Another chapter in the story
We recently introduced a new licensing model for WebStorm, RustRover, Rider, and CLion – making them free for non-commercial use. RubyMine is now joining the party! For commercial use, our existing licensing model still applies.
Why are we doing this?
We believe developers do their best work when the right tools are accessible. We’ve been listening closely to the Ruby and Rails community – their feedback, success, challenges, and passion for building with joy. Now, we’re making a change that reflects what we’ve heard.
By making RubyMine free for non-commercial use, we hope to lower the barrier to starting and help more people write clean, confident Ruby code from day one. It’s our way of supporting the unique Ruby community – from those who choose Ruby for their projects to maintainers of gems and frameworks who contribute to the Ruby ecosystem. Whether you’re debugging at midnight, crafting clever DSLs, or launching your first Rails app, RubyMine is here to help you build smarter (and crash less).
Commercial vs. non-commercial use
As defined in the Toolbox Subscription Agreement for Non-Commercial Use, commercial use means developing products and earning commercial benefits from your activities. However, certain categories are explicitly excluded from this definition. Common examples of non-commercial uses include learning and self-education, open-source contributions without earning commercial benefits, any form of content creation, and hobby development.
It’s important to note that, if you’re using a non-commercial license, you cannot opt out of the collection of anonymous usage statistics. We use this information to improve our products. The data we collect is exclusively that of anonymous feature usages of our IDEs. It is focused on what actions are performed and what types of functionality of the IDE are used. We do not collect any other data. This is similar to our Early Access Program (EAP) and is in compliance with our Privacy Policy.
FAQ
Below are answers to the most common questions. Check out the full FAQ for more information.
Licensing
What features are included under the free license?
With the new non-commercial license type, you can enjoy a full-featured IDE that is identical to its paid version. The only difference is in the Code With Me feature – you get Code With Me Community with your free license.
Which license should I choose if I want to use RubyMine for both non-commercial and commercial projects?
If you intend to use RubyMine for commercial development for which you will receive direct or indirect commercial advantage or monetary compensation within the meaning of the definitions provided in the Toolbox Subscription Agreement for Non-Commercial Use, you will need to purchase a commercial subscription (either individual or organizational). This license can then also be used for non-commercial development.
How do renewals and upgrades work now?
Non-commercial subscriptions are issued for one year and will automatically renew after that. However, for the renewal to happen, you must have used the assigned license at least once during the last 6 months of the subscription period. If it has been more than 6 months since you last used an IDE activated with this type of license and the renewal did not occur automatically, you can request a new non-commercial subscription again at any time.
Am I eligible for a refund if I’ve already bought a paid subscription but do non-commercial development?
If you’re unsure whether you qualify for a refund, you’ll find full details of our policy here. Please note that if you also work on projects that qualify as commercial usage, you can’t use the free license for them.
Data collection
Does my IDE send any data to JetBrains, and can I opt out?
When using a commercial subscription, you have full control over whether or not you want the product to send IDE telemetry to JetBrains, and detailed data collection is disabled by default.
With a non-commercial subscription, JetBrains IDEs may collect the following types of data:
- Anonymous telemetry. This refers to generalized, anonymous statistics about how features are used (such as time spent, clicks, or general workflows). Like with Early Access Program builds, using the free non-commercial subscription means agreeing to send anonymized usage statistics, which enables us to improve the product. It is not possible to opt out.
- Detailed code‑related data pertaining to IDE activity, such as edit history, terminal usage, and your interactions with AI features. This may include code snippets, prompt text, and AI responses. If you’re using a non-commercial subscription, detailed code‑related data collection is enabled by default. To disable it, you must do so manually via the product settings: Settings | Appearance & Behavior | System Settings | Data Sharing.
If you allow us to collect this data, we will make sure that:
- No sensitive or personal information is shared.
- Data is properly secured.
- Access is restricted to authorized personnel and use cases.
Read more about what data is collected and how it is protected.
Getting a non-commercial subscription
What should I do to apply for this subscription?
It can be easily done right inside your IDE:
- Install RubyMine and run it.
- Upon startup, there will be a license dialog box where you can choose the Non-commercial use option.
- Log in to your JetBrains account or create a new one.
- Accept the Toolbox Subscription Agreement for Non-Commercial Use.
- Enjoy development in your IDE.
If you’ve already started a trial period or have activated your IDE using a paid license, you still can switch to a non-commercial subscription by following these steps:
- Go to Help | Register.
- In the window that opens, click on the Deactivate License button.
- Choose Non-commercial use.
- Log in to your JetBrains account or create a new one.
- Accept the Toolbox Subscription Agreement for Non-Commercial Use.
- Enjoy development in your IDE.
I don’t see the Non-commercial use option in my IDE. What should I do?
The most likely explanation for this is that you’re using an older version of RubyMine. Unfortunately, we don’t support obtaining the non-commercial license for any releases prior to RubyMine 2025.2.1.
That’s it for today! If you don’t find an answer to your question, feel free to leave a comment or contact us at sales@jetbrains.com.
The RubyMine team
JetBrains
Make it happen. With code.
]]>Whether you are a seasoned Ruby developer or just getting started, mastering the debugger will save you time and frustration when tracking down bugs. At RubyMine, we’ve spent years building debugging tools for Ruby. In this blog series, we’re sharing some of the insights we’ve gained along the way.
In this post, we’ll take a closer look at the internal workings of byebug and the debug gem, comparing their unique approaches, strengths, and limitations. We’ll also break down the architecture of the RubyMine debugger to see how it works. Finally, we’ll conduct an experiment to test the performance of these debuggers and find out which one comes out on top.
This is the third post in a series inspired by Demystifying Debuggers, a talk by Dmitry Pogrebnoy, RubyMine Team Lead, presented at EuRuKo 2024, RubyKaigi 2025 and RubyConf Africa 2025. In this post, we go deeper into how Ruby debuggers work under the hood and share insights about Ruby debuggers.
If you haven’t seen the earlier posts yet, we recommend starting there:
- Mastering Ruby Debugging: From puts to Professional Tools
- Inside Ruby Debuggers: TracePoint, Instruction Sequence, and CRuby API
Prefer watching? You can also check out the original talk here: 🎥 Dmitry Pogrebnoy, “Demystifying Debugger”
Let’s dive into the internals!
Is the debugger an essential tool for Ruby developers?
Before we jump into how debuggers work, let’s take a step back and ask: How often do Ruby developers actually use a debugger? The answer might surprise you.
The need for and reliance on a debugger can vary greatly depending on the programming language and framework you’re using. It’s also influenced by the preferences of the developer community and the specific needs of the domain. Some developers might use a debugger all the time, while others might prefer different tools or methods for troubleshooting. Some of these tools were covered in the first post in the series.
Unfortunately, there aren’t any reliable public stats on how often Ruby developers use debuggers overall. But thanks to anonymous usage data from RubyMine users, we can still get a rough sense of how common debugger usage is in real-world projects.
The pie chart below shows how often RubyMine users run their code using a debugger compared to other types of run configurations. These numbers come from anonymous usage stats collected in RubyMine 2025.1.
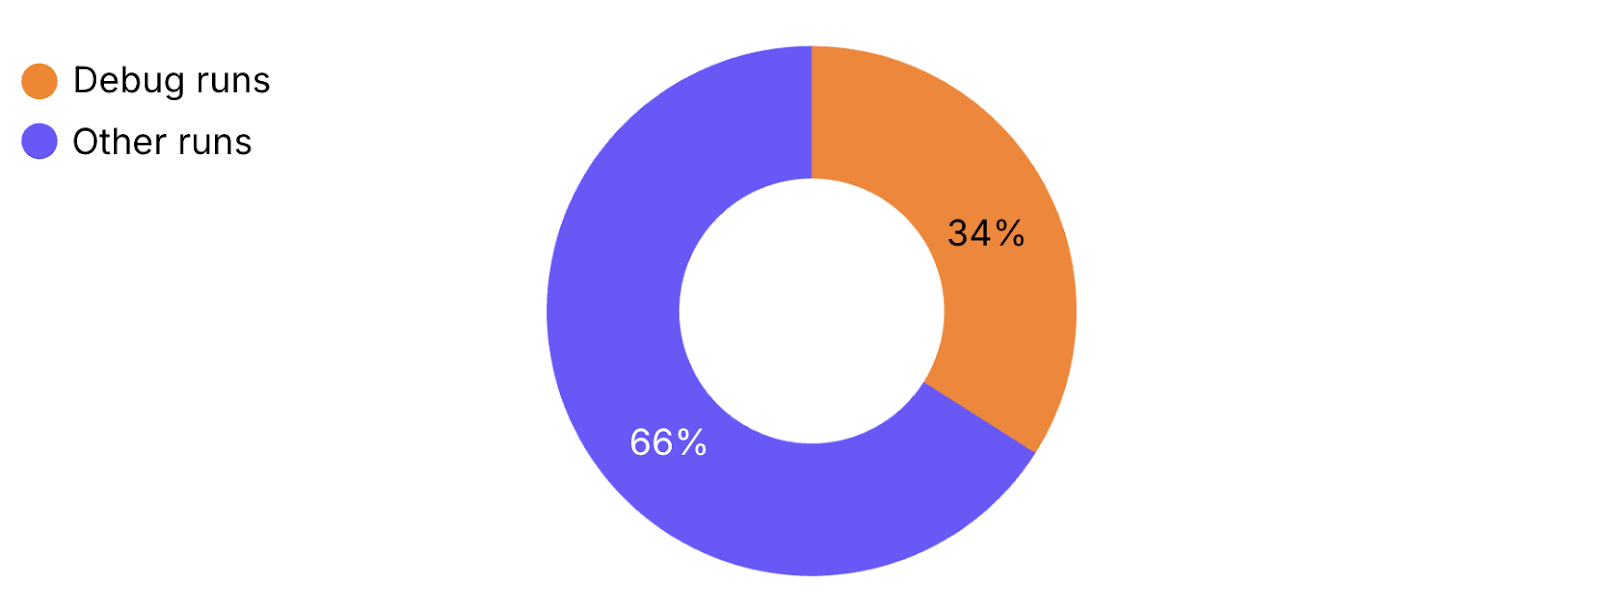
As we can see, almost every third run in RubyMine is a debugger run. This demonstrates just how essential and fundamental the debugger has become for professional Ruby developers. That’s why the RubyMine team tries to provide the smoothest possible debugger experience that will enhance your efforts in investigating problems.
How do Ruby debuggers work internally?
In the previous section, we covered the main building blocks of Ruby debuggers. Now it’s time to see how these components are applied in real-world tools. In this section, we’ll start with the byebug gem, then move on to the debug gem, and finally take a look at the RubyMine debugger. Let’s begin with byebug!
Simplified model of the byebug debugger
byebug is a simple Ruby debugger. It provides essential features like breakpoints, basic stepping, and variable inspection. By default, it offers a command-line interface (CLI) for debugging, but there’s also an option to install and configure a plugin for GUI support in code editors.
To start a debugging session with byebug, you typically need to modify your project’s source code by inserting byebug statements, or run commands manually in the terminal, which require some adjustments to your project setup, especially when working with Rails applications.
Let’s take a look at the simplified model of how byebug works. This code in the model should be executed before any code of the application that we are going to debug.
breakpoints = [] # list of breakpoints
tracepoints = [] # contains a single tracepoint for each event type


# For every type of tracepoint event
tracepoints << TracePoint.trace(:line) do |tp|
 breakpoint = breakpoints.find do |b|
   tp.path == b.path && tp.lineno == b.lineno
 end


 if breakpoint
   handle_breakpoint(breakpoint)
 end
end


# Ordinal code execution
# ...
Let’s examine how this works. At its core, byebug maintains two important lists — one for storing breakpoints set by the user throughout the debugging session, and another for tracepoints. TracePoint is a instrumentation technology in Ruby that works by intercepting specific runtime events such as method calls, line executions, or exception raises and executing custom code when these events occur. Take a look at our previous blog post for more details.
byebug has one TracePoint for each type of event it tracks — one for line events, one for call events, and so on. Each TracePoint in the list follows a similar pattern. When a trace event occurs at runtime, the corresponding TracePoint is triggered, and byebug checks whether there’s a breakpoint set at that location by comparing file paths and line numbers. If a breakpoint is found, byebug pauses program execution and hands control to the developer, who can then inspect variables, step through code, evaluate expressions, or perform other debugger actions. If no breakpoint is found, execution simply continues until the next trace event, where the same process is repeated. This is how byebug detects breakpoints and stops at them during runtime.
It is a simple yet effective approach that works well and allows developers to debug their code. However, it comes with one major drawback — performance.
With each event emitted during program execution, byebug has to perform breakpoint checks — even when there’s only a single breakpoint set in the entire application. This means that if you place just one breakpoint somewhere in your code, the debugger will still check for breakpoint matches on every single trace event. It’s like having a security guard check every room in a building when you only need to monitor one specific door.
Consequently, these constant checks add significant computational overhead when running code with byebug. Our performance tests show that applications can run more than 20 times slower under byebug compared to normal execution. This performance impact makes byebug challenging to use with complex real-world Rails applications, where execution time really matters. Fortunately, more modern debugging solutions have found ways to address this limitation.
Performant debug gem and TracePoint improvement
Our next tool is the debug gem — a debugger designed for modern Ruby versions starting from 2.7. It provides CLI by default, but you can also set it up with a plugin to get GUI in code editors.
Just like byebug, the debug gem requires you to modify your code by adding binding.break statements to start a debugging session. Alternatively, you can run it manually from the terminal, which may require some additional project configuration, especially in Rails applications.
The debug gem completely solves the significant performance limitation described in the previous section. Before we start with the debug gem, let’s take a look at the main feature that helped to overcome the performance problem.
The magic behind the strong performance of the debug gem is related to the TracePoint update that was released in Ruby 2.6 back in 2018.
This improvement added a key feature — TracePoints could now be targeted to specific lines of code or specific instruction sequences. No more checking for breakpoints on every event. Instead, TracePoints would only trigger exactly where breakpoints were set, solving the performance problem.
Let’s look at a practical example of how this feature works.
def say_hello = puts "Hello Ruby developers!"
def say_goodbye = puts "Goodbye Ruby developers!"


iseq = RubyVM::InstructionSequence.of(method(:say_hello))
trace = TracePoint.new(:call) do |tp|
 puts "Calling method '#{tp.method_id}'"
end


trace.enable(target: iseq)


say_hello
say_goodbye
# => Calling method 'say_hello'
# => Hello Ruby developers!
# => Goodbye Ruby developers!
Here we have two methods — say_hello and say_goodbye. The key change is that we’re targeting our TracePoint specifically to the instruction sequence of the first method only.
Looking at the output in the comments, we can see how powerful and precise targeted TracePoints are. The TracePoint is triggered only for say_hello but is completely ignored for say_goodbye — exactly what we needed. This level of control is a major improvement over the old approach where TracePoints would fire for every method indiscriminately.
This example demonstrates a simplified version of how the debug gem uses TracePoint under the hood. Unlike byebug, which maintains a general-purpose list of TracePoints and checks every single trace event against all breakpoints, the debug gem takes a more efficient and targeted approach. It creates a dedicated TracePoint for each individual breakpoint and binds it directly to the corresponding location in the code — either a specific line or an instruction sequence.
This means the TracePoint will only trigger when that exact location is executed, eliminating the need for constant runtime checks across unrelated code paths. As a result, the debug gem introduces significantly less overhead and performs much better in practice. This difference becomes especially noticeable in large Ruby codebases or performance-sensitive environments, where byebug’s frequent event scanning can lead to substantial slowdowns.
Despite its significant advantages, this TracePoint improvement wasn’t backported to Ruby versions before 2.6. As a result, the debug gem only supports Ruby 2.7 and newer versions where additional fixes for the TracePoint improvement were released. This circumstance leaves projects running on older Ruby versions without access to this powerful debugging tool, even though they might still need advanced debugging capabilities for investigating complex issues.
Starting with Ruby 3.1, the debug gem is bundled as the default debugger. It’s an excellent starting point for many Ruby developers — especially those who haven’t yet explored more advanced tools like the RubyMine debugger to meet their growing need for a better debugging experience and more powerful capabilities.
How is the RubyMine debugger structured?
As we’ve seen, both popular open-source Ruby debuggers have their limitations. Byebug suffers from performance issues that make it impractical for large applications, while the debug gem doesn’t support Ruby versions before 2.7. This can be frustrating for professional developers who need reliable debugging capabilities across different Ruby versions. The RubyMine debugger solves these problems by supporting Ruby versions from 2.3 onwards, covering practically any Ruby version your application might use.
One significant benefit that sets the RubyMine debugger apart is that it doesn’t have any performance issues and maintains excellent speed even on older Ruby versions. This feature makes the RubyMine debugger the go-to debugging tool for professional Ruby developers, regardless of their project’s specific requirements.
Another advantage is a straightforward debugging experience, with all features available immediately after setup. There’s no need to modify your project configuration, install and configure extra plugins, or manage terminal commands to start debugging. It works even with production size Rails applications and lets you focus on solving problems rather than setting up tools.
In addition, the RubyMine debugger offers smart stepping — a feature that lets you step into a specific method when there are multiple calls on the same line. Instead of always entering the first call, it highlights all available options so you can choose the one you want. It’s especially useful for debugging chained or complex expressions — a level of control that other Ruby debuggers don’t offer.
The RubyMine debugger provides versatile debugging capabilities and a productivity-focused debugger experience. If you haven’t tried the RubyMine debugger yet, it’s definitely worth a chance.
Let’s take a closer look at the architecture of the RubyMine debugger and how it’s built to be such a powerful tool.
General RubyMine debugger architecture
This is a high-level architecture of the RubyMine debugger.
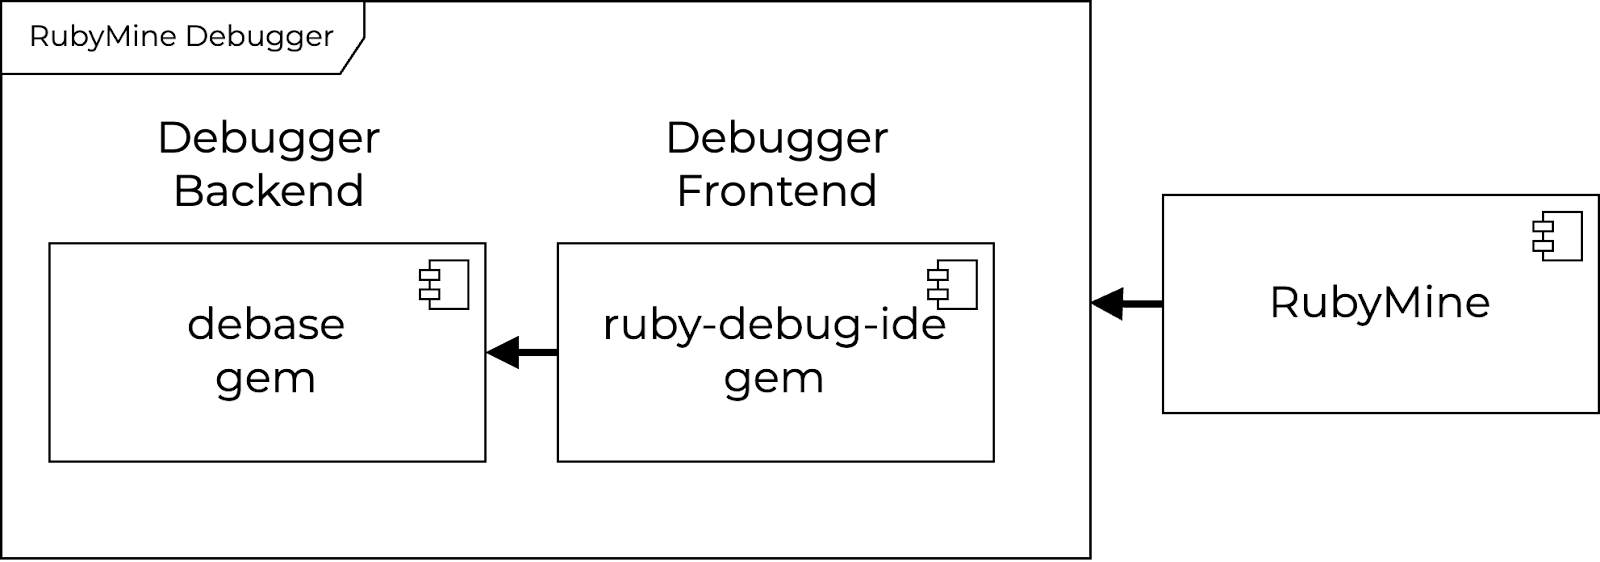
Let’s examine the diagram to understand how the RubyMine debugger works internally. The architecture consists of three main parts that work together to provide a smooth debugging experience.
The first component is the debase gem — the core backend of the RubyMine debugger. Written as a C extension, it handles all low-level operations like retrieving execution contexts, managing stack frames, and manipulating instruction sequences. This backend is responsible for direct interaction with Ruby internals, which makes it a convenient and efficient interface for other debugger components.
The second part is the ruby-debug-ide gem, which serves as the internal debugger frontend. This critical piece manages the communication between RubyMine and the backend by establishing and maintaining their connection. It handles the message protocol and processes commands coming from RubyMine. Additionally, it’s responsible for creating readable text representations of Ruby objects that developers will see in the RubyMine debugger Tool Window.
Finally, there’s RubyMine itself. Its primary role is to provide a smooth and productive debugging experience. Most of the debugger features that enhance developer productivity — like smart stepping, inline-debugger values, and frames and breakpoints management — are mainly implemented at this level. The IDE also handles communication with the debugger frontend by sending commands and processing responses.
Having three separate parts with clear interfaces between them brings several key benefits. This modular structure significantly reduces the overall system complexity, making it easier to maintain and less prone to bugs. Each component can be developed independently and at its own pace, which streamlines development and makes maintenance more efficient.
The real RubyMine debugger architecture
The architecture we’ve discussed is a simplified view of the RubyMine debugger. While it helps you understand the core concepts, the real-world implementation has additional layers of complexity. Let’s dive deeper and explore how the actual system is structured.
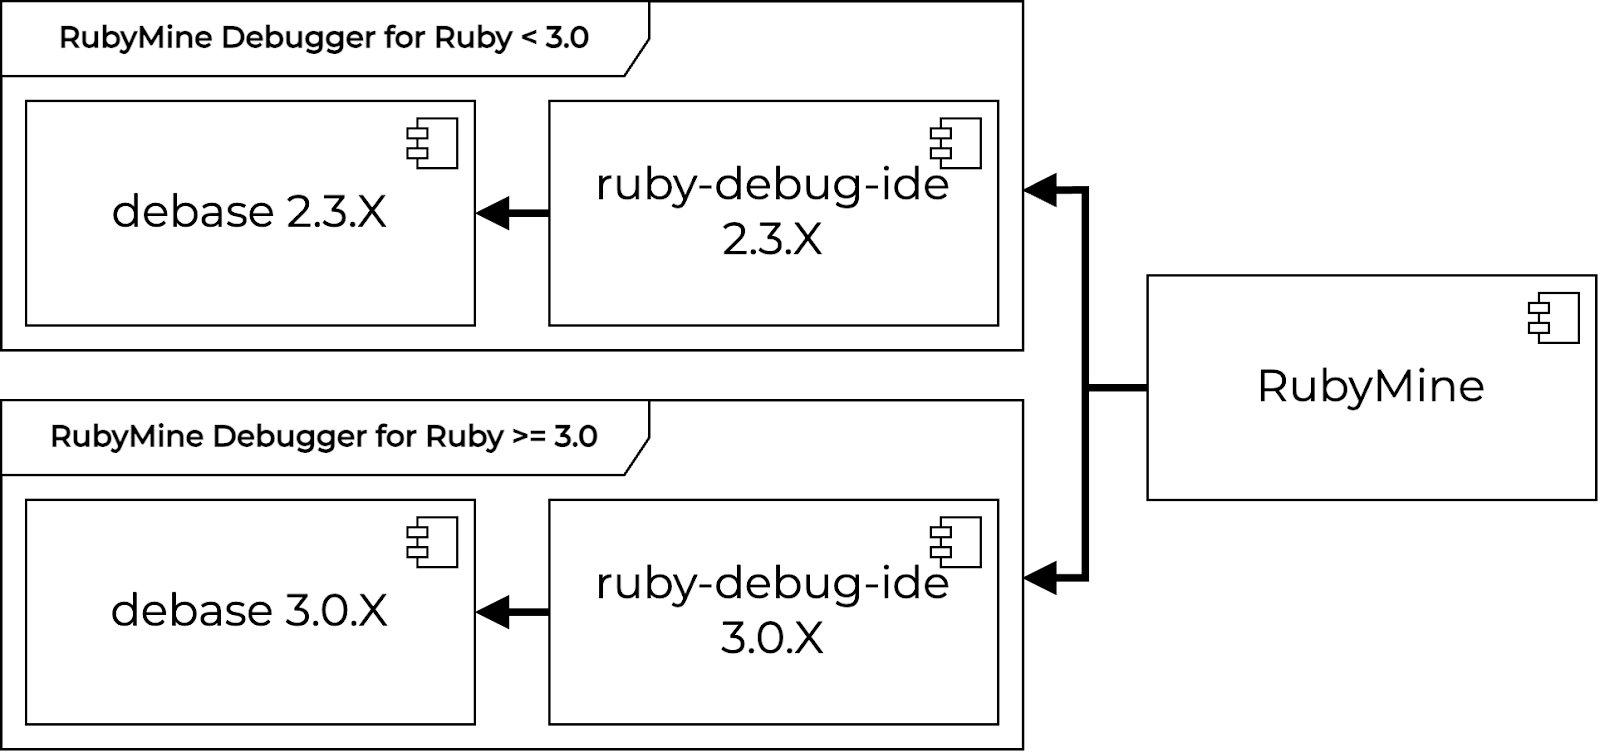
Instead of a single branch of debugger gems, there are two separate branches of debugger gems — a top branch and a bottom branch — each specified for different Ruby versions.
The top branch supports Ruby versions 2.3 through 2.7. These gems use several clever low-level hacks to achieve high performance without the TracePoint improvements we discussed earlier. While these hacks work effectively, they make the gems harder to maintain and extend. Still, this approach ensures excellent debugging capabilities for legacy Ruby applications.
The challenges of maintaining and extending the top branch gems led to the creation of the bottom branch of gems. This branch is designed specifically for modern Ruby and ensures a smooth debugging experience with Ruby versions 3.0 and onwards. Unlike the top branch, these gems don’t rely on low-level hacks. Instead, they leverage modern Ruby APIs and the improved TracePoint mechanism, resulting in a cleaner and more maintainable codebase. This approach not only simplifies the implementation but also makes it easier to add new features and support new Ruby versions.
Having two separate branches for different Ruby versions helps us keep the RubyMine debugger maintainable and performant. It lets us support legacy versions while steadily raising the quality bar and reliability of the debugging experience for modern Ruby.
Which debugger is the most performant?
Before we dive into performance, let’s quickly recap what we’ve covered so far. We began with an in-depth look at how the byebug debugger works internally and where it falls short. Then, we examined how the debug gem takes a different approach to overcome those limitations. Finally, we explored the architecture of the RubyMine Debugger and the advantages it brings to the table.
Now, it’s time to ask the big practical question: which of these debuggers performs best?
Rather than guess, let’s put these debuggers to the test with a straightforward benchmarking experiment.
def fib(n)
 raise if n < 0 # place a breakpoint on this line
 return n if n < 2
 fib(n - 1) + fib(n - 2)
end


require 'benchmark'
TOTAL_RUNS = 100
total_time = TOTAL_RUNS.times.sum do
 Benchmark.realtime { fib(40) }
end


puts "Avg real time elapsed: #{total_time/TOTAL_RUNS}"
We use the Fibonacci method with an added condition specifically to set a breakpoint. Although the breakpoint is never hit, it allows us to measure how simply having a breakpoint in place can impact the performance of each debugger. To run the experiment, we used the benchmark gem and averaged the execution time over 100 runs to get stable, meaningful results.
Let’s state the Ruby debugger and Ruby versions for that experiment to get reproducible results.
| Ruby 2.6.10 | Ruby 3.4.2 |
| byebug – 11.1.3 | debug gem – 1.10.0 |
| RubyMine debugger • ruby-debug-ide – 2.3.24 • debase – 2.3.15 | RubyMine debugger • ruby-debug-ide – 3.0.2 • debase – 3.0.2 |
For this experiment, we’ll use the latest available versions of Ruby and debugger gems at the time of writing. We define two test groups based on Ruby versions they support. One for Ruby 2.6.10, representing older versions, and one for Ruby 3.4.2, representing modern versions. The Ruby 2.6.10 group includes byebug. The Ruby 3.4.2 group features the debug gem. The RubyMine debugger is included in both groups, but it uses different gem versions optimized for the respective Ruby version.
Let’s run the benchmark and see how each debugger performs.
| Ruby 2.6.10 | Ruby 3.4.2 | |
| Original run | 17.7 sec | 15.8 sec |
| byebug | 529.1 sec | ✕ |
| debug gem | ✕ | 15.8 sec |
| RubyMine debugger | 17.7 sec | 15.8 sec |
Let’s first examine the results for the older Ruby version. The most striking observation is the performance of byebug. The benchmark shows it runs about 30 times slower than the original code without any debugger attached — a significant performance hit that makes it impractical for debugging complex applications.
On the other hand, the RubyMine debugger shows no noticeable performance impact on older Ruby versions. This means that for applications running on older Ruby versions, particularly production applications, the RubyMine debugger stands out as the only practical option for effective debugging. While having limited choices isn’t ideal, this is the reality when working with older Ruby versions.
Looking at a modern Ruby version group, the situation is much better. Both the RubyMine debugger and debug gem show excellent performance with no noticeable slowdown. This gives developers the freedom to choose either tool based on their specific needs and preferences. The availability of multiple performant debuggers empowers Ruby developers to choose the best tool for their situation and makes the Ruby debugging ecosystem stronger.
Overall, the RubyMine debugger delivers consistently high performance across both old and new Ruby versions, while byebug significantly slows down execution and is impractical for complex applications. On newer Ruby versions, the debug gem matches RubyMine in speed, giving developers an open-source alternative.
Conclusion
Debugging is a practical skill for every Ruby developer, and understanding the inner workings of Ruby debuggers can help you recognize each debugger’s limitations, choose the right tool for your needs, and avoid common pitfalls. In this post, we’ve examined the internal mechanics of Ruby debuggers like byebug, the debug gem, and the RubyMine debugger, highlighting the advantages and downsides of their approaches.
Byebug and the debug gem both offer basic debugging features like breakpoints, stepping, and variable inspection. The debug gem delivers significantly better performance than byebug, but it only supports Ruby versions 2.7 and newer. Byebug, on the other hand, works with older Ruby versions but tends to be much slower — especially in larger projects.
The RubyMine debugger stands out by combining the best of both worlds. It supports a wide range of Ruby versions, delivers strong performance across all of them, and offers a smooth, reliable debugging experience — even in complex Rails applications. On top of the basic features, RubyMine includes advanced capabilities like smart stepping, inline variable values, and more. You can explore the full set of features in the RubyMine debugging documentation.
We hope this post has helped clarify how Ruby debuggers work internally and provided useful insights for improving your debugging workflow.
Happy coding, and may your bugs be rare and simple to squash!
The RubyMine team
]]>In this blog post, we briefly go over the highlights of this release. For a detailed description, check out our What’s New page.
You can get the new build from our website or via the free Toolbox App.

AI Assistant
JetBrains AI Assistant has received a major upgrade, offering smarter code completion, greater project awareness, and more control over AI in your IDE. Below is an overview of the main improvements. Read the full article here.
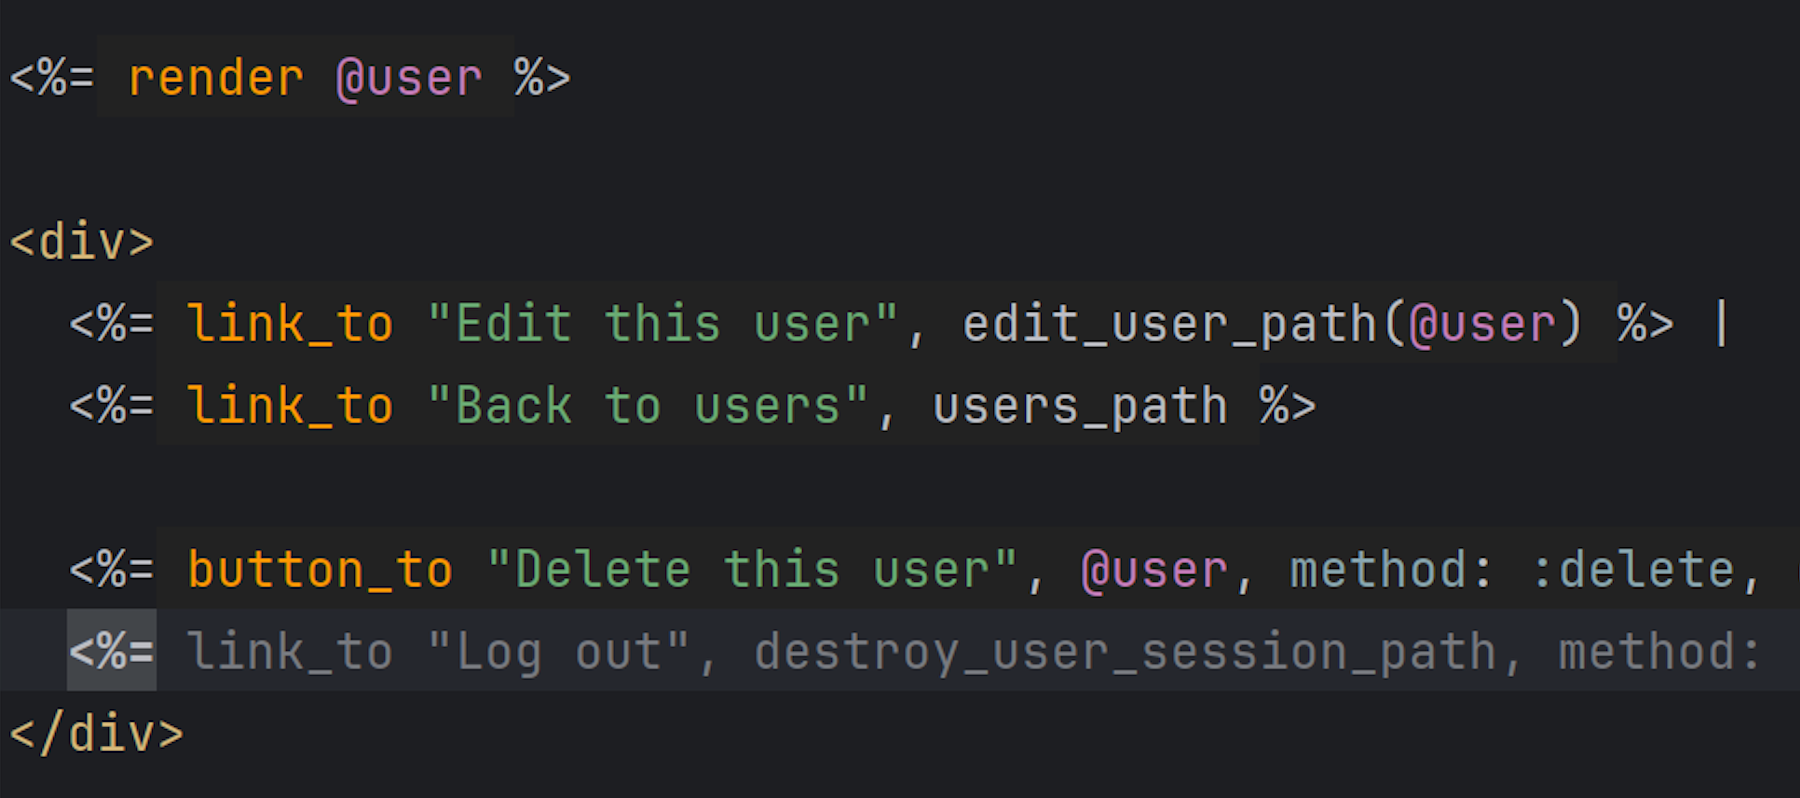
Code completion for ERB
Cloud-based code completion for ERB has been expanded to work directly within ERB tags like <% <caret> -%> and <%= <caret> %>. This feature builds on RubyMine’s existing AI-based code completion for Ruby and includes enhancements like better string handling, multiline code support, and the avoidance of duplicate closing tags.
Stronger project awareness in AI chat
AI Assistant’s chat now uses the Search Everywhere functionality for Classes and Symbols to offer more accurate and project-specific context.
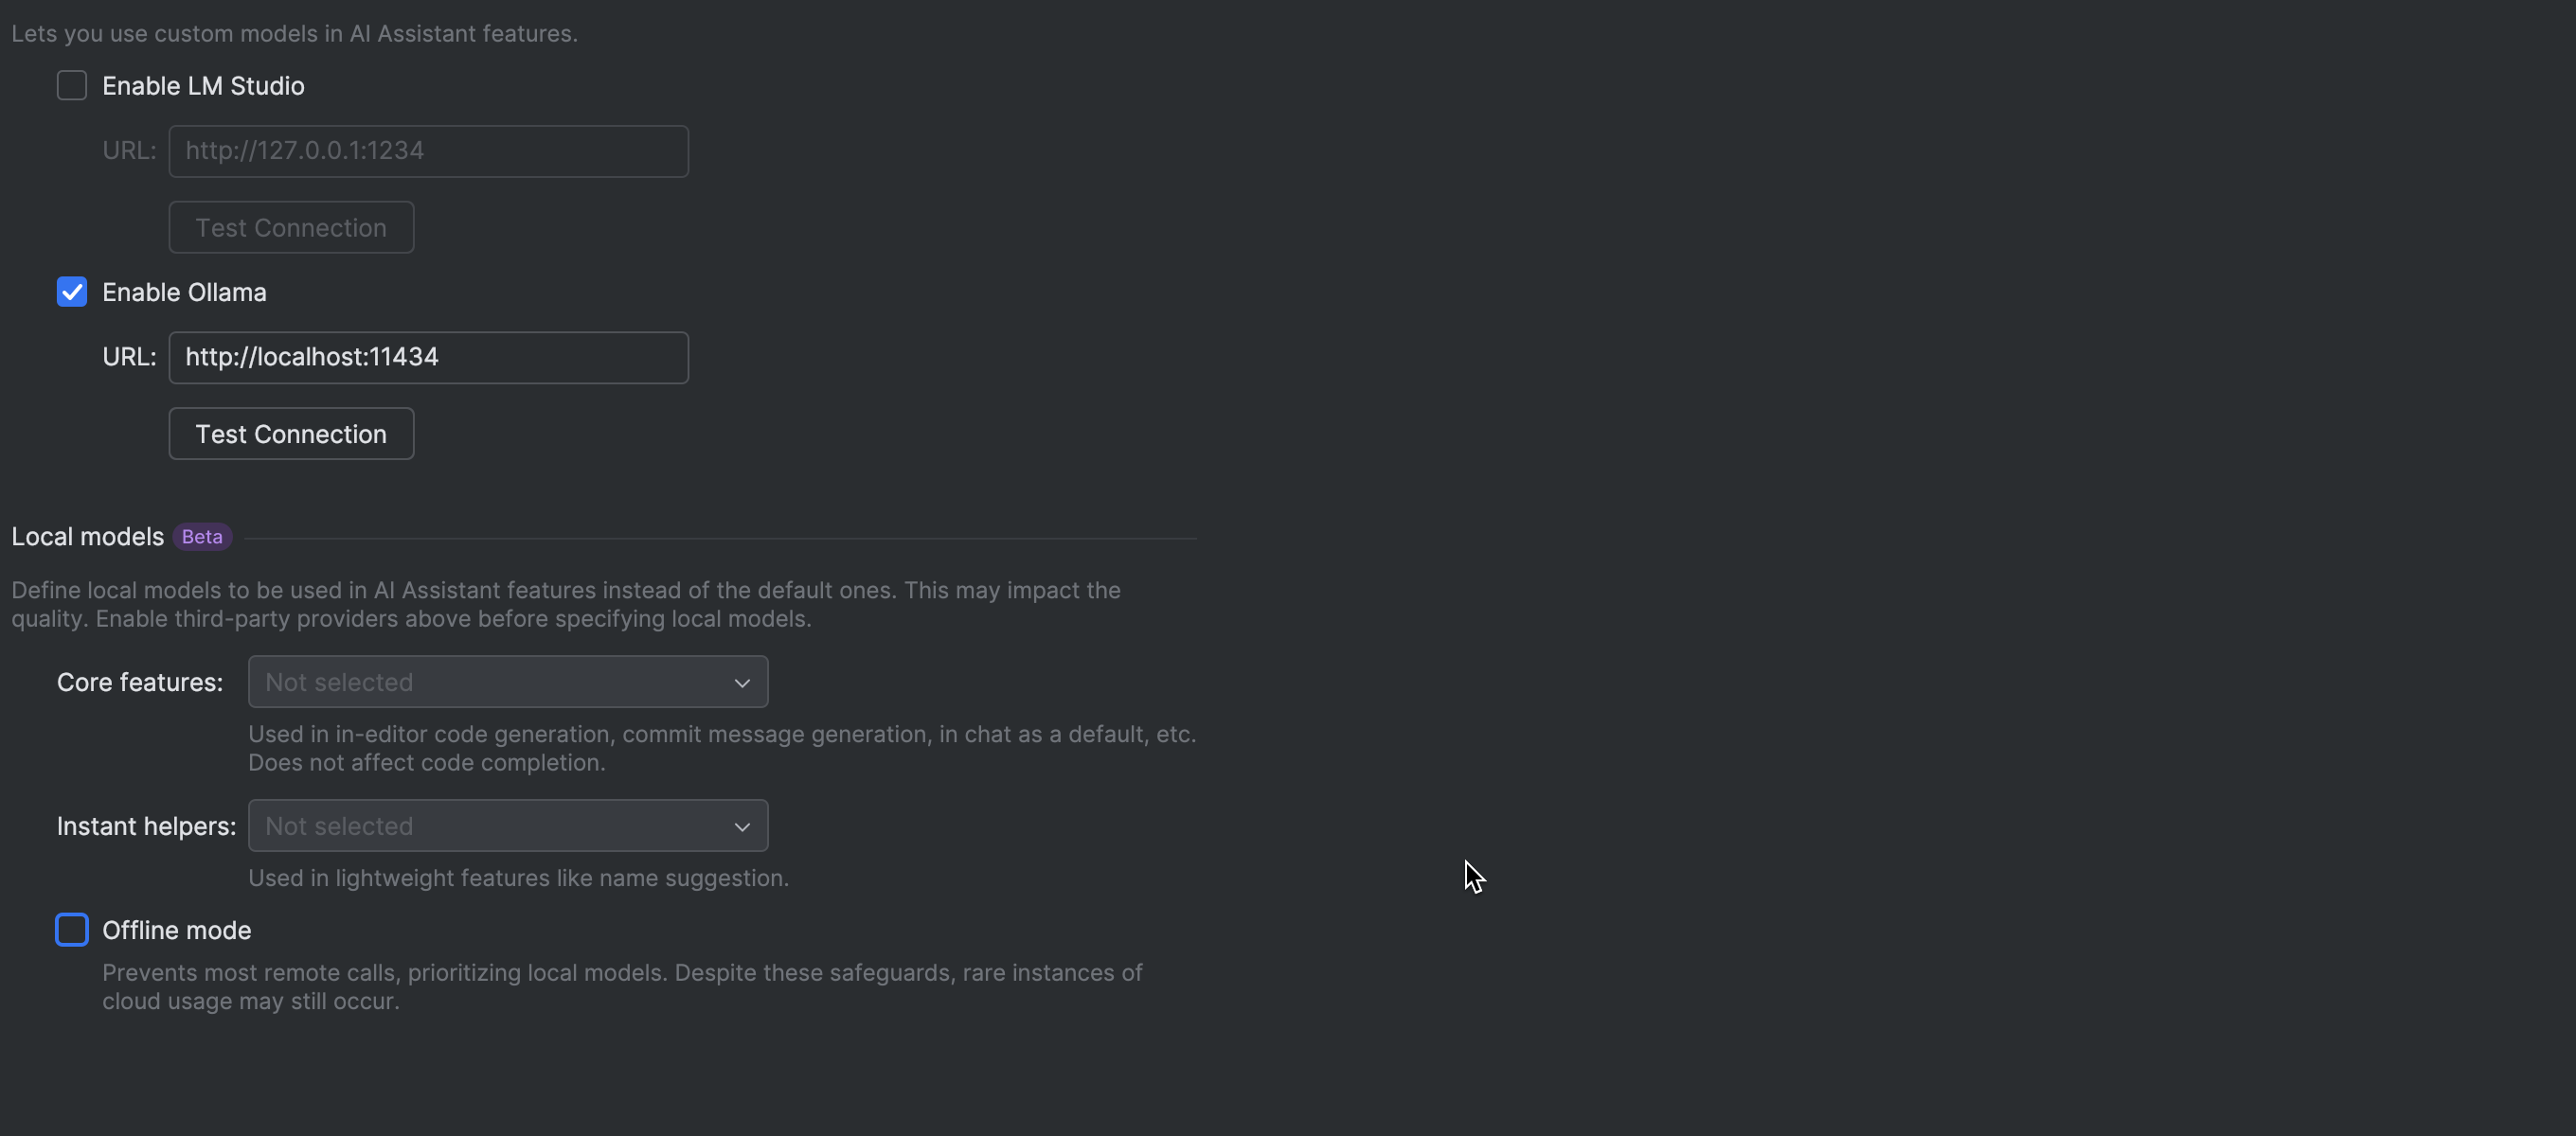
More ways to connect local models
You can now connect any OpenAI-compatible local model server, including llama.cpp, LiteLLM, and others. This lets you take advantage of powerful AI features offline, without any data being sent to the cloud.
Expanded and improved code suggestions
In RubyMine 2025.2, AI Assistant offers more frequent and context-aware code suggestions. Improved formatting for multiline outputs also ensures a smoother coding experience.
Image attachments
JetBrains AI Assistant now supports image attachments in the chat when using Anthropic and OpenAI models.
Junie
RubyMine now offers an exciting new way to code thanks to Junie, the AI coding agent from JetBrains, built to streamline your workflow and boost your productivity. Available in RubyMine 2025.2 as a plugin, Junie is reliable for simple tasks, but it really shines when assigned complex challenges. Use Code mode to delegate coding tasks or Ask mode to brainstorm features and explore new solutions.
Junie recently received several major updates. It is now up to 30% faster, and it offers MCP support and added functionality for remote development.
Ruby
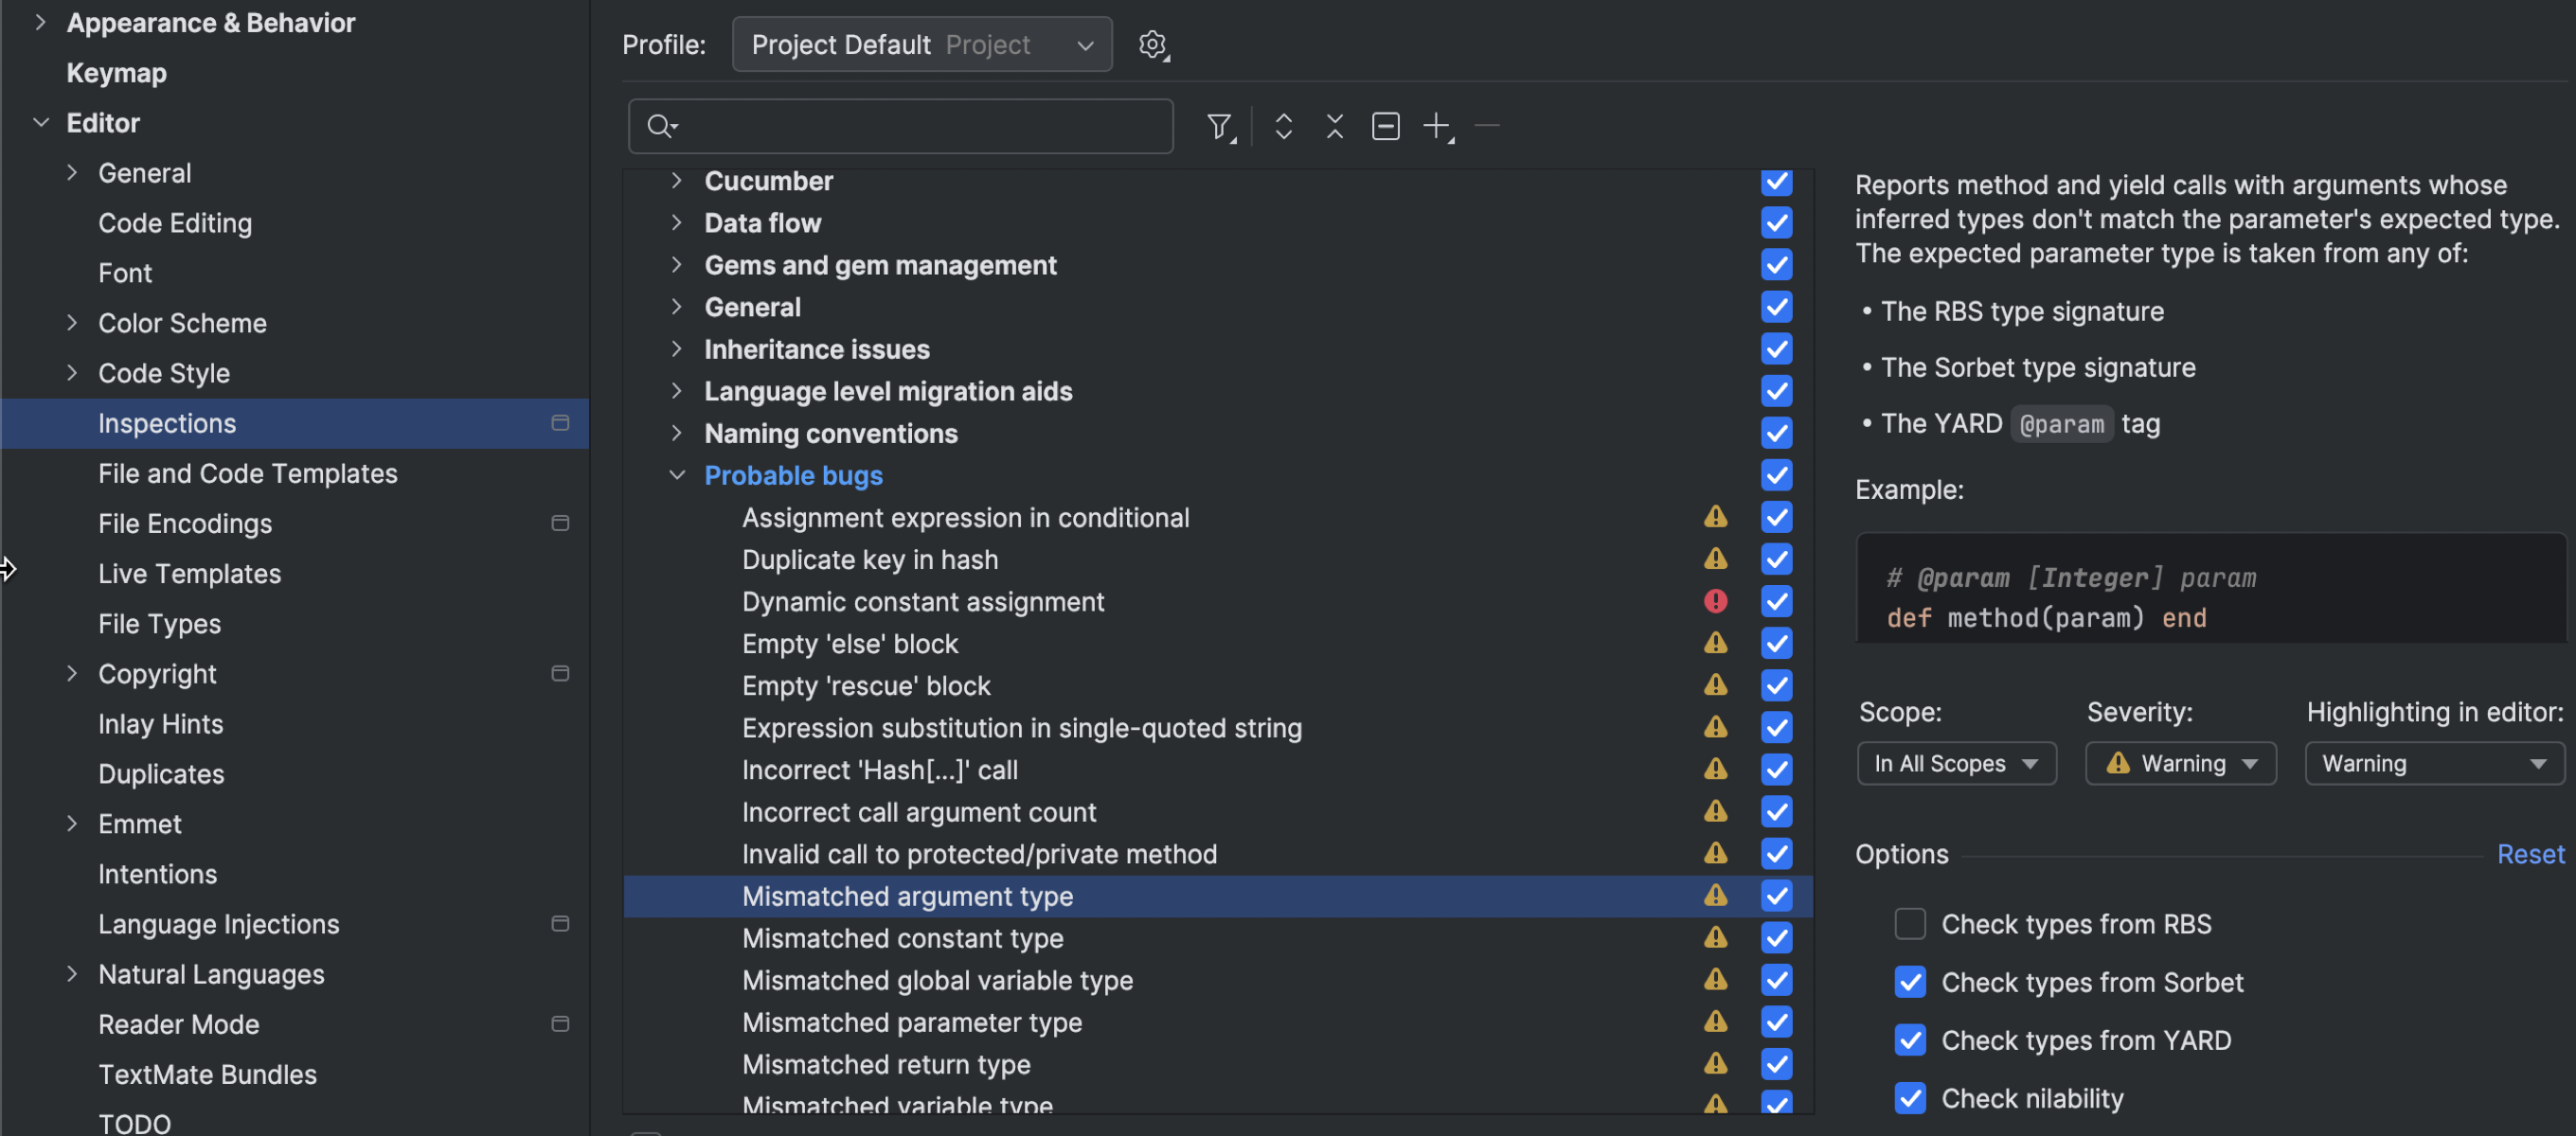
More control over code inspections
RubyMine 2025.2 gives you the flexibility to disable specific type signature providers used in certain inspections. For example, the Mismatched Argument Type inspection uses RBS and Sorbet, which might conflict with each other. To avoid any issues, you can disable one of them.
Find and customize them in Settings | Editor | Inspections | Ruby | Probable bugs.
Rails
Streamlined project startup
RubyMine 2025.2 increases the speed of project startup by optimizing how background tasks are handled. Nonessential operations like refreshing Rake tasks or updating RBS collections now run only when needed, so you’re not stuck waiting on them. Get started on your work faster with fewer interruptions right from the get-go.
Better performance when editing migration files
If your Rails project is packed with migration files, you know how sluggish and glitchy editing them can get. Not anymore – RubyMine ensures smooth edits, even in projects with tons of migrations, so that you can make changes quickly and without any hassle.
RBS
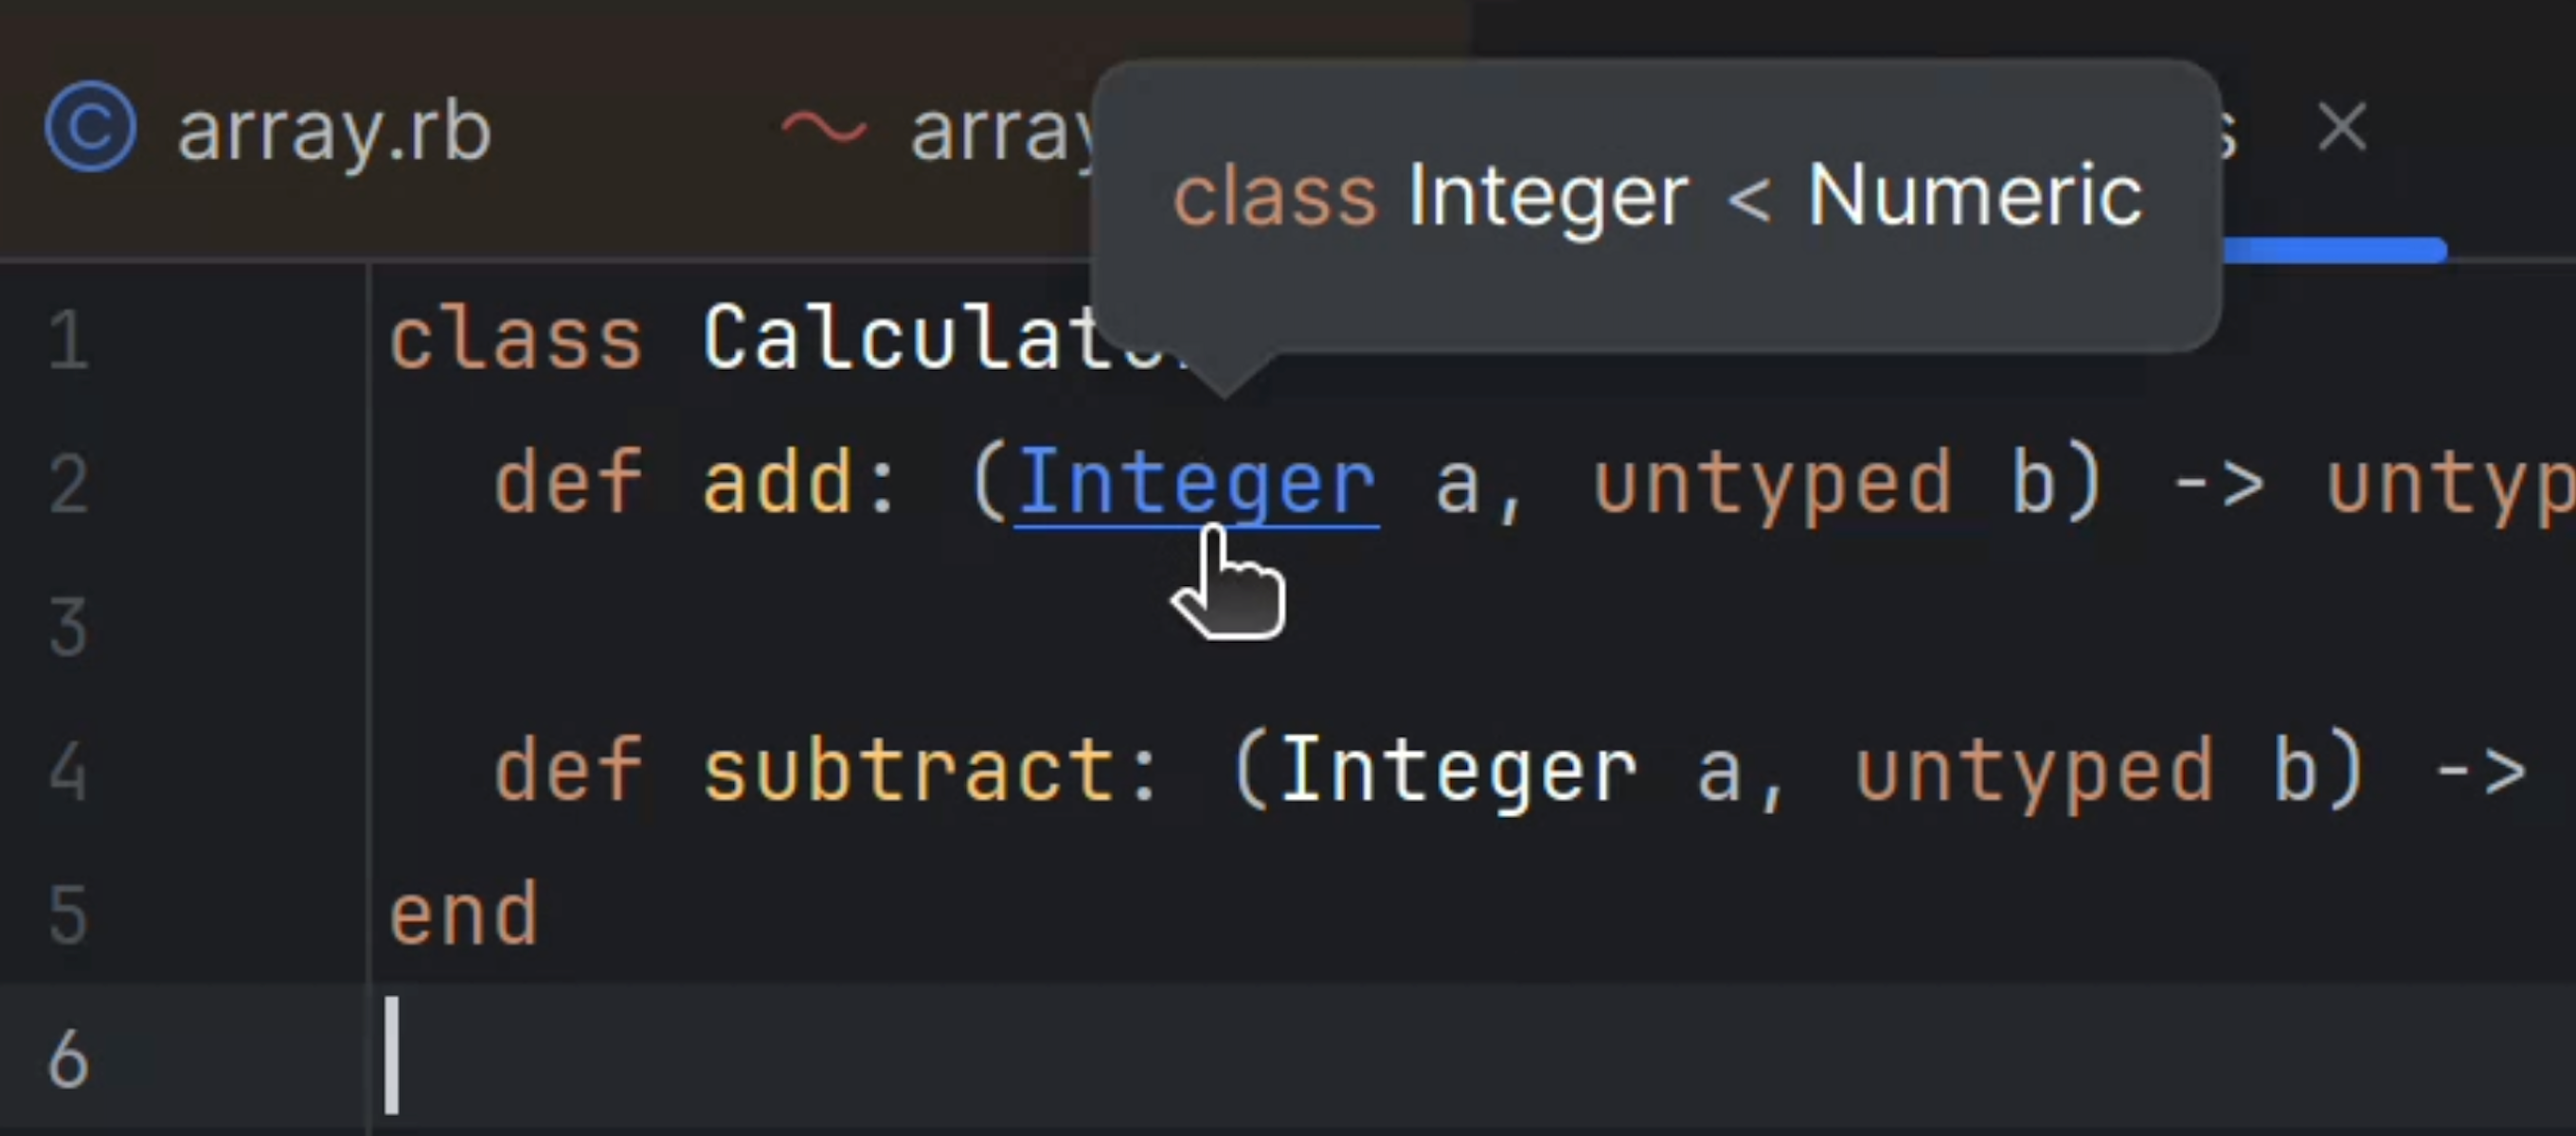
Hover hints for RBS
Digging into .rbsCmd (Mac) or Ctrl (Windows/Linux) and hover over a declaration to see a concise, in-context preview.
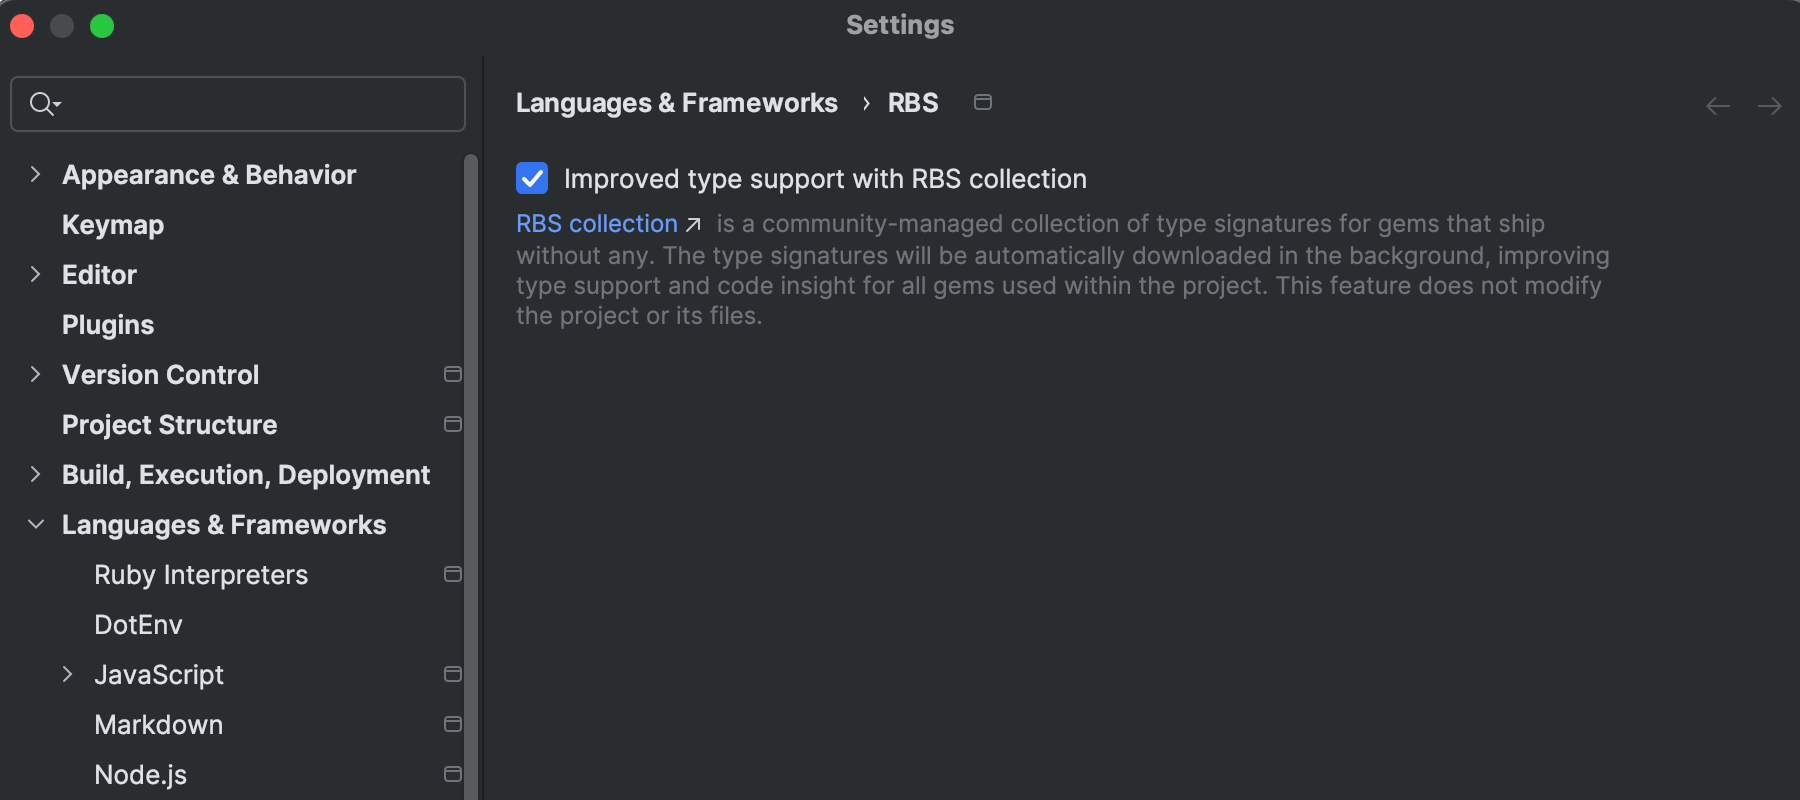
RBS Collection integration enabled by default
The RBS Collection integration is now enabled by default, improving the precision of Find Usages, the Rename refactoring, and inlay hints when working with type signatures. This feature requires RBS 3.2 (bundled with Ruby 3.4), and if you’re on an older Ruby version, RubyMine will prompt you to install the correct gem.
Bundler
Simpler notifications
RubyMine now groups missing gem alerts across all modules into a single notification, cleaning up your workspace and reducing distractions.
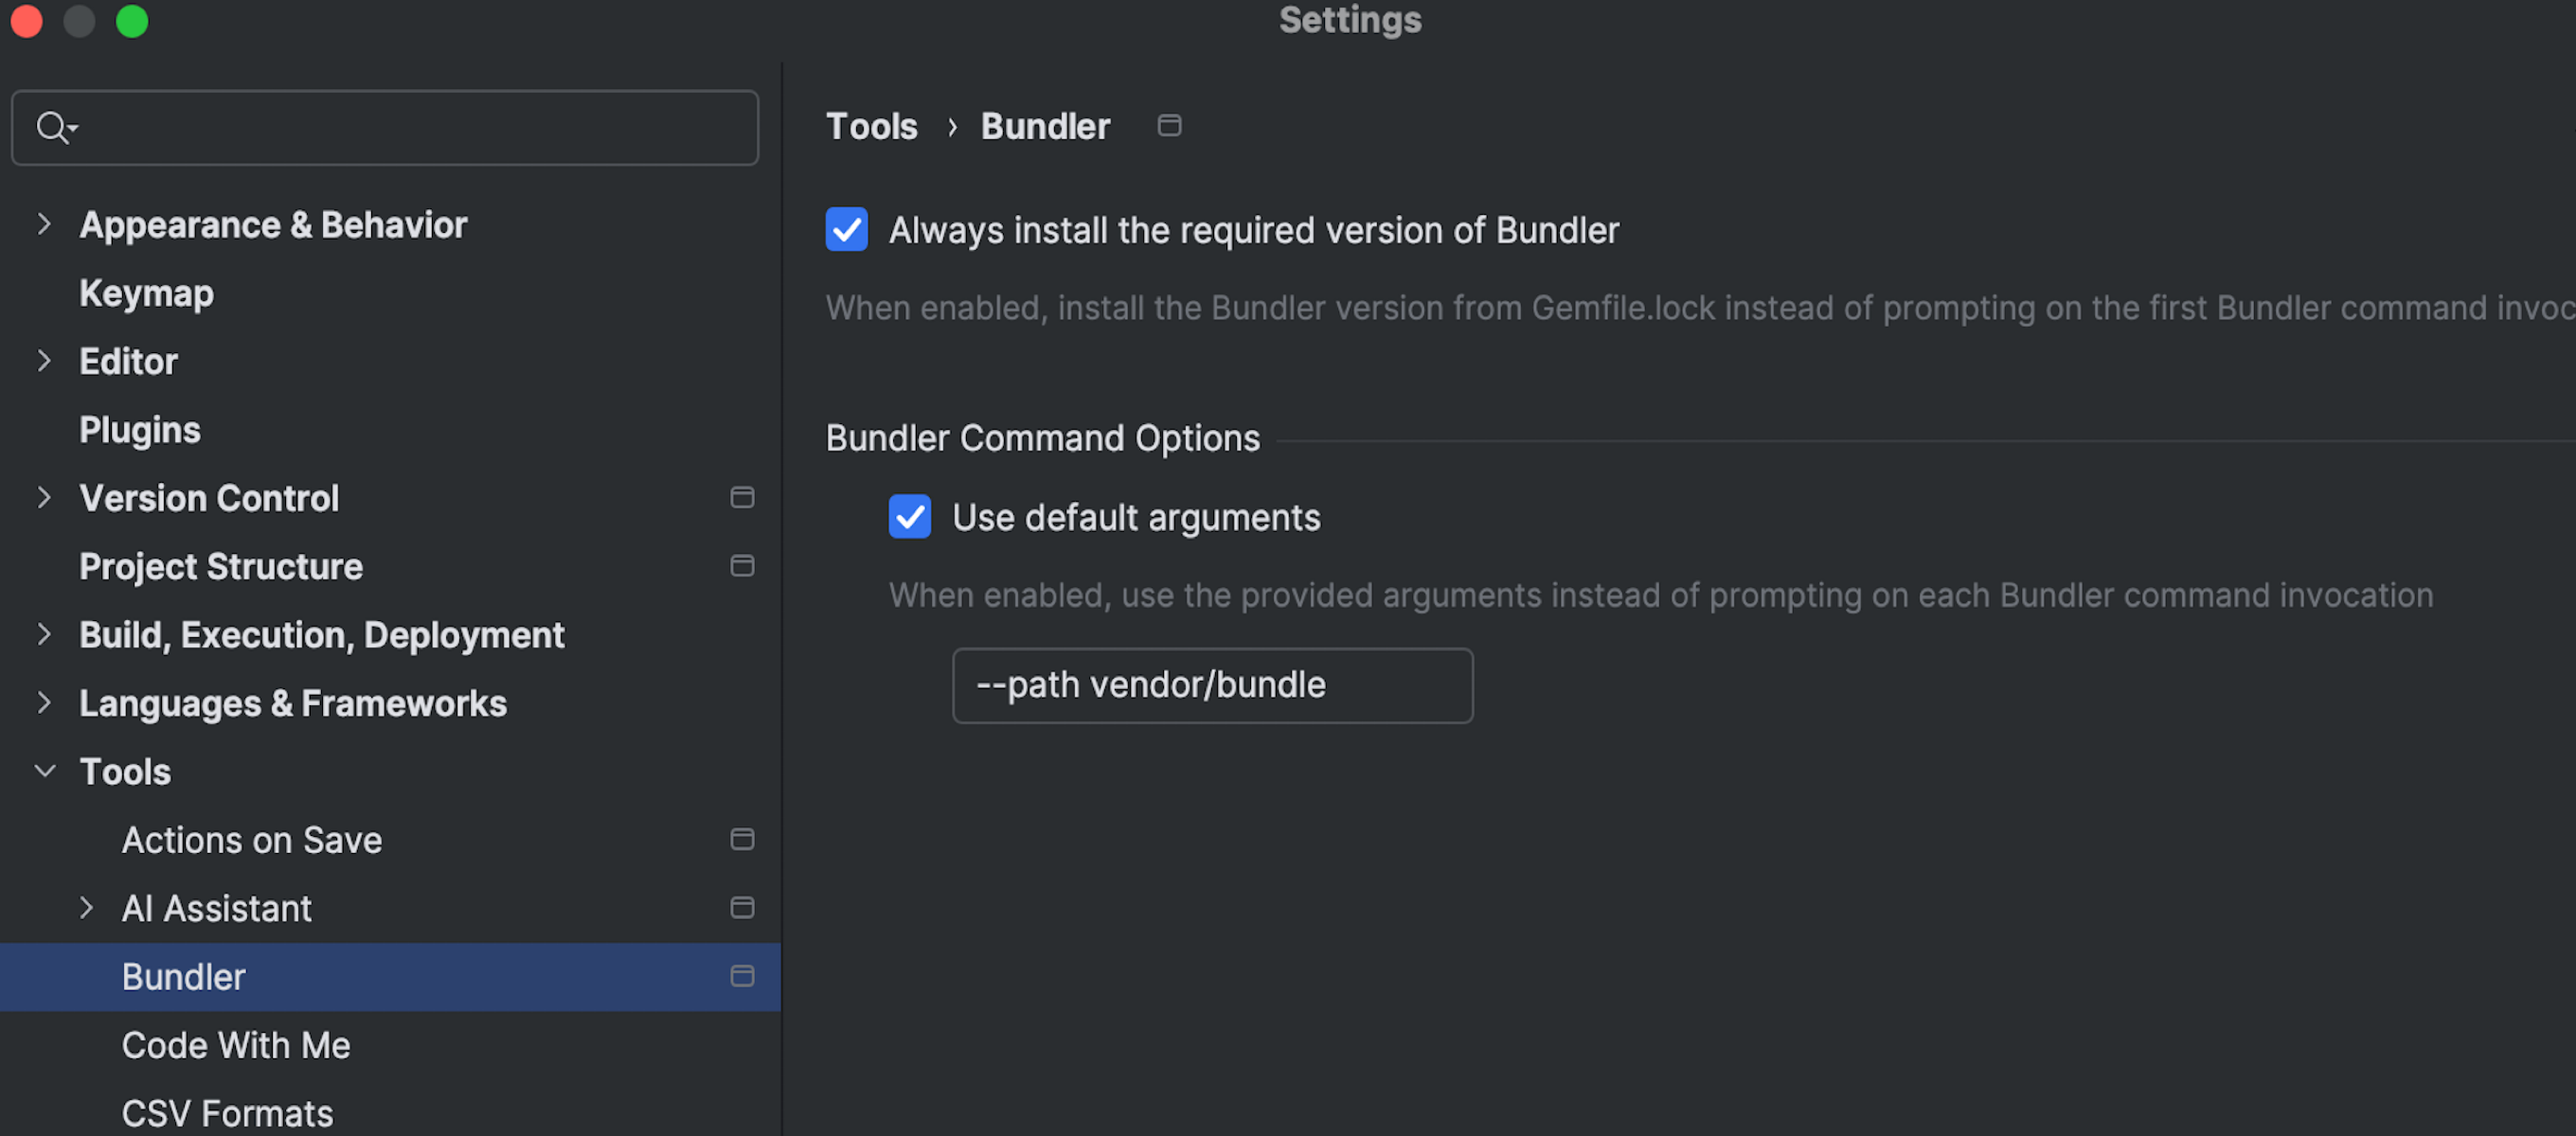
New Bundler tab
The new Bundler tab under Settings | Tools saves you from repetitive prompts every time you run a Bundler command. It contains two checkboxes you can mark that will:
- Allow the IDE to automatically install the Bundler version you need without asking you for confirmation.
- Allow you to define default arguments for all Bundler commands, streamlining your workflow.
Smarter gem installation
To prevent conflicts and the unnecessary reinstallation of shared gems, RubyMine now installs gems on a per-module basis. This makes working on multimodule projects far smoother.
Code insight
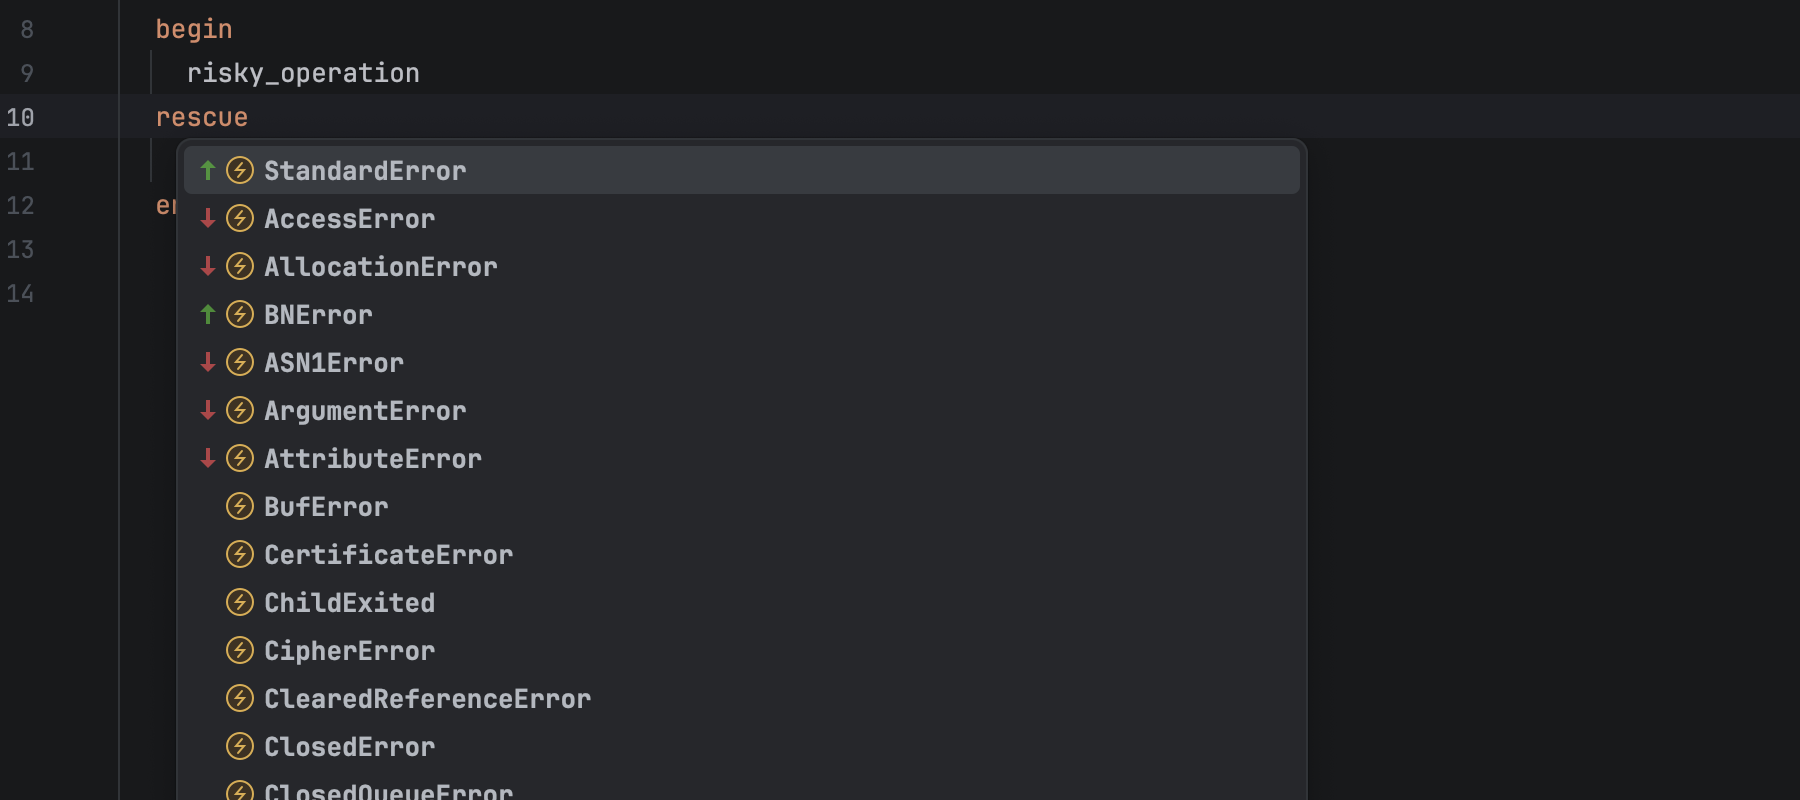
Improved exception-constant completion
RubyMine’s autocompletion for exception constants just got a lot smarter. When you trigger autocompletion without typing a prefix, the suggestions are now limited to a focused, relevant set of constants.
This makes the feature faster and far more precise, which is especially helpful in larger projects where suggestion bloat used to slow you down.
Debugger
Non-modal installation
You no longer have to wait around when setting up debugger gems in RubyMine! Starting with version 2025.2, debugger installation is now non-modal. The progress is displayed directly in the terminal window, so you can continue working without interruptions.
Stay in touch
To learn about the latest features as they come out, follow RubyMine on X.
We invite you to share your thoughts in the comments below and to suggest and vote for new features in the issue tracker.
Happy developing!
The RubyMine team
]]>Debugging is a key part of software development, but most developers use debuggers without knowing how they actually work. The RubyMine team has spent years developing debugging tools for Ruby, and we want to share some of the insights we’ve gained along the way.
In this post, we’ll explore the main technologies behind Ruby debuggers — TracePoint, Instruction Sequence, and Ruby’s C-level debugging APIs.
We’ll begin with TracePoint and see how it lets debuggers pause code at key events. Then we’ll build a minimal debugger to see it in action. Next, we’ll look at Instruction Sequences to understand what Ruby’s bytecode looks like and how it works with TracePoint. Finally, we’ll briefly cover Ruby’s C-level APIs and the extra power they offer.
This blog post is the second in a series based on the Demystifying Debuggers talk by Dmitry Pogrebnoy, RubyMine Team Leader, presented at EuRuKo 2024 and RubyKaigi 2025. If you haven’t read the first post yet, it’s a good idea to start there. Prefer video? You can also watch the original talk here.
Ready? Let’s start!
The core technologies behind any Ruby debugger
Before diving into the debugger internals, it’s essential to understand the two core technologies that make Ruby debugging possible: TracePoint and Instruction Sequence. Regardless of which debugger you use, they all rely on these fundamental features built into Ruby itself. In the following sections, we’ll explore how each of them works and why they’re so important.
TracePoint: Hooking into Code Execution
Let’s begin with TracePoint, a powerful instrumentation technology introduced in Ruby 2.0 back in 2013. It works by intercepting specific runtime events such as method calls, line executions, or exception raises and executing custom code when these events occur. TracePoint works in almost any Ruby context, and it works well with Thread and Fiber. However, it currently has limited support for Ractor.
Let’s take a look at the example and see how TracePoint works.
def say_hello
 puts "Hello Ruby developers!"
end


TracePoint.new(:call) do |tp|
 puts "Calling method '#{tp.method_id}'"
end.enable


say_hello
# => Calling method 'say_hello'
# => Hello Ruby developers!
In this example, we have a simple say_hello method containing a puts statement, along with a TracePoint that watches events of the call type. Inside the TracePoint block, we print the name of the method being called using method_id. Looking at the output in the comments, we can see that our TracePoint is triggered when entering the say_hello method, and only after that do we see the actual message printed by the method itself.
This example demonstrates how TracePoint lets you intercept normal code execution at specific points where special events occur, allowing you to execute your own custom code. Whenever your debugger stops on a breakpoint, TracePoint is in charge. This technology is valuable for more than just debugging. It is also used in performance monitoring, logging, and other scenarios where gaining runtime insights or influencing program behavior is necessary.
Building the simplest Ruby debugger with TracePoint
With just TracePoint technology, you can build what might be the simplest possible Ruby debugger you’ll ever see.
def say_hello
 puts "Hello Ruby developers!"
end


TracePoint.new(:call) do |tp|
 puts "Call method '#{tp.method_id}'"
 while (input = gets.chomp) != "cont"
   puts eval(input)
 end
end.enable


say_hello
This is almost the same code as in the TracePoint example, but this time the TracePoint code body is slightly changed.
Let’s examine what’s happening here. The TracePoint block accepts user input via gets.chomp, evaluates it in the current context using the eval method, and prints the result with puts. That’s really all there is to it — a straightforward and effective debugging mechanism in just a few lines of code.
This enables one of the core features of a debugger — the ability to introspect the current program context on each method invocation and modify the state if needed. You can, for example, define a new Ruby constant, create a class on the fly, or change the value of a variable during execution. Simple and powerful, right? Try to run it by yourself!
Clearly, this isn’t a complete debugger — it lacks exception handling and many other essential features. But when we strip away everything else and look at the bare bones, this is the fundamental mechanism that all Ruby debuggers are built upon.
This simple example demonstrates how TracePoint serves as the foundation for Ruby debuggers. Without TracePoint technology, it would be impossible to build a modern Ruby debugger.
Instruction Sequence: Ruby’s bytecode revealed
Another crucial technology for Ruby debuggers is Instruction Sequence.
Instruction Sequence, or iseq for short, represents the compiled bytecode that the Ruby Virtual Machine executes. Think of it as Ruby’s “assembly language” — a low-level representation of your Ruby code after compilation into bytecode. Since it’s closely tied to the Ruby VM internals, the same Ruby code can produce a different iseq in different Ruby versions, not just in terms of instructions but even in their overall structure and relationships between different instruction sequences.
Instruction Sequence provides direct access to the low-level representation of Ruby code. Debuggers can leverage this feature by toggling certain internal flags or even modifying instructions in iseq, effectively altering how the program runs at runtime without changing the original source code.
For example, a debugger might enable trace events on a specific instruction that doesn’t have one by default, causing the Ruby VM to pause when that point is reached. This is how breakpoints in specific language constructions and stepping through chains of calls work. The ability to instrument bytecode directly is essential for building debuggers that operate transparently, without requiring the developer to insert debugging statements or modify their code in any way.
Let’s take a look at how to get an Instruction Sequence in Ruby code.
def say_hello
 puts "Hello Ruby developers 💎!"
end


method_object = method(:say_hello)
iseq = RubyVM::InstructionSequence.of(method_object)


puts iseq.disasm
Let’s examine this code more closely. First, we have our familiar say_hello method containing a puts statement. Then, we create a method object from it using method(:say_hello). Finally, we get the Instruction Sequence for this method and print out its human-readable form using disasm. This lets us peek under the hood and see the actual bytecode instructions that Ruby will execute.
Let’s examine the output and see what it looks like.
== disasm: #<ISeq:say_hello@iseq_example.rb:1 (1,0)-(3,3)>
0000 putself                                                          (   2)[LiCa]
0001 putchilledstring                       "Hello Ruby developers 💎!"
0003 opt_send_without_block                 <calldata!mid:puts, argc:1, FCALL|ARGS_SIMPLE>
0005 leave                                                            (   3)[Re]
The first line shows metadata about our Ruby entity. Specifically, the say_hello method defined in iseq_example.rb with a location range (1,0)-(3,3). Below that are the actual instructions that the Ruby VM will execute. Each line represents a single instruction, presented in a human-readable format. You can easily spot the “Hello Ruby developers 💎!” string argument preserved exactly as it appears in the source code, without any encoding or decoding complexity, even with non-ASCII symbols. Such transparency makes it easier for you to understand what’s happening at the bytecode level.
Instruction Sequence plays a critical role in Ruby debugging by marking key execution points in the bytecode. In bracket notation in the output, you can notice markers like Li for line events, Ca for method calls, and Re for returns. These markers tell the Ruby VM when to emit runtime events. TracePoint relies on these markers to hook into the running program — it listens for these events and steps in when they happen. This tight connection between two technologies is what makes it possible for debuggers to pause execution and inspect the state.
Going deeper: Ruby’s C-level debugging API
So far, we’ve looked at the two core technologies behind Ruby debuggers — TracePoint and Instruction Sequence. These are enough to build a working Ruby debugger. However, if you want to implement advanced features like those offered by RubyMine, such as smart stepping or navigating back and forth through the call stack, TracePoint and Instruction Sequence alone won’t cut it. To support such capabilities, you need to go a level deeper and tap into the low-level debugging APIs provided by Ruby itself.
CRuby exposes a number of internal methods that fill the gaps left by the public Ruby APIs. These methods are defined in C headers such as vm_core.h, vm_callinfo.h, iseq.h, and debug.h, among others. These internal interfaces can unlock powerful capabilities that go beyond what’s possible with the public API, but they come with important trade-offs.
Since they are specific to CRuby, debuggers using them won’t work with other implementations like JRuby or TruffleRuby. Another downside is that these APIs are not public or stable across Ruby versions. Even minor updates can break them, which means any debugger depending on these methods needs constant attention to keep up with Ruby’s changes. Still, it’s worth exploring a few of these internal methods to get a better idea of what this low-level API looks like and what it provides for debugger tools.
Let’s start with rb_tracepoint_new(...):
VALUE rb_tracepoint_new(VALUE target_thread_not_supported_yet, rb_event_flag_t events, void (*func)(VALUE, void *), void *data);
This method works like creating a trace point in Ruby code, but with more flexibility for advanced use. It’s especially helpful for low-level debuggers written as C extensions that need deeper access to the Ruby VM. In the RubyMine debugger, this approach allows more precise control over when and where to enable or disable trace points, which is essential for implementing smart stepping.
Another useful method is rb_debug_inspector_open(...):
VALUE rb_debug_inspector_open(rb_debug_inspector_func_t func, void *data);
This C-level API lets you inspect the call stack without changing the VM state. The func callback receives a rb_debug_inspector_t struct, which provides access to bindings, locations, instruction sequences, and other frame details. In the RubyMine debugger, it’s used to retrieve the list of frames and implement the ability to switch between them back and forth on the call stack when the program is suspended by the debugger. Without this API, frame navigation and custom frame inspection in Ruby would be much more difficult.
The final example is a pair of methods for working with iseq objects. The method rb_iseqw_to_iseq(...) converts an iseq from a Ruby value to a C value, while rb_iseq_original_iseq(...) converts it back from C to Ruby. These let Ruby debuggers switch between Ruby and C-extension code when precise, low-level control is needed. In the RubyMine debugger, they are actively used in the implementation of smart stepping, helping determine which code should be stepped into during debugging.
These low-level APIs offer powerful tools for building advanced debugging features — the kind that aren’t possible with TracePoint and Instruction Sequence alone. But they come with a cost: platform lock-in to CRuby and a high maintenance burden due to their instability across Ruby versions. Despite that, they remain essential for debuggers that need deep integration with the Ruby VM.
Conclusion
In this post, we explored the foundational technologies that power Ruby debuggers — TracePoint and Instruction Sequence. These two components form the basis for how modern Ruby debuggers observe and interact with running Ruby code. TracePoint enables hooks into specific runtime events like method calls and line execution, while Instruction Sequence provides low-level access to the compiled Ruby VM bytecode.
We also took a brief look at how low-level CRuby C APIs exert even more precise control over code execution, offering insight into how debuggers like RubyMine implement advanced features. While we didn’t dive into full debugger implementations here, this foundation lays the groundwork for understanding how these tools operate.
Stay tuned — in a future post, we’ll go further into how modern debuggers are built on top of this foundation.
Happy coding, and may your bugs be few and easily fixable!
The RubyMine team
]]>The RubyMine 2025.2 Early Access Program is already available! In this blog post, we’ll share the upcoming features and updates planned for this release cycle.

What’s coming in RubyMine 2025.2?
Debugger improvements
We’re introducing a number of changes aimed at enhancing the debugger installation experience. The entire process will now take less time, and the associated notifications will be less distracting and more informative. Finally, the RubyMine debugger will be updated to support newly released Ruby versions sooner than it previously did.
Better multi-module support
A priority of the upcoming RubyMine release is the provision of support for multi-module projects. This will include bundler improvements, faster startup for multi-module projects, smoother switching between interpreters, and more.
Automatic management of RBS Collection
We made this feature a default setting, which requires RBS 3.2. Ruby 3.4 comes with a compatible RBS version bundled. This is beneficial for all features related to code insight.
Better remote development experience
We are continuing to enhance RubyMine remote development as an alternative to using just remote Ruby interpreters. In 2025.2, you will enjoy an even better overall performance and several improvements to split mode.
AI Assistant improvements
In the new release, you can expect AI Assistant to generate more code suggestions across your projects. The quality of multi-line suggestions will also improve now that the formatting of outputs has been fixed.
What’s more, in line with our efforts to expand AI Assistant’s functionality, we have improved code completion for ERB in RubyMine 2025.2.
Join the Early Access Program
You can download the latest EAP build from our website or via the Toolbox App. The full list of tickets addressed by this EAP build is available in the release notes.
Stay connected through our official RubyMine X channel. We encourage you to share your thoughts in the comments below and to create and vote for new feature requests in our issue tracker.
Happy developing!
The RubyMine team
]]>Why Junie is a game-changer
Unlike other AI coding agents, Junie leverages the robust power of JetBrains IDEs and reliable large language models (LLMs) to deliver exceptional results with high precision.
According to SWE-bench Verified, a curated benchmark of 500 real-world developer tasks, Junie successfully solves 60.8% of tasks on a single run. This impressive success rate demonstrates Junie’s ability to tackle coding challenges that would normally require hours to complete. This is more than AI – it’s the latest evolution in developer productivity.

Your most trusted AI partner
Junie isn’t just an assistant – it’s your creative and strategic partner. Here’s what Junie can do for you in RubyMine:
- Build entire Ruby apps, not just snippets
Need more than individual code fragments? Junie can write entire applications, handling complex structures with ease and precision. - Automate inspections and testing
Pairing Junie with RubyMine’s powerful code insight tools means inspections and automated tests (RSpec, minitest) are no longer a chore. Let Junie ensure your code works – and works well. - Suggest features and code improvements
Stuck? Junie brings fresh ideas to the table, pointing out areas for improvement, suggesting optimizations, or brainstorming entirely new features for your project. - Clean and align code with your style
Junie doesn’t just write code – it ensures everything aligns with your coding style and guidelines, leaving your code polished, structured, and ready to deploy.
With most of the heavy lifting off your plate, Junie saves you time and mental energy. Instead of getting bogged down in the mundane, you’re free to focus on strategy, innovation, and big-picture ideas.
You define the process, Junie elevates it
While Junie is indeed powerful and capable, it’s designed to enhance your coding experience, not take control of it. You remain the decision-maker at every step – from delegating tasks to reviewing Junie’s code suggestions.
You control how and when AI contributes to your workflow. No matter what you entrust to Junie, it will adapt to your style and always give you the final say, ensuring that your code remains truly yours.
Try Junie in RubyMine today
Now is the perfect time to try Junie in RubyMine and experience firsthand how AI can boost your productivity, simplify your workflow, and enhance your coding experience.
To install Junie in RubyMine, visit this page.
Follow us for updates and tips
Find more about Junie and the project’s further development in this article.
Stay connected through our official RubyMine X channel. Don’t forget to share your thoughts in the comments below and to suggest and vote for new features in our issue tracker.
Happy developing!
The RubyMine team
]]>Below is a brief overview of the most notable features. For a detailed description of this update, please visit our What’s New page.
You can get the new build from our website or via the free Toolbox App.
AI Assistant
The new RubyMine release comes with all JetBrains AI features accessible for free, with unlimited use for some, such as unlimited code completion and local model support, and limited credit-based access to others. You can choose what to use and how to use it with the new subscription system.
RBS coding assistance
RubyMine 2025.1 further expands the powers of the JetBrains AI Assistant plugin with code completion for RBS based on JetBrains’ new Mellum model. AI Assistant now also allows you to use natural language prompts directly in the editor to enhance your RBS coding.
Better AI suggestions
AI code suggestions are now provided with error inspections and syntax highlighting to make sure you find and use only what best suits your purposes.
New models and modes
Take full control of your AI experience in RubyMine by choosing from the latest and most advanced models: Claude 3.7 Sonnet and Gemini 2.0 Flash.

You can now also use the plugin offline. With Ollama and LM Studio local models, all AI-powered coding assistance is still available even when there’s no internet connection.
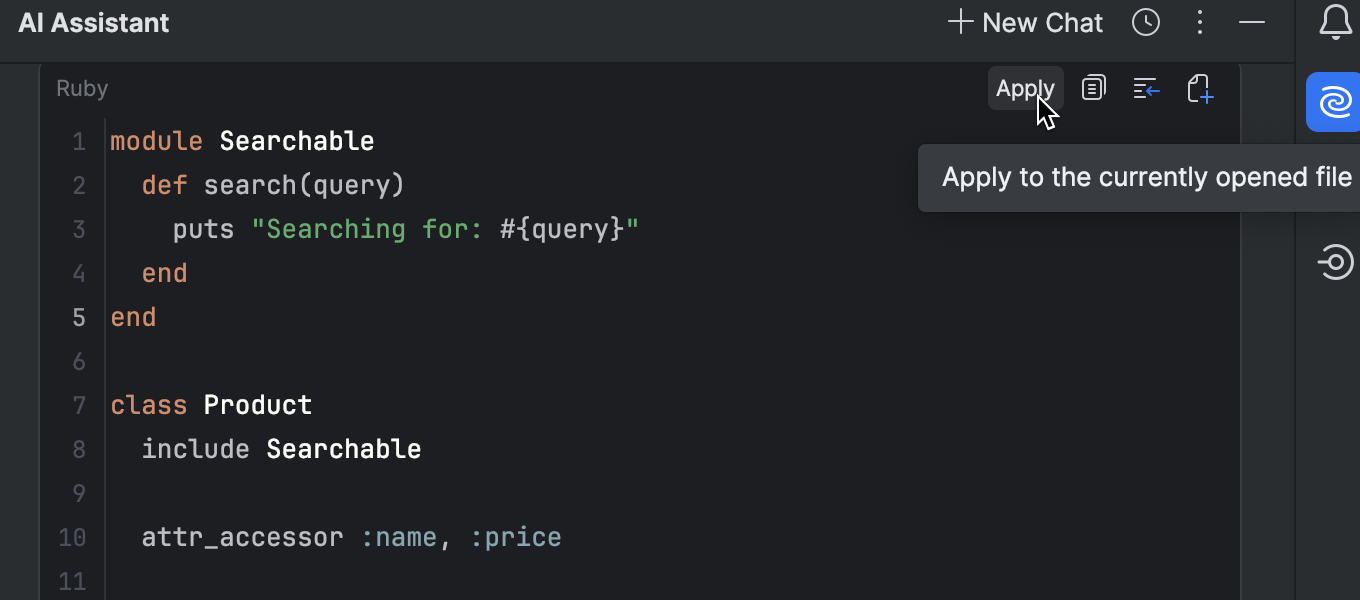
Improved AI chat
Be more productive with the upgraded AI chat, which can now locate the most relevant files and make suggestions across your entire project within one interaction. Moreover, it will find and suggest where to insert the newly generated code to save you the trouble of manual copy-pasting. All it takes is one click on the Apply button.
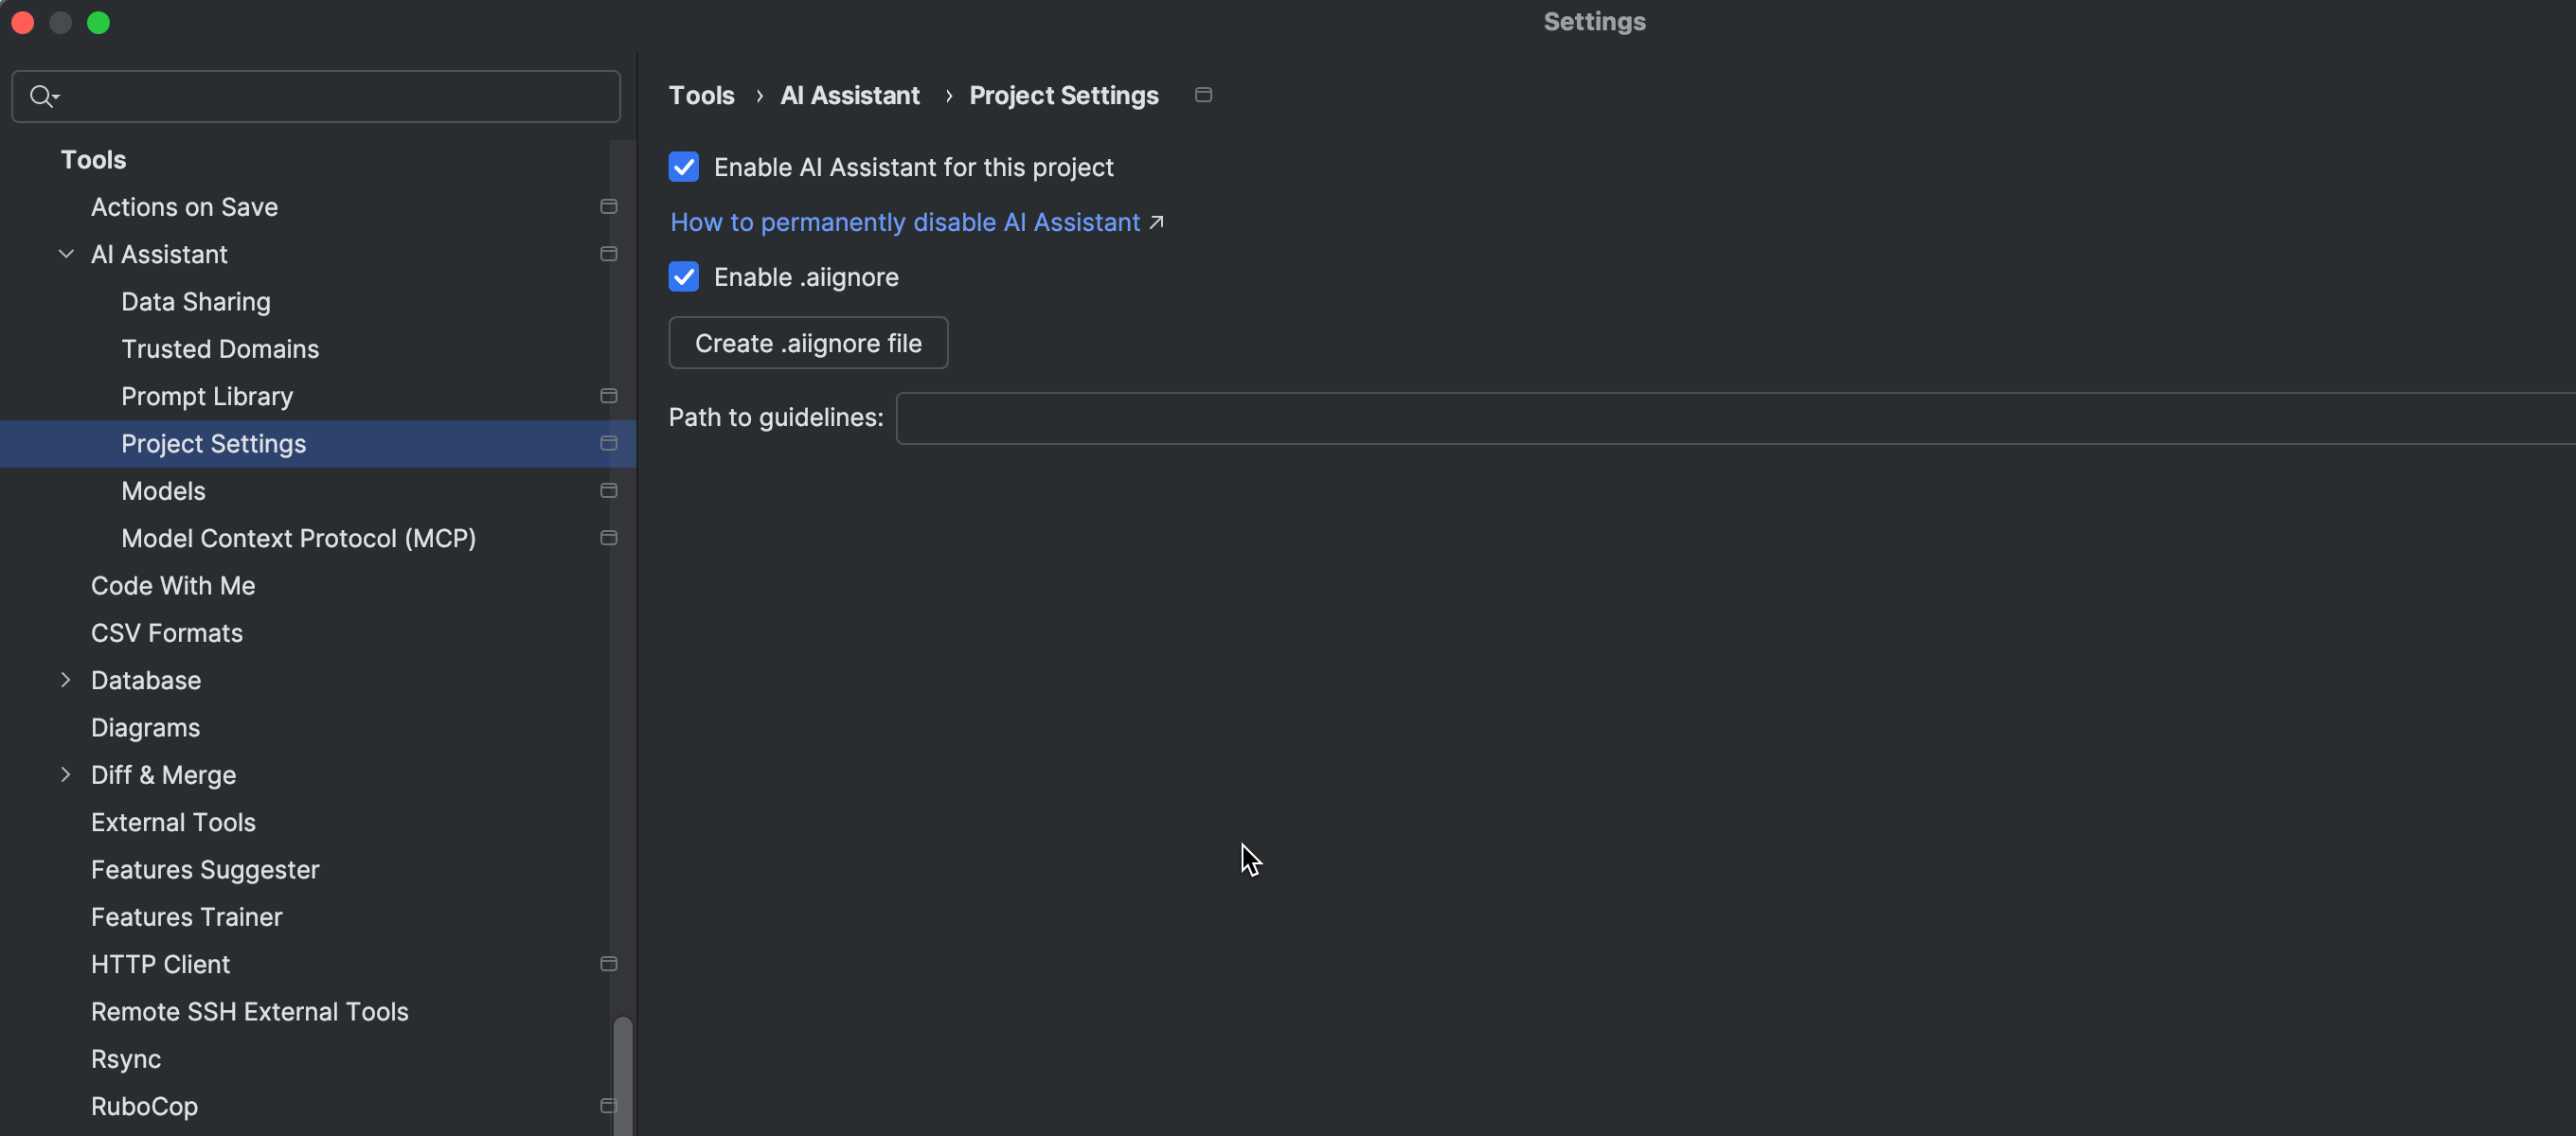
Smarter AI awareness
The revamped AI Assistant better understands your entire project thanks to the advanced RAG-based retrieval technique. While AI context now includes recently accessed files, you can tell AI Assistant which files or folders to ignore by configuring an .aiignore file.
Ruby
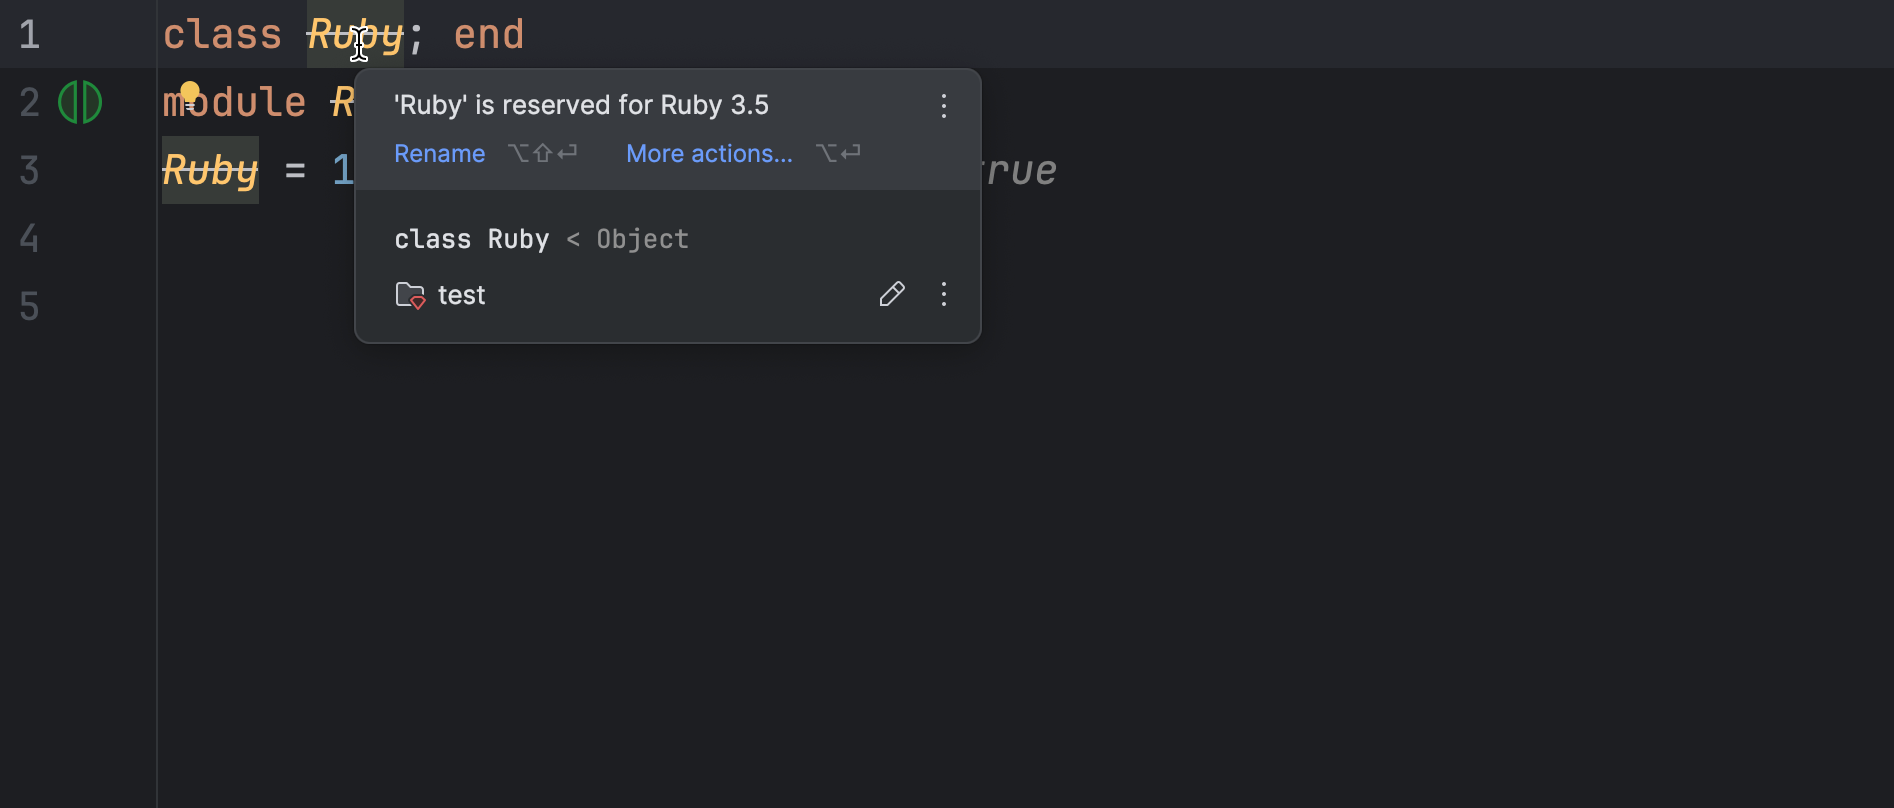
Ruby 3.4 support
RubyMine 2025.1 displays warnings when you create constants or modify the global Ruby namespace and sends error messages when using keyword and block arguments inside index assignments.
asdf 0.16+ compatibility
RubyMine 2025.1 supports the latest version of asdf to make sure the interpreters installed with this version manager are recognized properly. This fixes any issues you might have previously encountered in RubyMine when using the re-written 0.16 version of asdf.
Rails
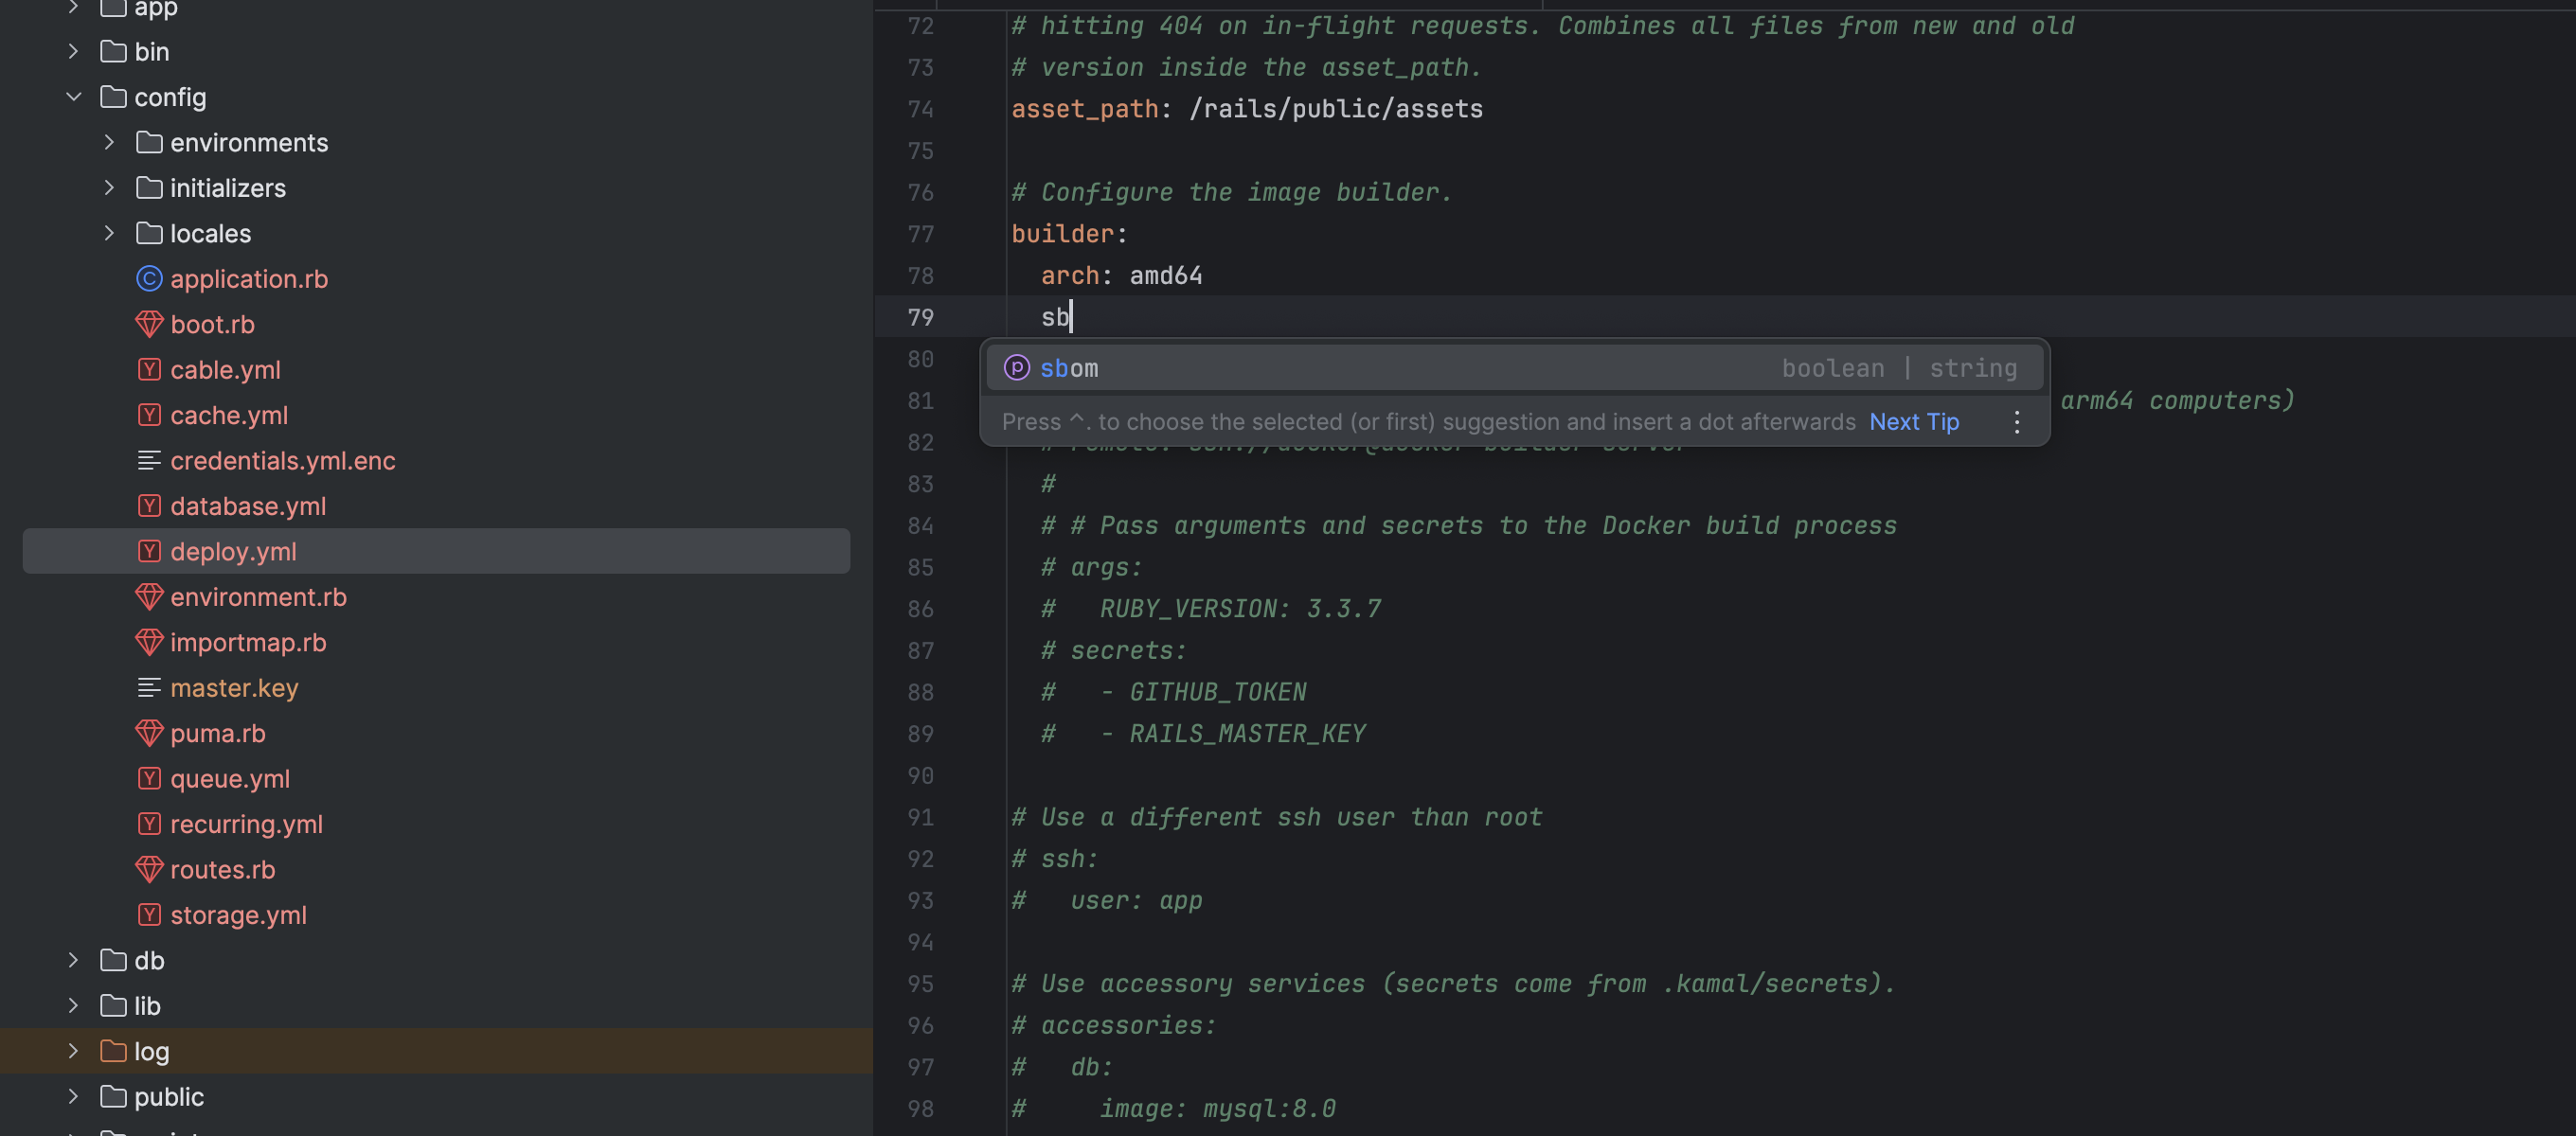
Kamal 2.4.0 and 2.5.0 support
RubyMine 2025.1 comes with the updated deploy.yml schema to help you deploy your Rails applications with the new 2.4.0 and 2.5.0 versions of Kamal.
Rake task and Rails generator handling
Control the automatic refreshing of Rails generators and Rake tasks using advanced settings. When the automatic loading is disabled, only manual reload actions are available. We have also improved the UX by placing loading errors in balloon notifications instead of the previously used window notifications.
User experience
User interface updates
The UI improvements in RubyMine 2025.1 include native Windows file dialogs, which are part of the default settings but can be changed to the previous option in Advanced Settings | User Interface. We also simplified the procedure of creating new files. After clicking the + icon in the Project tool window, you can now quickly find and select the required template from the popup using the search field.
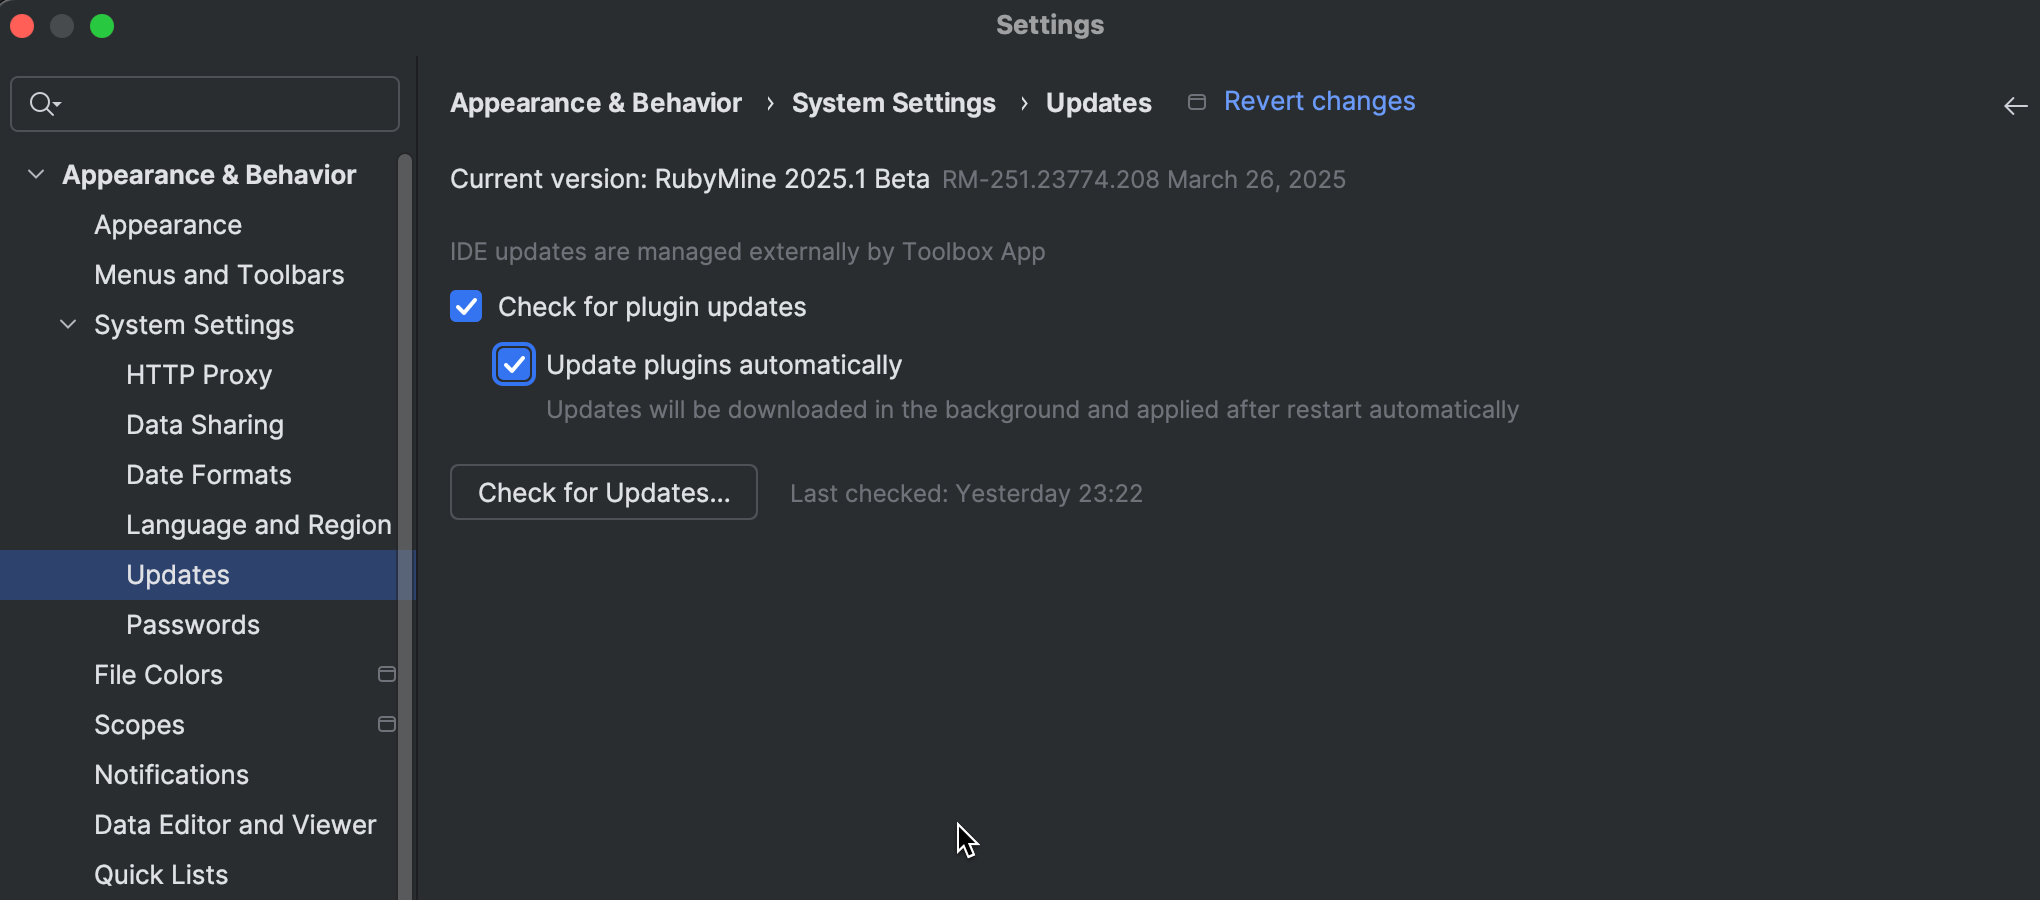
Automatic plugin updating
RubyMine 2025.1 can update plugins in the background. With this setting, all available and compatible updates are downloaded and applied on the next RubyMine restart.
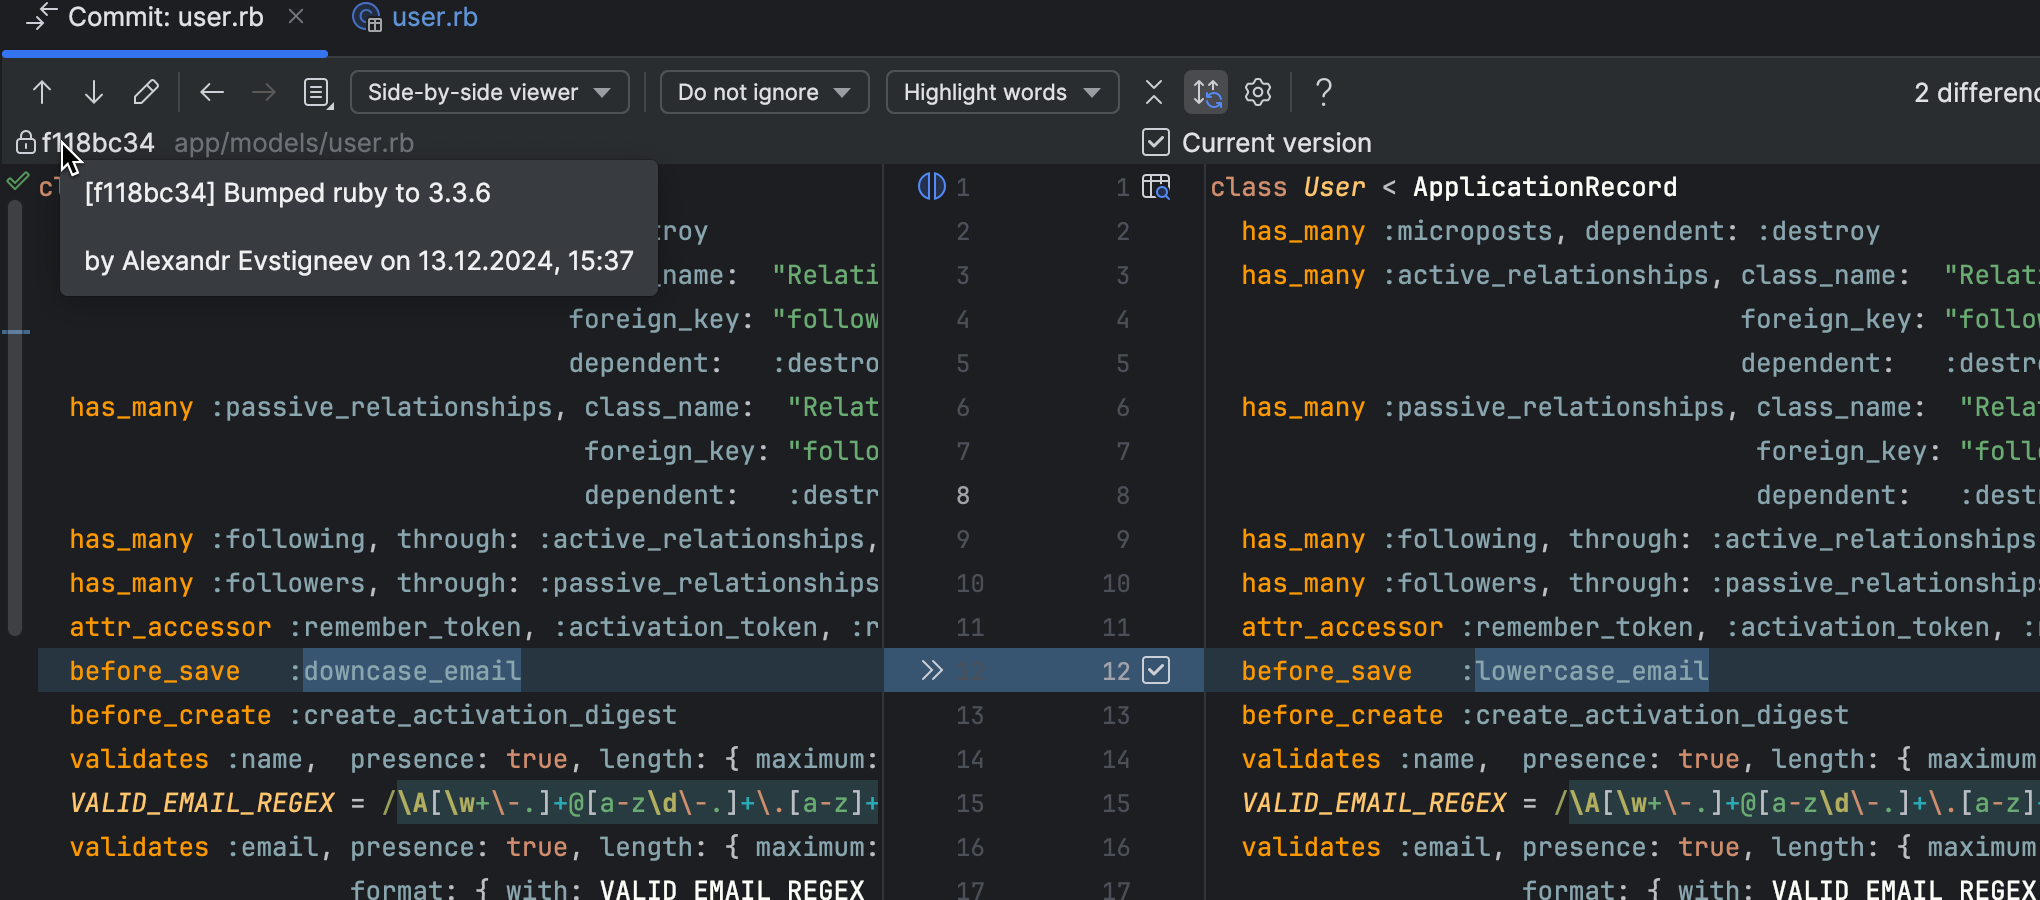
VCS
RubyMine 2025.1 no longer offers the modal commit interface as a bundled option, but you can still use it as a separate plugin. Another change is the enhanced diff view, which allows you to see commit details for quicker and easier analysis of the file history and modifications.
Remote development
Containerfile support
Enjoy more freedom and flexibility when using various tools for remote solutions in the same environment. With RubyMine 2025.1 featuring built-in Containerfile recognition, Docker, Podman, and Buildah can all be configured in the same file. And this file is fully recognized by the tools of your choice, with full support for syntax highlighting, linting, and snippet suggestions.

Improved editing
With reduced typing, highlighting, and formatting latency, RubyMine 2025.1 ensures a better overall editing experience in remote development.
To learn about the latest features as they come out, please follow RubyMine on X.
We invite you to share your thoughts in the comments below and to suggest and vote for new features in the issue tracker.
Happy developing!
The RubyMine team
]]>We’re starting this year off with the opening of the RubyMine 2025.1 Early Access Program. In this blog post, you’ll find details about the new features and improvements we’ve been working on.

What’s coming in RubyMine 2025.1?
AI Assistant
The 2024.3 release introduced enhanced cloud-based completion for Ruby code. The upcoming release will expand that support to related technologies like RBS and ERB, offering faster, more context-sensitive completion and enhanced quality, as well as support for multiline completion.
We’re also implementing inline AI prompt functionality for those same technologies. This means you’ll be able to submit natural language requests to AI Assistant and get instant code changes in your RBS and ERB files.
Debugger
We’re working hard to improve our debugging tools and fix existing problems. In version 2025.1, you’ll find fixes for multi-module projects, an improved experience when attaching to running processes, and a more straightforward installation and downloading of RubyMine debugger gems. With these changes we aim to provide a smoother and more reliable debugging experience overall, along with various bug fixes and performance optimizations.
Remote development experience
Building on our previous release, we’re continuing to enhance remote development in RubyMine. We’re now working to introduce more responsive typing and editing for Ruby code when you’re working remotely with JetBrains Gateway, and we’re extending these improvements to RBS and ERB. Our goal is to reduce delays, resulting in a faster and more fluid coding experience.
Support for Ruby 3.4
In RubyMine 2025.1, we’re introducing more changes and improvements to accommodate Ruby 3.4 features. Stay tuned for updates about better code insight and improved inspections.
Minor releases for RubyMine 2024.3 will include select Ruby 3.4 updates as well.
Qodana for Ruby
We’re integrating Ruby inspections into Qodana, a smart code quality platform by JetBrains. Qodana offers customizable inspection profiles and detailed reports highlighting issues with solutions, and it facilitates code review optimization, standard enforcement, and team collaboration via cloud storage.
With the Qodana plugin in RubyMine, you will be able to run Qodana locally and then forward inspection reports to Qodana Cloud for storage and analysis.
Join the Early Access Program
You can download the latest EAP build from our website or via the Toolbox App. The full list of closed tickets for this build is available in the release notes.
We encourage you to share your thoughts in the comments below and to create and vote for new feature requests in the issue tracker.
Happy developing!
The RubyMine team
]]>Debugging is an essential skill in software development, and in this post, we’ll be looking at how to investigate the behavior of Ruby code. As the RubyMine team, we’ve accumulated considerable expertise in creating tools for Ruby developers, and we’re excited to share our experience and knowledge with you.
Recently, at the EuRuKo 2024 conference, our team member Dmitry Pogrebnoy presented the Demystifying Debuggers talk. This blog post is the first in a series based on that presentation, aiming to provide you with valuable insights into debugging Ruby applications.
Every Ruby programmer inevitably encounters situations where their code doesn’t behave as expected. In these moments, we all wish we had an efficient way to pinpoint the problem and fix it quickly. That’s where debugging tools come into play.
In this post, we’ll explore various tools and approaches available to Ruby developers for investigating bugs. We’ll cover several classes of tools, each with its own strengths and weaknesses. Understanding the specifics of each tool will help you choose the most effective one for your particular debugging scenario.
To make our discussion more concrete, we’ll start with a real-world example of a bug we encountered in one of our internal Ruby projects. This case study will illustrate the importance of proper debugging techniques and set the stage for our exploration of debugging tools.
Whether you’re a seasoned Ruby developer or just starting out, this guide will help you sharpen your debugging skills and tackle bugs more efficiently. Let’s get started!
A real bug case from the RubyMine team
In the RubyMine team, our development efforts extend beyond the IDE itself. We’ve created several proprietary gems that enhance the IDE’s functionality. To share some insights, we’ll explore a real-world bug we encountered in one of these gems about a year ago. We’ve isolated and simplified the code sample to focus on the core issue.
Consider the following Ruby code:
def process(thing)
 if defined? thing.to_s || defined? thing.inspect
   puts "Element is Printable"
 else
   puts "Element is Not Printable"
 end
end

process(5)               # -> Element is Printable
process(BasicObject.new) # -> Element is Printable
At first glance, this process method seems straightforward. It aims to check whether the given argument has either a to_s or an inspect method. If either method exists, process should print “Element is Printable”; otherwise, it prints “Element is Not Printable”.
At the bottom, you can see two calls of this method with their outputs. The first call process(5) produces the message “Element is Printable”. This is correct. But the second call process(BasicObject.new) looks suspicious. It takes BasicObject as an argument, but prints “Element is Printable”. This is incorrect because the BasicObject instance does not respond to either of the methods we are looking for. So apparently this code contains a bug.
Let’s take a moment to examine the process method. Can you spot the bug?
Spoiler – click to expand!
The bug lies in the if condition:
defined? thing.to_s || defined? thing.inspect
Due to Ruby’s operator precedence, the interpreter actually evaluates this as:
defined?(thing.to_s || defined?(thing.inspect))
This expression always returns “expression”, regardless of whether thing responds to to_s or inspect. As a result, the condition is always true, and our method incorrectly classifies every object as printable.
The fix is simple but illustrative of how small syntax errors can lead to significant logical flaws. We need to explicitly structure our conditions using parentheses:
def process(thing)
 if defined?(thing.to_s) || defined?(thing.inspect)
   puts "Element is Printable"
 else
   puts "Element is Not Printable"
 end
end

process(5)               # -> Element is Printable
process(BasicObject.new) # -> Element is Not Printable
With this correction, our method now accurately distinguishes between objects that implement to_s or inspect and those that don’t.
By sharing this real-world example, we hope to demonstrate that debugging is a crucial skill for all developers, regardless of experience level. It’s not just about fixing errors; it’s about understanding the intricacies of the language and writing more reliable code.
In more complex, production-level applications, such issues can be far more challenging to identify and resolve. This underscores the importance of robust debugging tools and techniques, which we’ll explore in the following sections.
Choosing the right tool
When it comes to debugging Ruby code, developers have several tools and approaches at their disposal. Let’s explore these options, starting with the basics and then moving on to more advanced techniques.
puts statements
The most basic debugging technique, requiring no setup or additional gems, is using puts statements. This method involves inserting print statements directly into your code to output variable values or execution flow information. While simple, it can be surprisingly effective for quick investigations.
Let’s apply this technique to our earlier example:
def process(thing)
 puts "defined? thing.to_s: #{defined? thing.to_s}"
 puts "defined? thing.inspect: #{defined? thing.inspect}"
 puts "defined? thing.to_s || defined? thing.inspect: #{
   defined? thing.to_s || defined? thing.inspect
 }"
 if defined? thing.to_s || defined? thing.inspect
   puts "Element is Printable"
 else
   puts "Element is Not Printable"
 end
end

process(5)
process(BasicObject.new)
This yields the following output:
defined? thing.to_s: method
defined? thing.inspect: method
defined? thing.to_s || defined? thing.inspect: expression
Element is Printable
defined? thing.to_s:
defined? thing.inspect:
defined? thing.to_s || defined? thing.inspect: expression
Element is Printable
The inconsistent output from these two methods calls with different arguments hints at where the problem might lie. We can see that, for BasicObject.new, both thing.to_s and thing.inspect are undefined, yet the condition still evaluates to true.
While basic puts statements are useful, several gems can make them more informative:
1. puts_debuggerer gem enhances puts output with the file name, line number, and content of this line.
For example:
require 'puts_debuggerer'
pd "defined? thing.to_s: #{defined? thing.to_s}"
Output:
[PD] example_puts_debuggerer.rb:5 in Object.process
   > pd "defined? thing.to_s: #{defined? thing.to_s}"
  => "Debug print 1: method"
2. awesome_print and similar gems provide more structured and readable output, especially useful for complex objects.
Generally puts statements are useful and might effectively help you with simple cases or when other tools don’t work for some reason. However, puts statements are really basic. They require modifying your source code every time you need to adjust an existing message or add a new one. They are usually not convenient to use because you need to restart the program whenever you modify what you are printing.
Pros and cons of debugging using puts
Pros:
- Simple and quick to implement.
- Works in any Ruby environment.
- No additional tools or setup are required.
Cons:
- Requires modifying source code.
- Can clutter the code if overused.
- Forces you to restart the program if you want to change what you print.
- Limited information compared to more advanced tools.
While puts statements are invaluable for quick checks, they become less efficient for complex scenarios or when frequent changes are needed. In such cases, more advanced tools like interactive consoles or full-fledged debuggers offer greater flexibility and power.
Interactive consoles
Interactive consoles represent the next level in bug investigation tools for Ruby developers. The two primary options are IRB and Pry, both offering powerful introspection capabilities.
To utilize interactive consoles for debugging, you typically need to insert binding.irb or binding.pry calls into your source code. When the binding command is executed, an interactive console launches, providing access to the current context and the ability to execute arbitrary expressions in this context.
Let’s use IRB in our earlier example:
def process(thing)
 binding.irb
 if defined? thing.to_s || defined? thing.inspect
   puts "Element is Printable"
 else
   puts "Element is Not Printable"
 end
end

process(5) # -> Element is Printable
process(BasicObject.new) # -> Element is Printable
When the code hits the binding.irb line, we’ll enter an interactive session:
From: 5_example_define_irb.rb @ line 2 :

    1: def process(thing)
 => 2:   binding.irb
    3:   if defined? thing.to_s || defined? thing.inspect
    4:     puts "Element is Printable"
    5:   else
    6:     puts "Element is Not Printable"
    7:   end

irb(main):001> defined? thing.to_s
=> nil
irb(main):002> defined? thing.inspect
=> nil
irb(main):003> defined? thing.to_s || defined? thing.inspect
=> "expression"
irb(main):004> exit
Element is Printable
This interaction allows us to examine the behavior of the condition’s individual parts, helping to pinpoint the issue.
Pros and cons of debugging using interactive consoles
Pros:
- More complex and flexible than
putsstatements. - Partially allows for on-the-fly investigation.
- No need to predetermine all debugging output.
Cons:
- Still requires source code modification.
- Requires you to set predefined introspection points that cannot be changed at runtime.
- Forces you to restart the program if you want to change introspection points.
While interactive consoles offer more power than simple puts statements, they still have limitations. For complex debugging scenarios or when fine-grained control over execution is needed, full-featured debuggers provide even more capabilities.
Debuggers
Debuggers represent the pinnacle of tools available for investigating bugs in Ruby code. They offer capabilities far beyond simple puts statements and interactive consoles, providing full control over program execution. This powerful feature set allows developers to:
- Pause execution at a specified point using breakpoints.
- Inspect and modify variables in real time.
- Examine the call stack at every breakpoint.
- Step through code line by line.
- Evaluate expressions in the current context.
Let’s explore the three main debuggers for Ruby:
1. byebug gem
- Default debugger for Ruby 2.5.X, Ruby 2.6.X, Rails 5, and Rails 6.
- Comes with all the essential features you’d expect from a debugger like breakpoints, stepping, context, and stack introspection.
- For Rails applications, it requires modification of the application source code. You usually need to place a special call in your code to start the debugger at a certain place.
- Has noticeable performance overheads that make it less usable for complicated applications.
2. debug gem
- Supports only Ruby versions starting from 2.7.
- Has no visible performance overheads on supported Ruby versions.
- For Rails applications,
debug, similar tobyebug, requires modification of the application source code. - Bundled with Ruby starting from version 3.1.
- Supports Ruby versions 2.3 and later – so almost all possible versions of Ruby your application could use.
- Has no visible performance overheads on any of the supported versions of Ruby.
- No need to modify the code to use the debugger.
- Provides a user-friendly UI out of the box that streamlines debugging.
Despite its extensive feature set, debuggers might be difficult to use in some specific configurations. While debuggers are powerful, they’re most effective when combined with other debugging techniques. The choice of debugger often depends on your specific project and configuration requirements, Ruby version, and personal preferences.
Conclusion
Debugging in Ruby is both an art and a science, presenting challenges that can be overcome with the right tools. As we’ve explored in this post, Ruby developers have a rich toolkit at their disposal, ranging from simple puts statements to sophisticated debuggers.
Each debugging approach we’ve discussed has its strengths:
putsstatements offer quick, straightforward insights, ideal for simple issues or when other tools are unavailable.- Interactive consoles like IRB and Pry provide a more dynamic environment, allowing for deep context introspection and complex expression evaluation.
- Full-fledged debuggers, such as the
byebuganddebuggems, as well as the RubyMine debugger, offer comprehensive control over program execution, enabling developers to dissect even the most intricate bugs.
The journey from encountering an unexpected bug to pinpointing its exact cause often requires a combination of these tools, along with methodical investigation and sometimes a bit of creative problem-solving. By understanding the strengths and limitations of each debugging tool, you can select the most appropriate approach for each unique situation.
As the RubyMine team, we’re particularly interested in how our debugging tools serve the Ruby community. We encourage you to explore the RubyMine debugger and share your experiences in the comments below or create an issue in the issue tracker. Your fellow developers will surely appreciate your insight.
Looking ahead, our next post will delve deeper into the inner workings of debuggers. We’ll explore their internal mechanisms and even tackle an exciting challenge: creating a basic debugger from scratch. This exploration will enhance your understanding of debugging tools and provide deeper insights into Ruby’s internals.
Meanwhile, take advantage of the advanced debugger in RubyMine. Download the latest RubyMine version from our website or via the free Toolbox App.
Remember, effective debugging is more than just finding and fixing errors – it’s about understanding your code at a fundamental level. Each debugging session is an opportunity to learn, improve, and write more robust Ruby code.
Stay curious, keep exploring, and happy debugging!
The RubyMine team
]]>The latest version of JetBrains’ IDE for Ruby and Ruby on Rails comes with Rails 8 support, including Kamal 2 code completion, nilability annotations from schema.rb for type support, and Solid Queue and Solid Cache code insights.
Enhanced by JetBrains AI Assistant, RubyMine now offers faster and more contextually aware cloud-based code completion, inline AI prompts, and more context about Rails applications for unit test generation.
With built-in integration with the RBS Collection, you can benefit from the type signatures included in the RBS Collection even if you don’t use RBS in your project. RubyMine 2024.3 also includes Ruby 3.4 updates, bundled spelling and grammar checks from Grazie, and much more!
Below is a brief overview of the most notable features. For a detailed description of this update, please visit our What’s New page.
You can get the new build from our website or via the free Toolbox App.
Rails 8 support
Kamal 2 support
Rails 8 provides support for deploying your applications with Kamal 2, and in RubyMine 2024.3, we’ve implemented code completion for Kamal 2 configurations.

Nilability annotations from schema.rb for type support
RubyMine now recognizes the not-null type modifier for migration attributes and provides highlighting and warnings for incorrect nil assignments.

Code insight for Solid Queue and Solid Cache
In RubyMine 2024.3, queue_schema.rb and cache_schema.rb files now feature specific icons and syntax highlighting.

AI Assistant
Enhanced cloud-based code completion
RubyMine 2024.3 introduces faster and more contextually aware cloud-based code completion through the JetBrains AI Assistant plugin, featuring quality and speed improvements and adding support for multiline completion.
Powered by the Mellum large language model (LLM), completion latency has been nearly cut down to one-tenth of what it was in previous versions, which means suggestions are almost instant. The acceptance rate for completion suggestions has approximately doubled, while the cancel rate has dropped to between half and a third of what it was in the previous version.
Please note that cloud-based code completion in AI Assistant is available only with an AI Pro subscription or an active free trial.
Inline AI prompts
RubyMine 2024.3 introduces inline AI prompts, offering a seamless way to interact with AI Assistant directly in the editor. You can type requests in natural language, which AI Assistant instantly interprets and converts into code changes, marked with purple in the gutter for easy tracking. Inline AI prompts are context-aware, automatically including related files and symbols for more accurate code generation.
This feature is currently only available in *.rb files.

Improved Rails context for unit tests
RubyMine now provides AI Assistant with more context about Rails applications for better unit test generation.
Built-in integration with the RBS Collection
RubyMine now features built-in integration with the RBS Collection, a community-managed collection of RBS files for gems that do not include signatures.
Even if you don’t use RBS in your project, you can still benefit from the type signatures included in the RBS Collection, with no additional effort required. RubyMine will automatically download and manage the type signatures for the project dependencies.

Ability to use it as an alias for numbered parameters in blocks
RubyMine now recognizes it as an alias for _1 in blocks without parameters, providing type support and conversion intentions for such usages.
We added a new error annotation that prevents you from using it in a block with regular numbered parameters.

Support for Ruby 3.4 “chilled” strings
RubyMine now recognizes “chilled” strings, a new transitional state for string literals in Ruby 3.4. In projects without the frozen_string_literal pragma, strings are “chilled”. A “chilled” string will output a warning when modified; unlike a frozen string, it will not throw an error.

Error annotations for ambiguous anonymous arguments
RubyMine now displays an error when you try to use anonymous block, rest, and keyword rest arguments in an ambiguous nested context.

Bundled spelling and grammar checks
The Grazie plugin is now available in RubyMine out of the box. It provides intelligent checks beyond simple spelling mistakes and typos. It understands grammar rules and can warn you about inappropriate style. Grazie checks are available in strings, HereDocs, comments, block comments, and RDoc files.

You can manage Grazie checks in Settings | Editor | Natural Languages | Grammar and Style | Scope.

To learn about the newest features as they come out, please follow RubyMine on X.
We invite you to share your thoughts in the comments below and to suggest and vote for new features in the issue tracker.
Happy developing!
The RubyMine team
]]>In this post, we will tell you more about the motivation behind the new UI and how it was developed. We’ll also provide some useful tips for configuring it if you are used to the classic one.
Evolution of the UI and UX
In version 2024.2, the new UI became the default in JetBrains IDEs after being optional for several releases. Still, time flies and this may have happened sooner than expected. The classic UI was moved to an unbundled plugin, and our in-IDE tips and onboarding tour weren’t always enough for those who had to adjust during their busy workdays. However, this significant change was the natural final step in the long process of the UI’s evolution.
The idea for the new UI was born over four years ago, around the 20th anniversary of JetBrains in 2020. Our goal was to create a modern, lightweight interface that follows current industry trends while maintaining the powerful features our tools are known for.
We started working on this new interface in 2022 with a limited preview program joined by over 5000 users. We gathered feedback from Reddit, X, and a dedicated Slack channel, which allowed us to fix key usability issues raised by program participants. By the end of the year, with version 2022.3, the new UI was available in Beta for everyone to try.
Ten months later, in version 2023.2, we made the new UI the default for new users, and its adoption rate has steadily increased. We conducted several UX studies to understand user perceptions and address any remaining usability issues. Working with all the feedback, we improved the new UI to its final form and released it as the default for everyone in version 2024.2.
While we appreciate the mostly positive feedback we received during the development of the new UI, we know that some users may be disappointed. We understand that adapting to significant changes in your trusted tools can be challenging. However, all the powerful features you rely on are still there, and you can configure the new UI to suit your preferences.
Dogfooding the new UI inside JetBrains
At JetBrains, developers create tools for developers. That’s why we involved our own development teams in the evaluation process of the new UI from the very beginning. We gathered extensive internal feedback and engaged in spirited discussions, allowing us to assess the impact of each change and quickly address any pain points.
Initially, many of our colleagues were skeptical about the new UI. However, the current internal adoption rates for the latest major IntelliJ IDEA version (2024.2) show a significant preference for it, with 98.8% of our team using it compared to just 1.2% using the classic UI.
What’s next for the classic UI?
Starting with version 2024.2, the classic UI is available as a plugin that you can download from JetBrains Marketplace. We are committed to maintaining it until at least July 2025. This means that it will be tested and supported for all IDE versions we release until then.
Maintaining two different UIs places a significant load on our development and testing resources that we cannot continue to bear indefinitely. We plan to evaluate your feedback, fix more issues, and implement support for missing use cases in the new UI, but at some point, the classic UI will be deprecated.
How to configure familiar behavior in the new UI
While we want to move forward with this new UI, we recognize people are still adapting to it. To ease the transition, we’ve made sure it is possible to configure the new UI to behave more like the classic one. Let’s look at some configuration tweaks you may want to make.
In addition to outlining configuration options that are already available, we’ve also provided links to several tickets where you can vote for options you would like us to implement.
Use Compact mode
Enable Compact mode to reduce the heights of toolbars and tool window headers, scale down spacings and paddings, and make icons and buttons smaller. Just go to the main menu and select View | Appearance | Compact Mode.

Show the main menu in a separate toolbar (Windows and Linux)
To display the horizontally expanded main menu at the top of the window, go to View | Appearance in the main menu and enable the corresponding option. Alternatively, you can right-click on the main toolbar and enable Show Main Menu in Separate Toolbar.

Note: There’s a request to always show the expanded menu in the main toolbar – IJPL-43725.
Native OS window title (Linux)
To restore the native window title, go to Settings | Appearance & Behavior | Appearance, and disable the Merge main menu with window title option.

Add missing action buttons to the main toolbar
To add action buttons to the main toolbar, simply right-click on the toolbar, point to Add to Main Toolbar, and select the actions you want to add. If your desired action is not on the list, you can use the Customize Main Toolbar dialog to add it.

Move the navigation bar to the top of the window
To put the navigation bar containing project breadcrumbs at the top of the window, from the main menu, go to View | Appearance | Navigation Bar, then select Top.

Show tool window names on sidebars
To add labels to the tool window buttons, right-click the tool window bar and select Show Tool Window Names.

Note: There’s a request to restore vertical tool window names – IJPL-158776.
Always show folding arrows and tool window header icons
In the new UI, tool window header icons and code folding arrows in the editor gutter appear on hover and disappear when you move the mouse away.
To make them always visible:
- In Settings | Advanced settings | Tool windows, enable Always show tool window header icons.
- In Settings | Editor | General | Code Folding, select Always next to the Show code folding arrows.
Select a line in the editor by clicking the line number
In the new UI, clicking on a line number sets a breakpoint instead of selecting the line. To revert to the previous behavior, right-click the gutter and disable Appearance | Breakpoints Over Line Numbers.

Add actions to the Debug window toolbar
Some actions, like Evaluate Expression and Show Execution Point, have been moved into the three-dot menu. To make them visible on the toolbar, right-click the header of the Debug tool window and select Add Actions…, then simply select the action you want to add from the list.

Note: There is a request to restore the Show Execution Point and Evaluate Expression buttons to the toolbar by default – IJPL-83483.
Return tool windows to the sidebar
Some tool windows are no longer shown by default. To bring the missing tool windows back, right-click the More tool windows button in the sidebar and select the tool windows you need. Alternatively, in the main menu, go to View | Tool Windows and select the ones you want there.

Note: There are currently unsupported configurations for tool windows that we are collecting votes for and may consider implementing in the future:
- Horizontal tool window bar at the bottom of the window – IJPL-43772.
- Tool windows placed horizontally at the top of the window – IJPL-59816.
Is something still missing?
There might be configurations that are not easy to set up or that aren’t supported at all in the new UI. If you’re struggling to configure the IDE to suit your particular scenario, we encourage you to contact JetBrains support or file a new issue in our tracker.
]]>We’re starting the RubyMine 2024.3 Early Access Program today. In this blog post, we’ll inform you about the upcoming features and updates in this release cycle.

What’s coming in RubyMine 2024.3?
AI Assistant
For RubyMine 2024.3, we’re working on several Ruby-specific AI features, focusing on context improvements for AI-powered unit test generation, explanation of exceptions in the test environment, and a new AI model for multiline code completion.
Support for Ruby 3.4
With the upcoming release of RubyMine 2024.3, you can look forward to Ruby code insight improvements to accommodate Ruby 3.4 features.
Remote development experience
Another important focus of our work is to enhance the typing and editing experience when using remote development. We’re reducing delays in typing and response time on the client side.
Built-in integration with the RBS Collection
The feature provides built-in integration with the RBS Collection, a community-managed collection of RBS files for gems that do not include signatures.
Even if you don’t use RBS in your project, you can still benefit from the type signatures included in the RBS Collection, with no additional effort required. RubyMine will automatically download and manage the type signatures for the project dependencies.
This feature is already available in the first RubyMine 2024.3 EAP build.
Improvements for code completion in consoles
We’ve added new options to control the preselection of the first completion suggestion when using consoles or evaluating expressions while debugging. You can already try these options in the first RubyMine 2024.3 EAP build.
Grazie bundled in RubyMine
Grazie is an intelligent spelling and grammar checker for any text you write in the IDE. We plan to make the Grazie plugin available in RubyMine out of the box.
Join the Early Access Program
You can download the latest EAP build from our website or via the Toolbox App. The full list of closed tickets for this EAP build is available in the release notes.
We encourage you to share your thoughts in the comments below and to create and vote for new feature requests in our issue tracker.
Happy developing!
The RubyMine team
]]>