Monitoring
JetBrains Rider provides an integrated monitoring tool that lets you track application performance in real time and analyze runtime behavior. You can view CPU usage, memory consumption, garbage collection activity, environment variables, counters, and metrics. On Windows, the tool can also collect detailed performance data in the background and let you analyze it using the integrated dotTrace Profiler.
By default, monitoring starts automatically in the Monitoring tool window when you run or debug your project.

Supported OSs and applications
Operating systems:
Windows – full functionality including background profiling, automatic detection of performance issues, timeframe analysis, and more *.
Linux and macOS – real-time data only. Background profiling and automatic detection of performance issues are not supported.
Applications:
.NET Core 3.0 and later, .NET 5.0 and later
.NET Framework **
Mono ***
Unity ***
C++ ***
Unreal Engine ***
Performance tab
The Performance tab visualizes your application's runtime behavior using charts. On Windows, it also provides a list of detected performance issues and lets you analyze them in detail via the integrated dotTrace Profiler (dotUltimate license required).
Charts

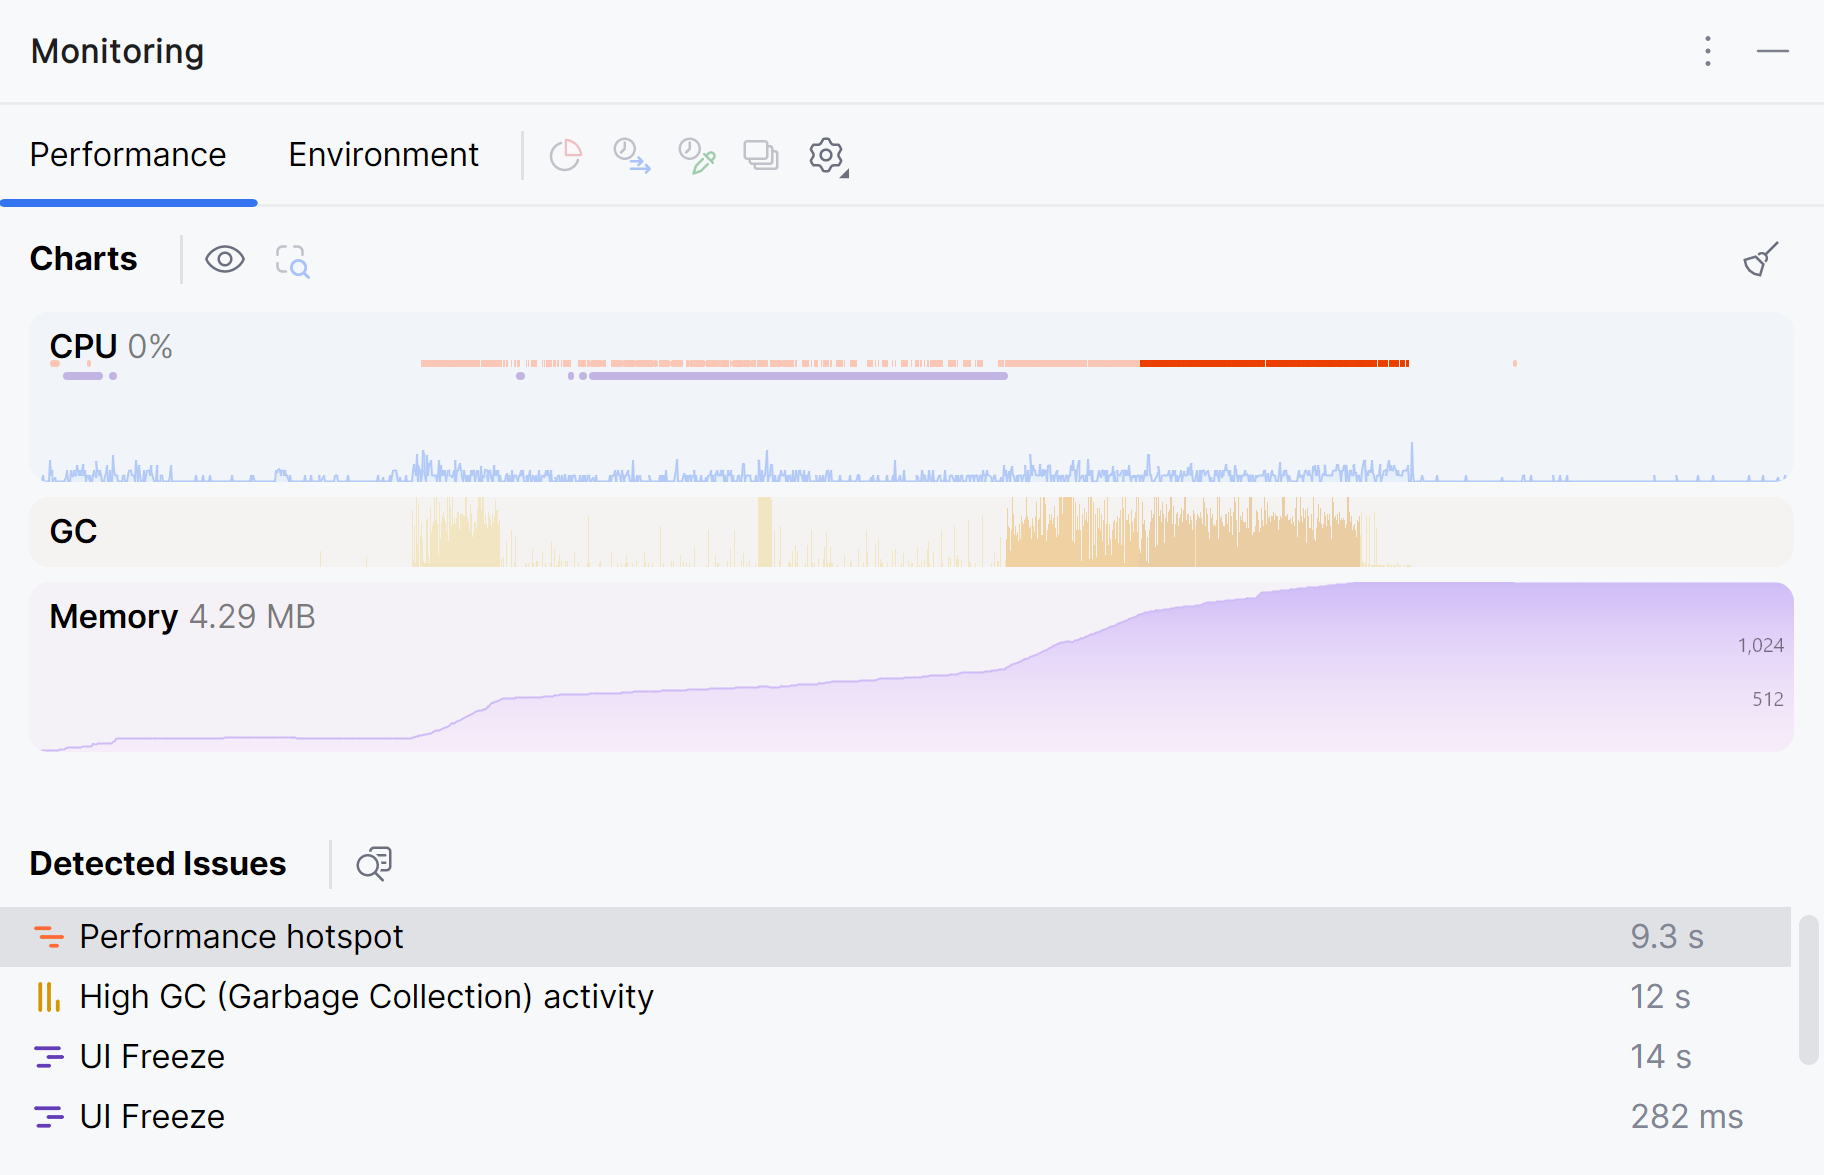
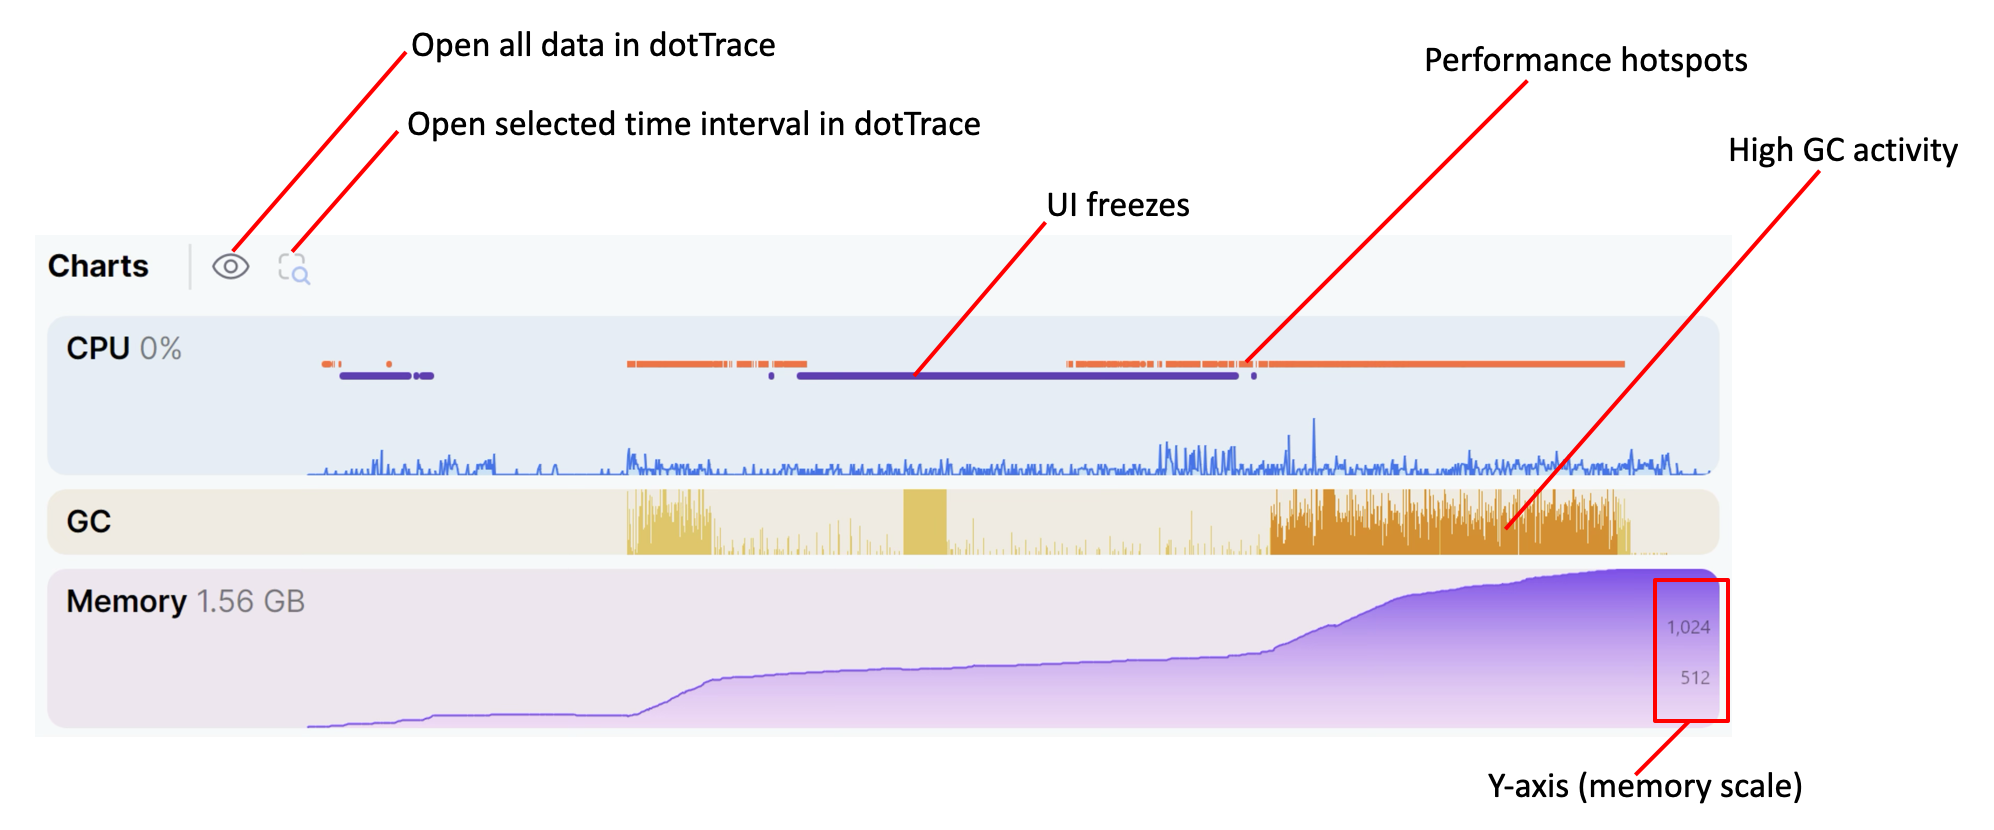
The Charts tab displays the CPU and memory usage of your application. If you hover over a chart, you can see detailed information about the data points.
The CPU chart shows the CPU usage of your application and time intervals where the UI freeze and Performance hotspot issues were detected.
The GC chart shows the garbage collection (GC) events in your application and time intervals where the High GC activity issue was detected.
The Memory chart shows the memory usage of your application.
- How memory usage is calculated
The Memory chart shows your process's private memory – memory committed for this process only and not shared with others.
Windows: The chart shows the process's Commit Charge value. It includes private pages (even if they are swapped out) and excludes pages shared with other processes, so it can be higher or lower than the "resident/working set" shown by other tools. The chart uses GetProcessMemoryInfo to get
PROCESS_MEMORY_COUNTERS_EX.PrivateUsage.Linux: The chart sums
Private_CleanandPrivate_Dirtyfrom /proc/<pid>/smaps_rollup (or from /proc/<pid>/smaps if the rollup file is unavailable).macOS: The chart adds resident private bytes and swapped-out private bytes by iterating the process's memory regions (similar to what the vmmap tool reports).
Because different tools visualize different metrics (private memory vs. resident/working set), it's normal if numbers don't match exactly across tools.
Detected Issues

On Windows, the monitoring tool can automatically detect the following issues in your application:
Performance hotspot – a time interval where one or more user methods consumed a significant portion of total execution time.
UI freeze – a time interval where the UI was unresponsive. This can happen if the application doesn't pump window messages for more than 200 ms or if processing a window message takes more than 200 ms.
High GC activity – a time interval where more than 30% of the total execution time was spent on garbage collection. This can indicate memory pressure or excessive memory allocation in your application.
You can analyze the detected issues in detail using the integrated dotTrace Profiler (see below). If you want to disable automatic detection of particular issue types, you can do this in .
Background profiling (Windows)
On Windows, JetBrains Rider uses ETW CPU sampling to collect detailed performance data in the background during run or debug sessions. This process is similar to dotTrace's timeline profiling, but runs automatically and with minimal overhead. The collected data includes:
Stack traces with method execution times
Timeline of method activity
Runtime events like allocations or garbage collection
Background profiling typically causes only a 1–2% impact on application performance. In edge cases, the overhead may reach up to 10%. If you experience performance degradation, you can disable the ETW CPU sampling checkbox in .
You can analyze the performance data using the integrated dotTrace Profiler (see below). Note that analyzing the data requires a dotUltimate license.
The Detected Issues panel (e.g., Performance hotspot, UI Freeze) is powered by this background profiling data as well.
Analyze an issue
You can analyze the detected issues in detail using the integrated dotTrace Profiler (dotUltimate license required).
Double-click an issue in the list or right-click it and select Analyze issue.
The corresponding time range will open in the dotTrace tool window showing the call tree and event data. Learn how to analyze the data using dotTrace
Analyze a time interval
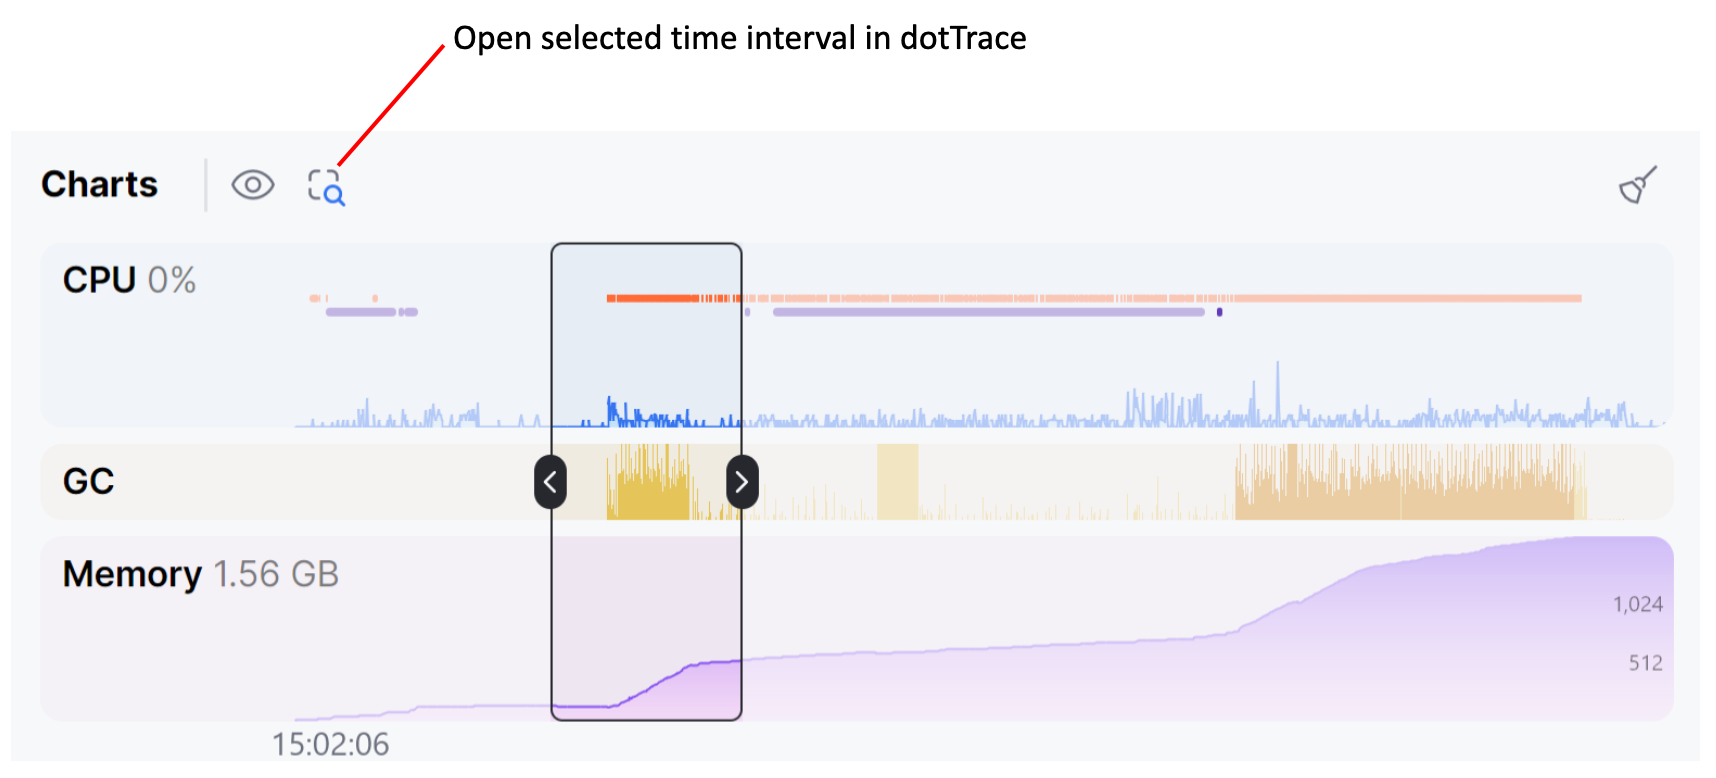
You can select and analyze any time interval from the charts.
Click the chart and select the time interval you want to analyze.
Click the
 Analyze selected time range button on top of the Charts tab.
The corresponding time range will open in the dotTrace tool window showing the call tree and event data. Learn how to analyze the data using dotTrace

Analyze full time range
You can analyze all performance data collected during the run or debug session.
Click the
 Analyze full time range button on top of the Charts tab.
The dotTrace tool window will open showing the call tree and event data for the entire run or debug session. Learn how to analyze the data using dotTrace
Counters tab
The Counters tab displays counters and their values for all enabled counter and metric providers.
Counters
.NET counters are one of the ways to get performance data on your application. Most of the .NET system assemblies provide their own set of counters. For example, the base
System.Runtimeassembly includes such counters as CPU and memory usage, the number of garbage collections in particular heaps, lock contention count, thread pool queue length, and more.Microsoft.AspNetCore.Hostingprovides counters that can be helpful for monitoring server applications: request rate, number of failed requests, and so on. Moreover, your application can provide its own custom counters with the help of EventCounters.Metrics
Metrics is a more modern way to collect application data that supports various third-party providers like OpenTelemetry. .NET assemblies also provide their own set of metrics. For example,
Microsoft.AspNetCore.Hostingprovides metrics for request duration and current number of active requests. As well as counters, your application can provide its own custom metrics.
To add or remove providers, go to and configure the list of providers in Counter providers or Metric providers. When adding a provider:
To add all counters/metrics from a provider, specify its name, e.g.,
MyProviderTo add specific counters/metrics from a provider, specify the provider and the counter/metric names in the following format:
ProviderName[CounterName1,CounterName2]. For example,OpenTelemetry.Instrumentation.Runtime[process.runtime.dotnet.gc.collections]
To define how often the counter and metric values must be updated (in seconds), use the Refresh interval parameter in .
Environment tab
The Environment tab displays environment variables and system properties of your application.
Monitoring modes
By default, monitoring starts automatically when you run or debug your project. You can change this behavior with the Enable Monitoring selector in the Monitoring tool window settings:
On debug or run – monitoring starts automatically when you run or debug your project.
On debug – monitoring starts automatically only when you debug your project.
Never – monitoring is disabled.
Get profiling data
Sometimes, data collected by the monitoring tool is not enough to analyze the performance of your application. For a more detailed analysis, you can get profiling data (e.g., start a performance profiling session or get a memory snapshot) right from the Monitoring window's toolbar:
 Collect stack trace – get a stack trace of the application. The stack trace will be automatically opened in the Stack Trace Explorer. This might be helpful, for example, when you encounter unexpected UI freezes and want to investigate potential thread locks.
 Get memory snapshot – instantly get a memory snapshot of your application. Once the snapshot is collected, it will be opened in the dotMemory Profiler tool window.
 Start sampling profiling |
  Start timeline profiling – start a performance profiling session using the timeline or sampling profiling type. To stop recording the profiling data and save a performance snapshot, click the
  button. The collected snapshots will be opened in the dotTrace Profiler tool window.