Download as PDF, PPTX


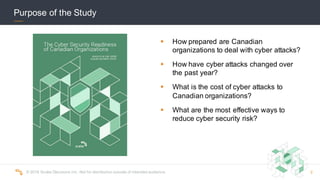
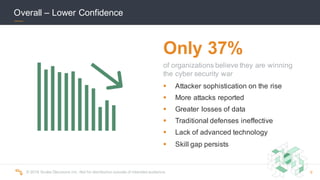
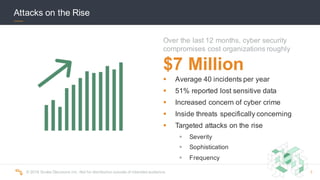


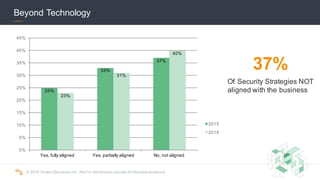
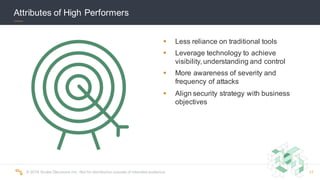
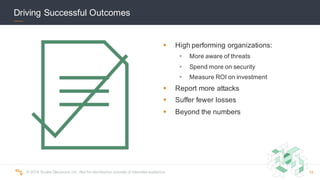
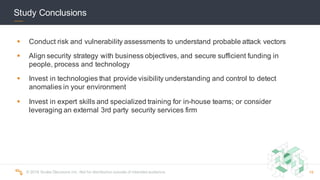


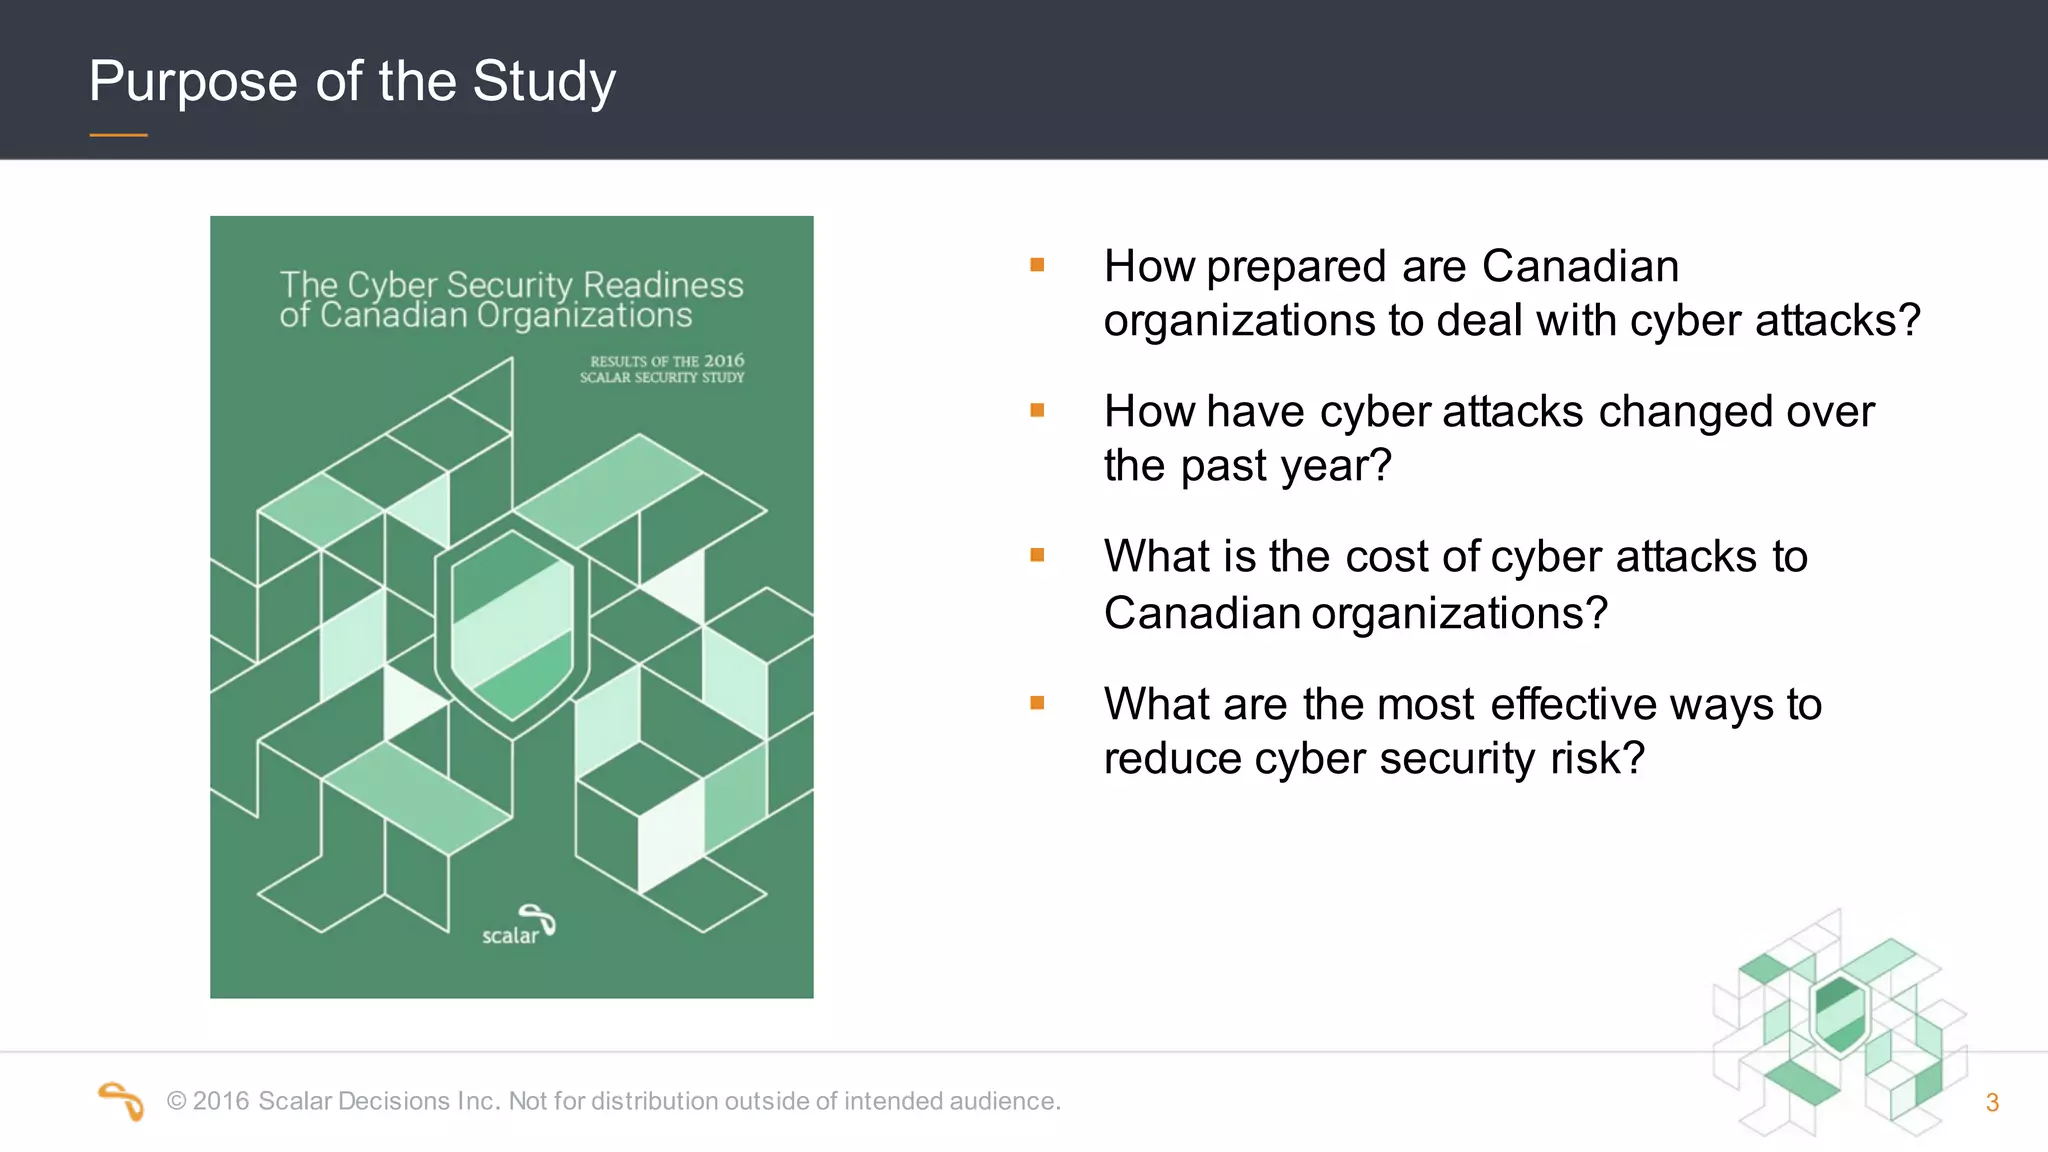
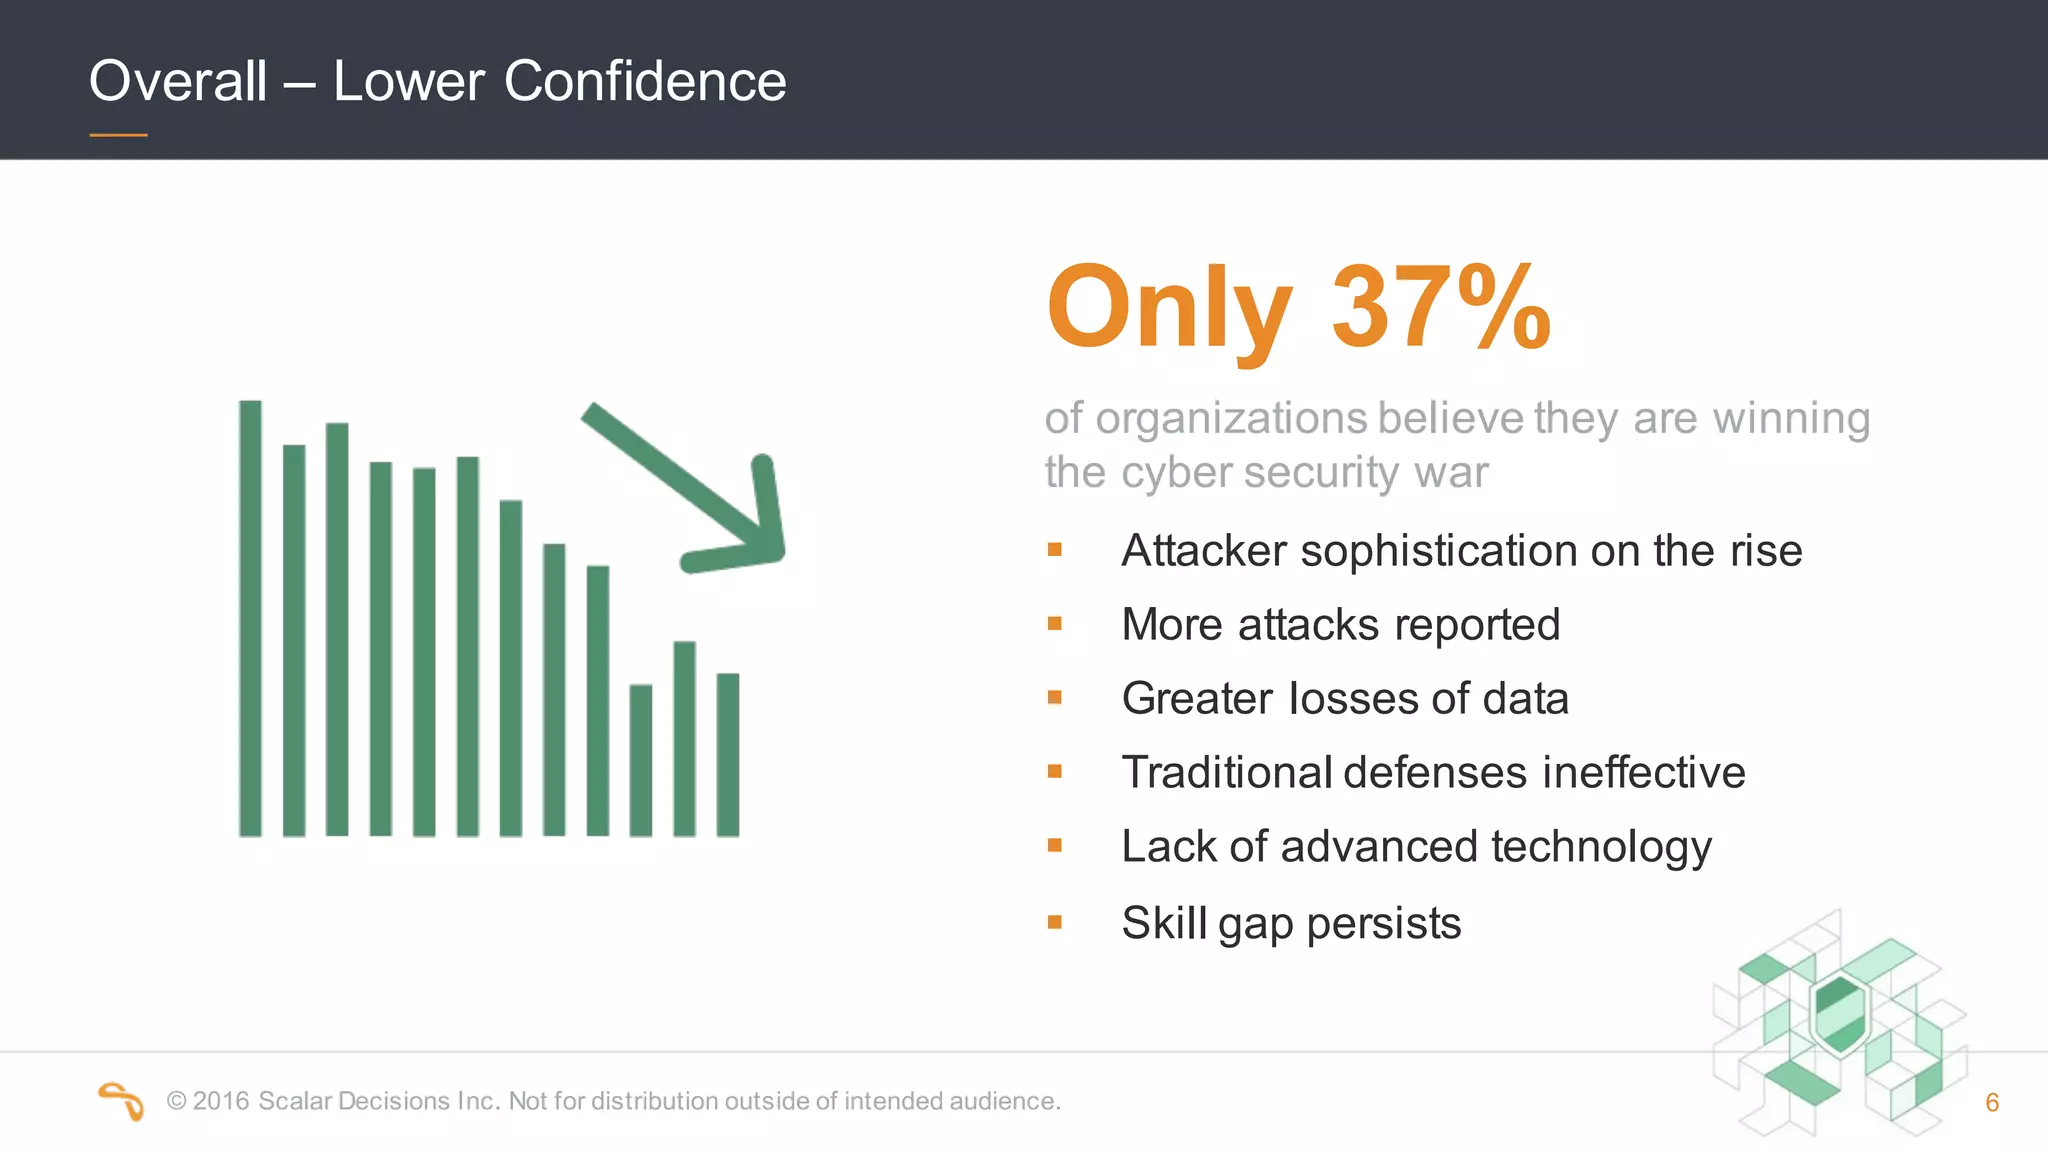
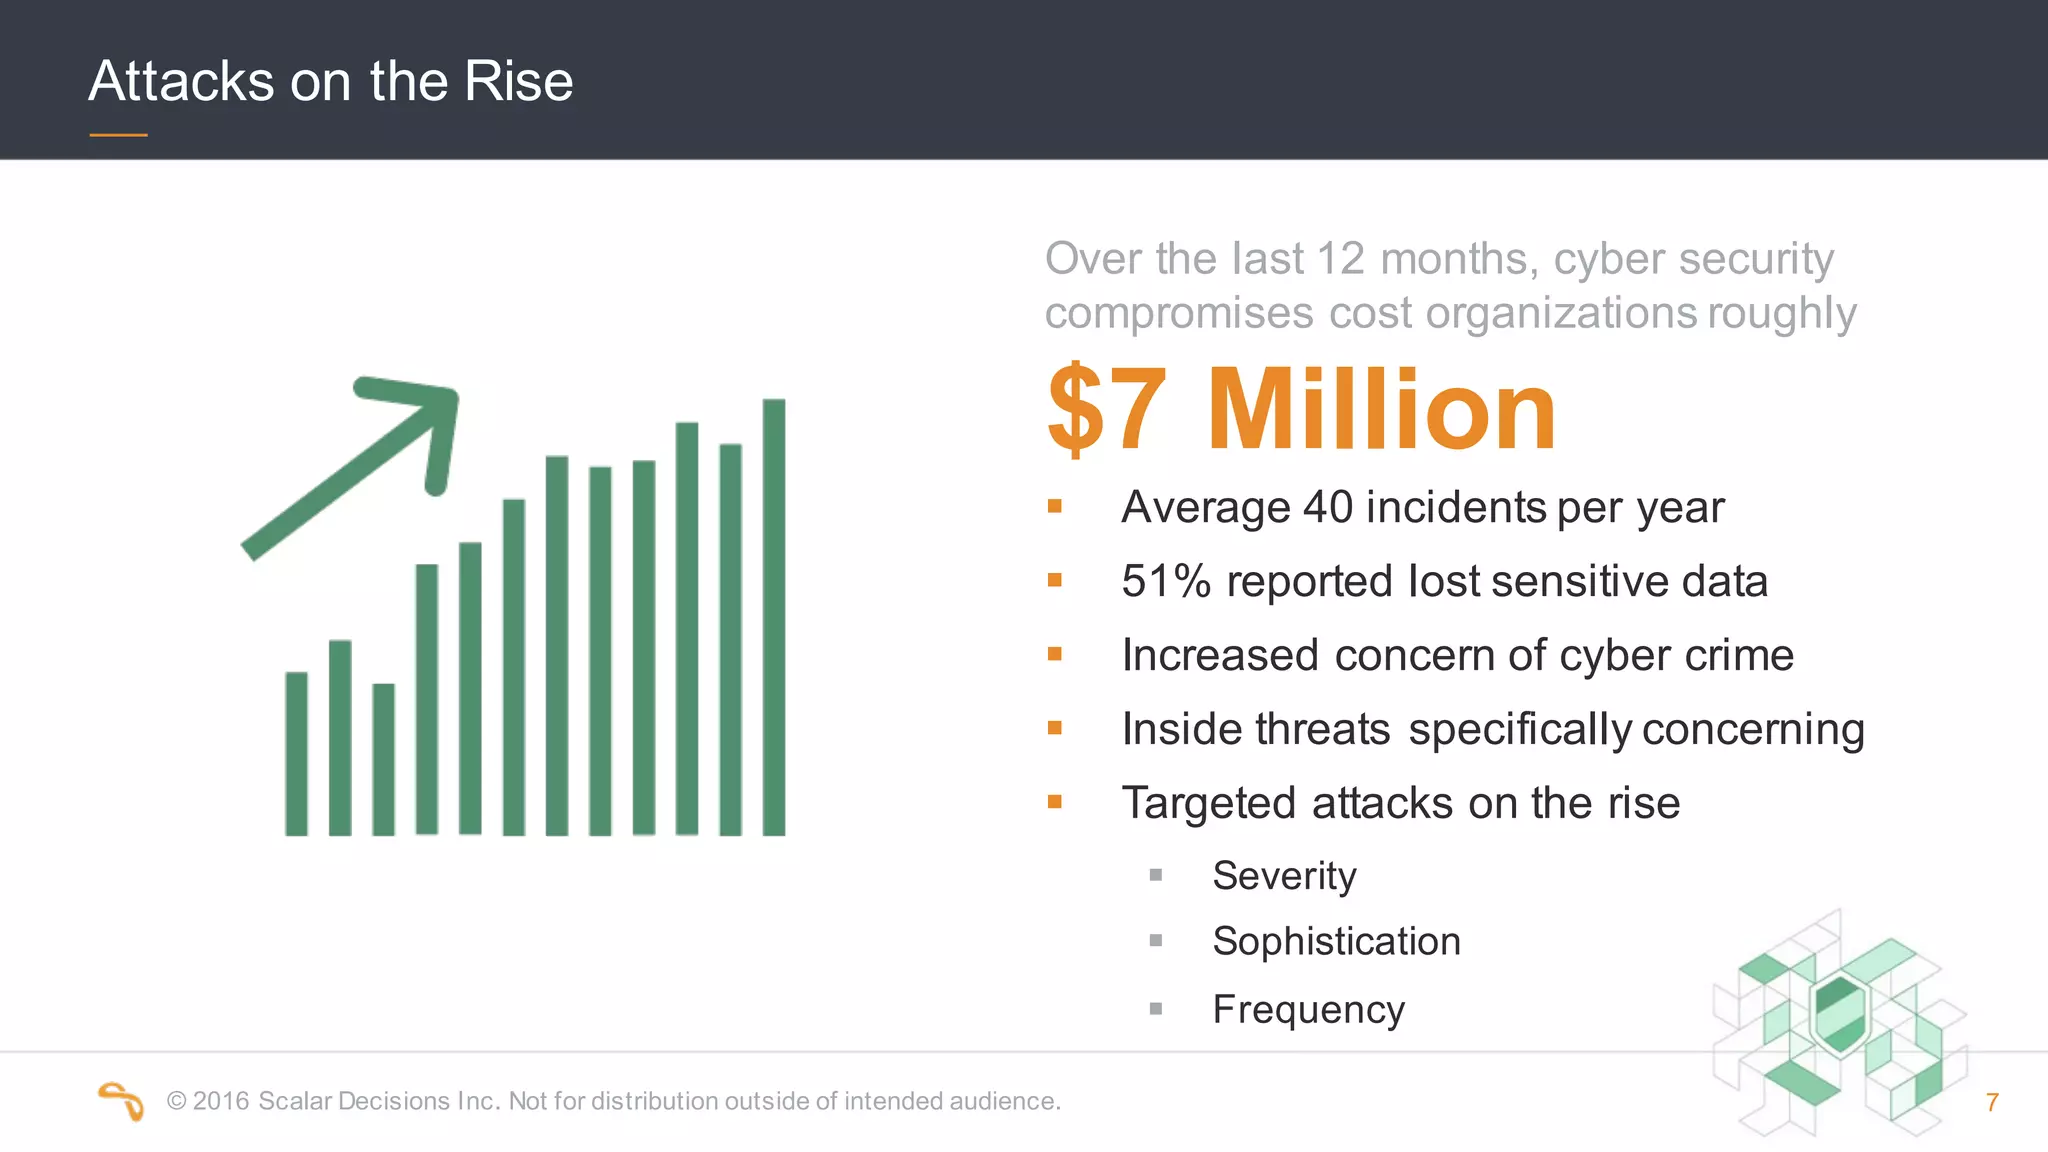
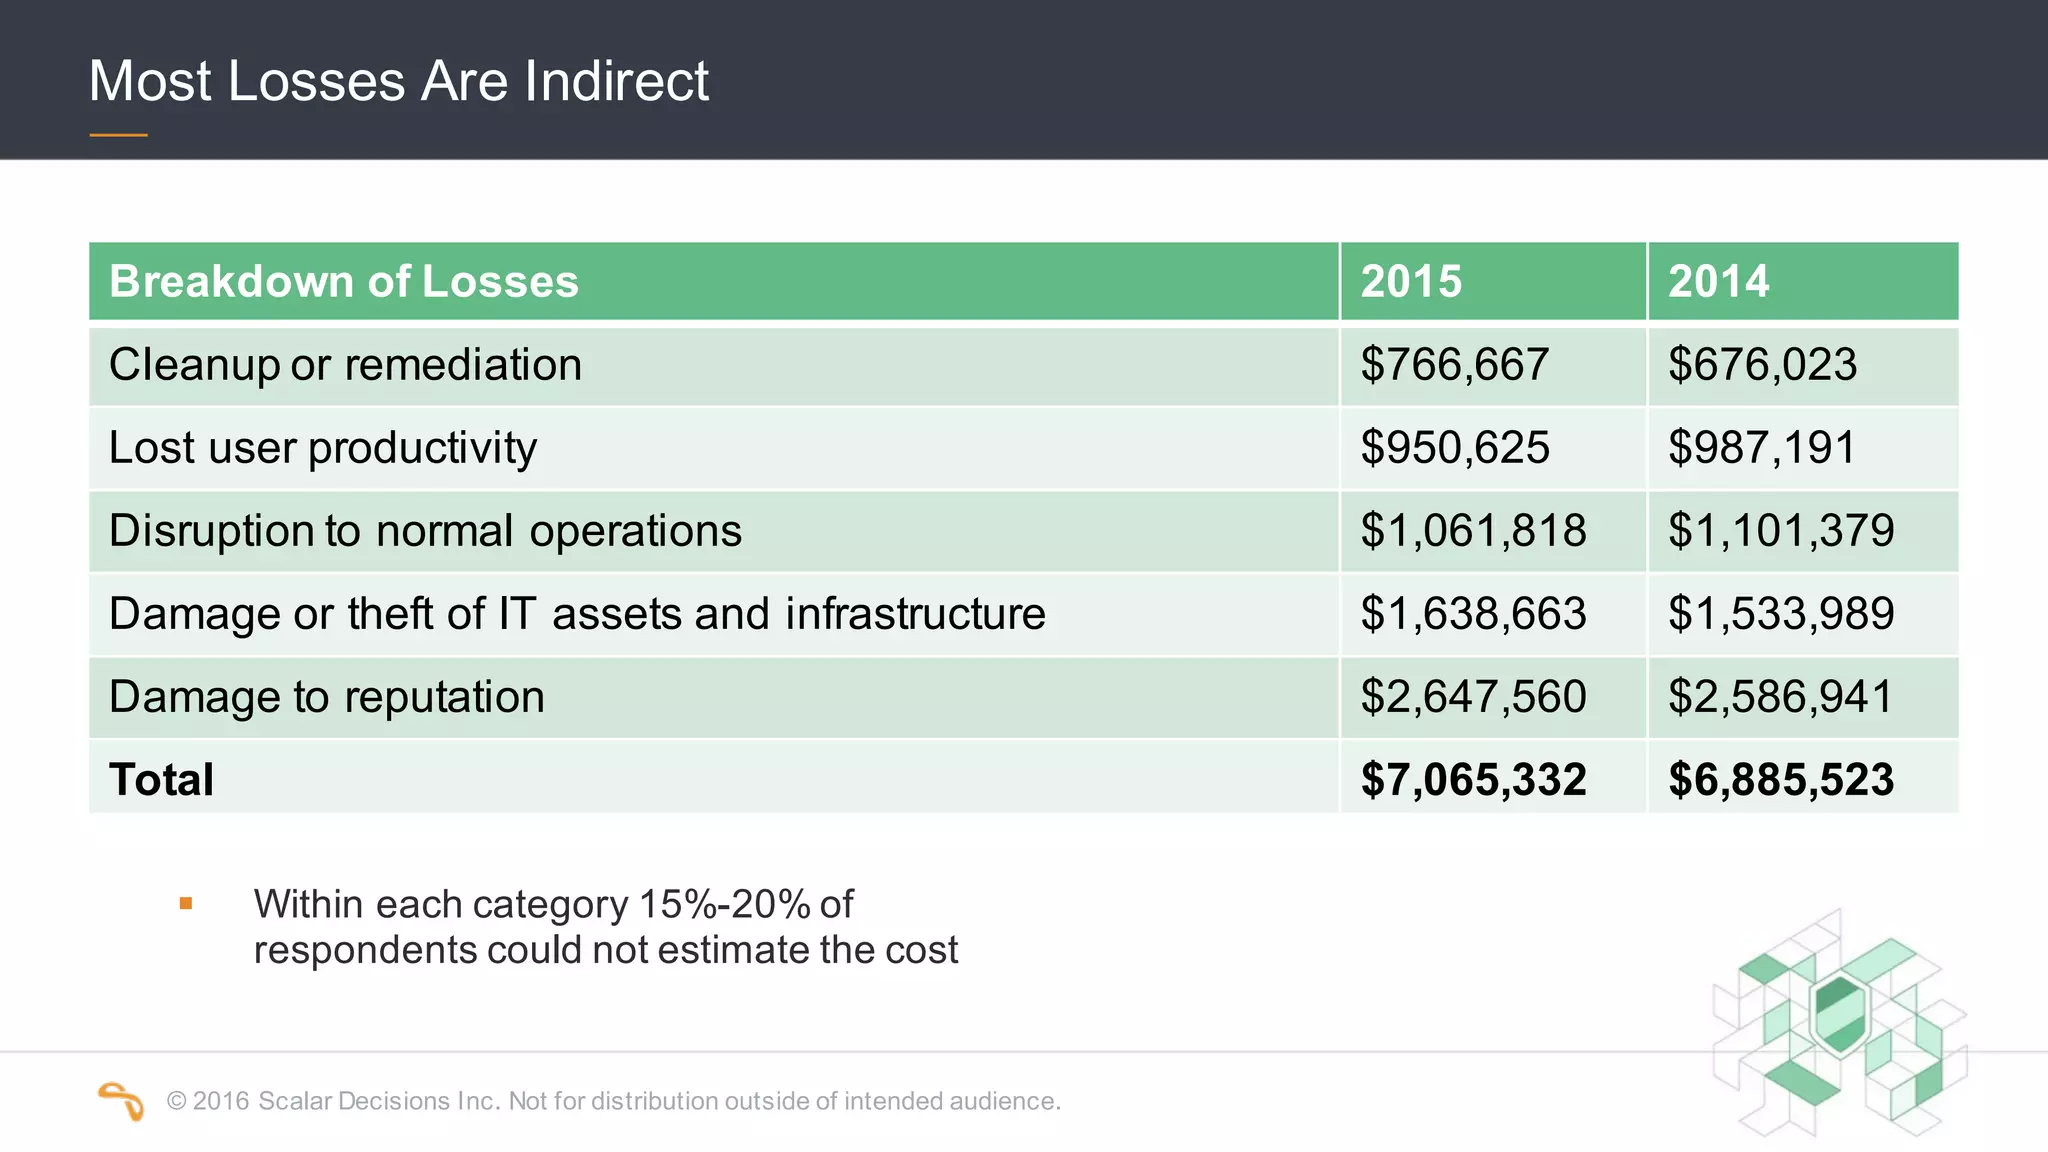

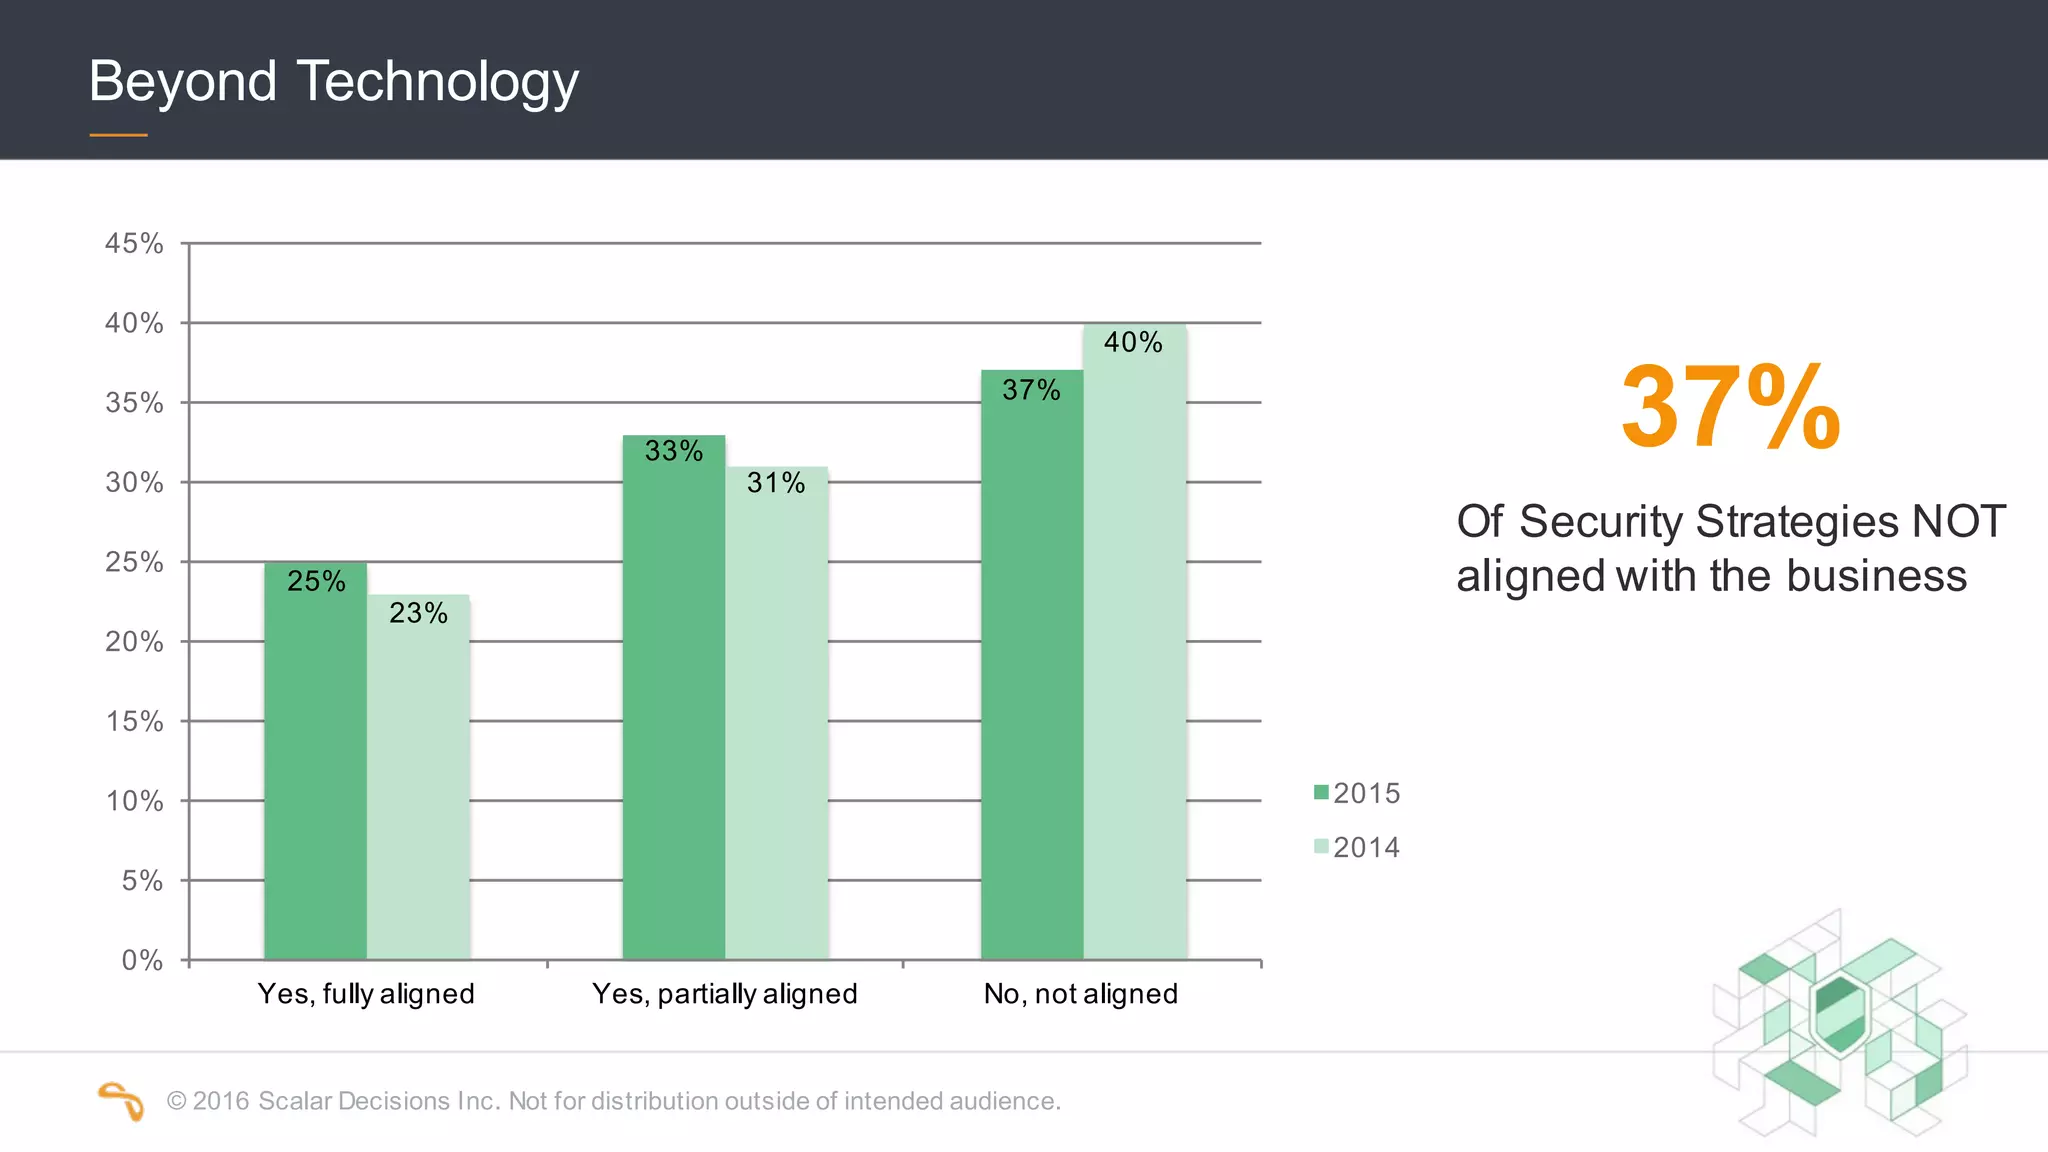


The 2016 Scalar Security Study reports that Canadian organizations face increasing challenges from cyber attacks, with only 37% feeling effective in their defenses. The study highlights significant costs from these attacks, averaging $7 million annually, and emphasizes the importance of aligning security strategies with business objectives. Recommendations include investing in advanced technology and expertise to enhance security measures.


![Scalar security study2017_slideshare_rev[1]](https://cdn.slidesharecdn.com/ss_thumbnails/scalarsecuritystudy2017slidesharerev1-170628170828-thumbnail.jpg?width=600ounds&width=560&fit=bounds)


![[Challenge:Future] Rallying Youth Against Cyber Crime](https://cdn.slidesharecdn.com/ss_thumbnails/challengefuture-rallying-youth-against-cyber-crime760-111125224621-phpapp02-thumbnail.jpg?width=600ounds&width=560&fit=bounds)


