Downloaded 37 times
![9
Copyright © 2010, SAS Institute Inc. All rights reserved.
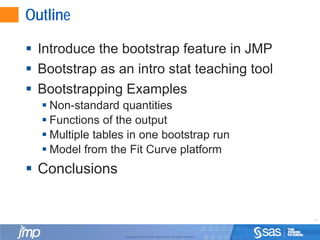
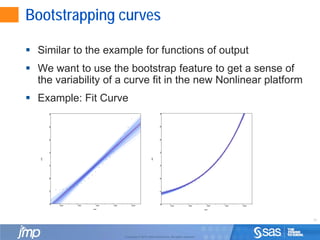
Multiple tables at one time
“Trick” to use JSL to select multiple tables in a report
and bootstrap them
Can also be accomplished by setting a random seed prior to
each separate bootstrap analysis for multiple tables in a report
Example: Fixed scale parameter in lifetime data
rpt["Parametric Estimate - Normal"][NumberColBox("Estimate")] << select;
rpt["Fix Parameter"]["Parametric Estimate - Normal"][NumberColBox("Estimate")] << select;
dtlst = rpt["Parametric Estimate - Normal"][NumberColBox("Estimate")] << Bootstrap(100);](https://image.slidesharecdn.com/jmpadvancedusecasesbootstrap-140324130549-phpapp01/85/Advanced-Use-Cases-of-the-Bootstrap-Method-in-JMP-Pro-9-320.jpg)


![9
Copyright © 2010, SAS Institute Inc. All rights reserved.
Multiple tables at one time
“Trick” to use JSL to select multiple tables in a report
and bootstrap them
Can also be accomplished by setting a random seed prior to
each separate bootstrap analysis for multiple tables in a report
Example: Fixed scale parameter in lifetime data
rpt["Parametric Estimate - Normal"][NumberColBox("Estimate")] << select;
rpt["Fix Parameter"]["Parametric Estimate - Normal"][NumberColBox("Estimate")] << select;
dtlst = rpt["Parametric Estimate - Normal"][NumberColBox("Estimate")] << Bootstrap(100);](https://image.slidesharecdn.com/jmpadvancedusecasesbootstrap-140324130549-phpapp01/75/Advanced-Use-Cases-of-the-Bootstrap-Method-in-JMP-Pro-9-2048.jpg)
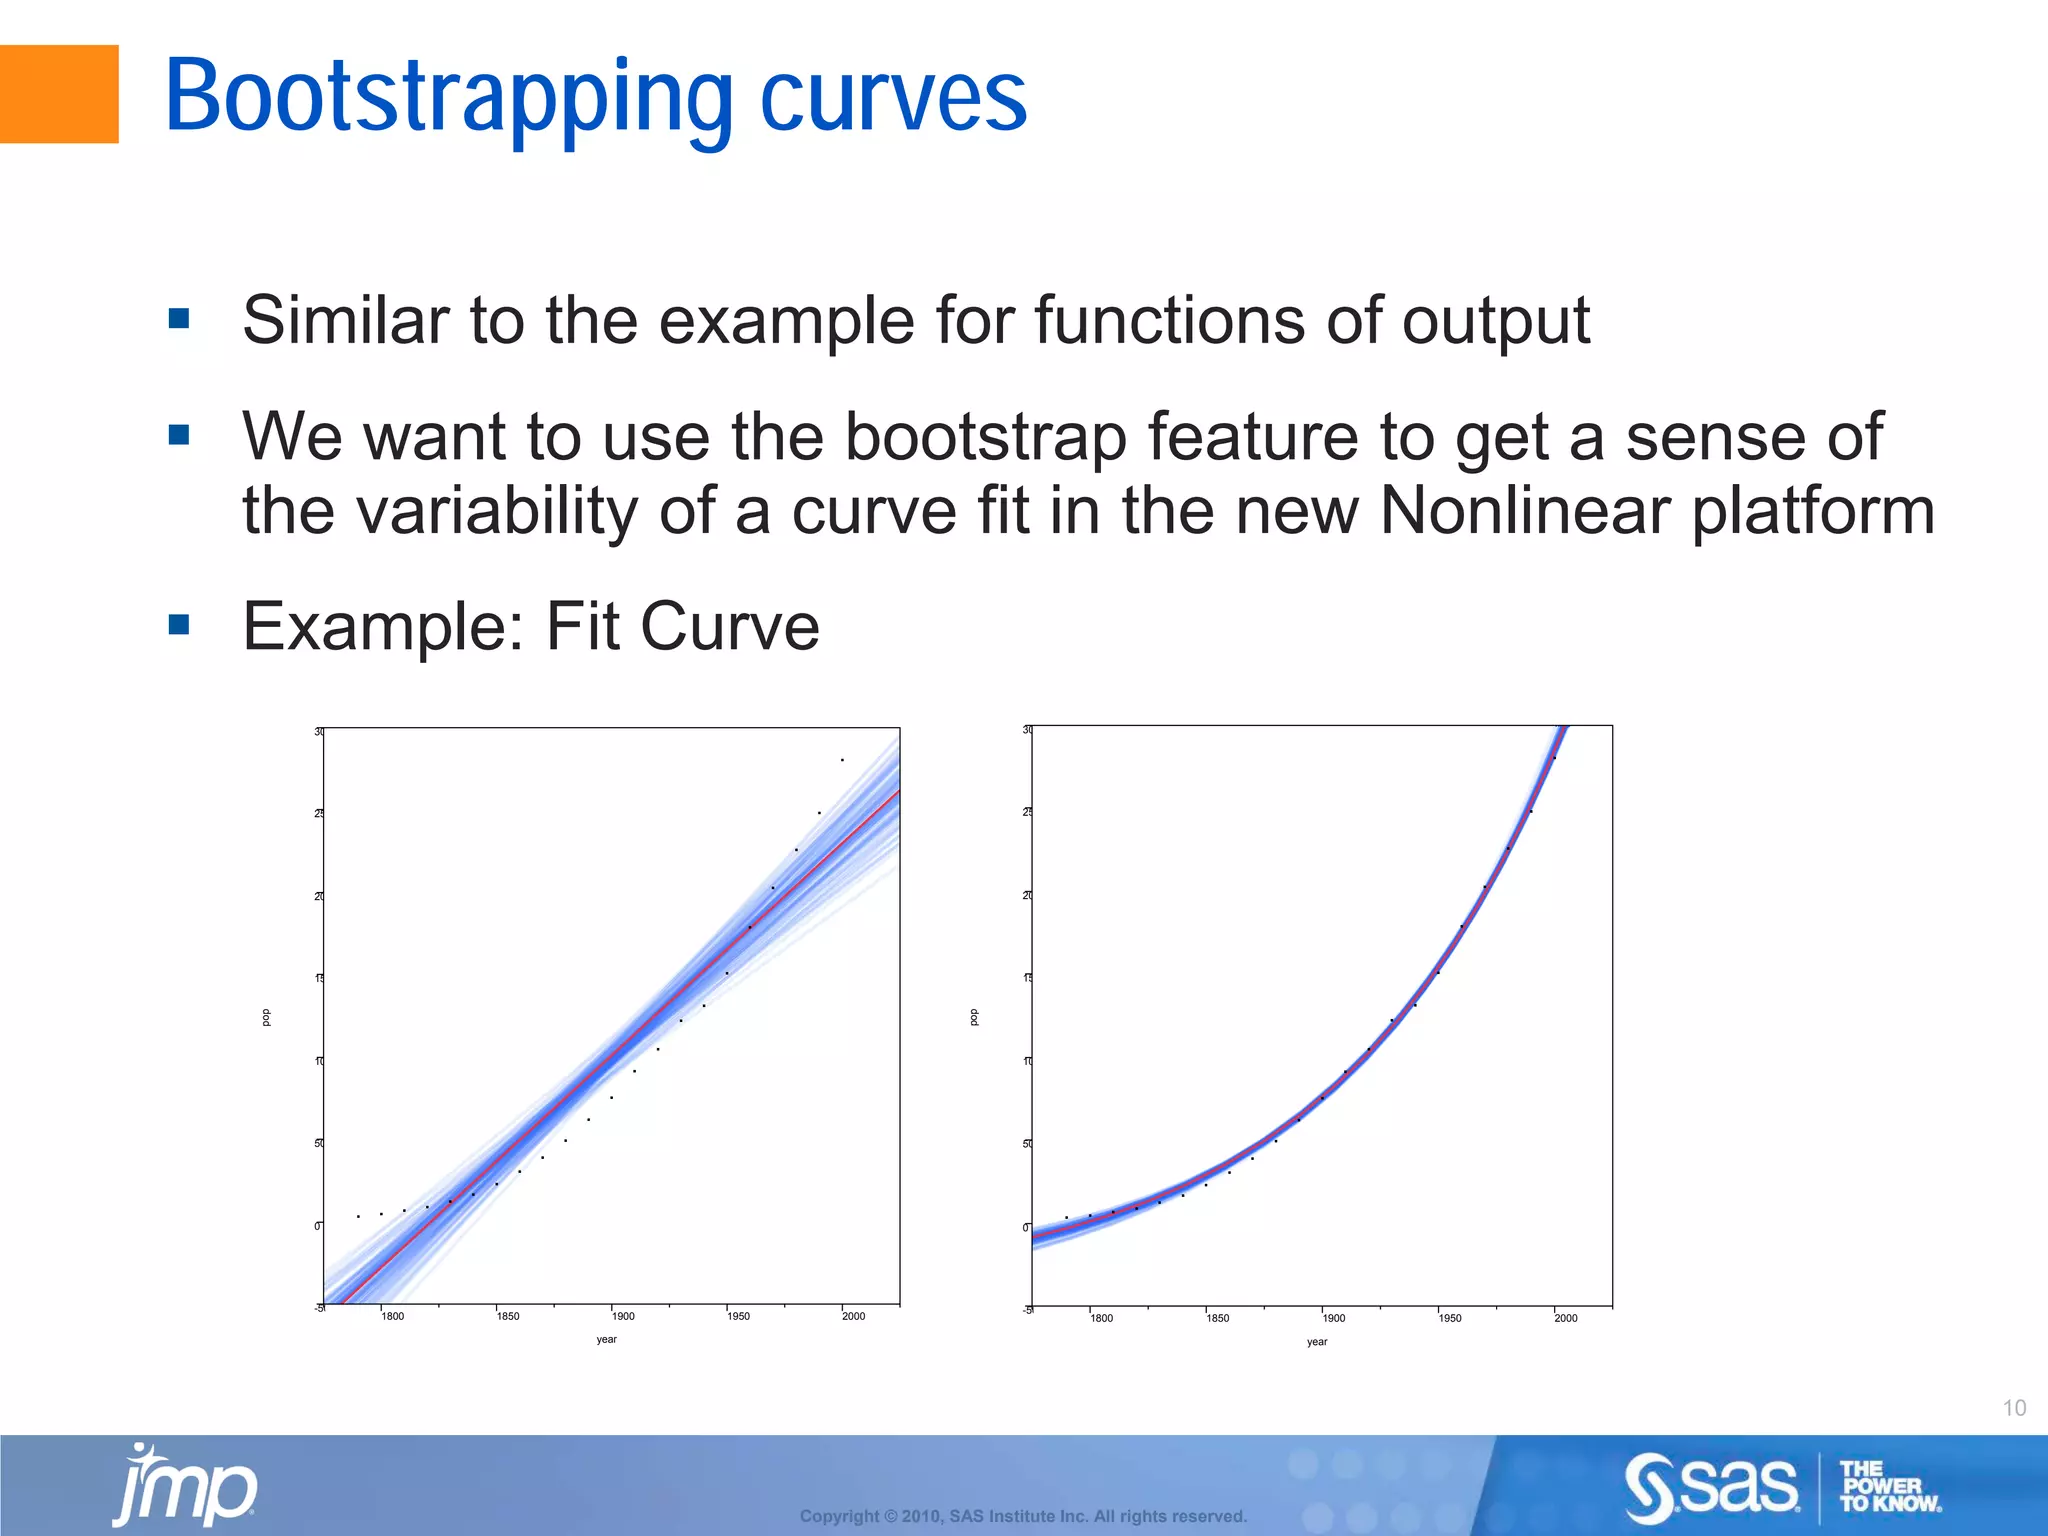


The document discusses the bootstrap feature in JMP Pro, introduced by Brad Efron in 1979, highlighting its use for estimating variances of statistics through resampling techniques. It includes examples of non-standard applications, educational benefits for introductory statistics courses, and methods for utilizing bootstrap samples effectively within the software. The aim is to inspire users to explore and share their unique applications of the bootstrap feature.


![Webquest on output_devices[1]](https://cdn.slidesharecdn.com/ss_thumbnails/webquestonoutputdevices1-131209224232-phpapp01-thumbnail.jpg?width=600ounds&width=560&fit=bounds)


