Download as PDF, PPTX


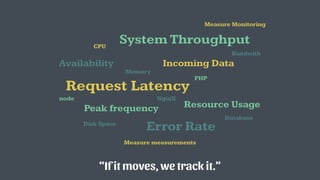


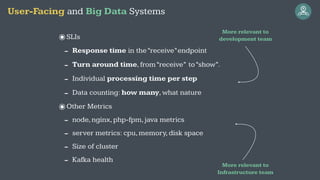


![<?php
use PrometheusCounter;
use PrometheusHistogram;
use PrometheusStorageAPC;
require_once 'vendor/autoload.php';
$adapter = new APC();
$histogram = new Histogram(
$adapter,
'my_app',
'response_time_ms',
'This measures ....',
['status', 'url'],
[0, 10, 50, 100]
);
$histogram->observe(15, ['200', '/url']);
$counter = new Counter($adapter, 'my_app', 'count_total',
'How many...', ['status', 'url']);
$counter->inc(['200', '/url']);
$counter->incBy(5, ['200', '/url']);](https://image.slidesharecdn.com/applicationmetrics-phpsrb19-190525132042/85/Application-Metrics-with-Prometheus-examples-71-320.jpg)
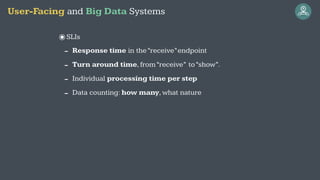
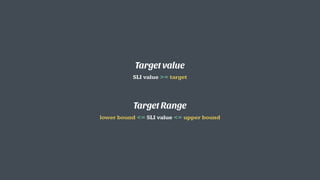
![<?php
use PrometheusCounter;
use PrometheusHistogram;
use PrometheusStorageAPC;
require_once 'vendor/autoload.php';
$adapter = new APC();
$histogram = new Histogram(
$adapter,
'my_app',
'response_time_ms',
'This measures ....',
['status', 'url'],
[0, 10, 50, 100]
);
$histogram->observe(15, ['200', '/url']);
$counter = new Counter($adapter, 'my_app', 'count_total',
'How many...', ['status', 'url']);
$counter->inc(['200', '/url']);
$counter->incBy(5, ['200', '/url']);](https://image.slidesharecdn.com/applicationmetrics-phpsrb19-190525132042/85/Application-Metrics-with-Prometheus-examples-72-320.jpg)
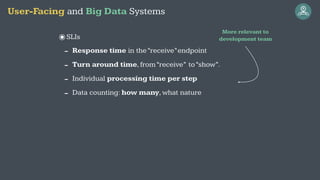
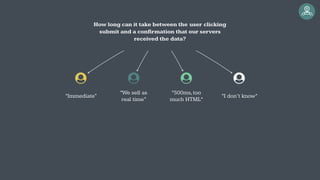
![<?php
use PrometheusCounter;
use PrometheusHistogram;
use PrometheusStorageAPC;
require_once 'vendor/autoload.php';
$adapter = new APC();
$histogram = new Histogram(
$adapter,
'my_app',
'response_time_ms',
'This measures ....',
['status', 'url'],
[0, 10, 50, 100]
);
$histogram->observe(15, ['200', '/url']);
$counter = new Counter($adapter, 'my_app', 'count_total',
'How many...', ['status', 'url']);
$counter->inc(['200', '/url']);
$counter->incBy(5, ['200', '/url']);
APC / APCu
Redis](https://image.slidesharecdn.com/applicationmetrics-phpsrb19-190525132042/85/Application-Metrics-with-Prometheus-examples-73-320.jpg)
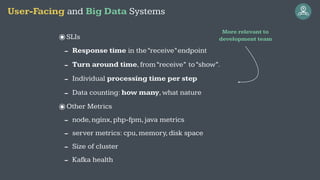
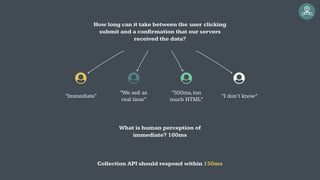
![<?php
use PrometheusCounter;
use PrometheusHistogram;
use PrometheusStorageAPC;
require_once 'vendor/autoload.php';
$adapter = new APC();
$histogram = new Histogram(
$adapter,
'my_app',
'response_time_ms',
'This measures ....',
['status', 'url'],
[0, 10, 50, 100]
);
$histogram->observe(15, ['200', '/url']);
$counter = new Counter($adapter, 'my_app', 'count_total',
'How many...', ['status', 'url']);
$counter->inc(['200', '/url']);
$counter->incBy(5, ['200', '/url']);
namespace
metric name
help
label names
buckets](https://image.slidesharecdn.com/applicationmetrics-phpsrb19-190525132042/85/Application-Metrics-with-Prometheus-examples-74-320.jpg)
![<?php
use PrometheusCounter;
use PrometheusHistogram;
use PrometheusStorageAPC;
require_once 'vendor/autoload.php';
$adapter = new APC();
$histogram = new Histogram(
$adapter,
'my_app',
'response_time_ms',
'This measures ....',
['status', 'url'],
[0, 10, 50, 100]
);
$histogram->observe(15, ['200', '/url']);
$counter = new Counter($adapter, 'my_app', 'count_total',
'How many...', ['status', 'url']);
$counter->inc(['200', '/url']);
$counter->incBy(5, ['200', '/url']);
measurement
label values](https://image.slidesharecdn.com/applicationmetrics-phpsrb19-190525132042/85/Application-Metrics-with-Prometheus-examples-75-320.jpg)
![<?php
use PrometheusCounter;
use PrometheusHistogram;
use PrometheusStorageAPC;
require_once 'vendor/autoload.php';
$adapter = new APC();
$histogram = new Histogram(
$adapter,
'my_app',
'response_time_ms',
'This measures ....',
['status', 'url'],
[0, 10, 50, 100]
);
$histogram->observe(15, ['200', '/url']);
$counter = new Counter($adapter, 'my_app', 'count_total',
'How many...', ['status', 'url']);
$counter->inc(['200', '/url']);
$counter->incBy(5, ['200', '/url']);
namespace
metric name
help
labels](https://image.slidesharecdn.com/applicationmetrics-phpsrb19-190525132042/85/Application-Metrics-with-Prometheus-examples-76-320.jpg)
![<?php
use PrometheusCounter;
use PrometheusHistogram;
use PrometheusStorageAPC;
require_once 'vendor/autoload.php';
$adapter = new APC();
$histogram = new Histogram(
$adapter,
'my_app',
'response_time_ms',
'This measures ....',
['status', 'url'],
[0, 10, 50, 100]
);
$histogram->observe(15, ['200', '/url']);
$counter = new Counter($adapter, 'my_app', 'count_total',
'How many...', ['status', 'url']);
$counter->inc(['200', '/url']);
$counter->incBy(5, ['200', '/url']);](https://image.slidesharecdn.com/applicationmetrics-phpsrb19-190525132042/85/Application-Metrics-with-Prometheus-examples-77-320.jpg)
![<?php
use PrometheusCounter;
use PrometheusHistogram;
use PrometheusStorageAPC;
require_once 'vendor/autoload.php';
$adapter = new APC();
$histogram = new Histogram(
$adapter,
'my_app',
'response_time_ms',
'This measures ....',
['status', 'url'],
[0, 10, 50, 100]
);
$histogram->observe(15, ['200', '/url']);
$counter = new Counter($adapter, 'my_app', 'count_total',
'How many...', ['status', 'url']);
$counter->inc(['200', '/url']);
$counter->incBy(5, ['200', '/url']);](https://image.slidesharecdn.com/applicationmetrics-phpsrb19-190525132042/85/Application-Metrics-with-Prometheus-examples-78-320.jpg)


![<?php
use PrometheusCounter;
use PrometheusHistogram;
use PrometheusStorageAPC;
require_once 'vendor/autoload.php';
$adapter = new APC();
$histogram = new Histogram(
$adapter,
'my_app',
'response_time_ms',
'This measures ....',
['status', 'url'],
[0, 10, 50, 100]
);
$histogram->observe(15, ['200', '/url']);
$counter = new Counter($adapter, 'my_app', 'count_total',
'How many...', ['status', 'url']);
$counter->inc(['200', '/url']);
$counter->incBy(5, ['200', '/url']);](https://image.slidesharecdn.com/applicationmetrics-phpsrb19-190525132042/75/Application-Metrics-with-Prometheus-examples-71-2048.jpg)
![<?php
use PrometheusCounter;
use PrometheusHistogram;
use PrometheusStorageAPC;
require_once 'vendor/autoload.php';
$adapter = new APC();
$histogram = new Histogram(
$adapter,
'my_app',
'response_time_ms',
'This measures ....',
['status', 'url'],
[0, 10, 50, 100]
);
$histogram->observe(15, ['200', '/url']);
$counter = new Counter($adapter, 'my_app', 'count_total',
'How many...', ['status', 'url']);
$counter->inc(['200', '/url']);
$counter->incBy(5, ['200', '/url']);](https://image.slidesharecdn.com/applicationmetrics-phpsrb19-190525132042/75/Application-Metrics-with-Prometheus-examples-72-2048.jpg)
![<?php
use PrometheusCounter;
use PrometheusHistogram;
use PrometheusStorageAPC;
require_once 'vendor/autoload.php';
$adapter = new APC();
$histogram = new Histogram(
$adapter,
'my_app',
'response_time_ms',
'This measures ....',
['status', 'url'],
[0, 10, 50, 100]
);
$histogram->observe(15, ['200', '/url']);
$counter = new Counter($adapter, 'my_app', 'count_total',
'How many...', ['status', 'url']);
$counter->inc(['200', '/url']);
$counter->incBy(5, ['200', '/url']);
APC / APCu
Redis](https://image.slidesharecdn.com/applicationmetrics-phpsrb19-190525132042/75/Application-Metrics-with-Prometheus-examples-73-2048.jpg)
![<?php
use PrometheusCounter;
use PrometheusHistogram;
use PrometheusStorageAPC;
require_once 'vendor/autoload.php';
$adapter = new APC();
$histogram = new Histogram(
$adapter,
'my_app',
'response_time_ms',
'This measures ....',
['status', 'url'],
[0, 10, 50, 100]
);
$histogram->observe(15, ['200', '/url']);
$counter = new Counter($adapter, 'my_app', 'count_total',
'How many...', ['status', 'url']);
$counter->inc(['200', '/url']);
$counter->incBy(5, ['200', '/url']);
namespace
metric name
help
label names
buckets](https://image.slidesharecdn.com/applicationmetrics-phpsrb19-190525132042/75/Application-Metrics-with-Prometheus-examples-74-2048.jpg)
![<?php
use PrometheusCounter;
use PrometheusHistogram;
use PrometheusStorageAPC;
require_once 'vendor/autoload.php';
$adapter = new APC();
$histogram = new Histogram(
$adapter,
'my_app',
'response_time_ms',
'This measures ....',
['status', 'url'],
[0, 10, 50, 100]
);
$histogram->observe(15, ['200', '/url']);
$counter = new Counter($adapter, 'my_app', 'count_total',
'How many...', ['status', 'url']);
$counter->inc(['200', '/url']);
$counter->incBy(5, ['200', '/url']);
measurement
label values](https://image.slidesharecdn.com/applicationmetrics-phpsrb19-190525132042/75/Application-Metrics-with-Prometheus-examples-75-2048.jpg)
![<?php
use PrometheusCounter;
use PrometheusHistogram;
use PrometheusStorageAPC;
require_once 'vendor/autoload.php';
$adapter = new APC();
$histogram = new Histogram(
$adapter,
'my_app',
'response_time_ms',
'This measures ....',
['status', 'url'],
[0, 10, 50, 100]
);
$histogram->observe(15, ['200', '/url']);
$counter = new Counter($adapter, 'my_app', 'count_total',
'How many...', ['status', 'url']);
$counter->inc(['200', '/url']);
$counter->incBy(5, ['200', '/url']);
namespace
metric name
help
labels](https://image.slidesharecdn.com/applicationmetrics-phpsrb19-190525132042/75/Application-Metrics-with-Prometheus-examples-76-2048.jpg)
![<?php
use PrometheusCounter;
use PrometheusHistogram;
use PrometheusStorageAPC;
require_once 'vendor/autoload.php';
$adapter = new APC();
$histogram = new Histogram(
$adapter,
'my_app',
'response_time_ms',
'This measures ....',
['status', 'url'],
[0, 10, 50, 100]
);
$histogram->observe(15, ['200', '/url']);
$counter = new Counter($adapter, 'my_app', 'count_total',
'How many...', ['status', 'url']);
$counter->inc(['200', '/url']);
$counter->incBy(5, ['200', '/url']);](https://image.slidesharecdn.com/applicationmetrics-phpsrb19-190525132042/75/Application-Metrics-with-Prometheus-examples-77-2048.jpg)
![<?php
use PrometheusCounter;
use PrometheusHistogram;
use PrometheusStorageAPC;
require_once 'vendor/autoload.php';
$adapter = new APC();
$histogram = new Histogram(
$adapter,
'my_app',
'response_time_ms',
'This measures ....',
['status', 'url'],
[0, 10, 50, 100]
);
$histogram->observe(15, ['200', '/url']);
$counter = new Counter($adapter, 'my_app', 'count_total',
'How many...', ['status', 'url']);
$counter->inc(['200', '/url']);
$counter->incBy(5, ['200', '/url']);](https://image.slidesharecdn.com/applicationmetrics-phpsrb19-190525132042/75/Application-Metrics-with-Prometheus-examples-78-2048.jpg)


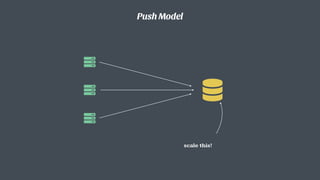
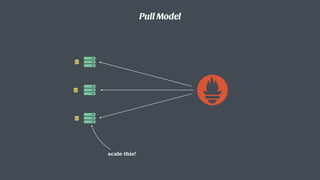
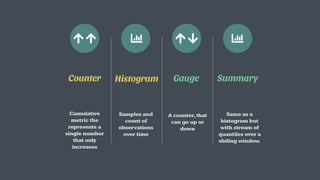
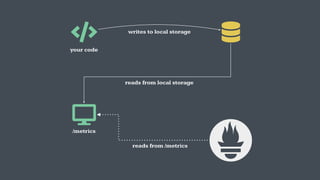
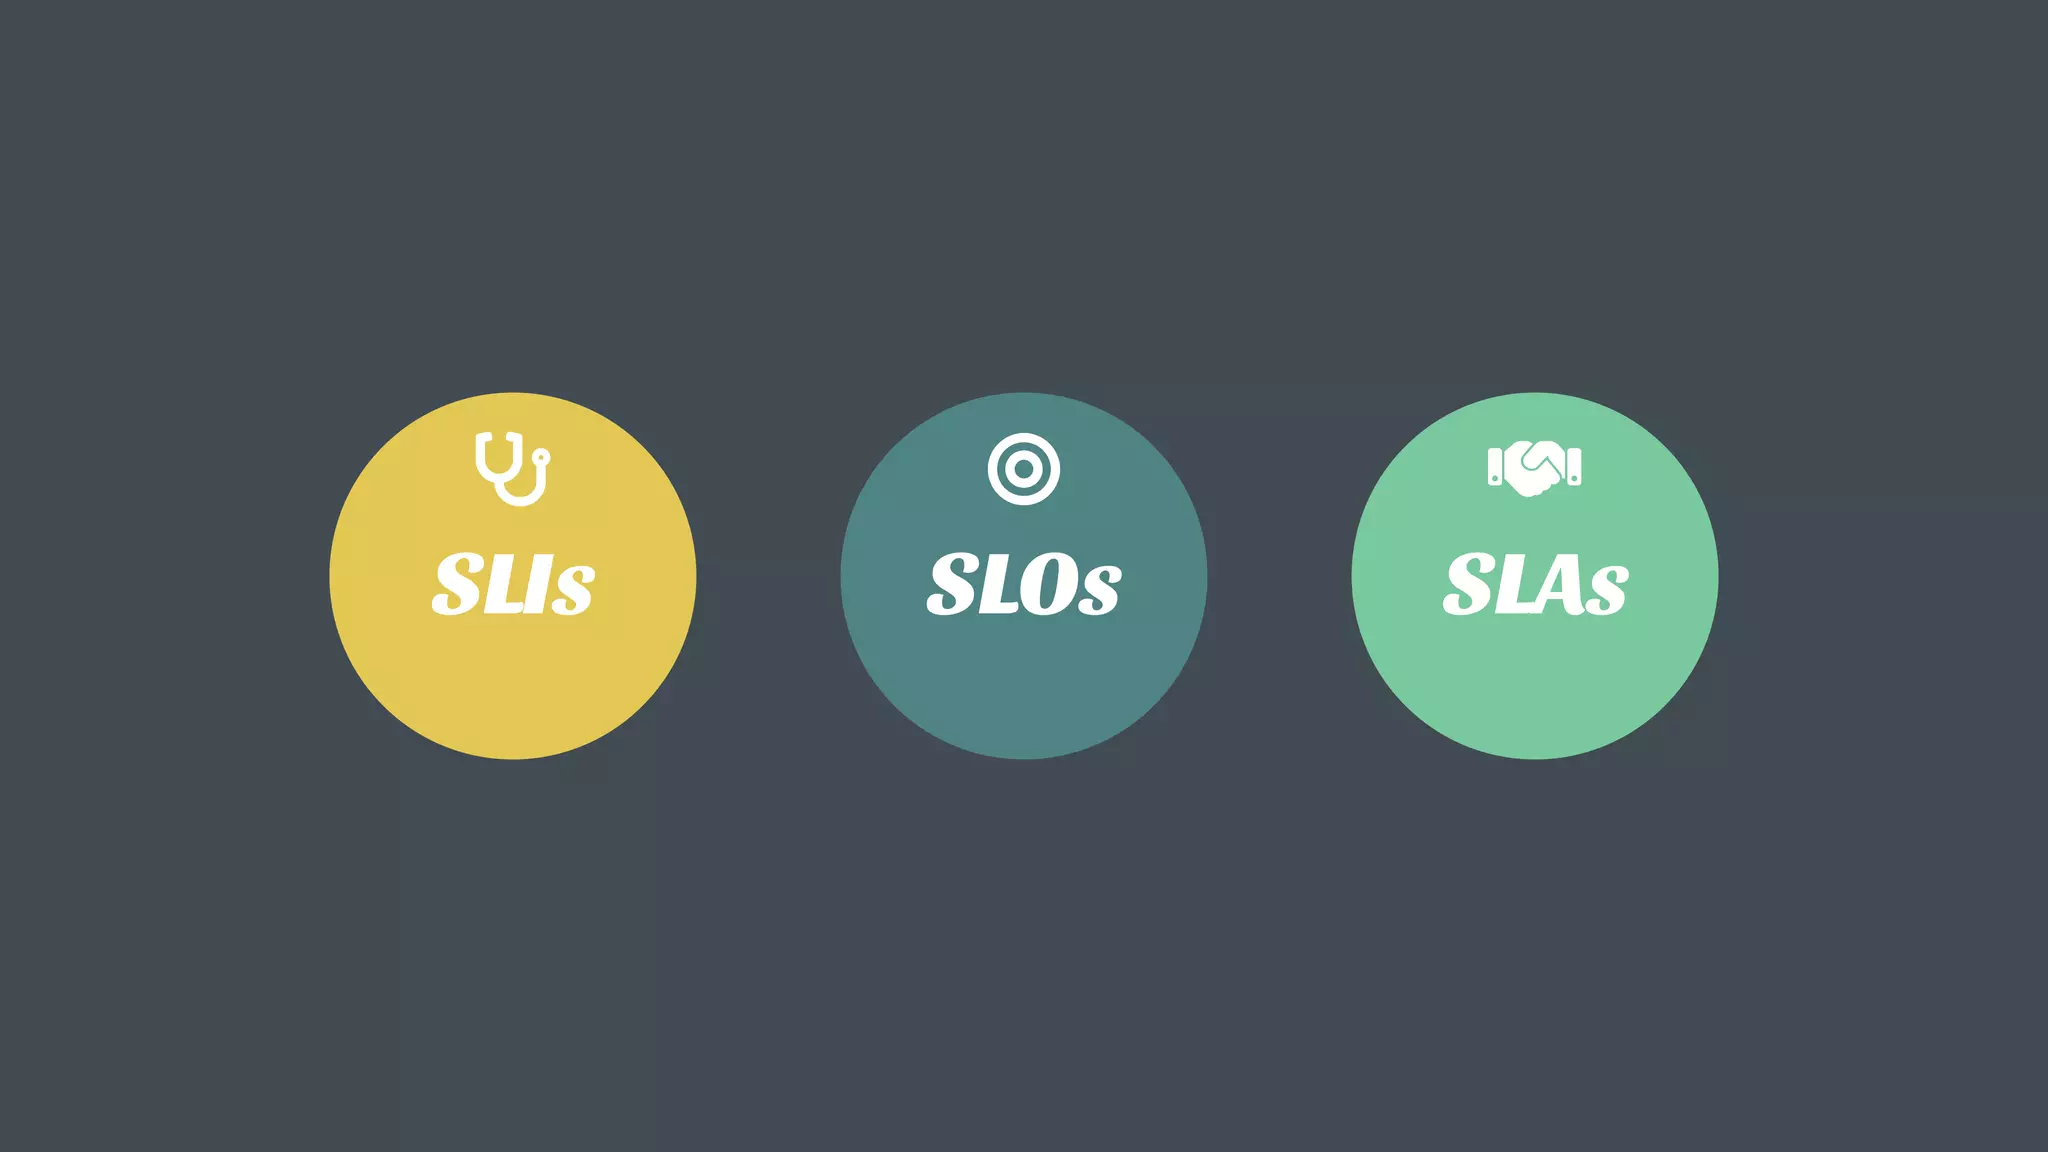
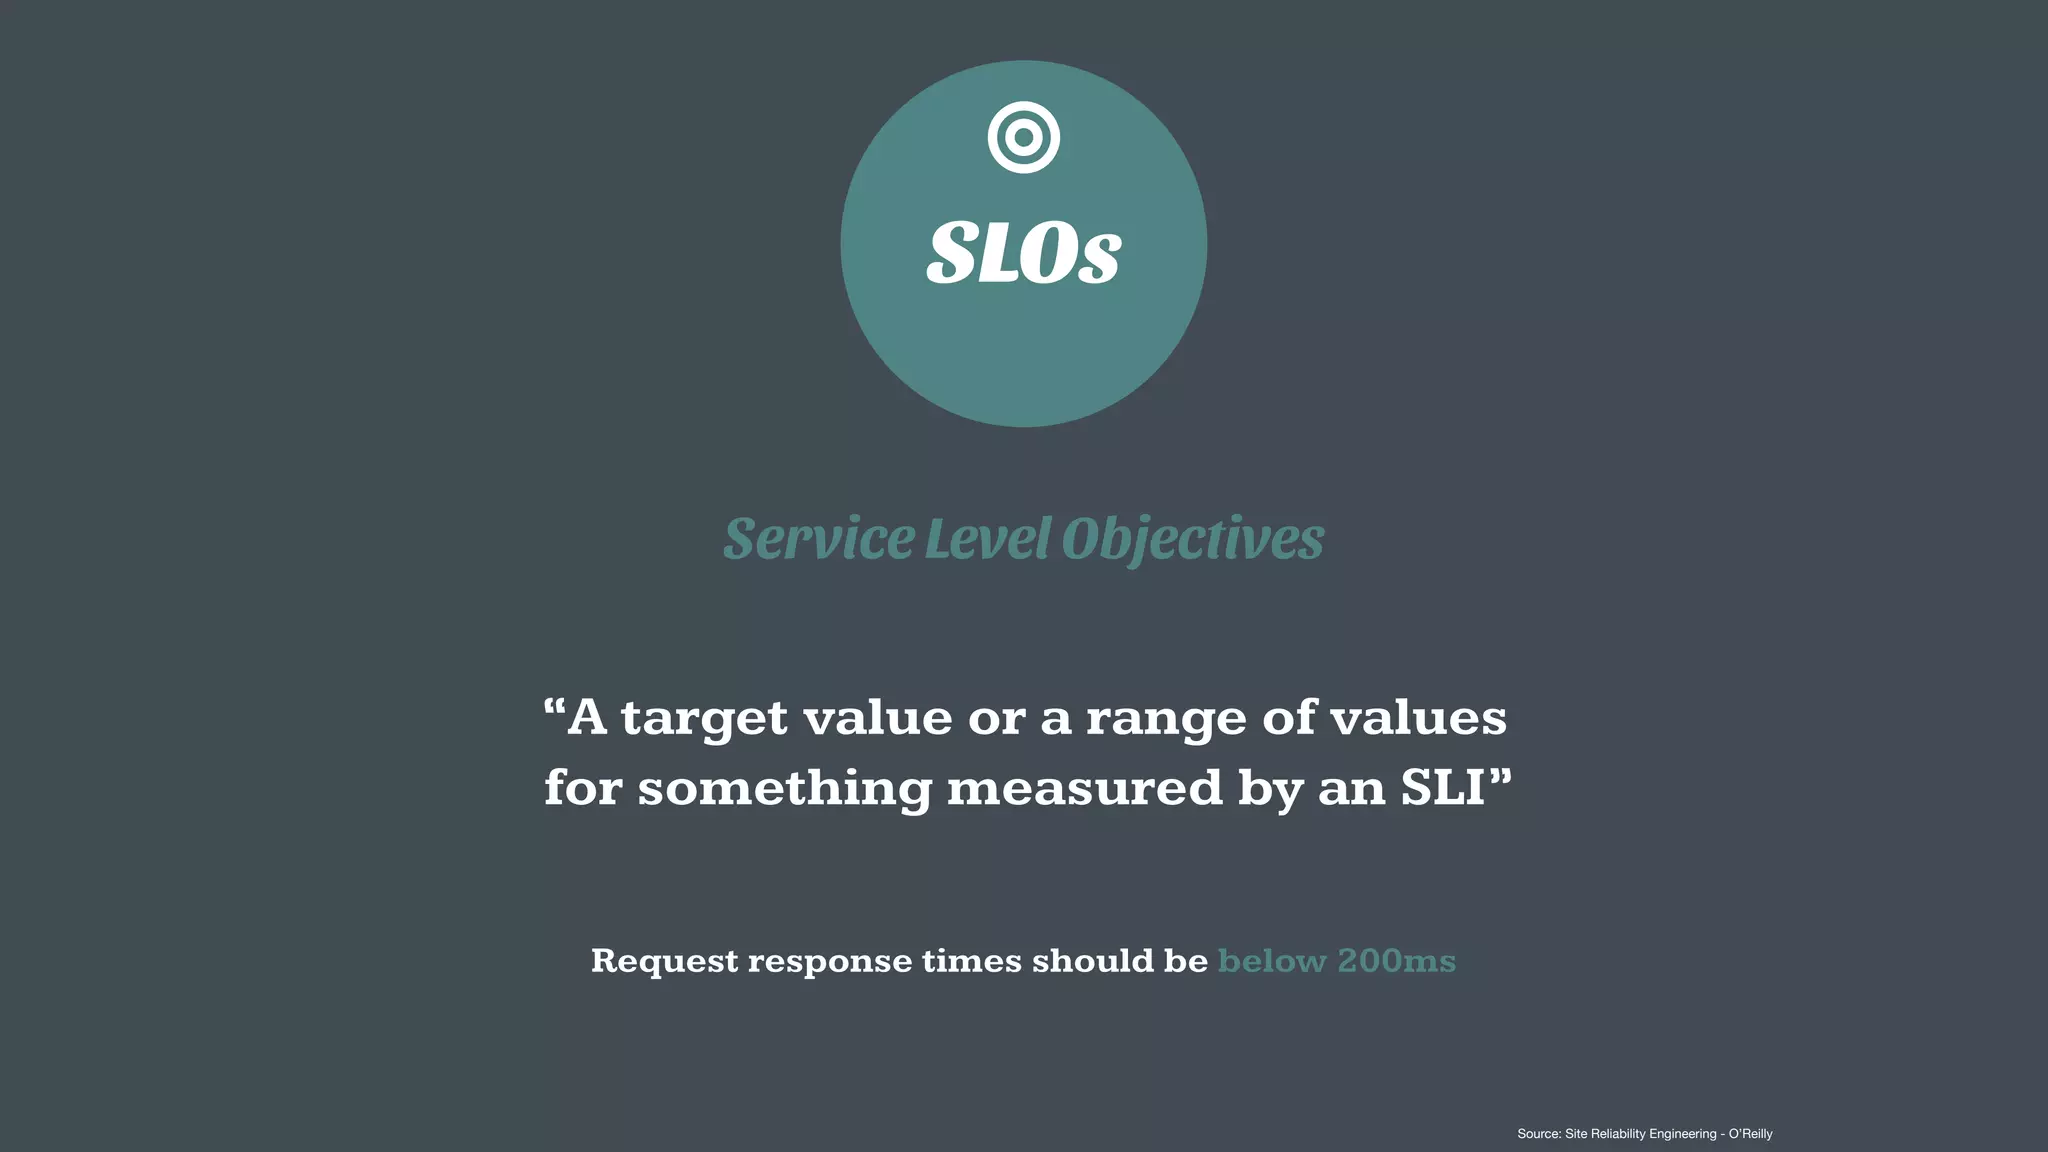
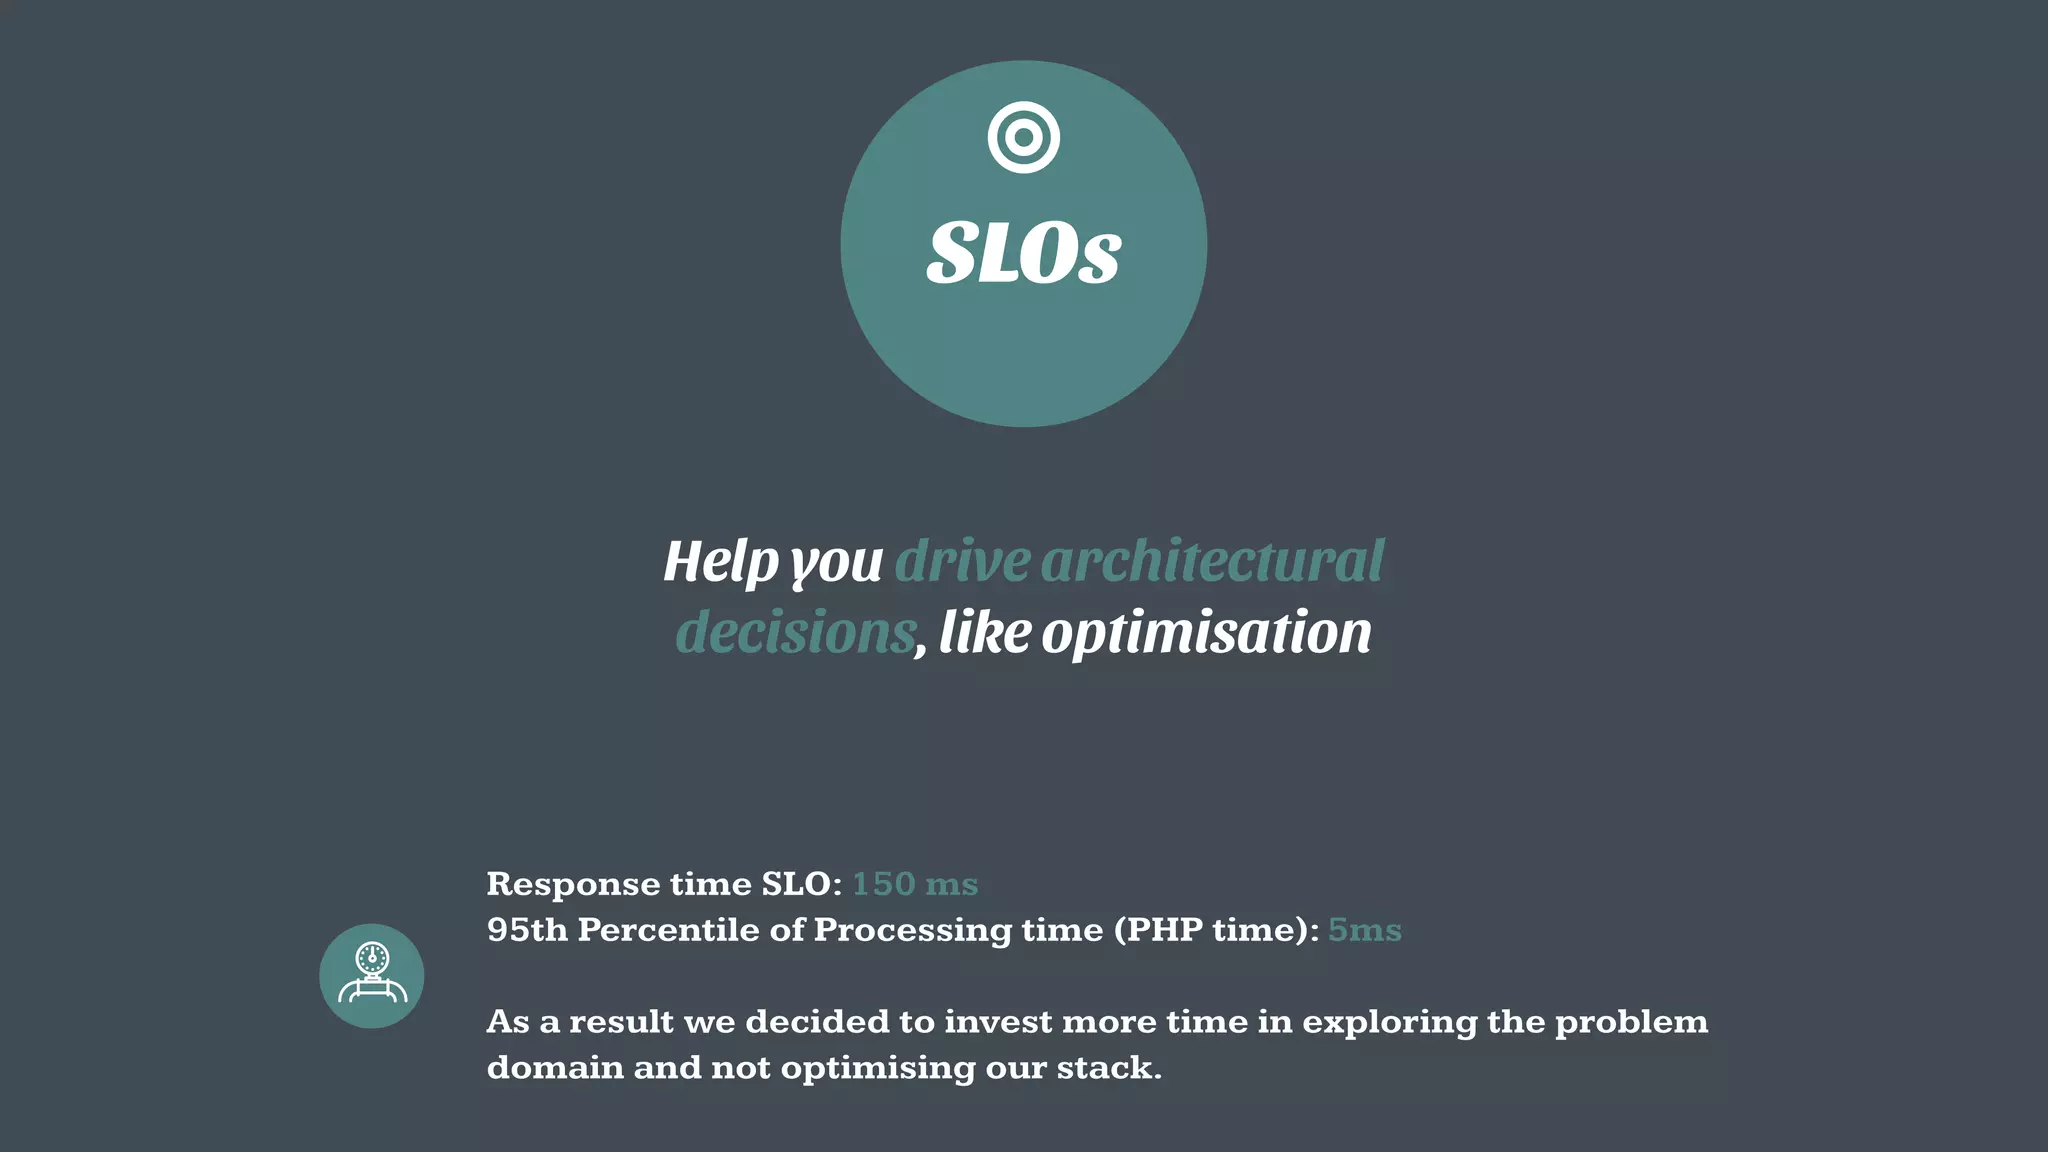
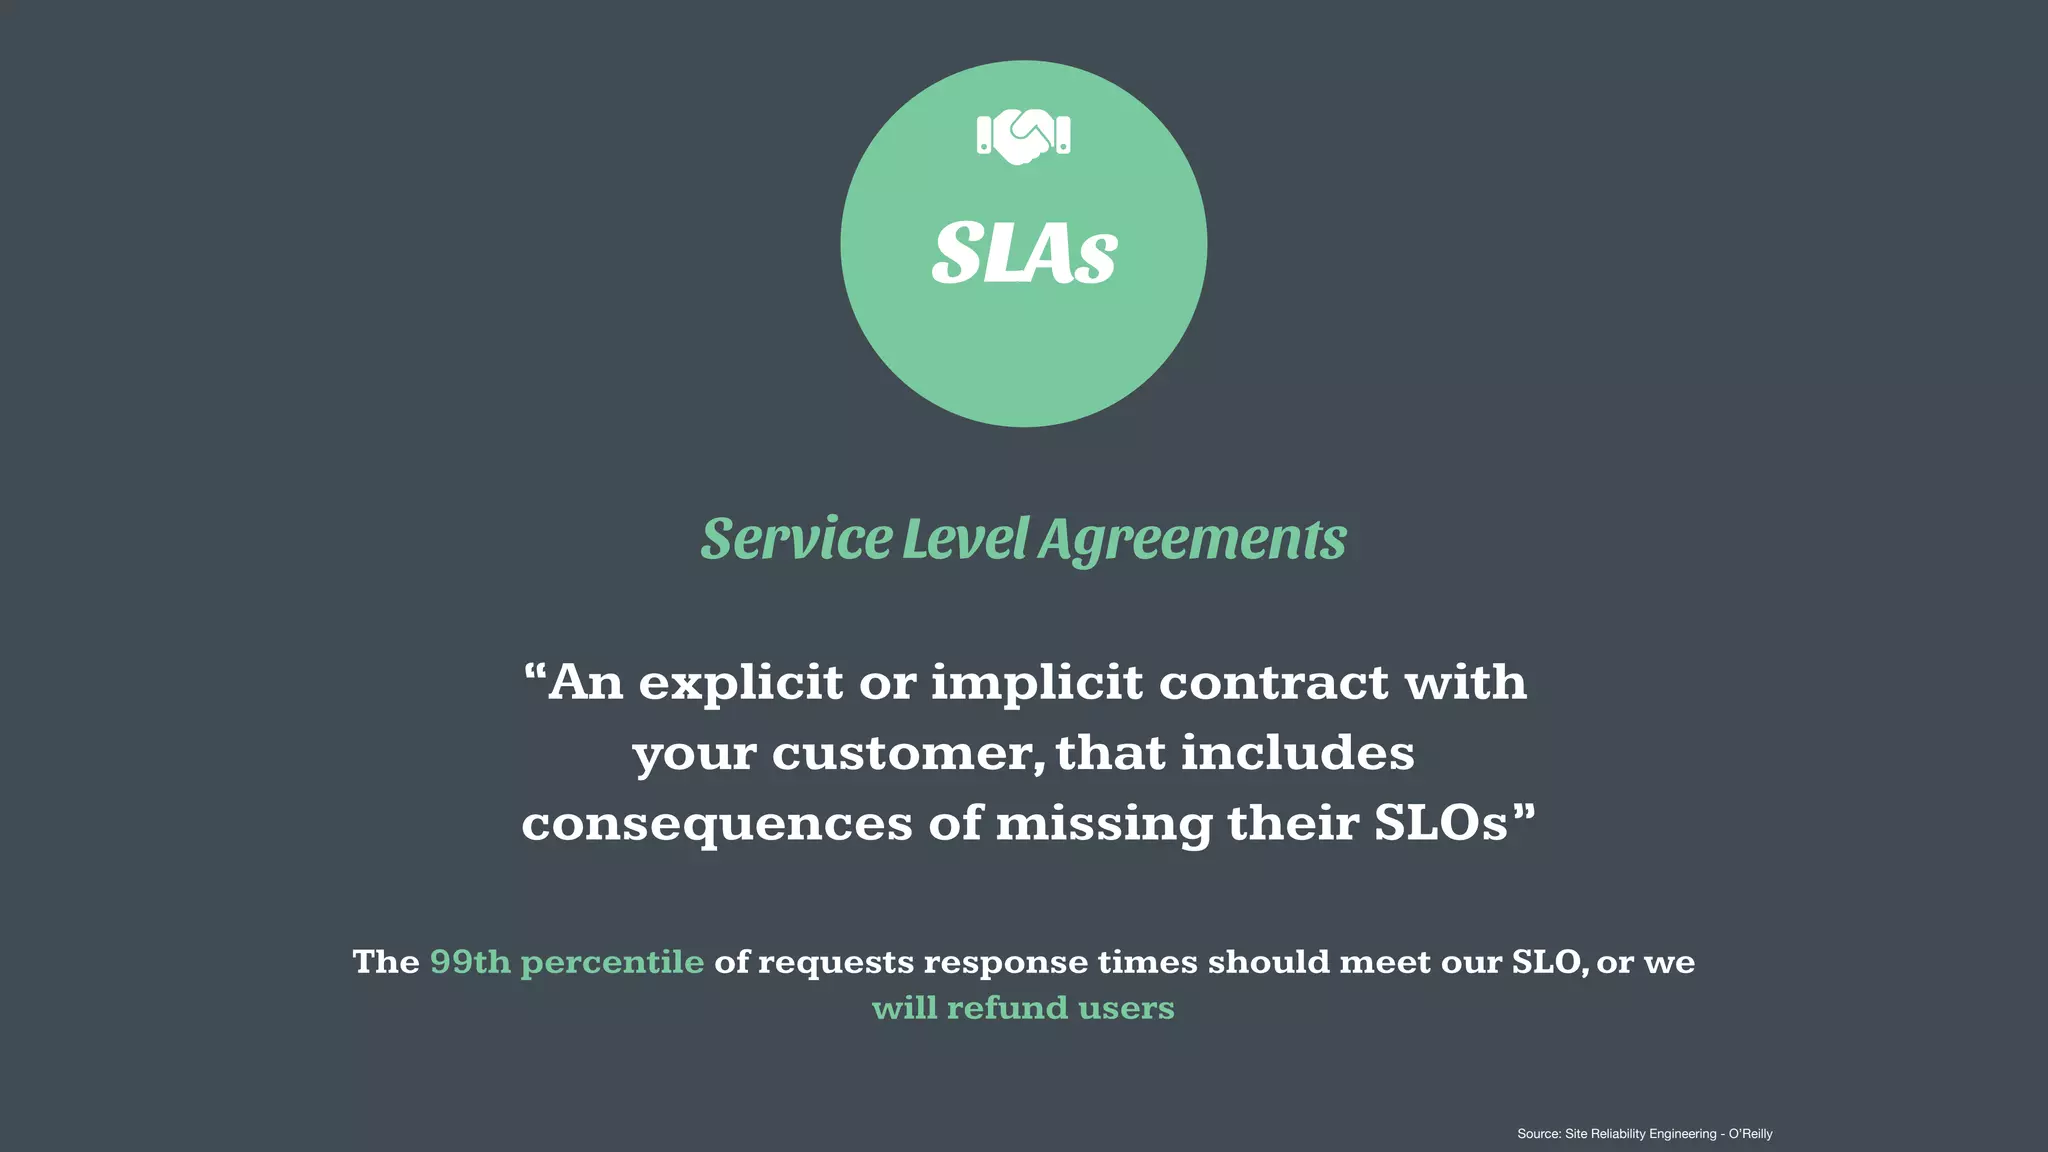
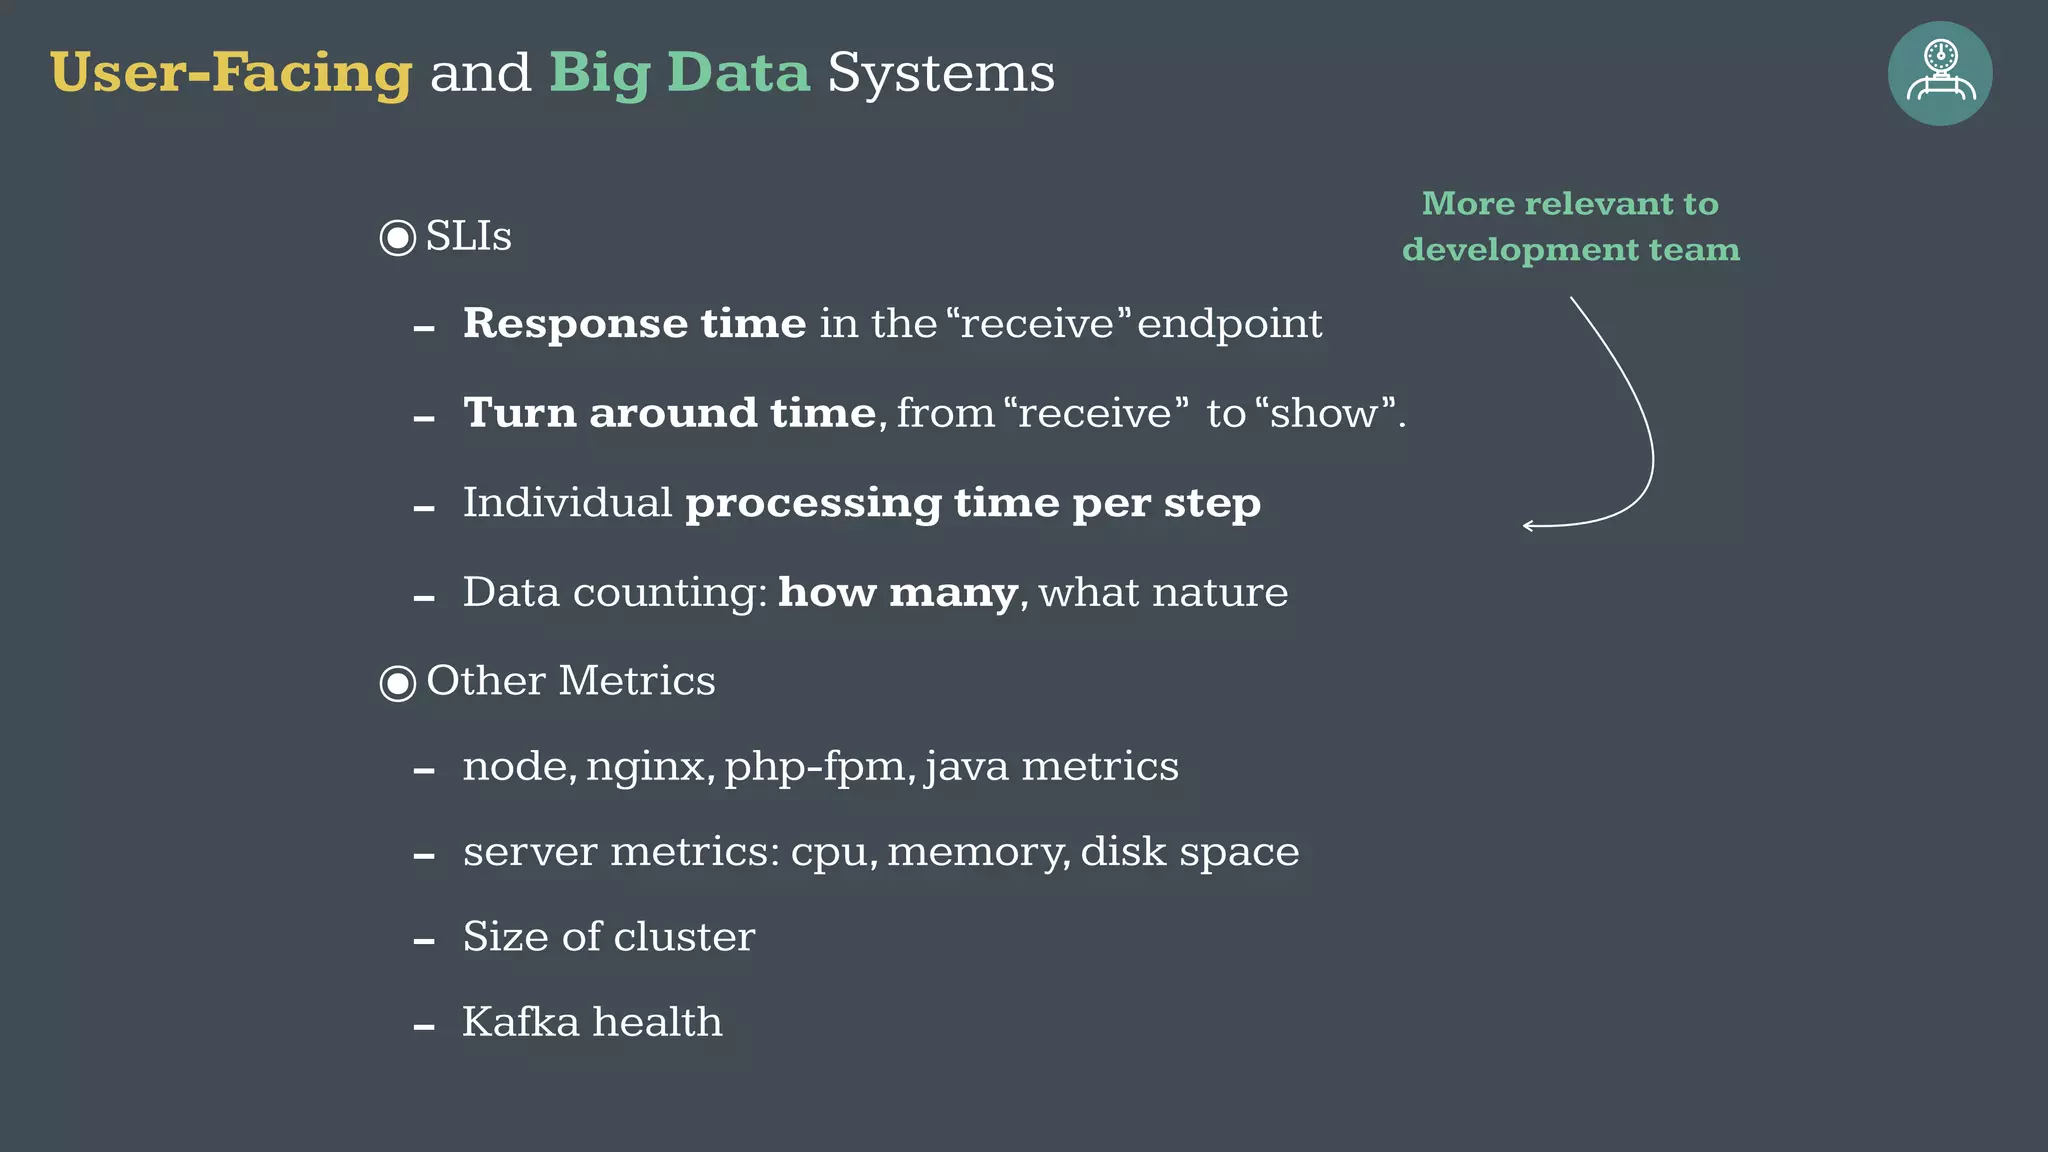
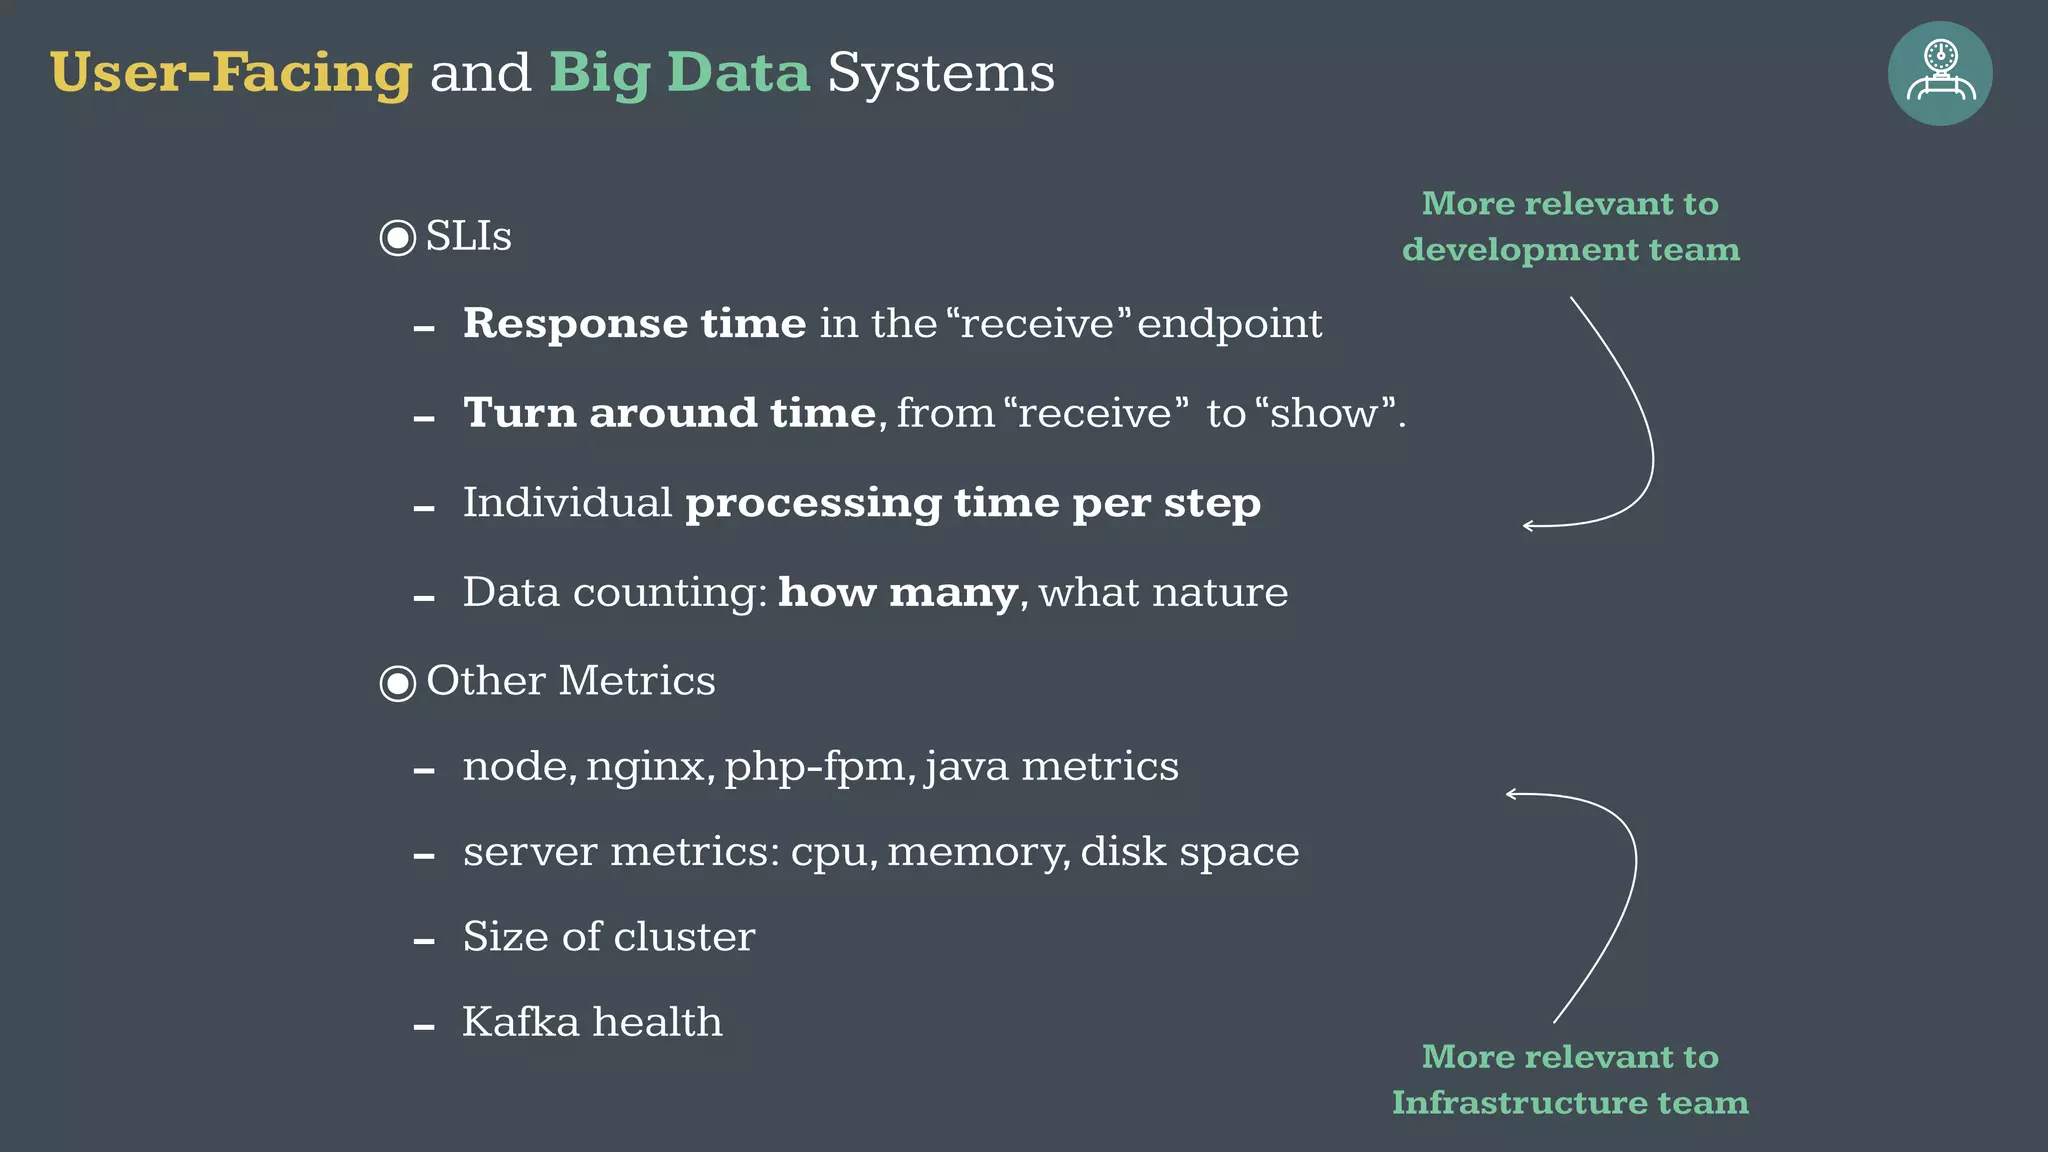
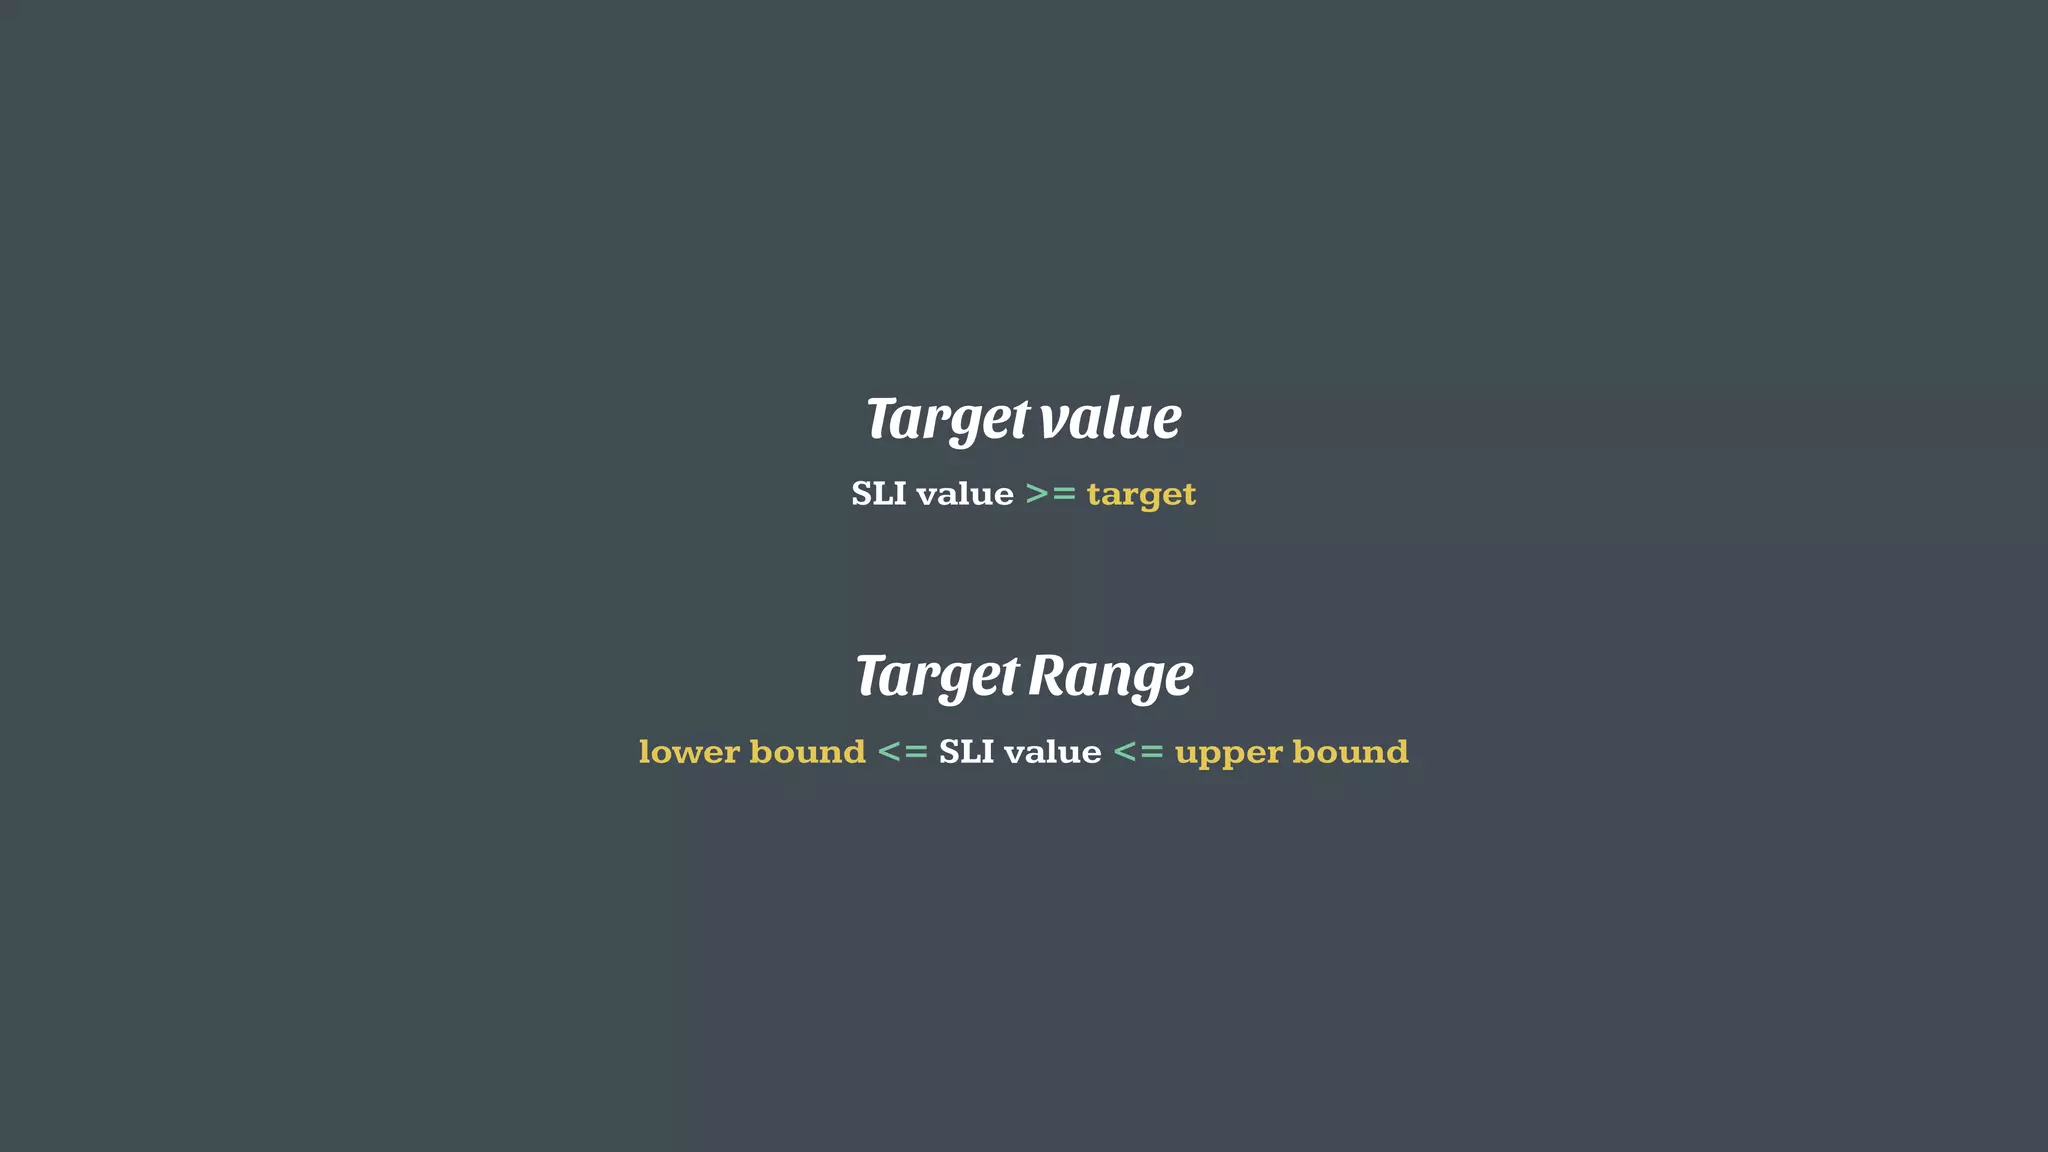
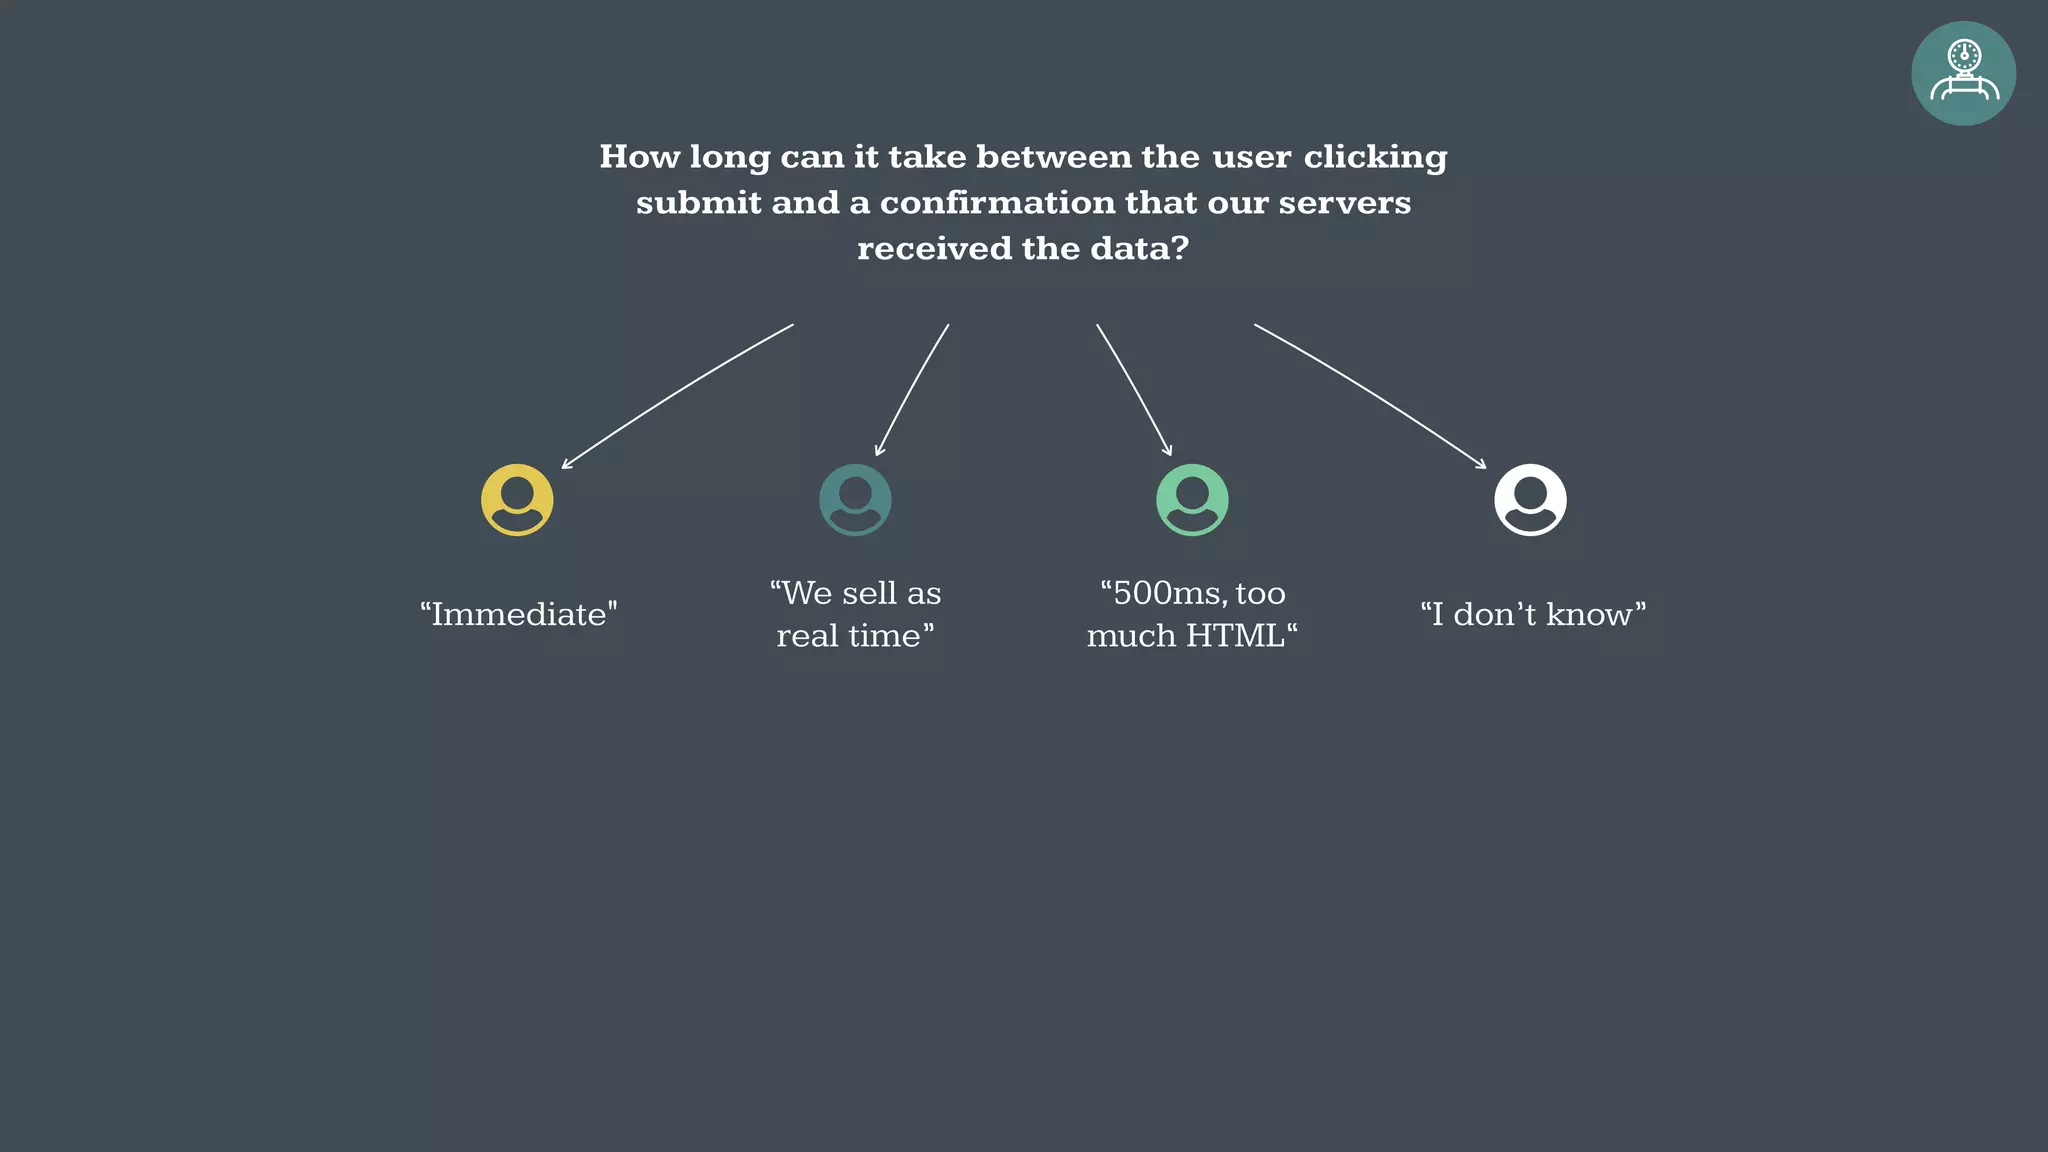
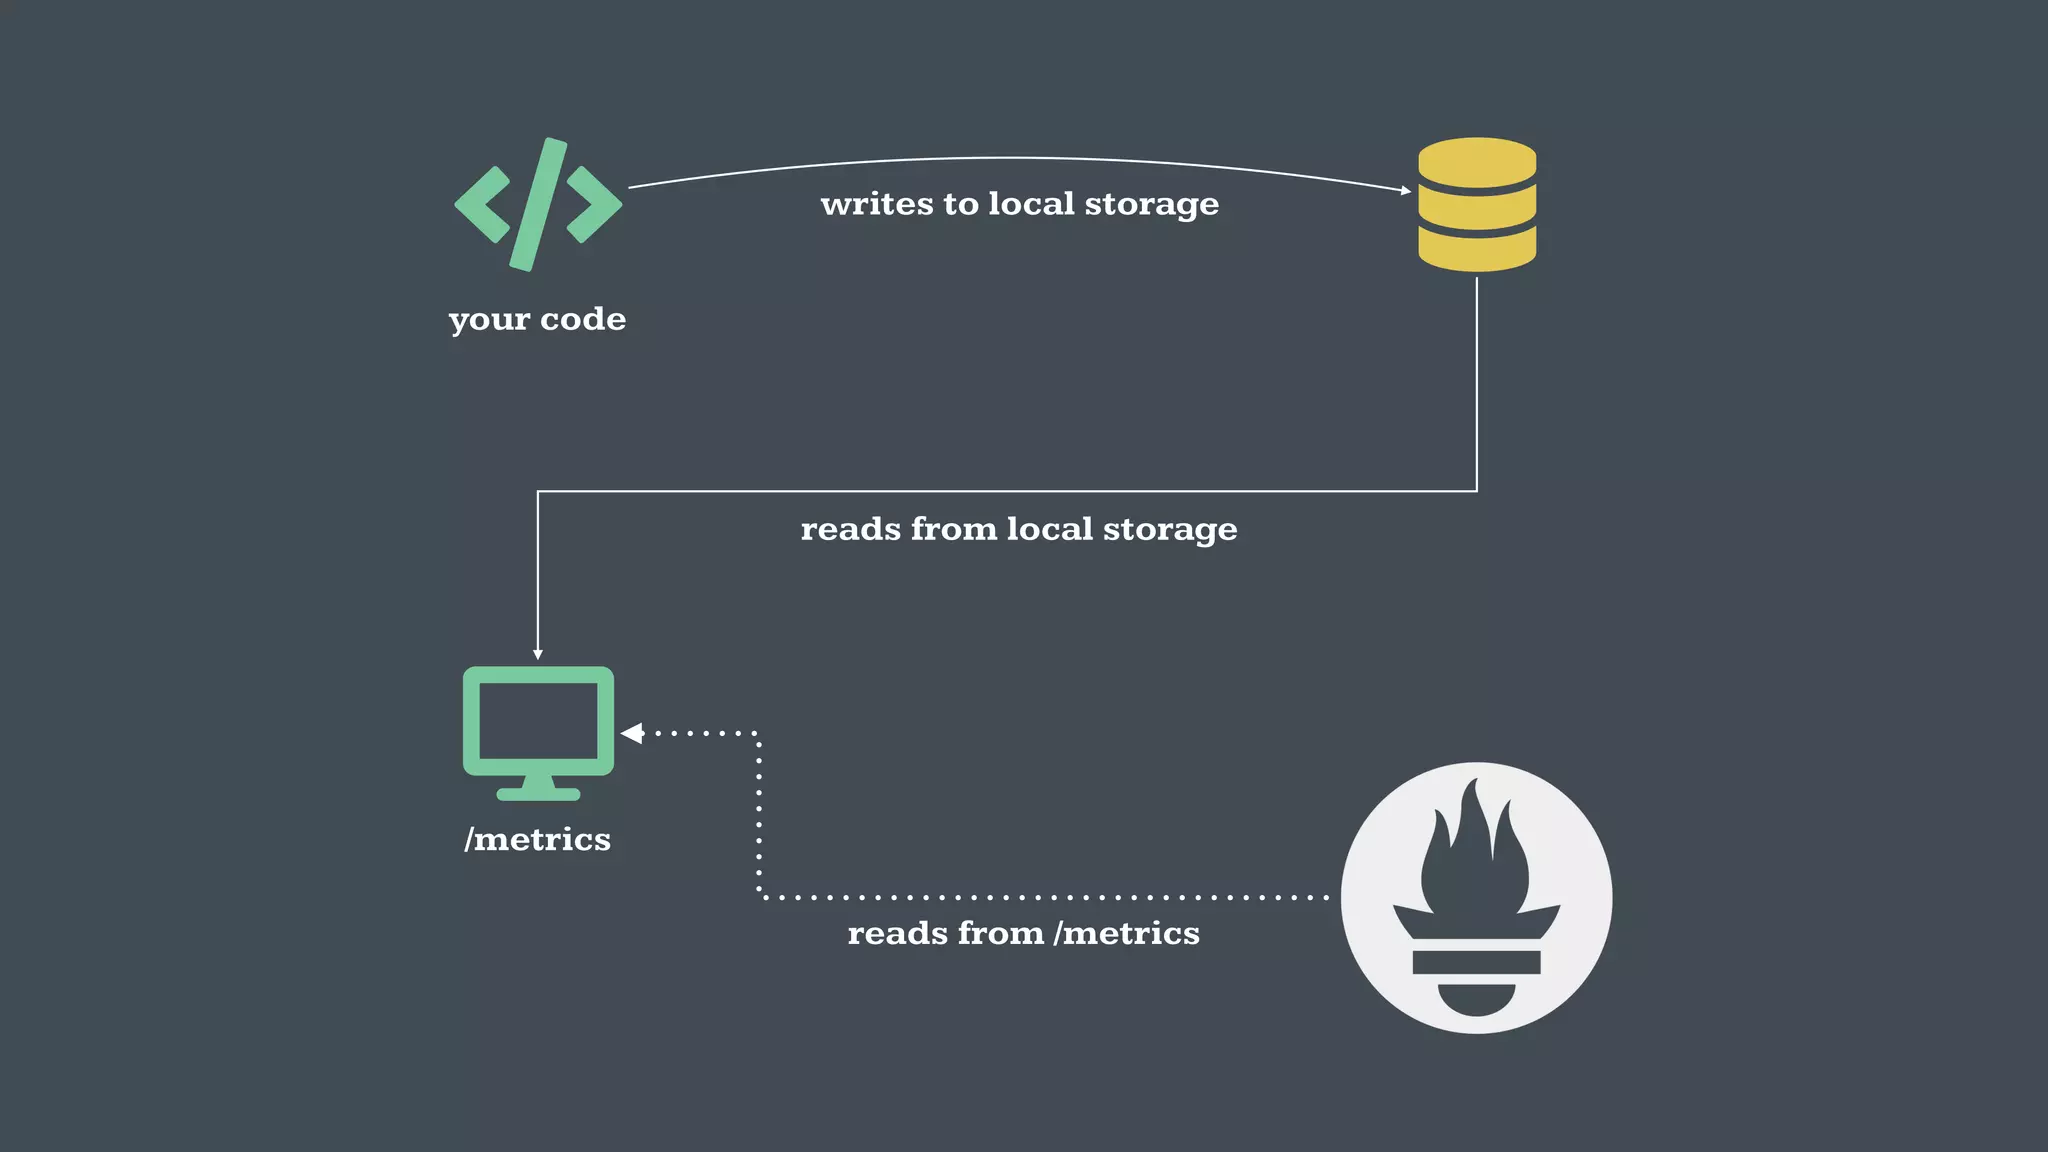
The document discusses application metrics using Prometheus, highlighting the importance of metrics for assessing service health and performance. It covers concepts such as Service Level Indicators (SLIs), Service Level Objectives (SLOs), and Service Level Agreements (SLAs), emphasizing the need for actionable insights from metrics. Additionally, it includes practical implementation examples and various metrics types for monitoring application performance.


