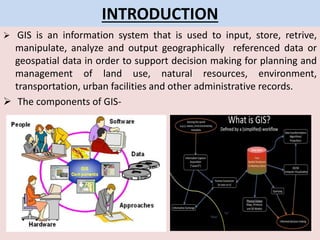
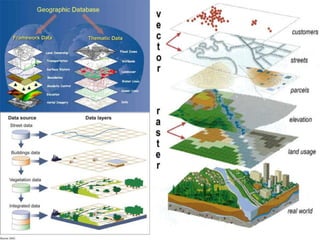
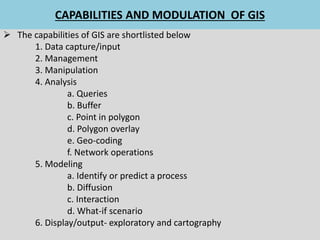
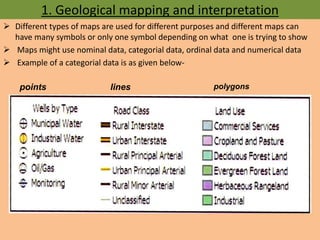
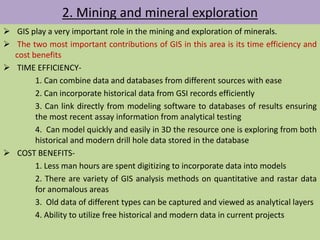
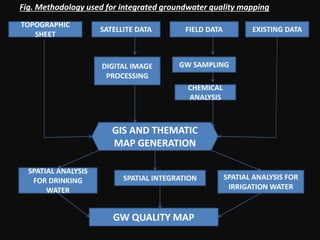
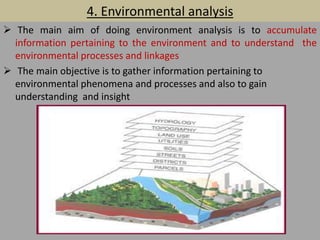
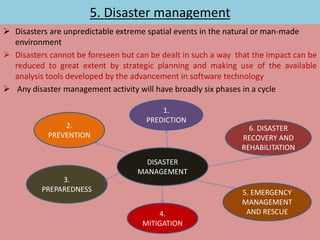
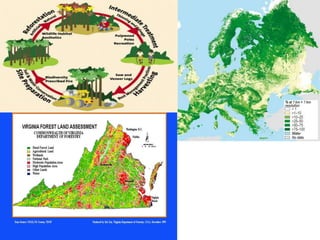
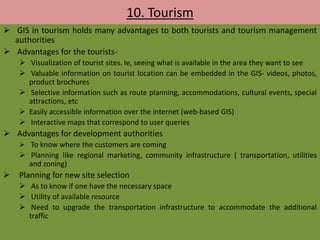
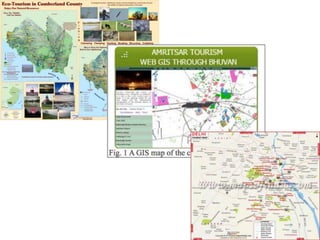
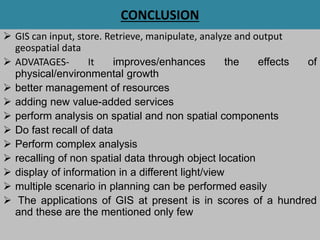
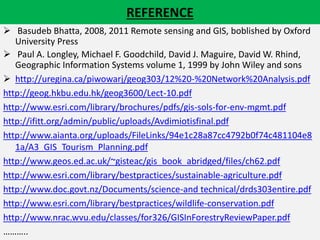
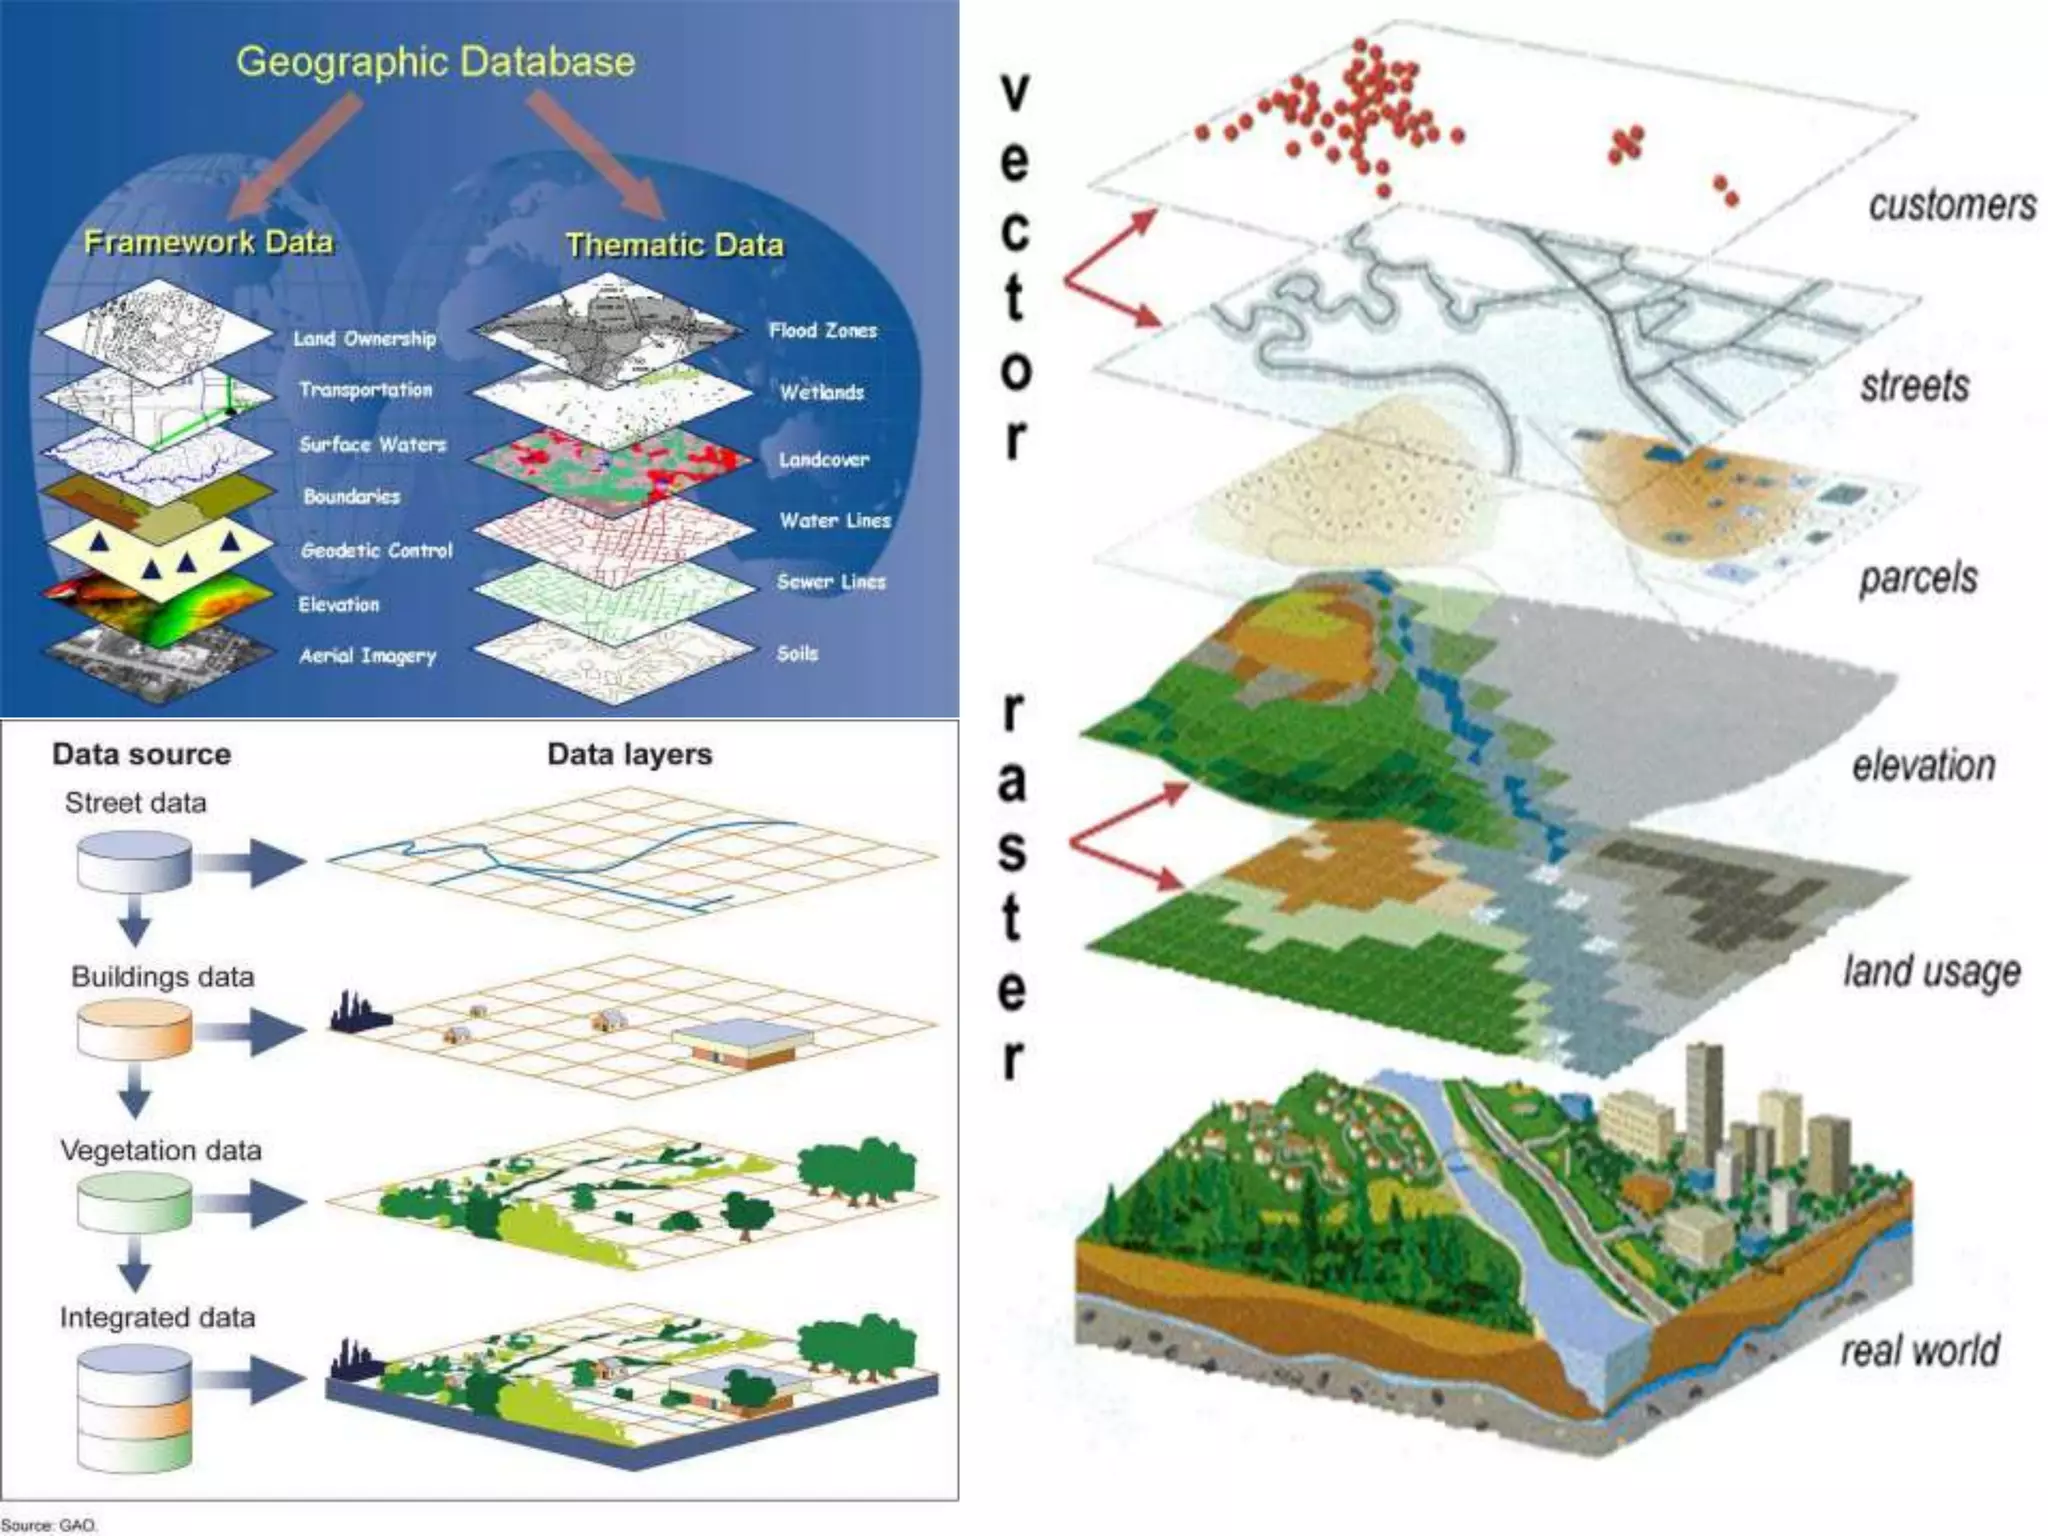
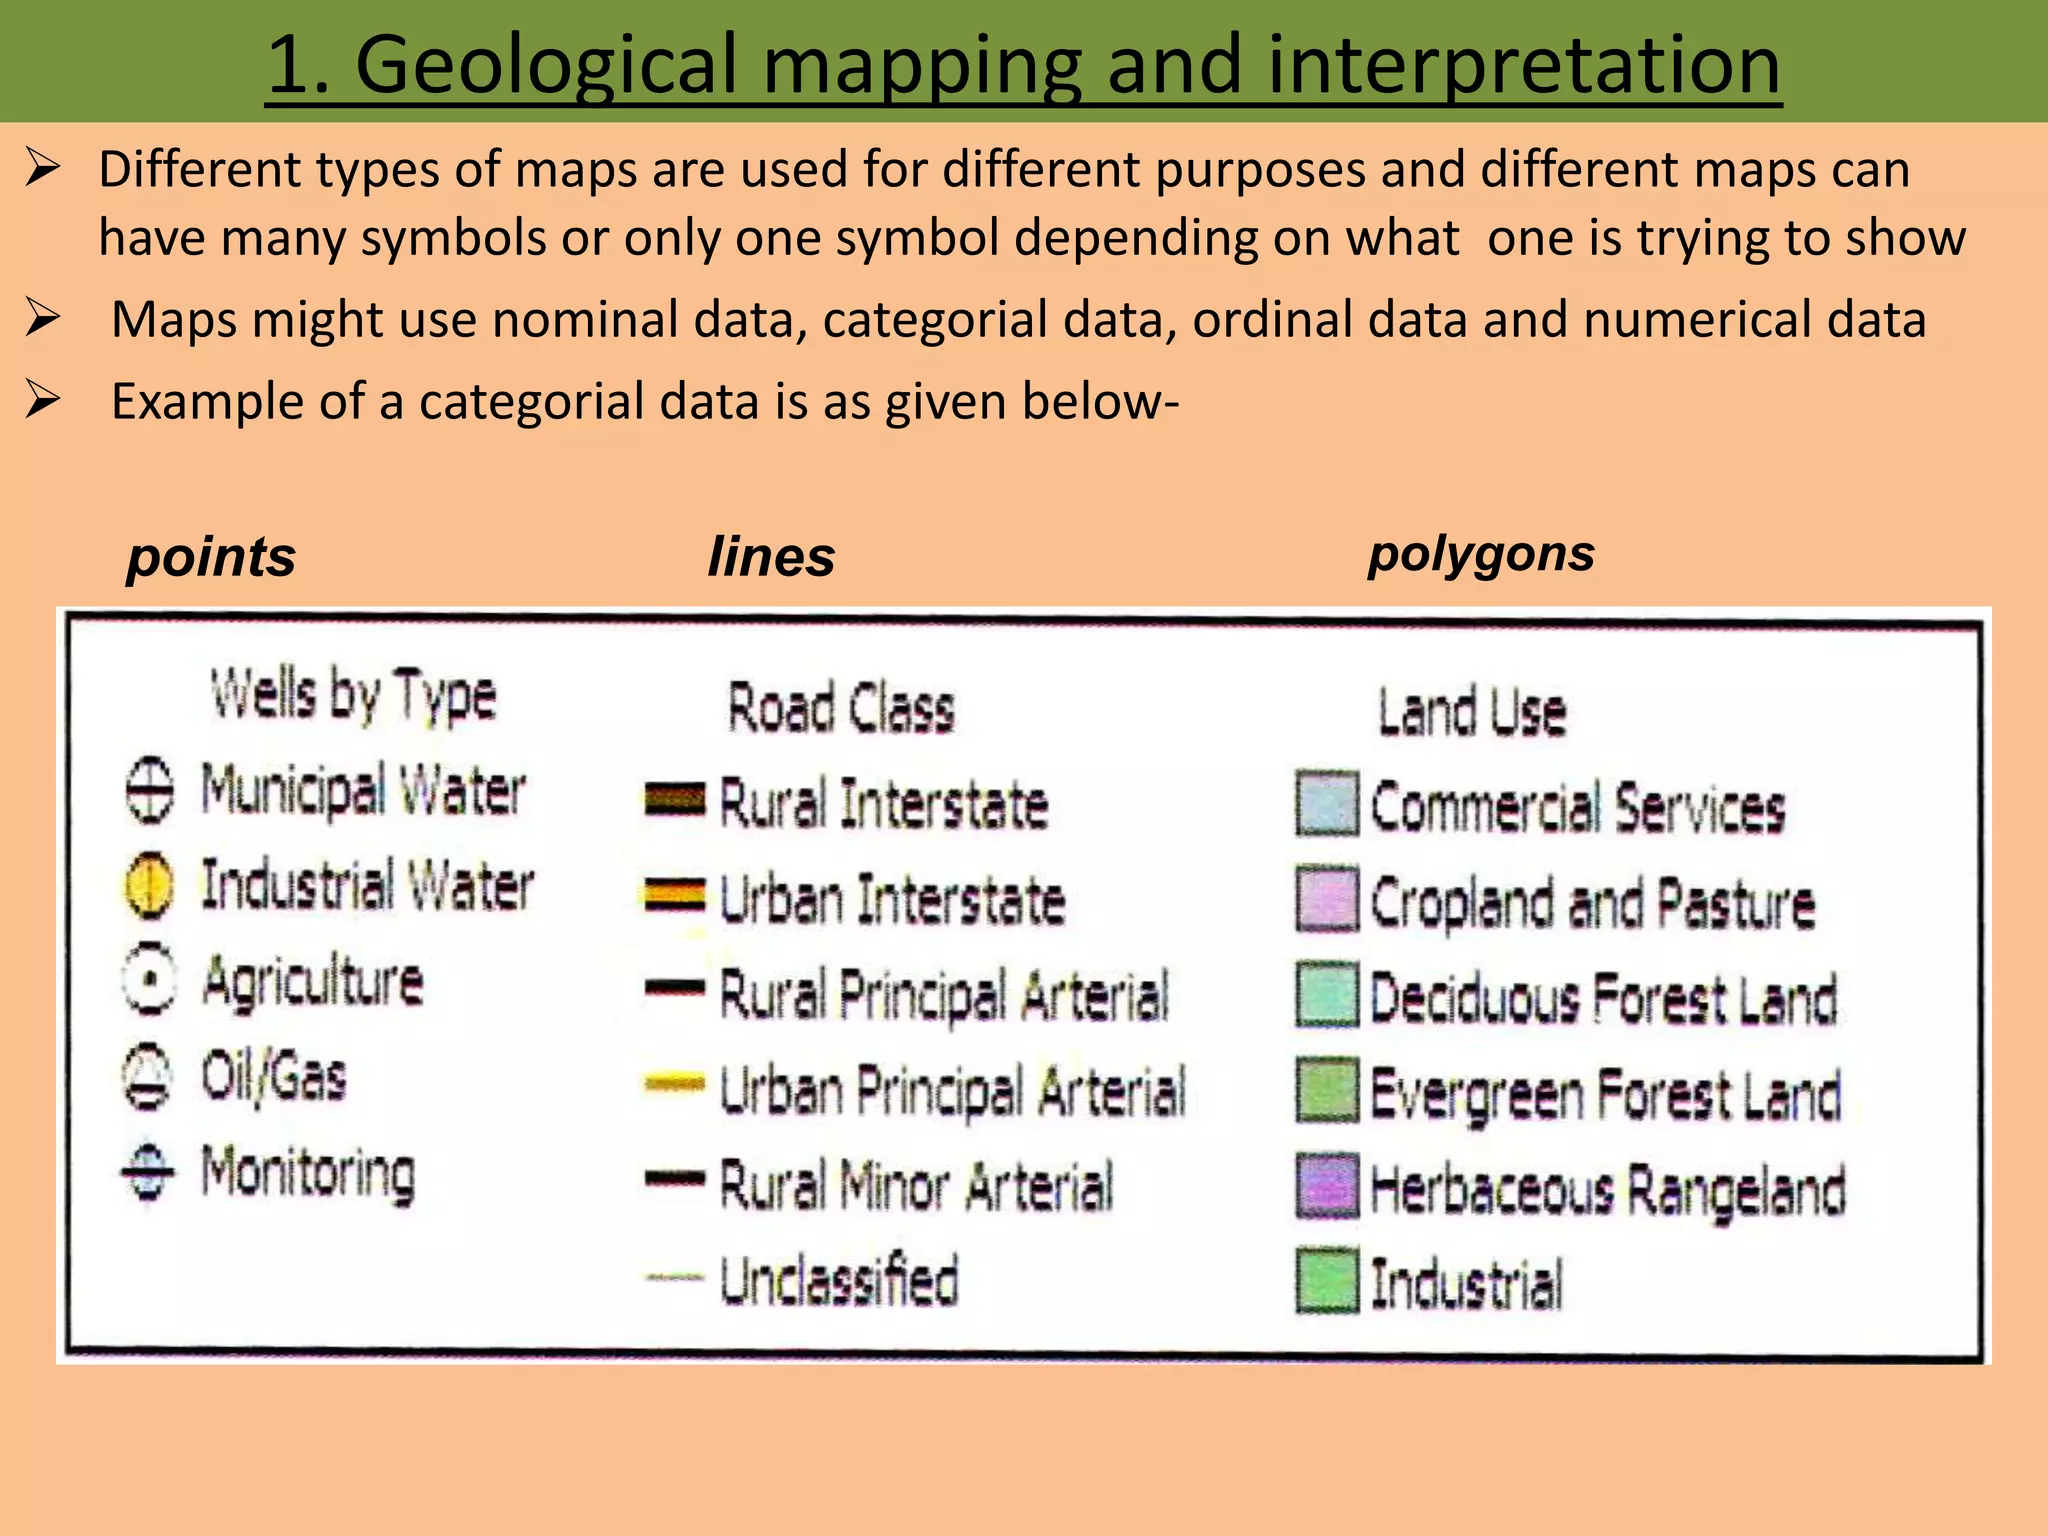
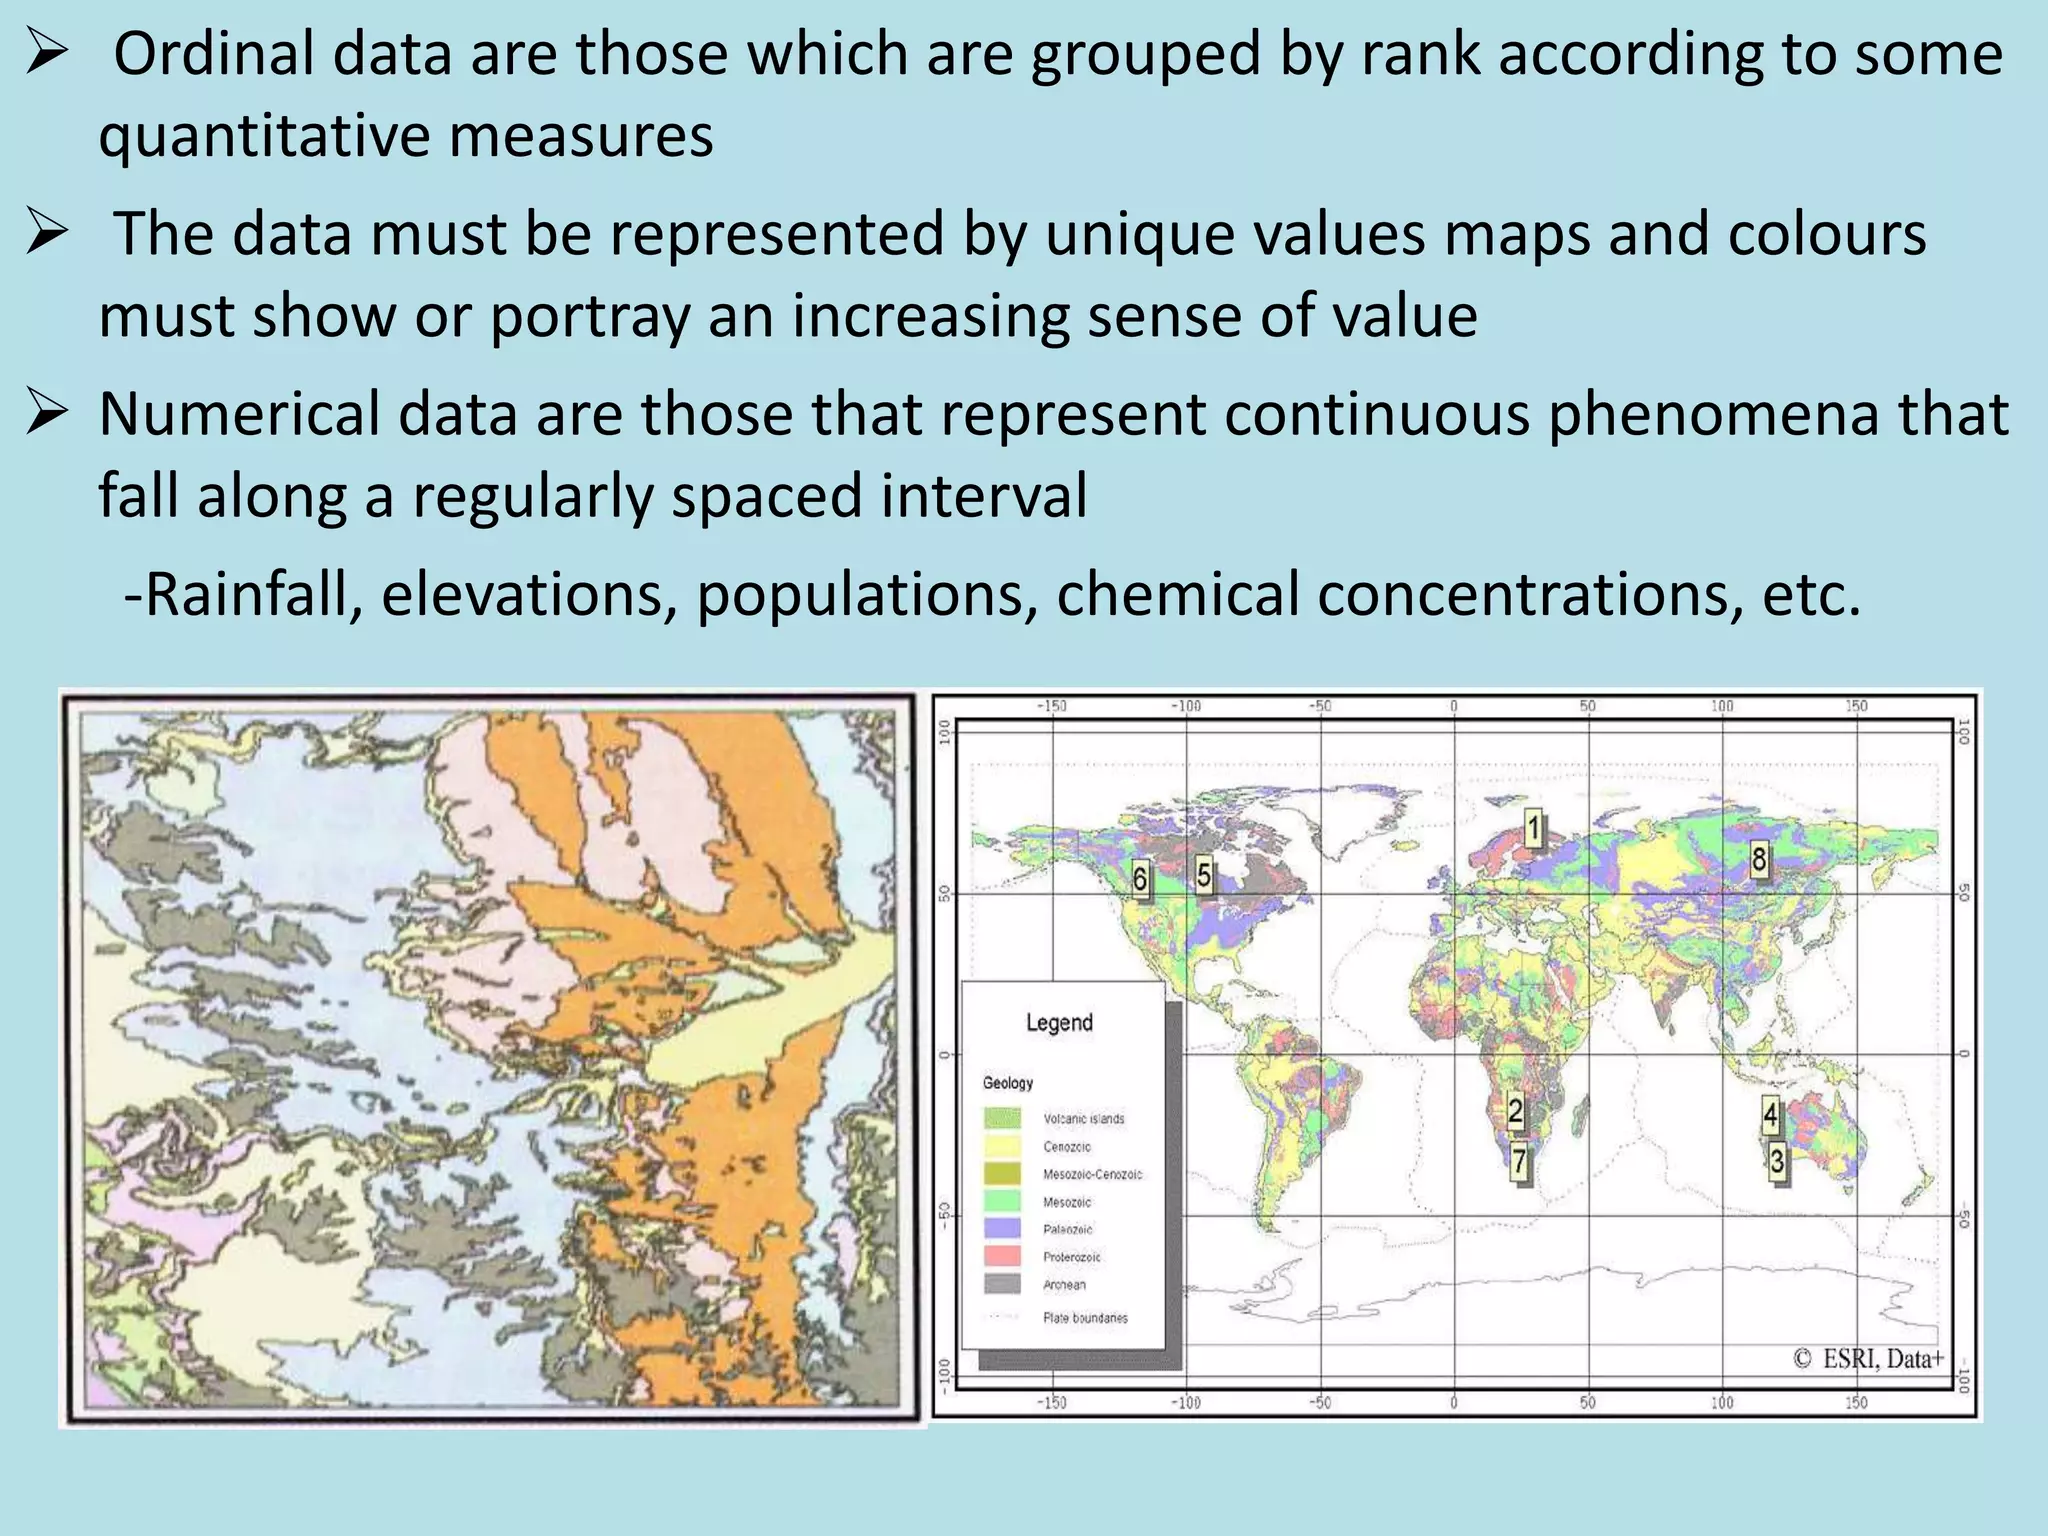
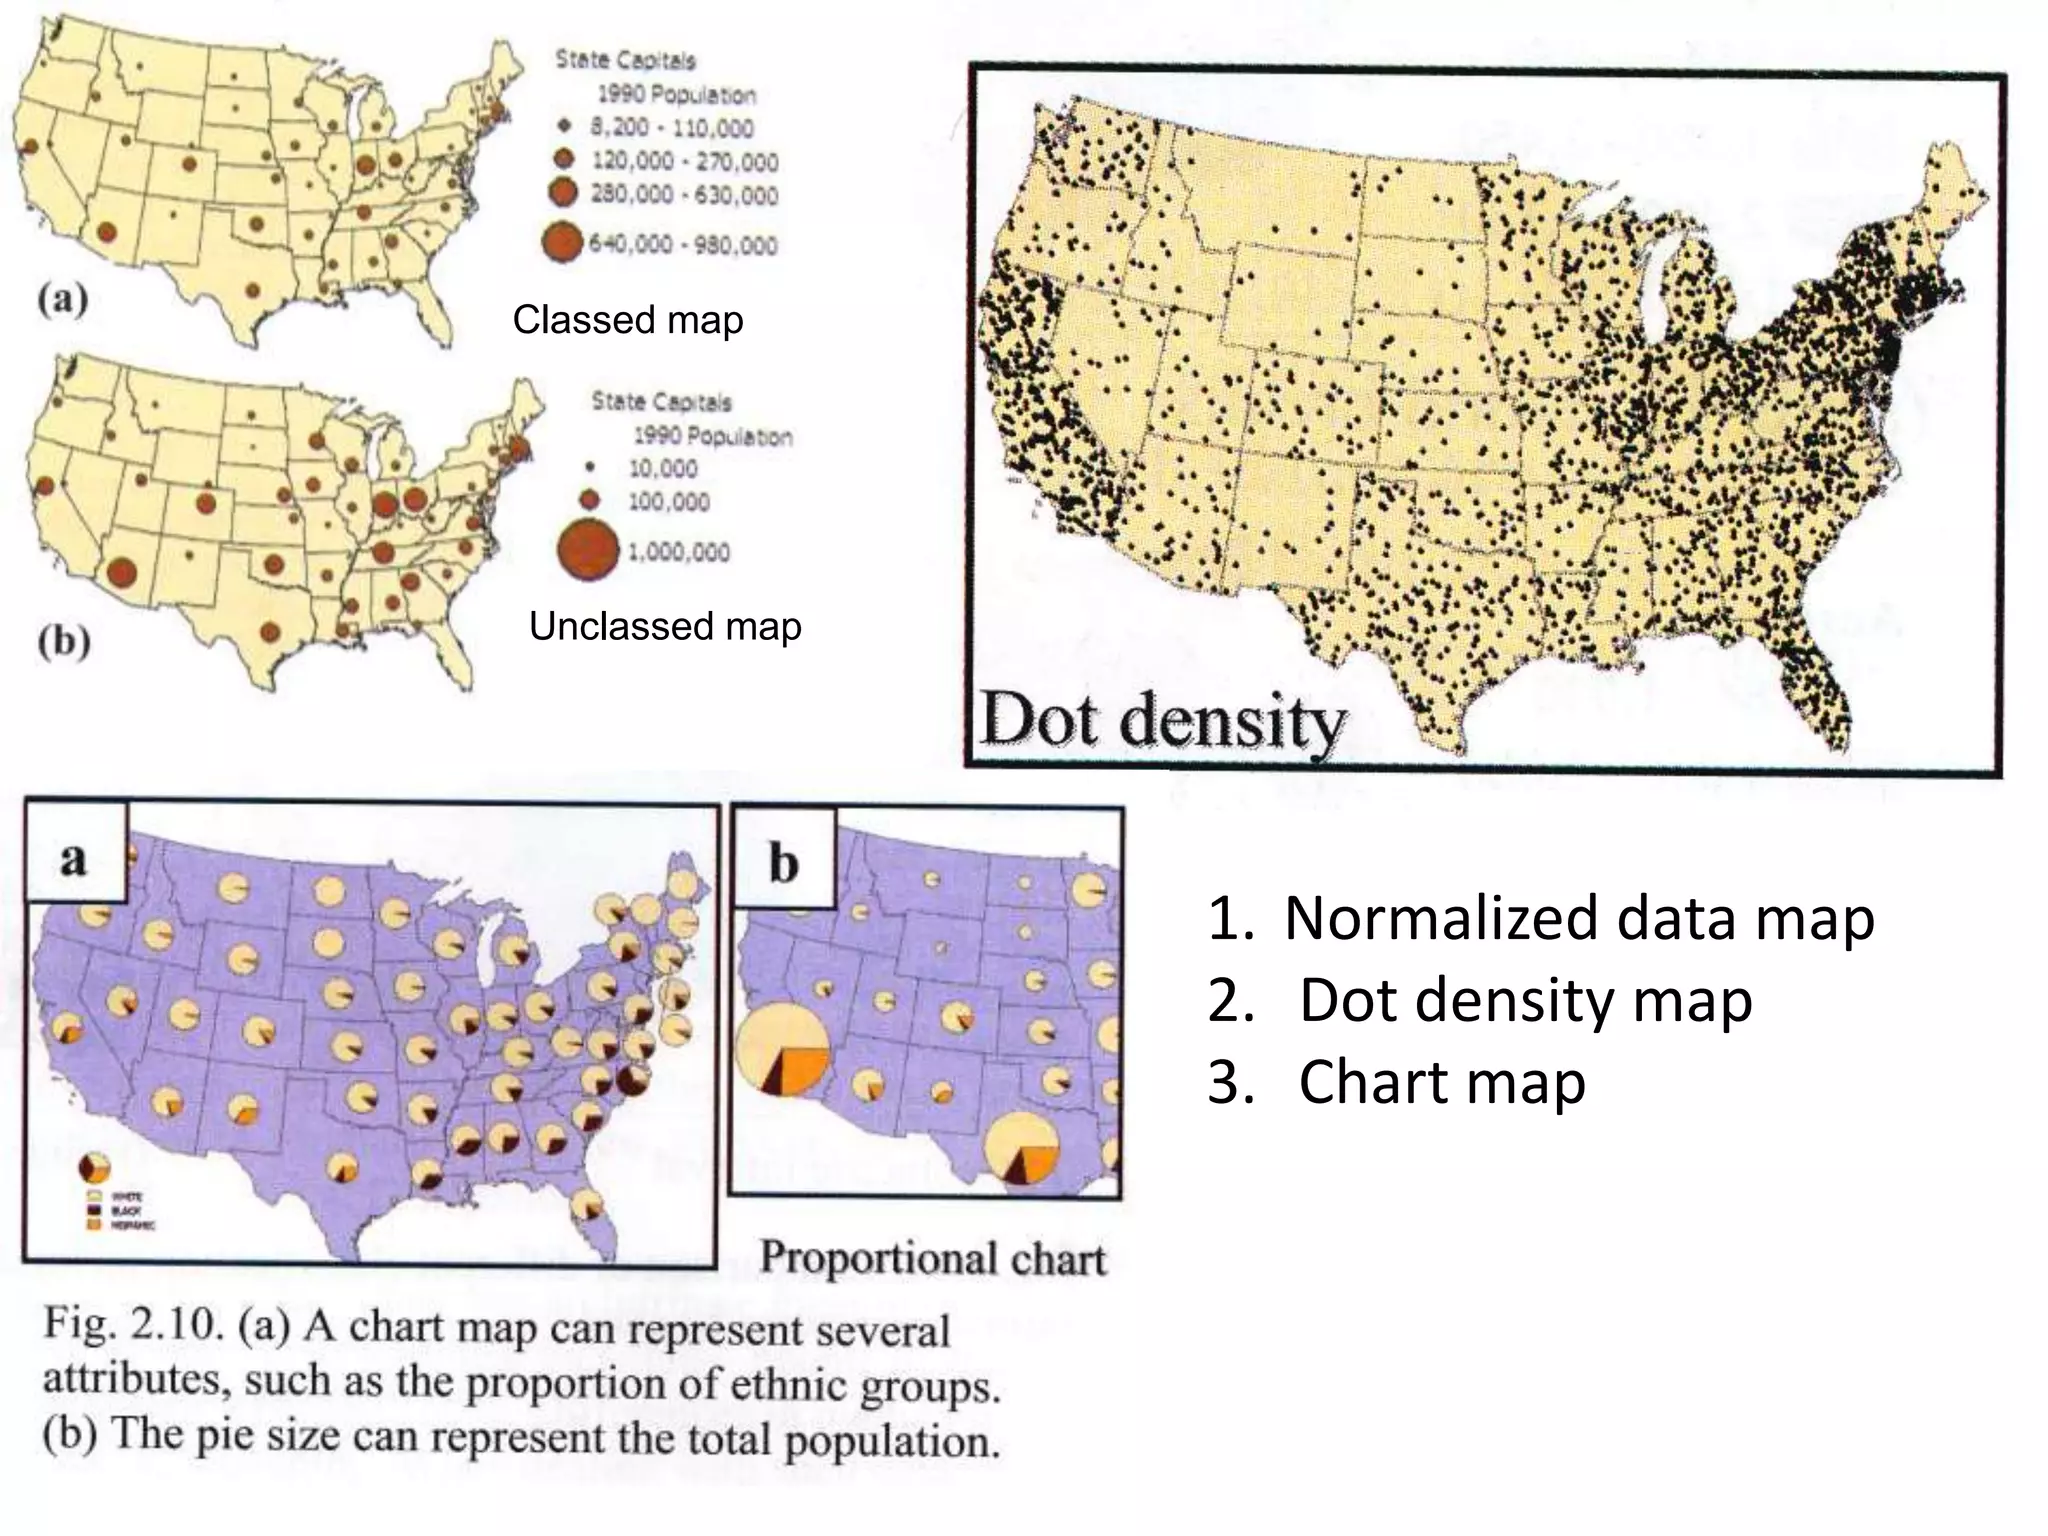
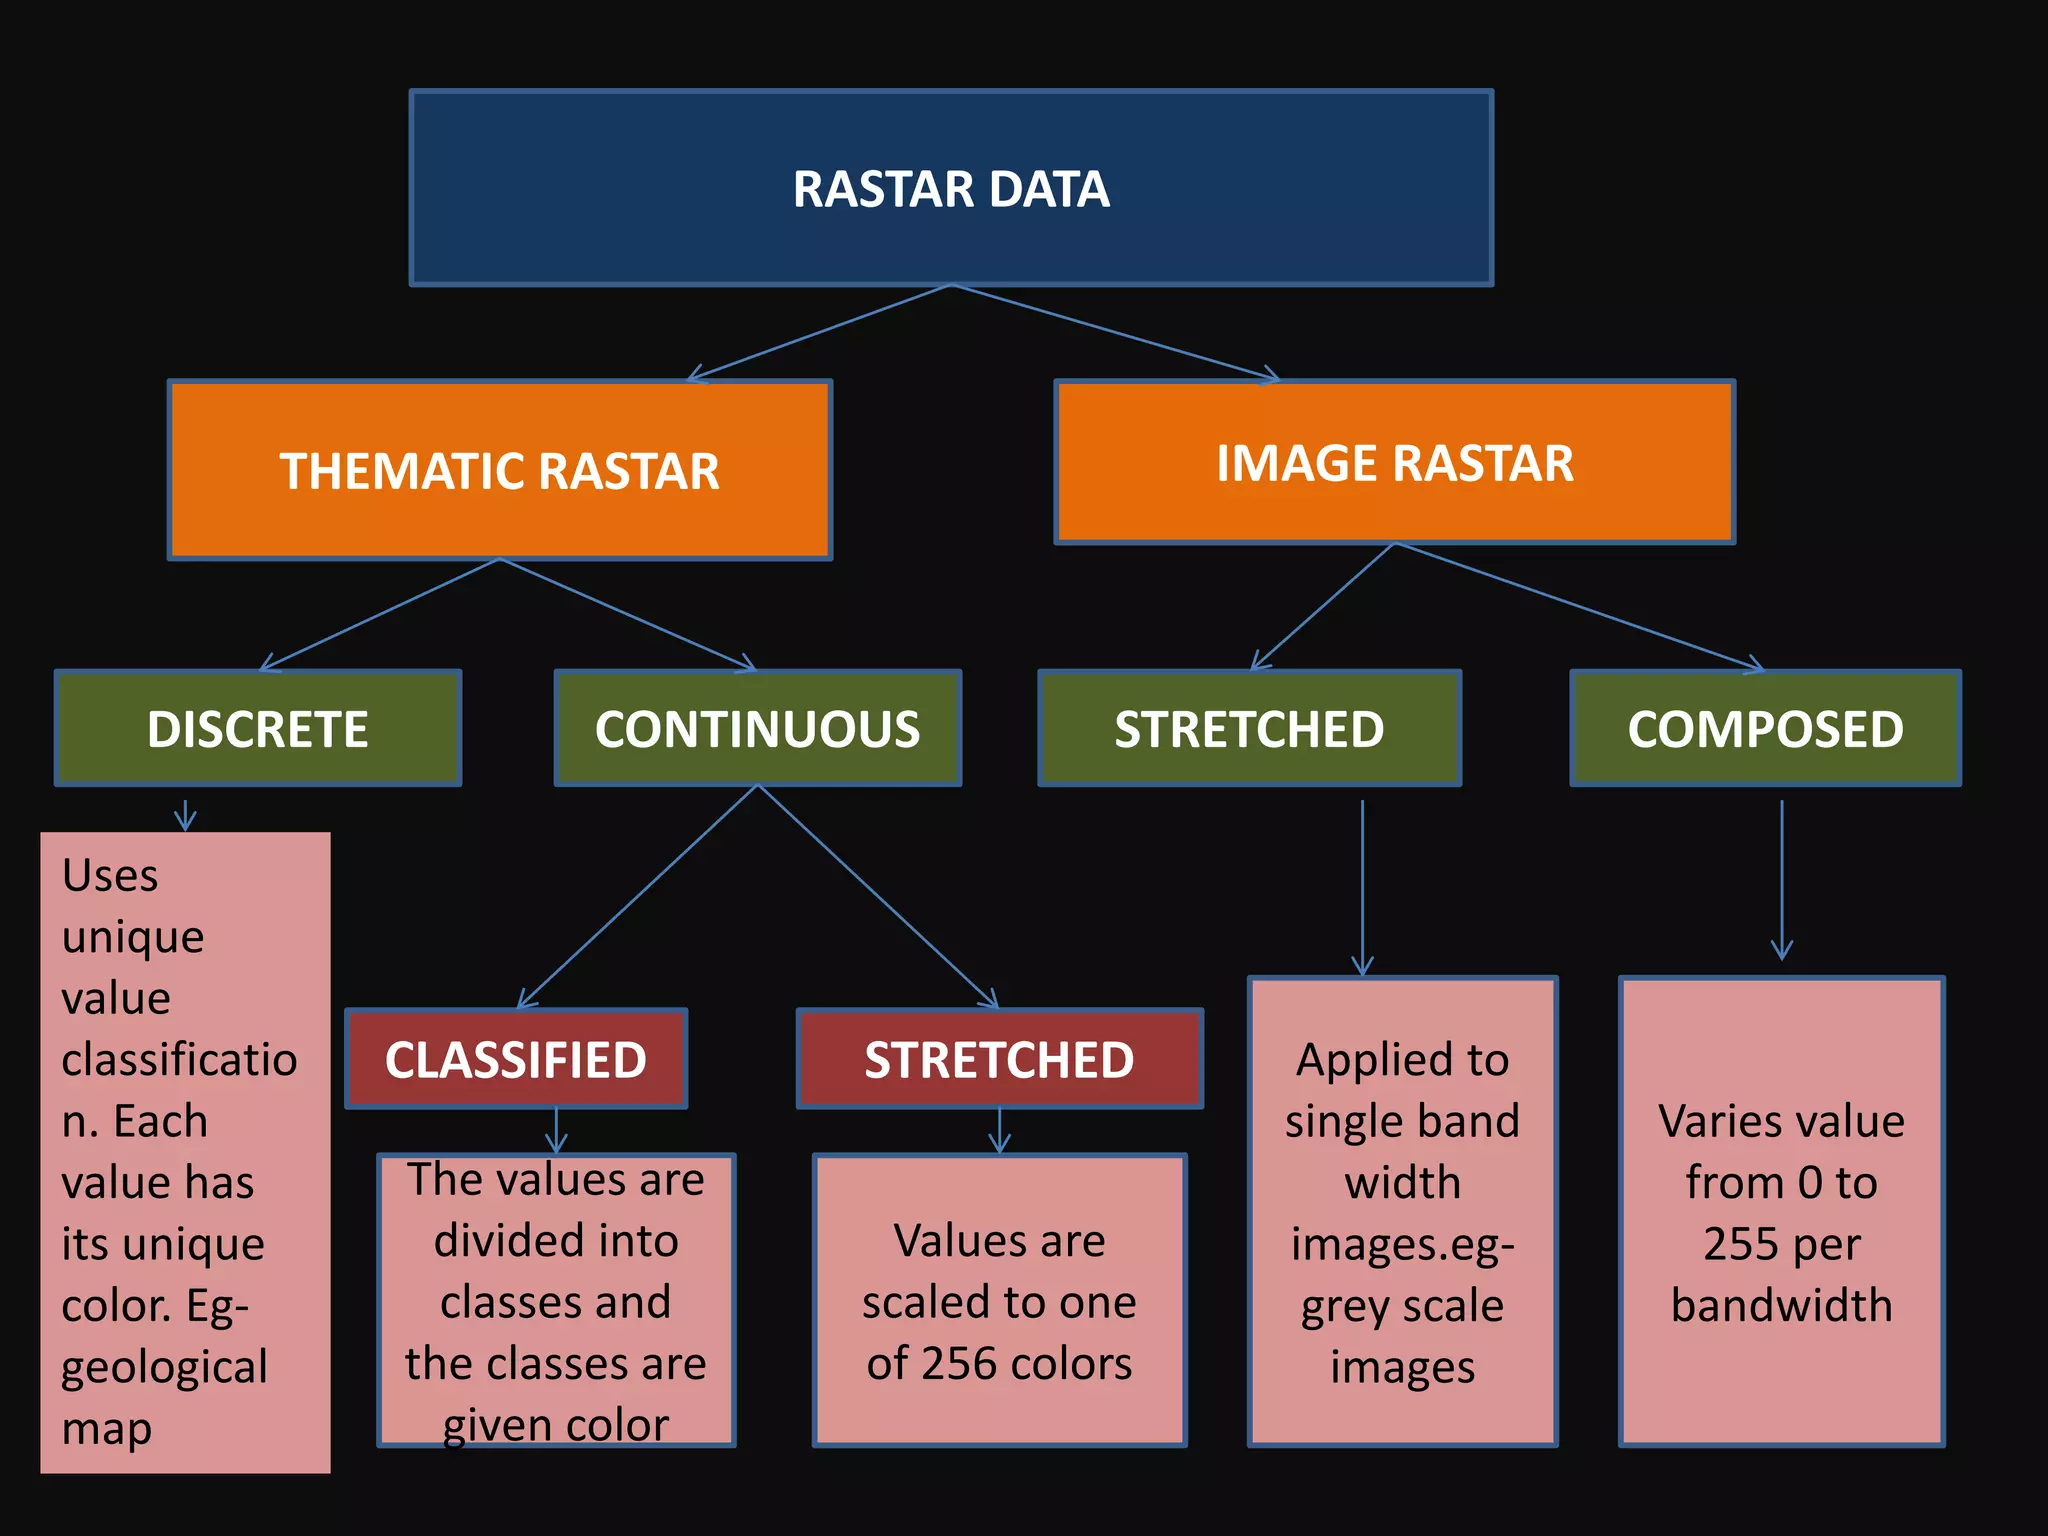
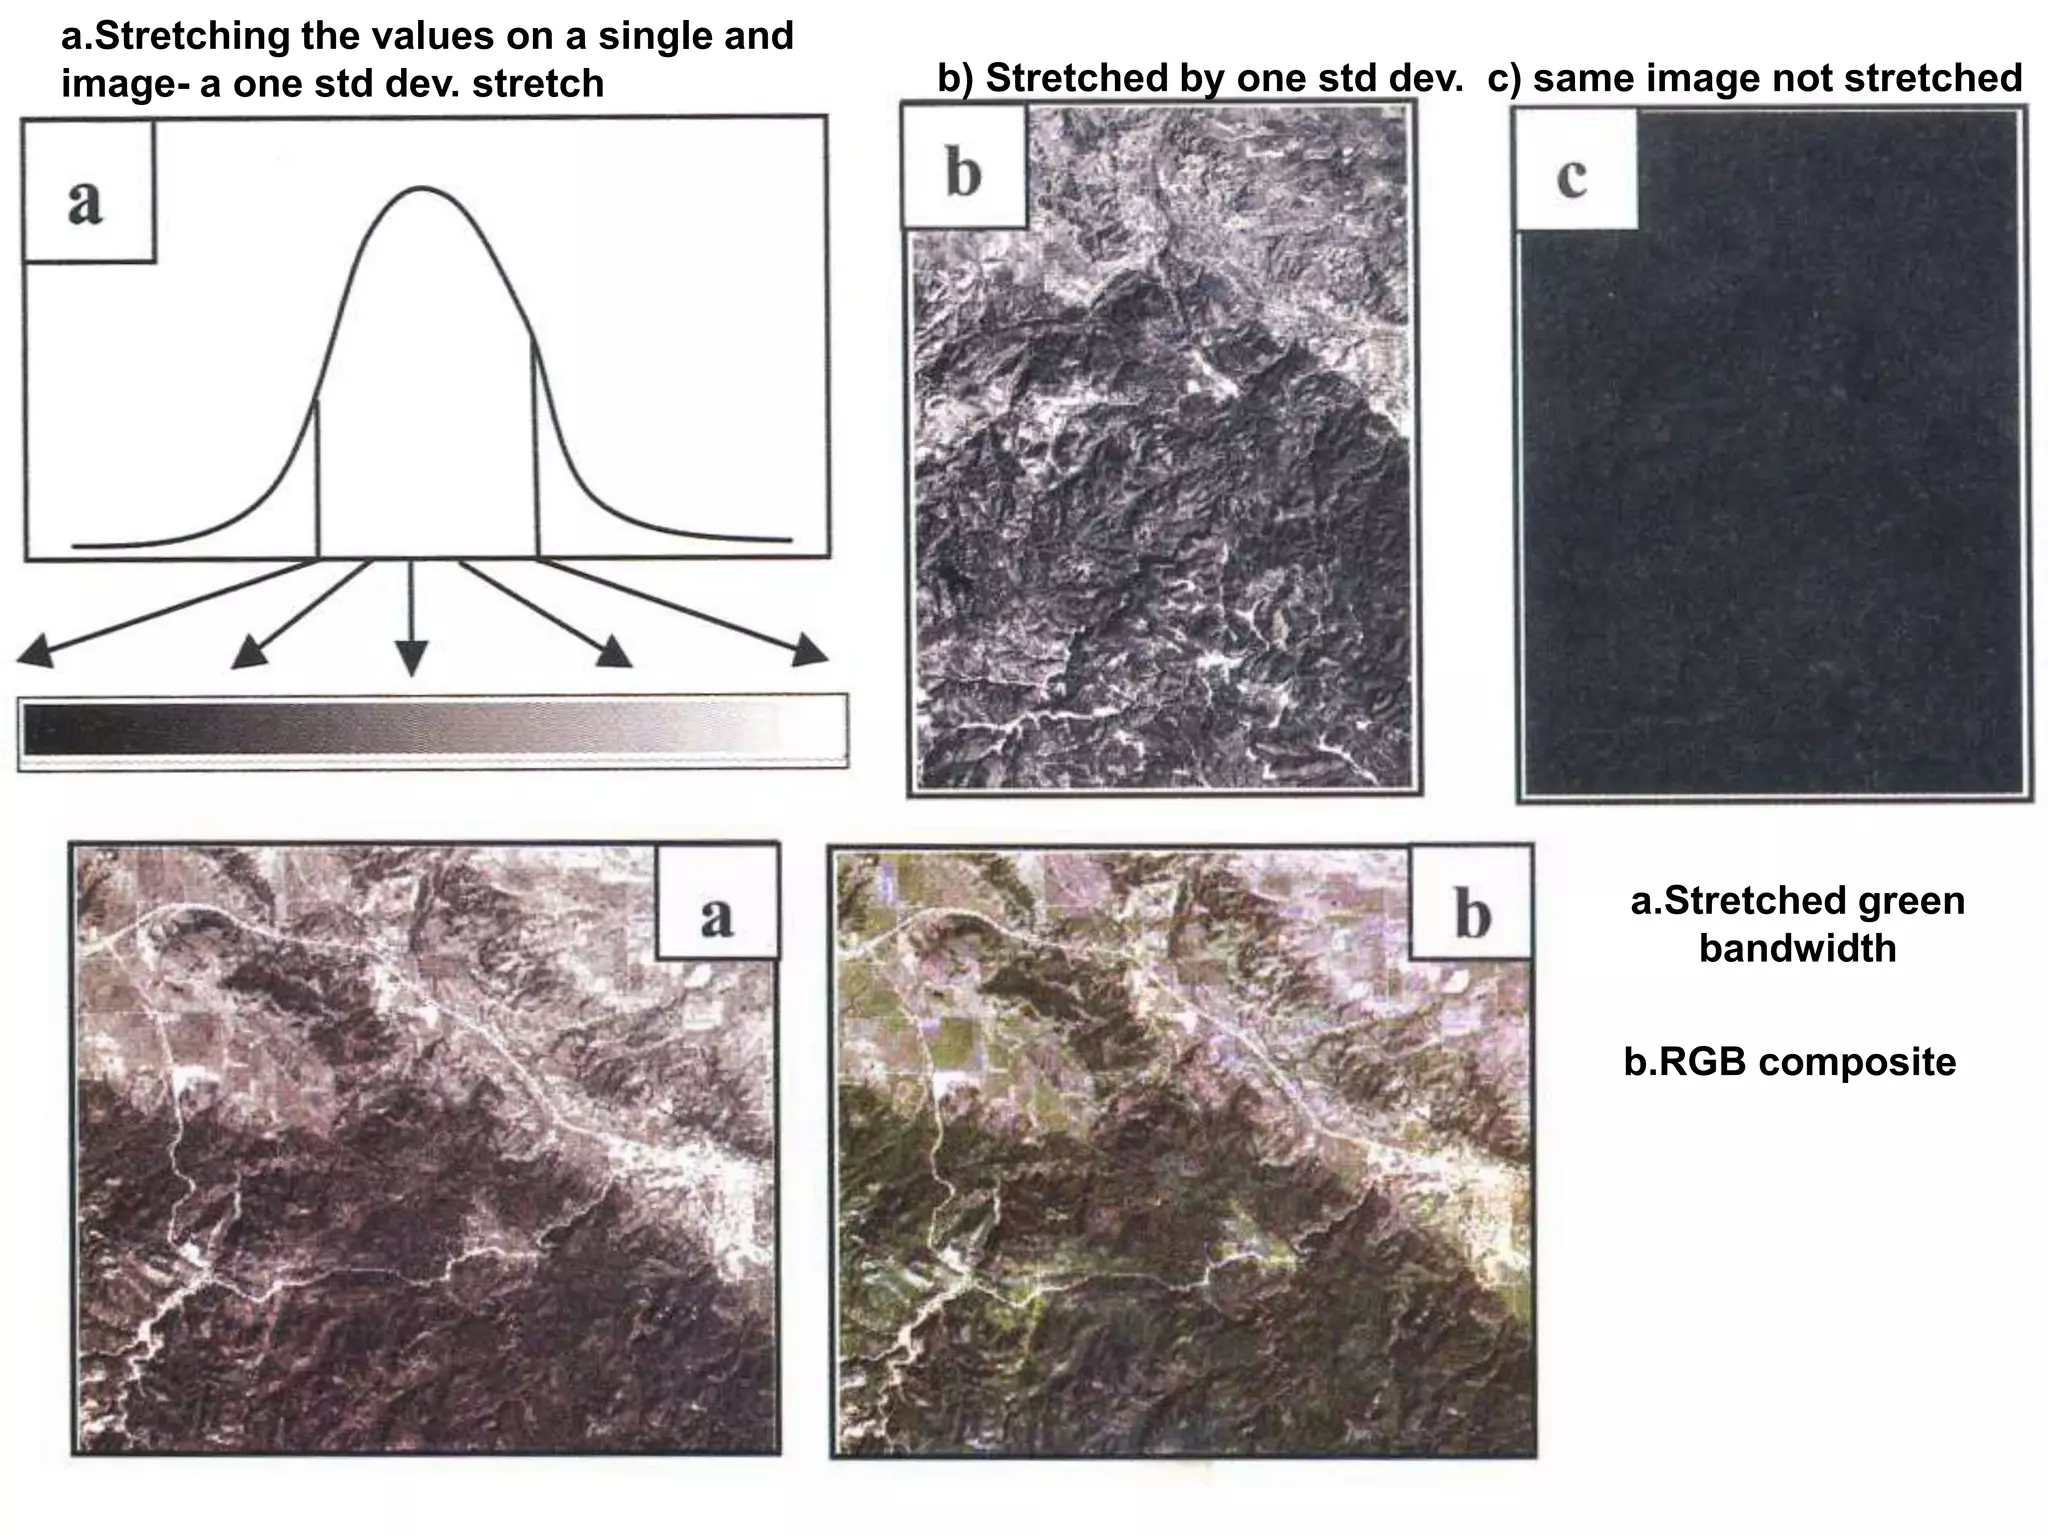
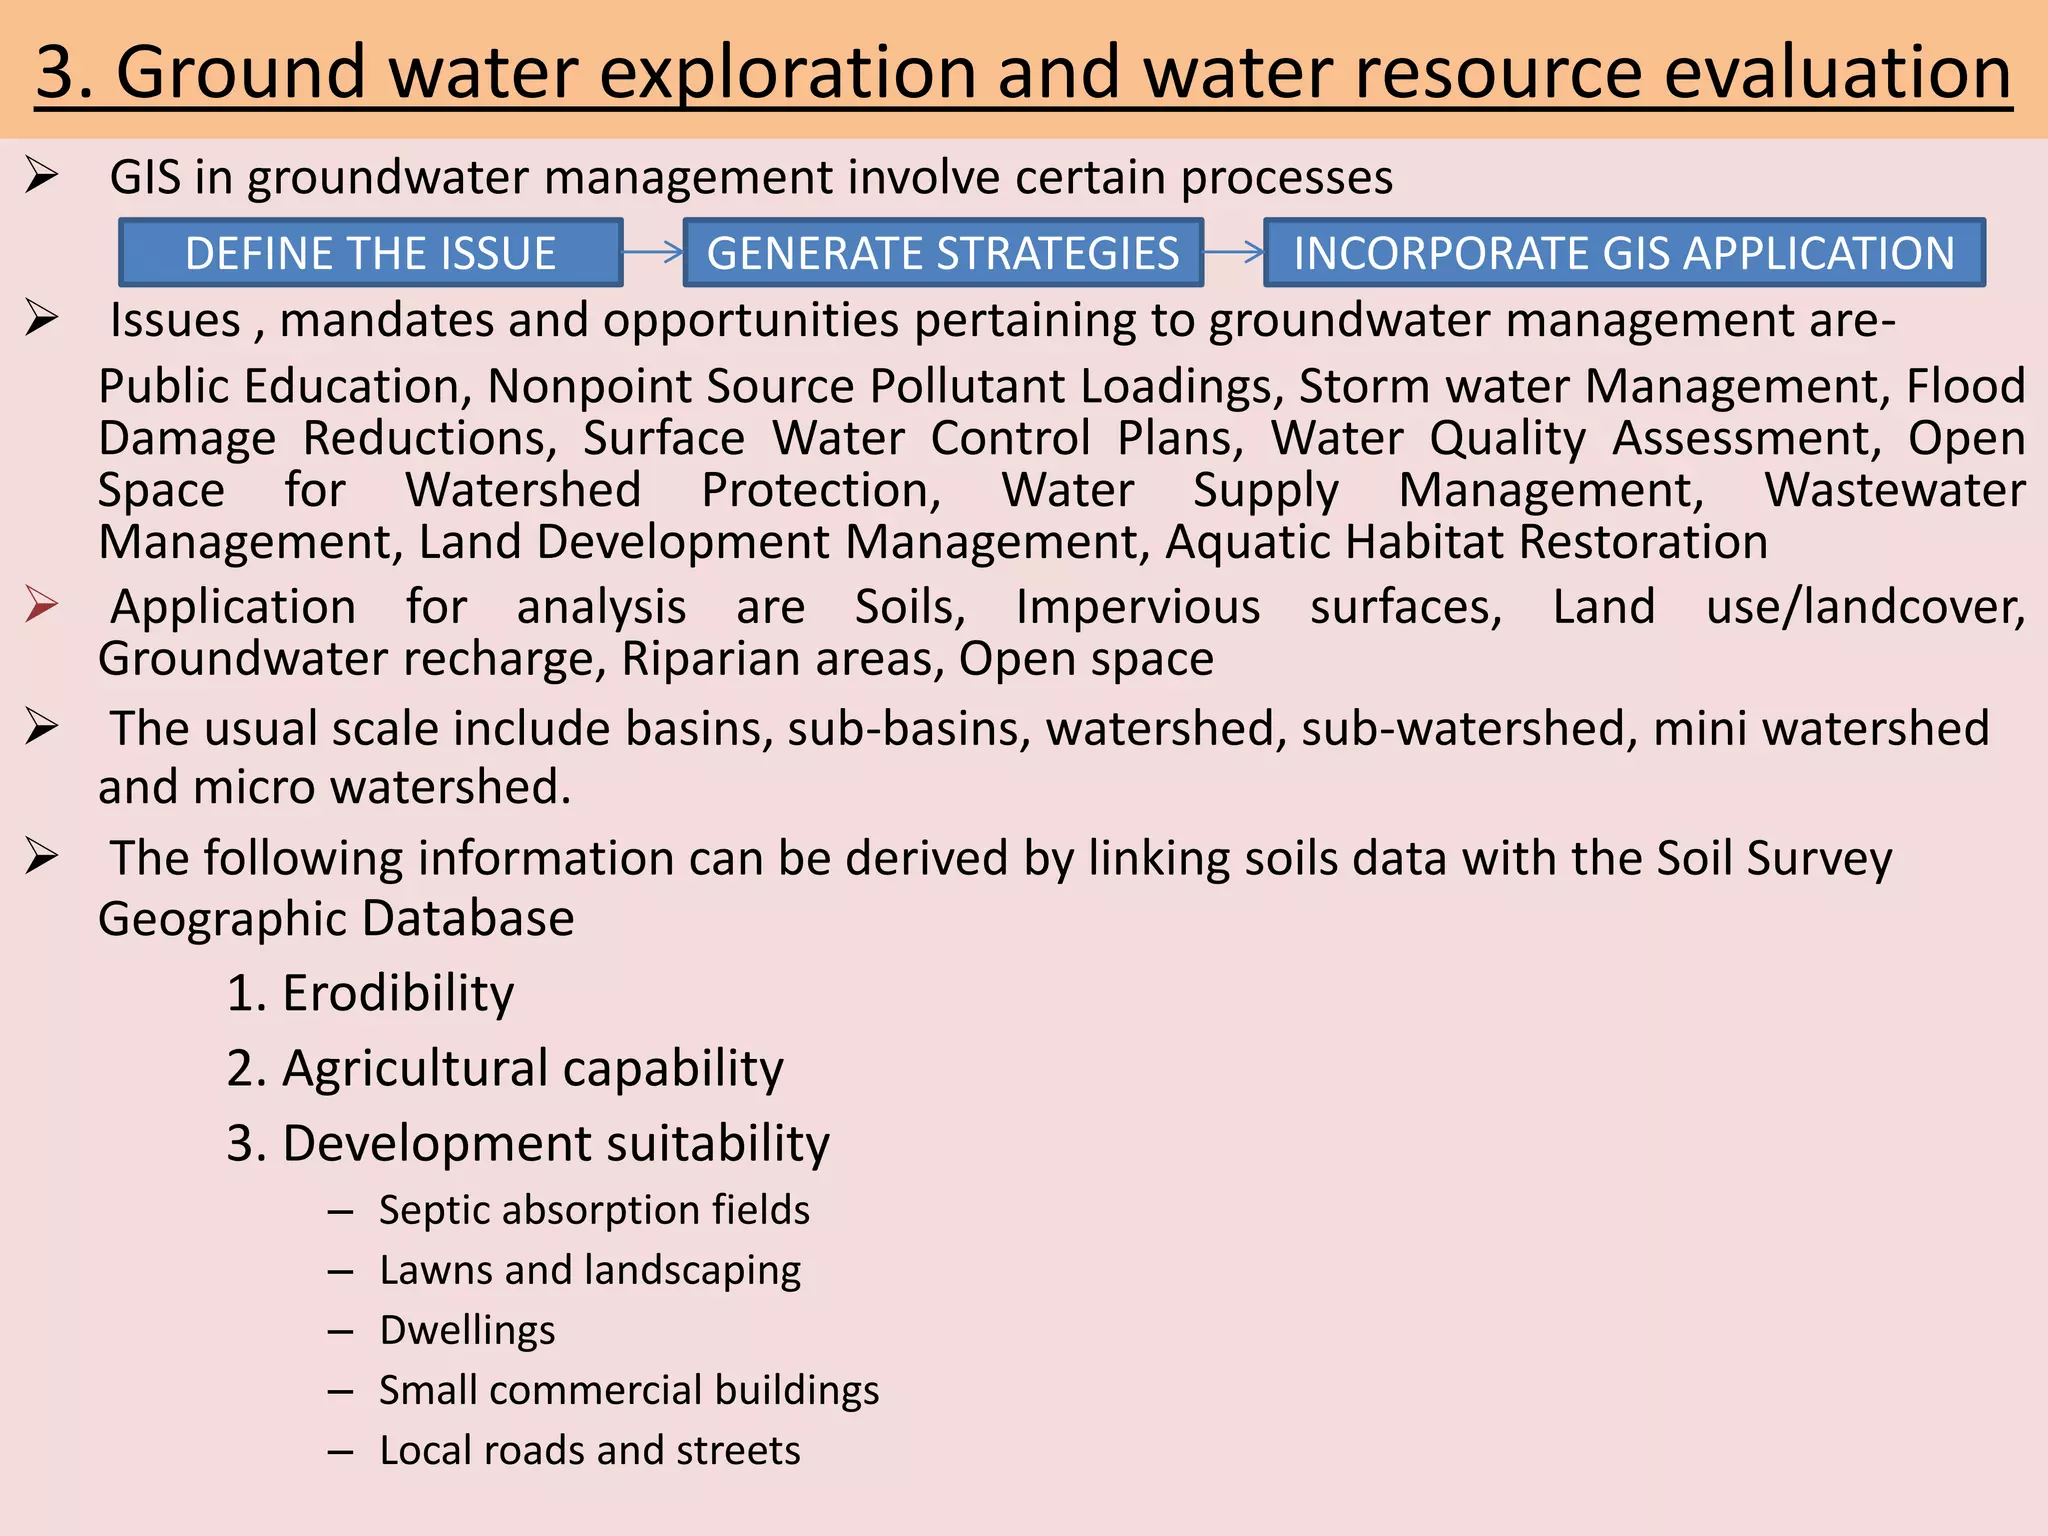
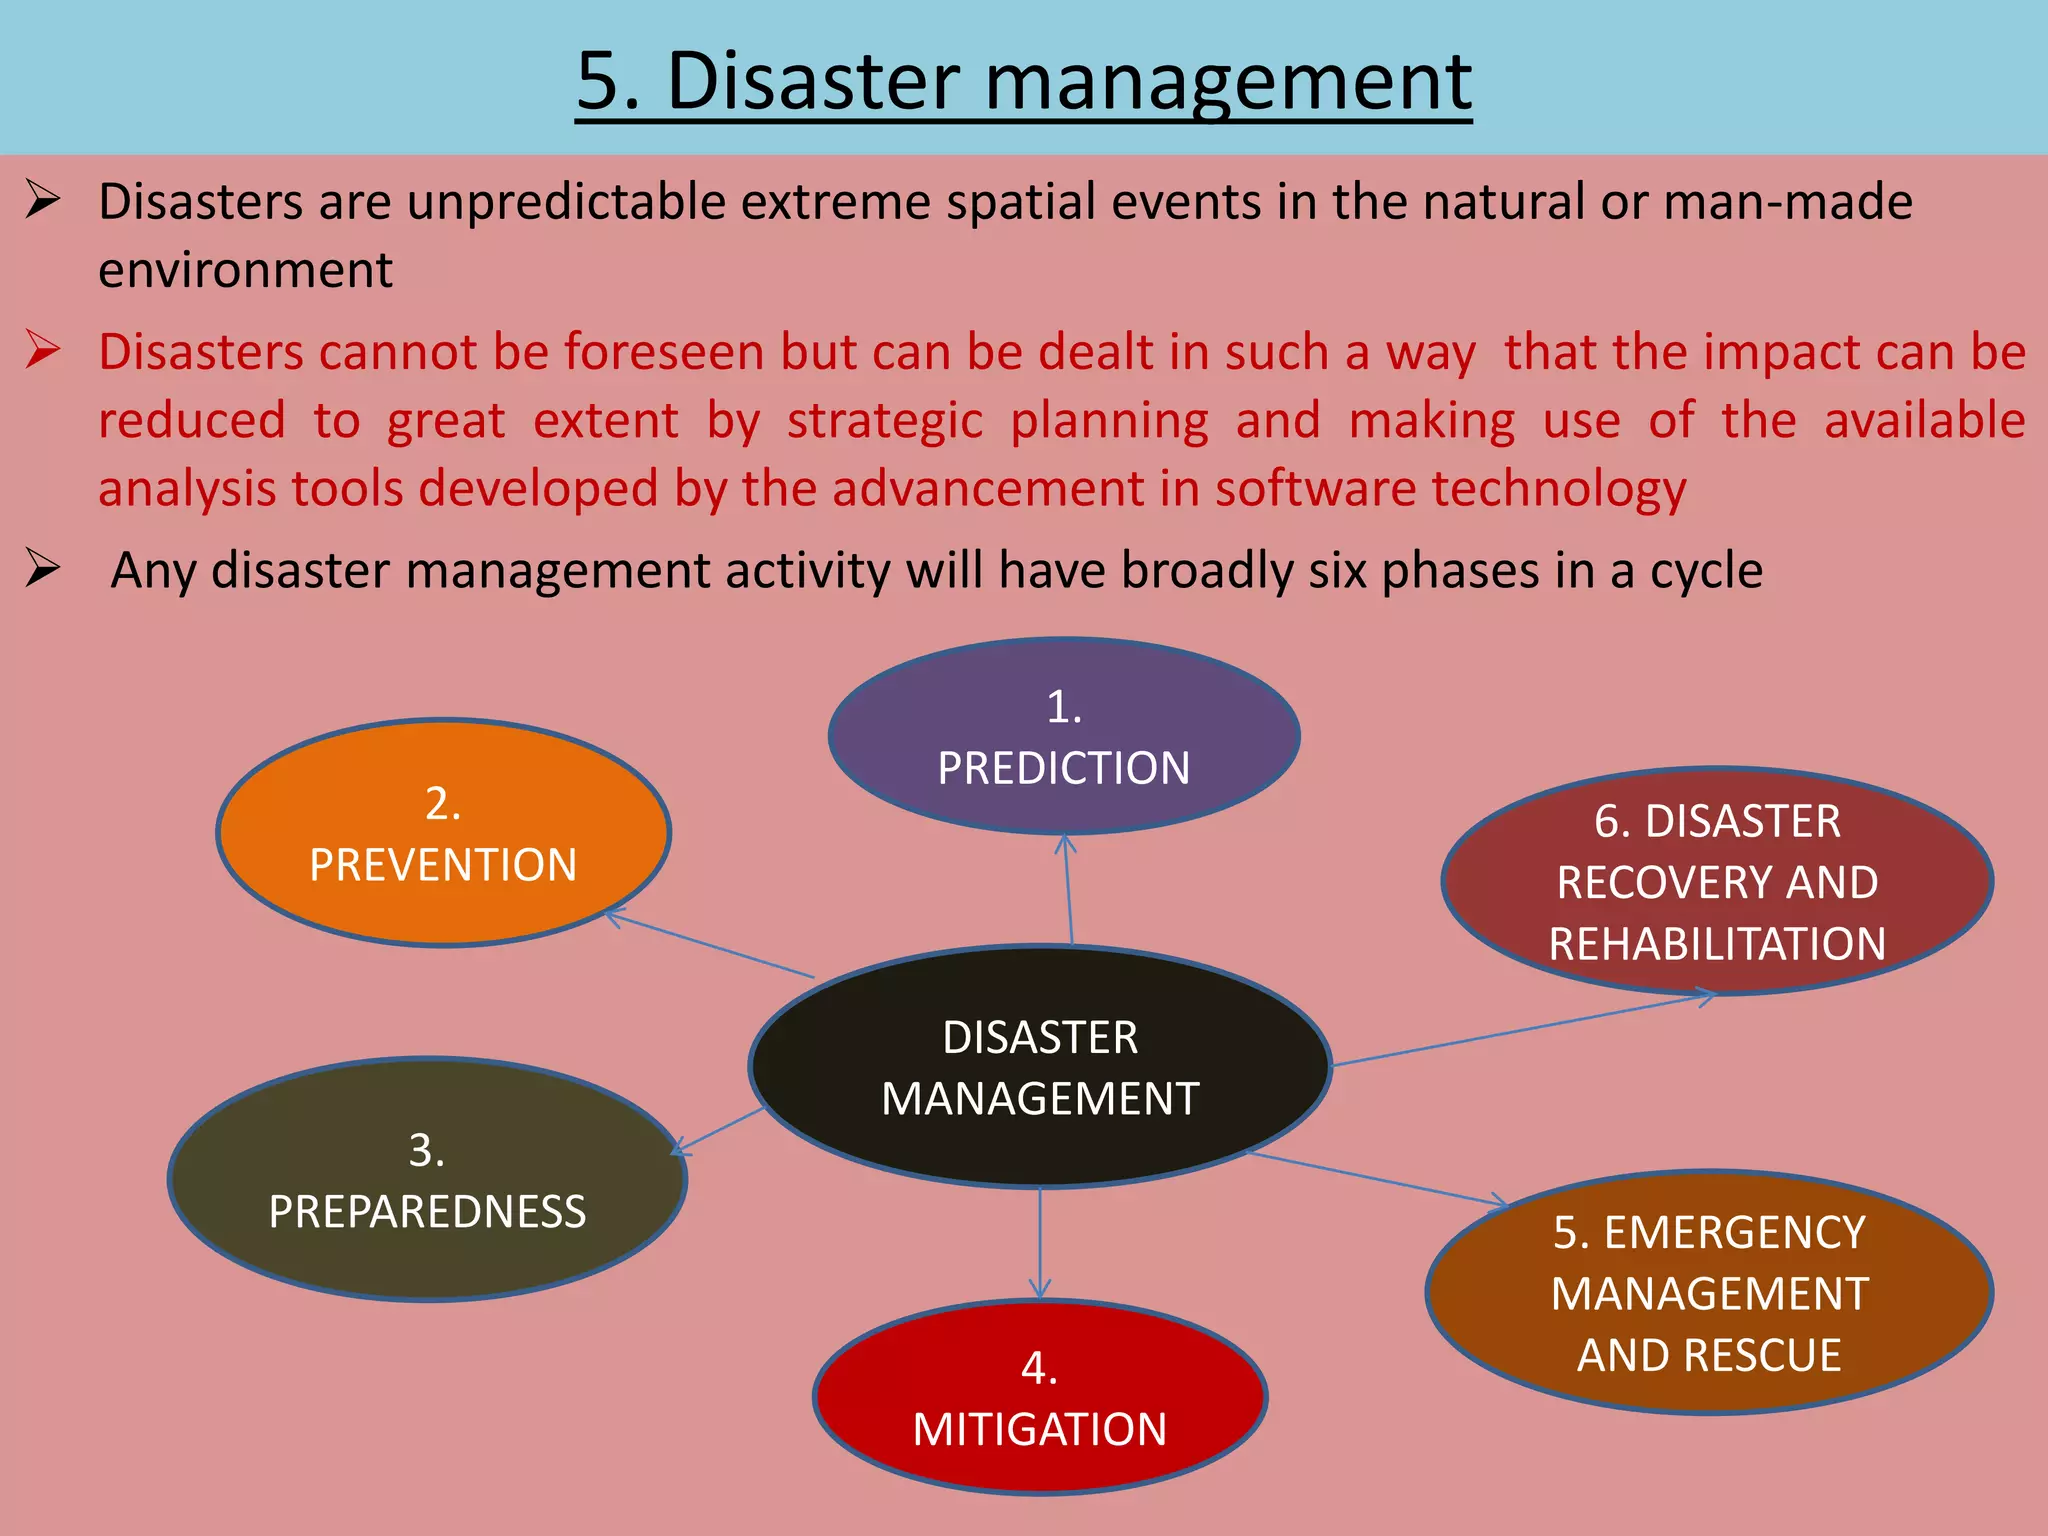
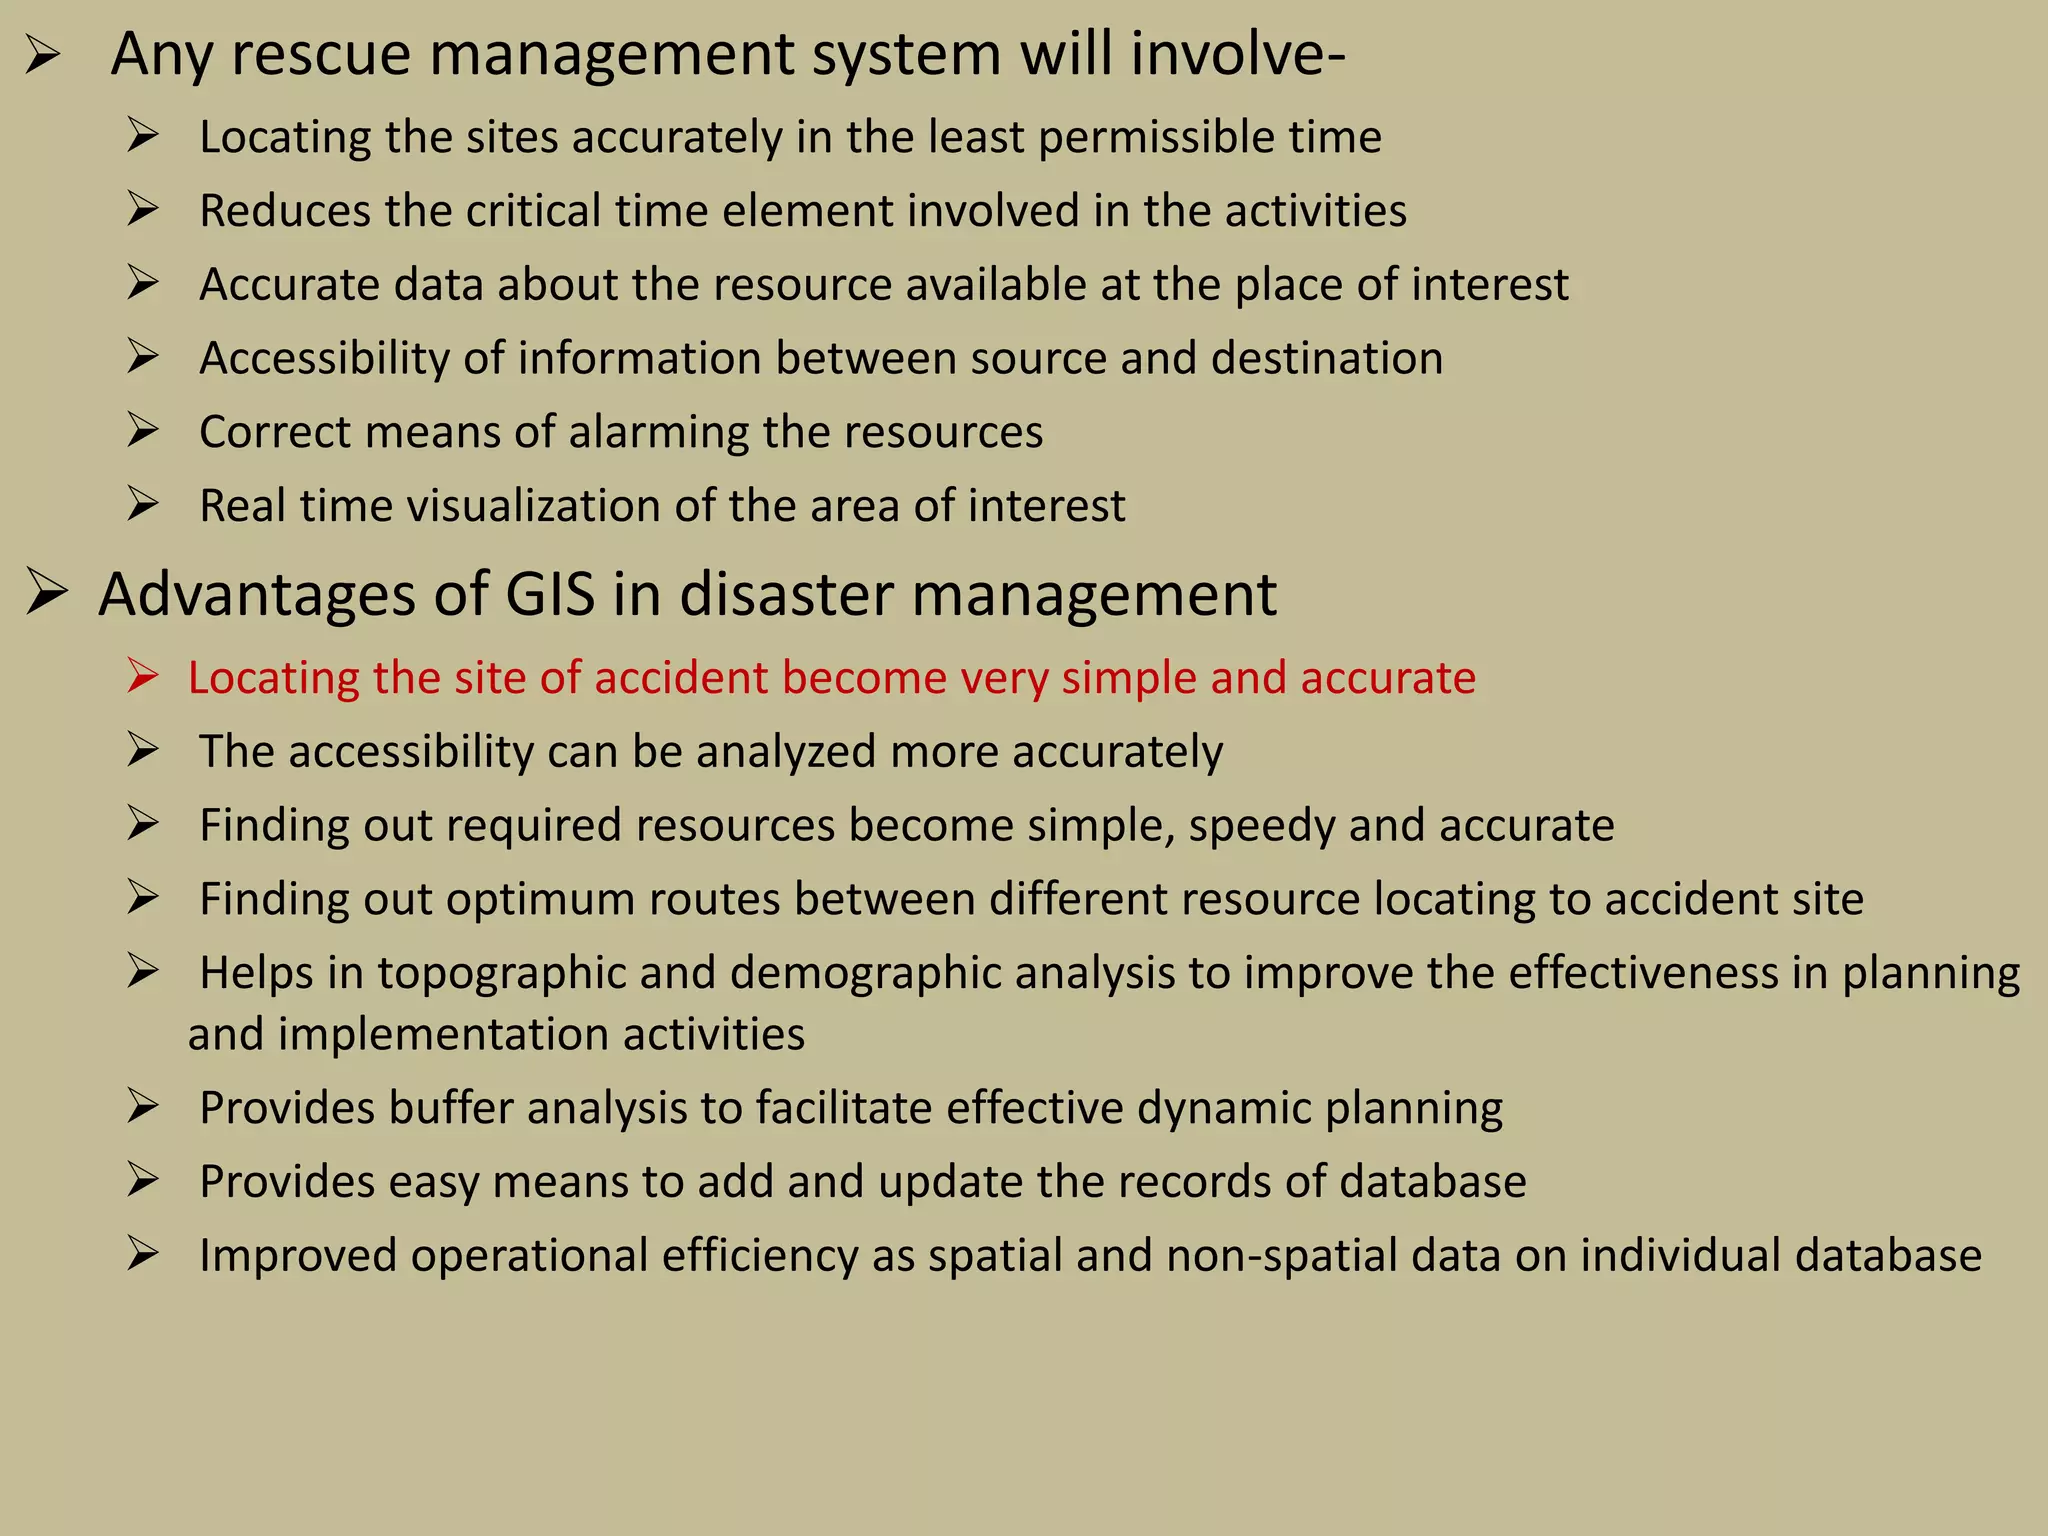
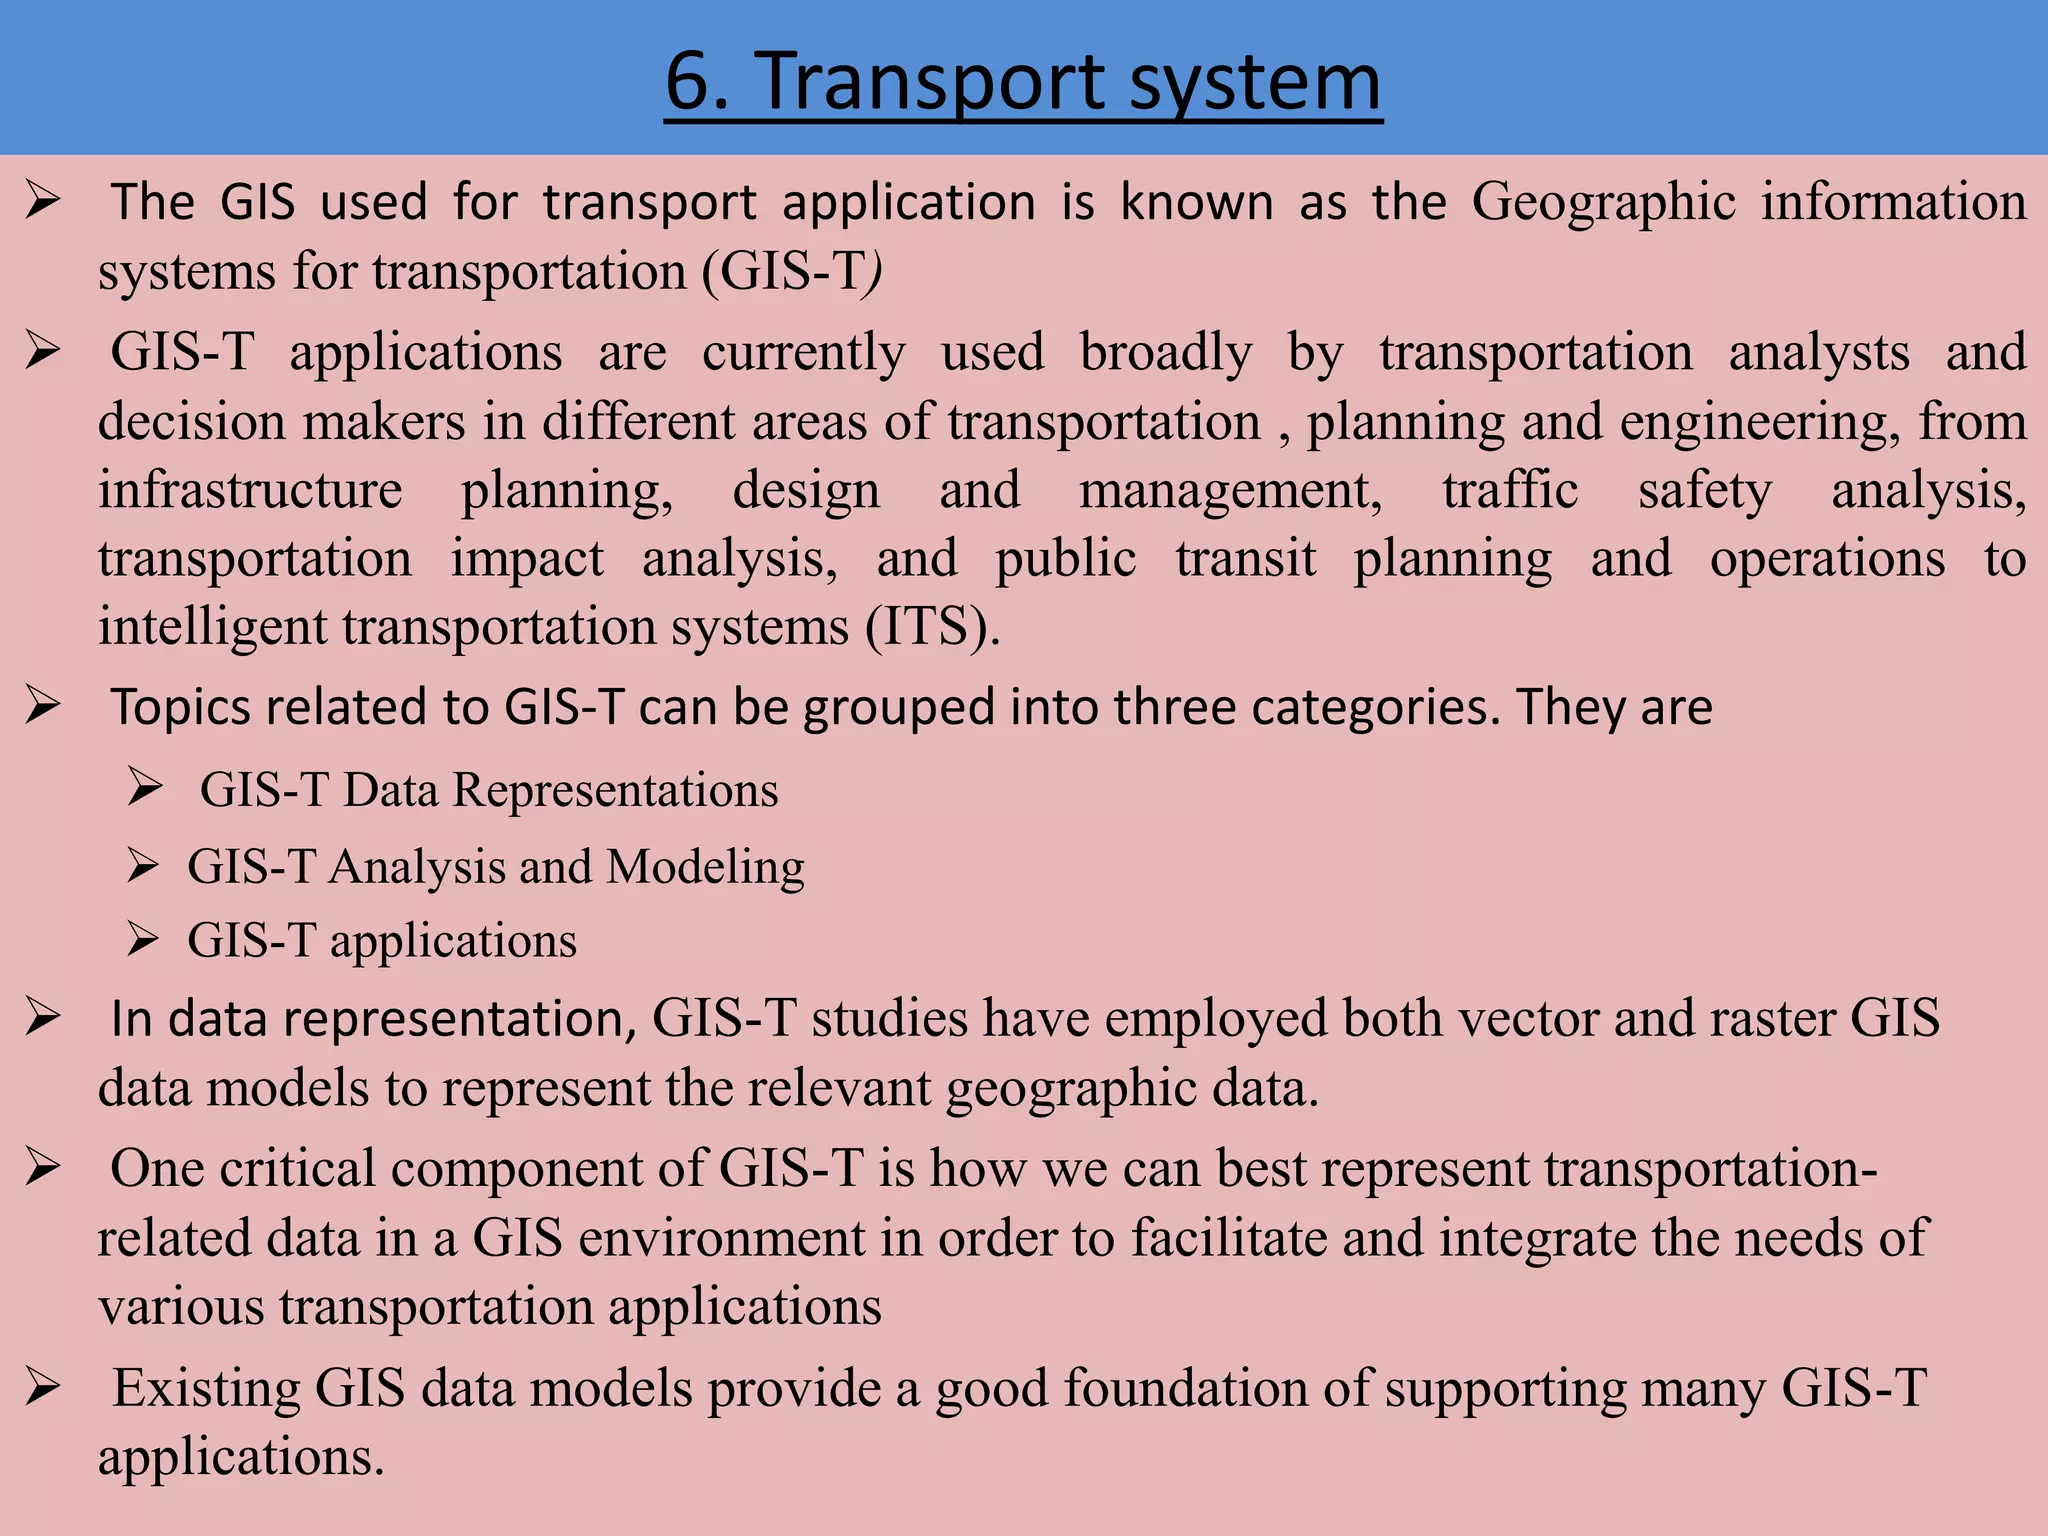
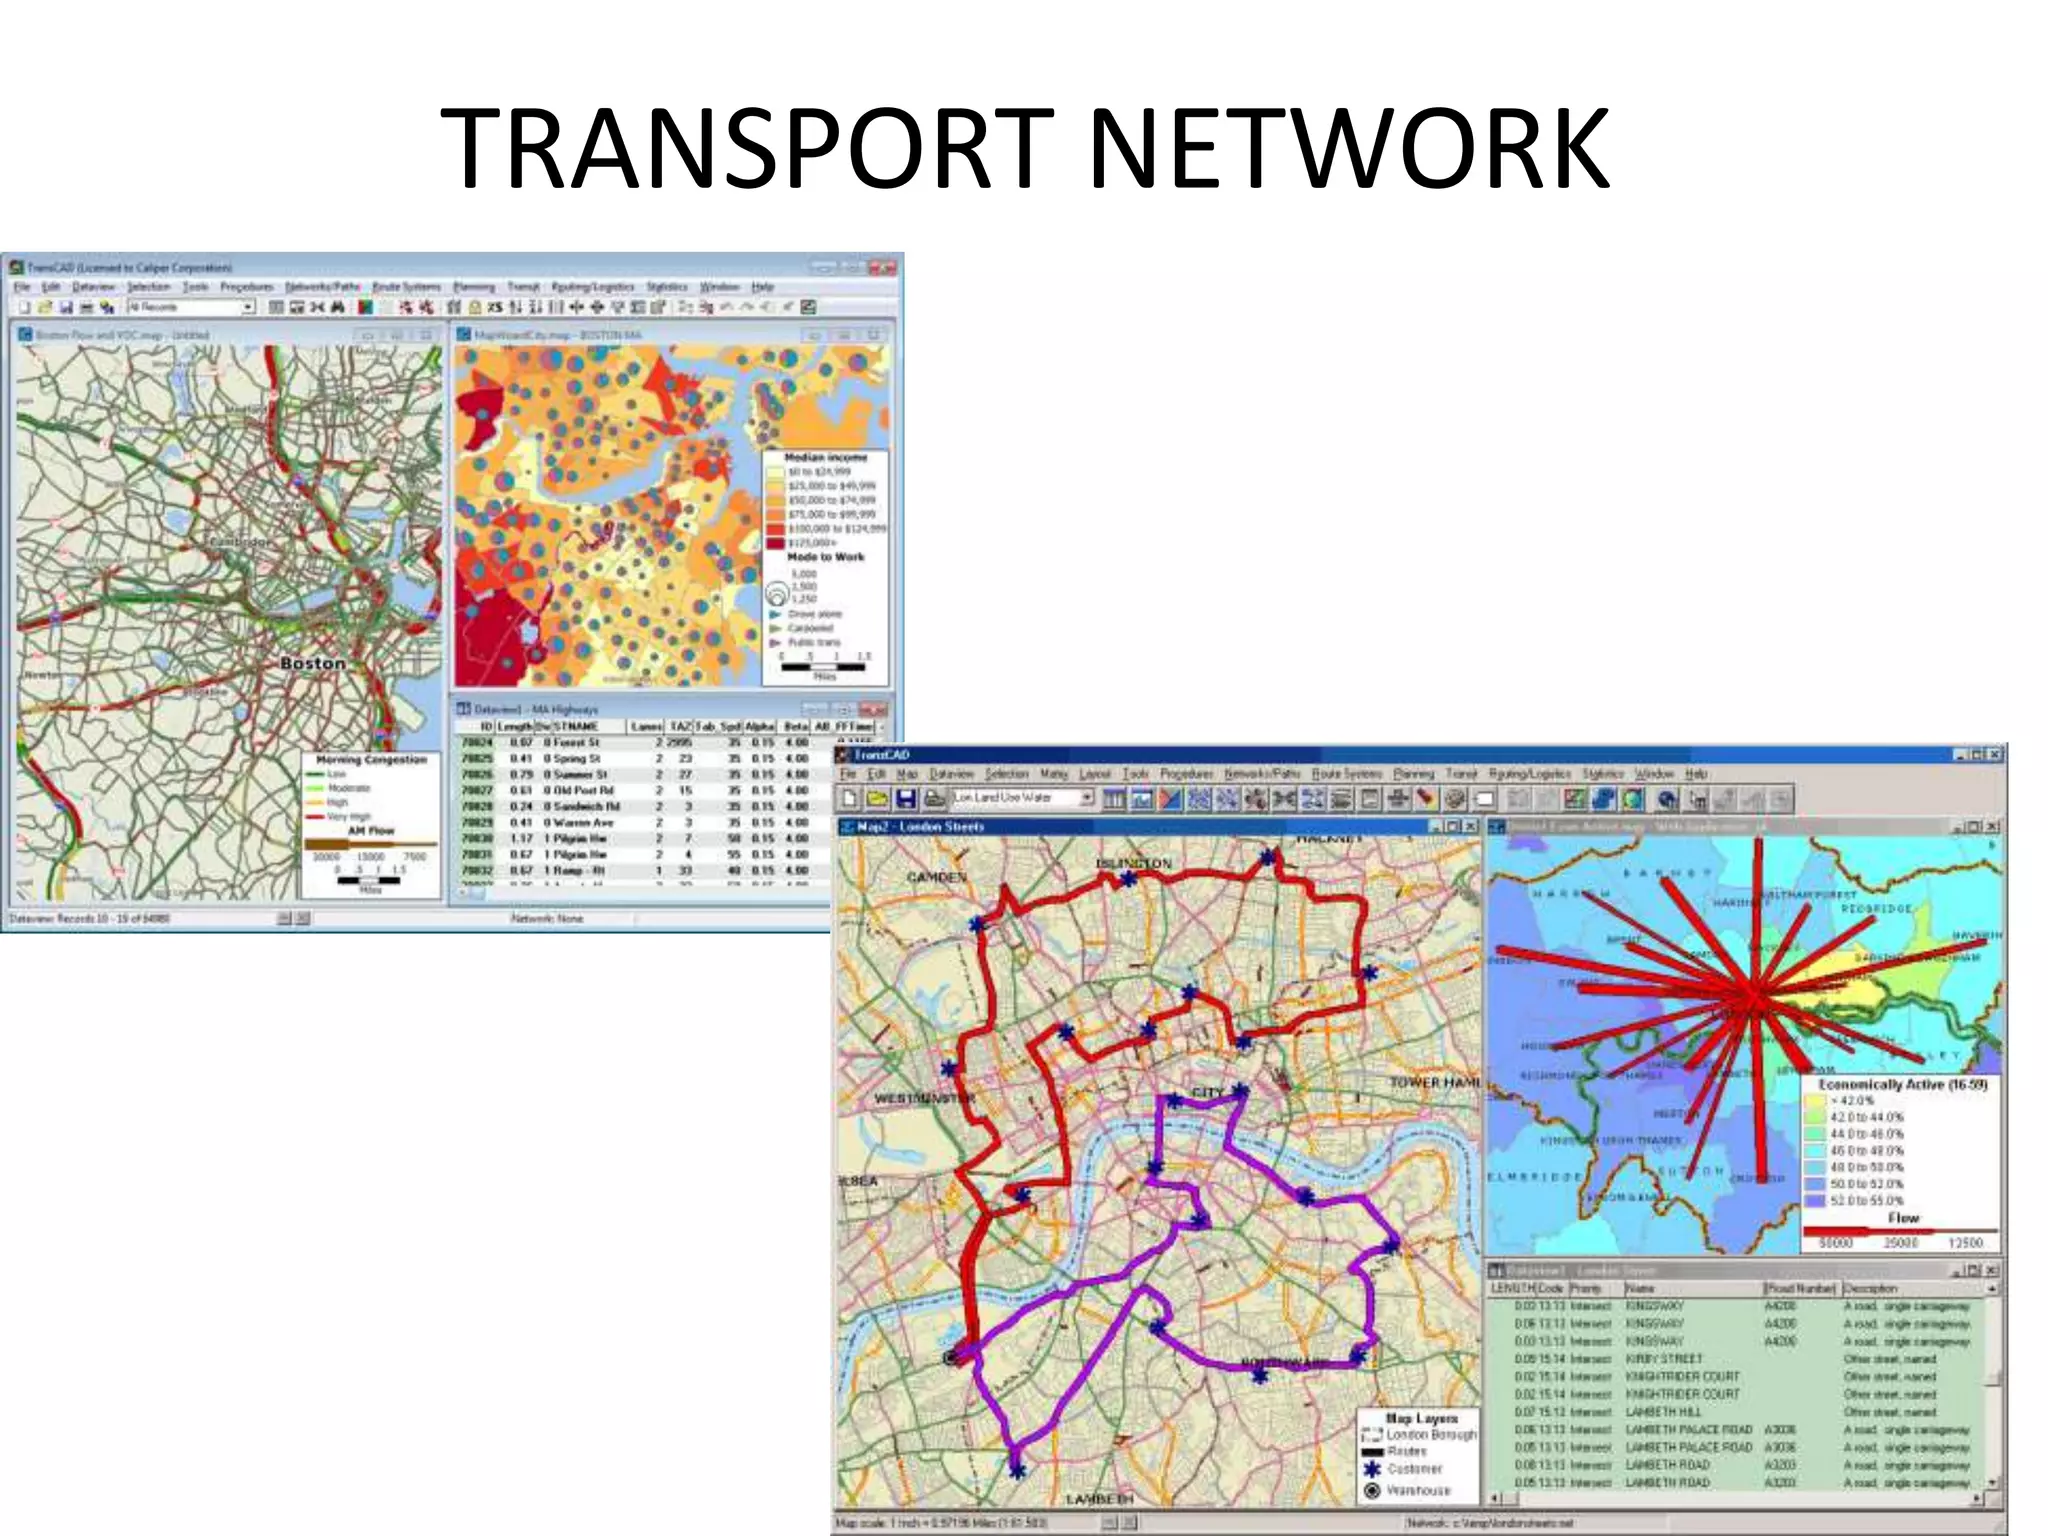
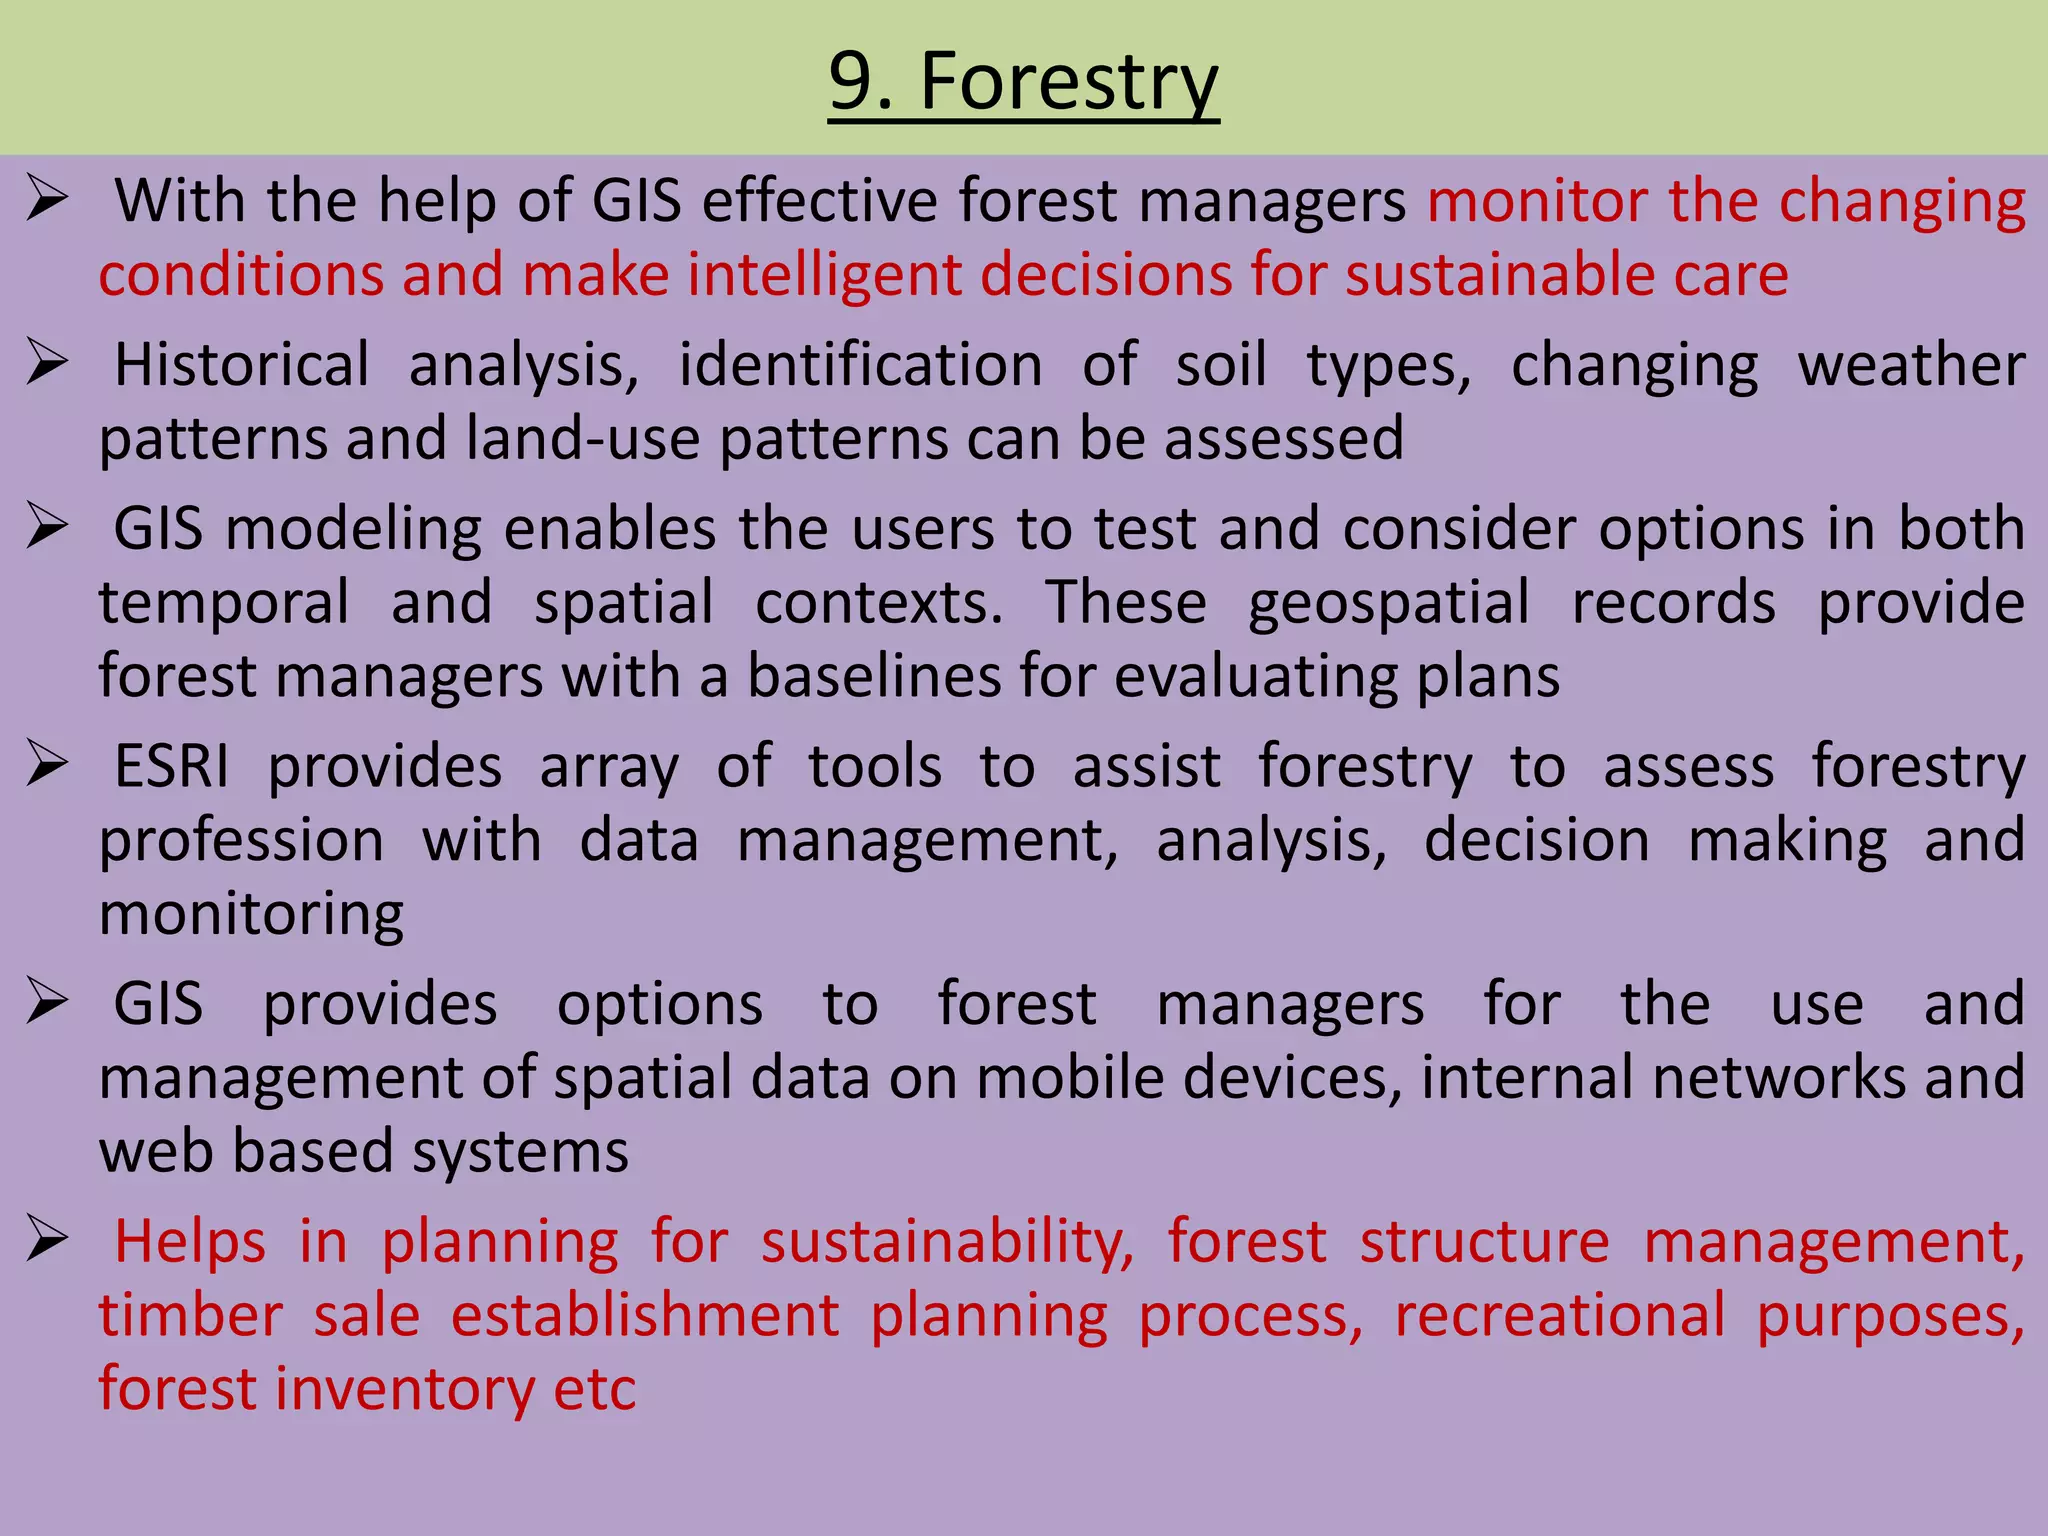
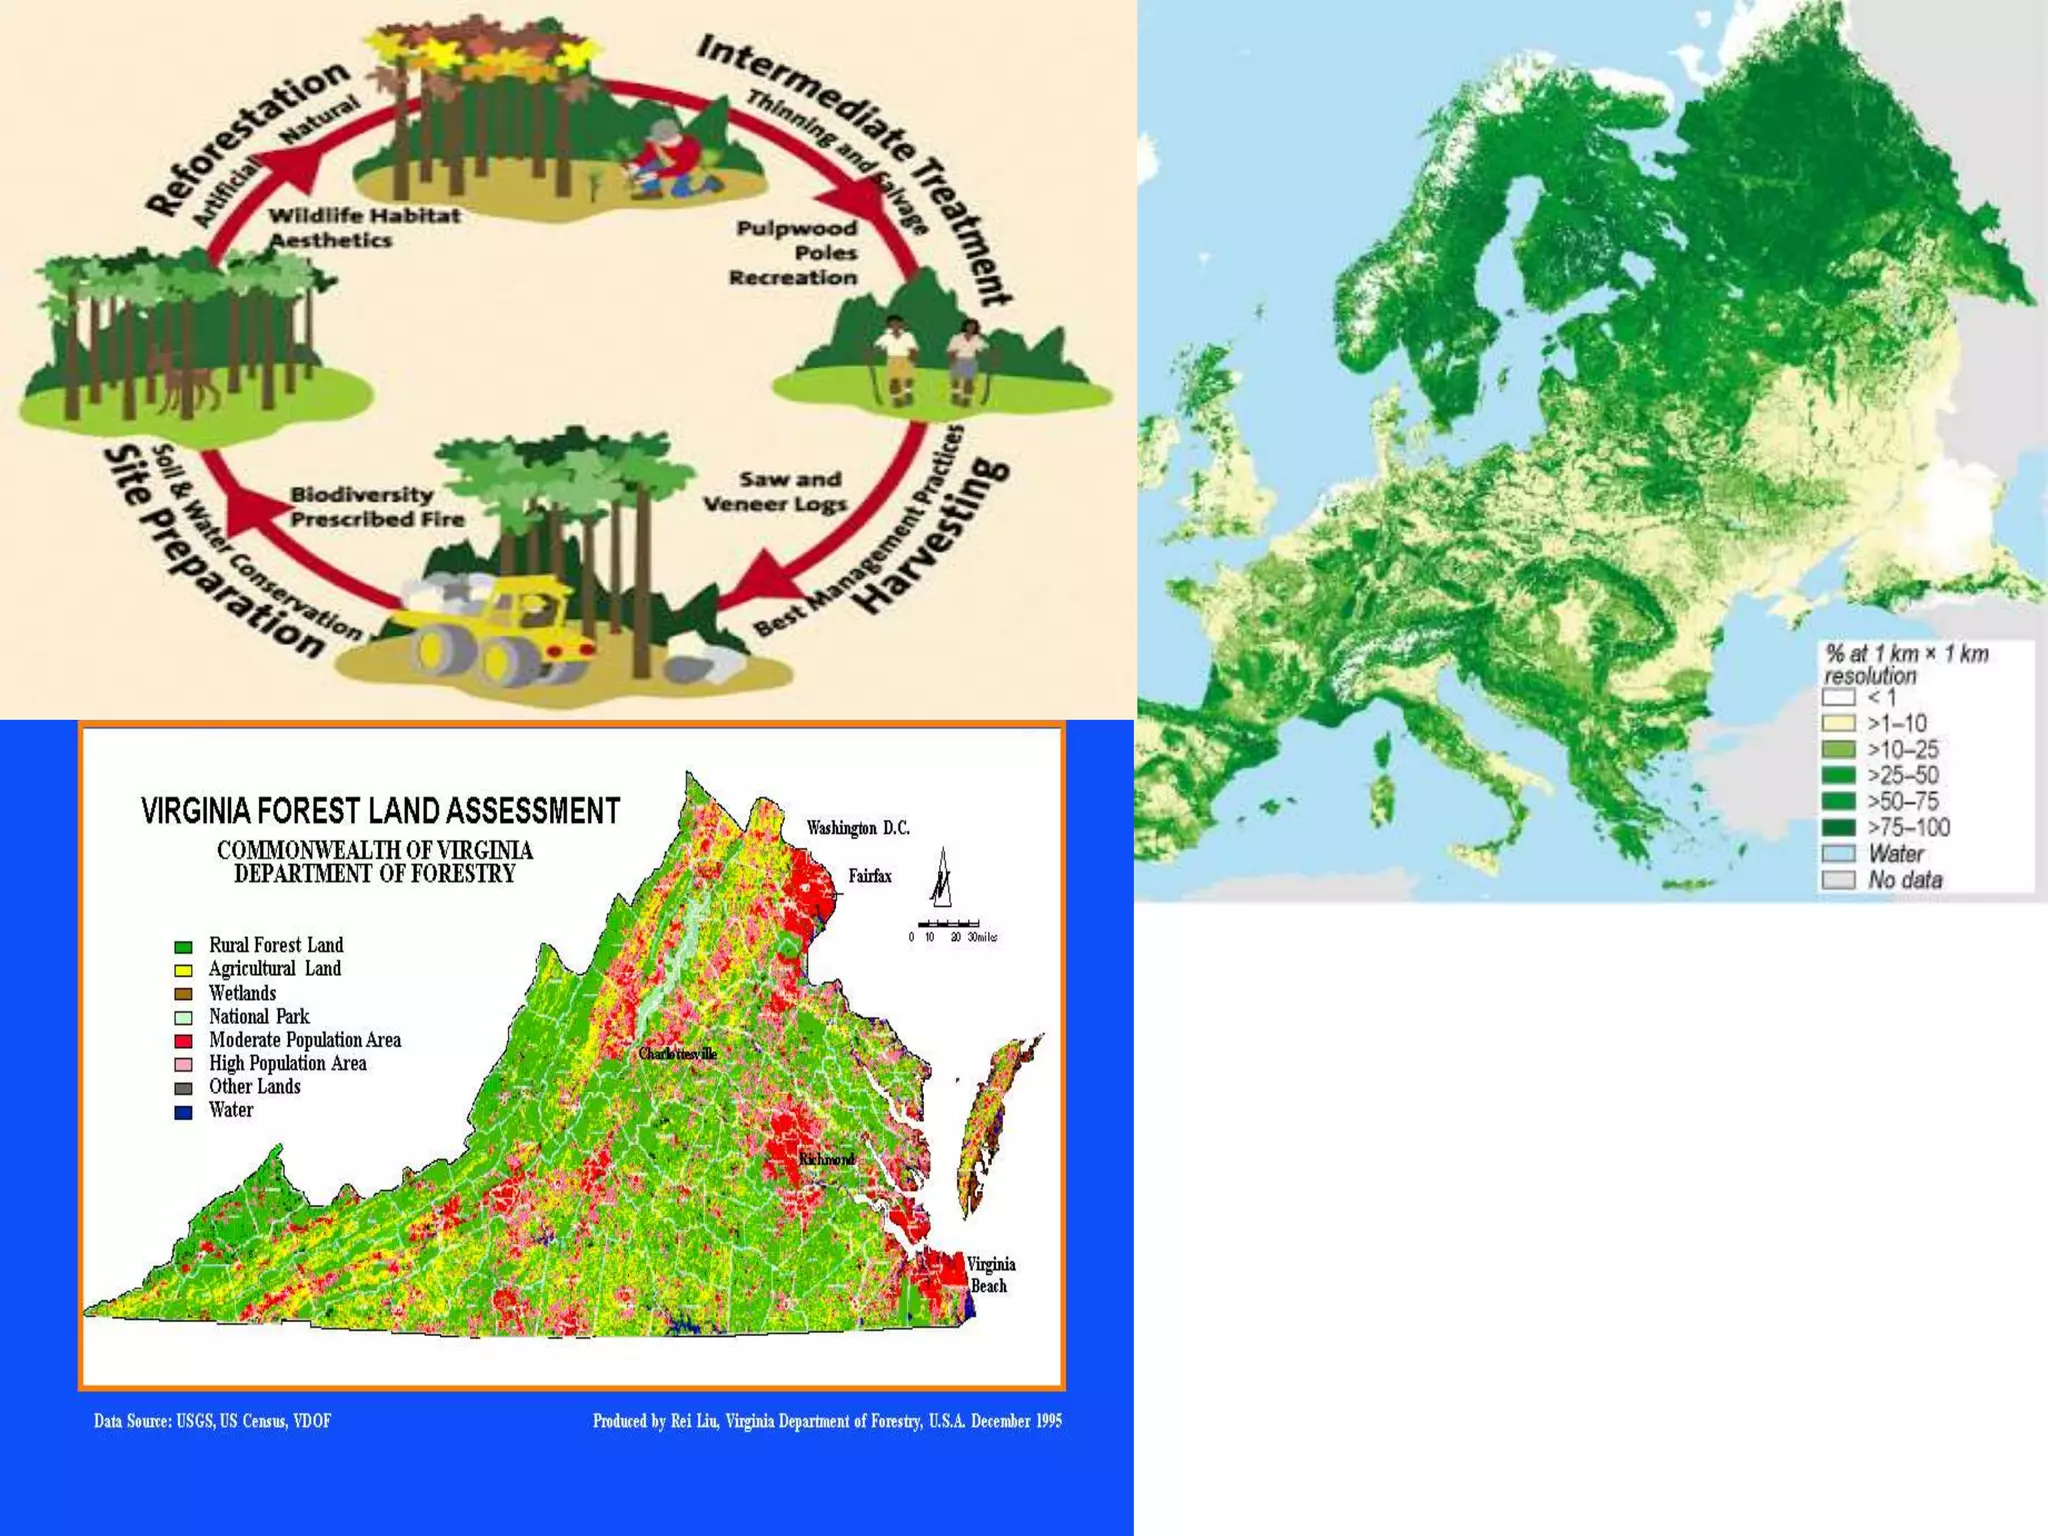
KEMBAR78
Applications of gis | PPTX
APPLICATIONS OF GIS
CONTENTS
1. Introduction
2. Capabilities and modules of GIS
3. GIS Applications
4. Conclusion
5. Reference
INTRODUCTION
 GIS is an information system that is used to input, store, retrive,
manipulate, analyze and output geographically referenced data or
geospatial data in order to support decision making for planning and
management of land use, natural resources, environment,
transportation, urban facilities and other administrative records.
 The components of GIS-
CAPABILITIES AND MODULATION OF GIS
 The capabilities of GIS are shortlisted below
1. Data capture/input
2. Management
3. Manipulation
4. Analysis
a. Queries
b. Buffer
c. Point in polygon
d. Polygon overlay
e. Geo-coding
f. Network operations
5. Modeling
a. Identify or predict a process
b. Diffusion
c. Interaction
d. What-if scenario
6. Display/output- exploratory and cartography
1. Geological mapping and interpretation
 Different types of maps are used for different purposes and different maps can
have many symbols or only one symbol depending on what one is trying to show
 Maps might use nominal data, categorial data, ordinal data and numerical data
 Example of a categorial data is as given below-
points lines polygons
 Ordinal data are those which are grouped by rank according to some
quantitative measures
 The data must be represented by unique values maps and colours
must show or portray an increasing sense of value
 Numerical data are those that represent continuous phenomena that
fall along a regularly spaced interval
-Rainfall, elevations, populations, chemical concentrations, etc.
Unclassed map
Classed map
1. Normalized data map
2. Dot density map
3. Chart map
RASTAR DATA
THEMATIC RASTAR IMAGE RASTAR
DISCRETE CONTINUOUS STRETCHED COMPOSED
Uses
unique
value
classificatio
n. Each
value has
its unique
color. Eg-
geological
map
CLASSIFIED STRETCHED
The values are
divided into
classes and
the classes are
given color
Values are
scaled to one
of 256 colors
Applied to
single band
width
images.eg-
grey scale
images
Varies value
from 0 to
255 per
bandwidth
a.Stretching the values on a single and
image- a one std dev. stretch b) Stretched by one std dev. c) same image not stretched
a.Stretched green
bandwidth
b.RGB composite
2. Mining and mineral exploration
 GIS play a very important role in the mining and exploration of minerals.
 The two most important contributions of GIS in this area is its time efficiency and
cost benefits
 TIME EFFICIENCY-
1. Can combine data and databases from different sources with ease
2. Can incorporate historical data from GSI records efficiently
3. Can link directly from modeling software to databases of results ensuring
the most recent assay information from analytical testing
4. Can model quickly and easily in 3D the resource one is exploring from both
historical and modern drill hole data stored in the database
 COST BENEFITS-
1. Less man hours are spent digitizing to incorporate data into models
2. There are variety of GIS analysis methods on quantitative and rastar data
for anomalous areas
3. Old data of different types can be captured and viewed as analytical layers
4. Ability to utilize free historical and modern data in current projects
 Using GIS in mineral exploration encourages a more efficient use
already existing data which is cost effective
 Exploration cost are rising, exploration drilling can be expensive, rate
of discovery of large world class ore bodies is decreasing- however re
analysis of existing data both modern and historical through GIS 3D
modeling allows for more targeted and cost effective drilling
operations
 Pipelines, electric lines, roads, ramps, and other mining facilities
change frequently
 Engineers and operations staff use GIS for facility planning
applications
 Keeping track of existing infrastructure and integrating it with the
mine plan and block models can be achieved with GIS
 GIS can also be used to integrate recent survey data with block
models or mine design data from other mining software packages
such as Geo Soft, Vulcan, Mine Sight, SURPAC Range, or Mining
Visualization System (MVS).
3. Ground water exploration and water resource evaluation
 GIS in groundwater management involve certain processes
 Issues , mandates and opportunities pertaining to groundwater management are-
Public Education, Nonpoint Source Pollutant Loadings, Storm water Management, Flood
Damage Reductions, Surface Water Control Plans, Water Quality Assessment, Open
Space for Watershed Protection, Water Supply Management, Wastewater
Management, Land Development Management, Aquatic Habitat Restoration
 Application for analysis are Soils, Impervious surfaces, Land use/landcover,
Groundwater recharge, Riparian areas, Open space
 The usual scale include basins, sub-basins, watershed, sub-watershed, mini watershed
and micro watershed.
 The following information can be derived by linking soils data with the Soil Survey
Geographic Database
1. Erodibility
2. Agricultural capability
3. Development suitability
– Septic absorption fields
– Lawns and landscaping
– Dwellings
– Small commercial buildings
– Local roads and streets
DEFINE THE ISSUE GENERATE STRATEGIES INCORPORATE GIS APPLICATION
 Impervious surface estimations can be derived from land use/land cover data.
 The chart on the right can be used as
a guide to develop strategies for preservation,
restoration or management, depending on the
level of impervious surface.
 Landuse/landcover data can be used to
calculate change in over a period of time
of the following land use/landcover types:
– Urban land
– Agricultural land
– Forest
– Water
– Wetlands
– Barren land
 These data can be used to inform analyses, such as groundwater recharge, riparian
areas and open space.
 Ground water recharge combines land use/landcover, soils and precipitation data
to estimate the amount of groundwater recharge for any area
 Riparian area data are created by combining relevant features into one GIS data
set- water, adjacent wetlands, wetland transition areas, flood areas, adjacent
hydric and alluvial soil
 To quantify riparian area, areas of development are removed using
landuse/landcover data
 To evaluate riparian health, determine the extent of forest crown closure,
impervious surfaces and barriers and alterations to stream flow such as managed
stream segments, dams and road crossings.
 To visualize and prioritize future open space acquisitions, view GIS data that fit the
specified objectives for acquisition with existing open space, easement and parcel
data. Water, wetlands, transition areas, flood hazard areas, Forests, steep slopes,
farmlands, wildlife habitats, etc. The data are not limited and include many other
TOPOGRAPHIC
SHEET
SATELLITE DATA FIELD DATA EXISTING DATA
DIGITAL IMAGE
PROCESSING
GW SAMPLING
CHEMICAL
ANALYSIS
GIS AND THEMATIC
MAP GENERATION
SPATIAL ANALYSIS
FOR DRINKING
WATER
SPATIAL INTEGRATION SPATIAL ANALYSIS FOR
IRRIGATION WATER
GW QUALITY MAP
Fig. Methodology used for integrated groundwater quality mapping
4. Environmental analysis
 The main aim of doing environment analysis is to accumulate
information pertaining to the environment and to understand the
environmental processes and linkages
 The main objective is to gather information pertaining to
environmental phenomena and processes and also to gain
understanding and insight
 Environmental problems are spatial problems
 Environmental data can almost always be geo-referenced and
therefore GIS serves as an ample tool for environmental analysis
 GIS for environmental analysis is used to explore the spatial
relationships, patterns and process of geographic, biological and
physical phenomena
 Geospatial analysis offers insight about the environment and reveals
management options through surface interpolation, temporal
analysis and 3D analysis
5. Disaster management
 Disasters are unpredictable extreme spatial events in the natural or man-made
environment
 Disasters cannot be foreseen but can be dealt in such a way that the impact can be
reduced to great extent by strategic planning and making use of the available
analysis tools developed by the advancement in software technology
 Any disaster management activity will have broadly six phases in a cycle
DISASTER
MANAGEMENT
2.
PREVENTION
1.
PREDICTION
6. DISASTER
RECOVERY AND
REHABILITATION
3.
PREPAREDNESS
4.
MITIGATION
5. EMERGENCY
MANAGEMENT
AND RESCUE
 Any rescue management system will involve-
 Locating the sites accurately in the least permissible time
 Reduces the critical time element involved in the activities
 Accurate data about the resource available at the place of interest
 Accessibility of information between source and destination
 Correct means of alarming the resources
 Real time visualization of the area of interest
 Advantages of GIS in disaster management
 Locating the site of accident become very simple and accurate
 The accessibility can be analyzed more accurately
 Finding out required resources become simple, speedy and accurate
 Finding out optimum routes between different resource locating to accident site
 Helps in topographic and demographic analysis to improve the effectiveness in planning
and implementation activities
 Provides buffer analysis to facilitate effective dynamic planning
 Provides easy means to add and update the records of database
 Improved operational efficiency as spatial and non-spatial data on individual database
6. Transport system
 The GIS used for transport application is known as the Geographic information
systems for transportation (GIS-T)
 GIS-T applications are currently used broadly by transportation analysts and
decision makers in different areas of transportation , planning and engineering, from
infrastructure planning, design and management, traffic safety analysis,
transportation impact analysis, and public transit planning and operations to
intelligent transportation systems (ITS).
 Topics related to GIS-T can be grouped into three categories. They are
 GIS-T Data Representations
 GIS-T Analysis and Modeling
 GIS-T applications
 In data representation, GIS-T studies have employed both vector and raster GIS
data models to represent the relevant geographic data.
 One critical component of GIS-T is how we can best represent transportation-
related data in a GIS environment in order to facilitate and integrate the needs of
various transportation applications
 Existing GIS data models provide a good foundation of supporting many GIS-T
applications.
TRANSPORT NETWORK
 Like many other fields, transportation has developed its own unique analysis
methods and models. Examples include
– shortest path and routing algorithms,
– spatial interaction models,
– network flow problems,
– facility location problems,
– travel demand models, and
– land use-transportation interaction models.
 GIS-T application
GIS-T APPLICATION
Manage Land Records
Marketing Trade Area Analysis
Customer Profiling
Urban Planning
Risk Analysis
Sales ManagementSite Selection
Asset Management
Transportation/Logistics
Manage Land Records
7. Demographic analysis
 GIS in demographic analysis is done for population estimation
 Related spatial analytic tools are used to provide greater
understanding of the spatial patterning of demographic trends over
time
 Population estimate can be done both by direct method and indirect
method
 Direct method tracks construction and occupation of housing units
 Indirect method tracks the component of change through an
accounting procedure- births, deaths, migration of individual in and
out of a given geography
 Population estimation is done based on accurate allocation of events
through a process known as geo-coding which converts descriptive
locations (addresses) to geo referenced locations (X, Y coordinates)
 This is achieved by referencing an address to a location on a road
network. The process is also known as road network
8. Agricultural development
 The ability of GIS to analyze and visualize agricultural environments and workflows
has proved to be very beneficial to those involved in the farming industry.
 From mobile GIS in the field to the scientific analysis of production data at the
farm manager's office, GIS is playing an increasing role in agriculture production
throughout the world by helping farmers increase production, reduce costs, and
manage their land more efficiently.
 The natural inputs in farming cannot be controlled however, they can be better
understood and managed with GIS applications such as crop yield estimates, soil
amendment analyses, and erosion identification and remediation
 Crop-specific maps, created by combining survey data and satellite images, literally
provides the lay of the land for farmers and agribusinesses such as seed and
fertilizer companies
 Reliable crop information is vital to the functioning of grain markets. It is used to
inform decisions on planting, marketing, and policy.
 Applying GIS to the process of preparing crop estimates has improved accuracy
while lowering costs.
 The aerial survey determines which crop is planted in the field
represented by each sample point
 The field observer notes which crop is planted at the sample point
and whether it is dry land or irrigated cultivation. Additional
information, such as growth problems or areas of double-cropping is
also captured
 The field data is captured and stored in shape file format. This data is
uploaded to a central server on a daily basis and imported into a SQL
Server database. Expansion statistics are used to calculate estimates
of the area planted in each grain crop on a provincial basis.
 The use of GIS has greatly improved crop estimates in many countries
and resulted in more cost- effective, accurate, and objective grain
area estimates.
Producer Independent Crop Estimate System (PICES)
 The Producer Independent Crop Estimate System (PICES) was
developed in 2005
 PICES uses crop field boundaries digitized from satellite imagery with
a point frame sampling system to objectively estimate the area
planted with grain crops.
 The PICES process consists of the following steps:
1. Obtain satellite imagery.
2. Digitize crop field boundaries from satellite imagery.
3. Design the point frame and select random sample point.
4. Use aerial survey sample points to capture crop data.
5. Perform statistical analysis.
 Digitized fields are stratified based on the probability of finding a
crop.
9. Forestry
 With the help of GIS effective forest managers monitor the changing
conditions and make intelligent decisions for sustainable care
 Historical analysis, identification of soil types, changing weather
patterns and land-use patterns can be assessed
 GIS modeling enables the users to test and consider options in both
temporal and spatial contexts. These geospatial records provide
forest managers with a baselines for evaluating plans
 ESRI provides array of tools to assist forestry to assess forestry
profession with data management, analysis, decision making and
monitoring
 GIS provides options to forest managers for the use and
management of spatial data on mobile devices, internal networks and
web based systems
 Helps in planning for sustainability, forest structure management,
timber sale establishment planning process, recreational purposes,
forest inventory etc
10. Tourism
 GIS in tourism holds many advantages to both tourists and tourism management
authorities
 Advantages for the tourists-
 Visualization of tourist sites. Ie, seeing what is available in the area they want to see
 Valuable information on tourist location can be embedded in the GIS- videos, photos,
product brochures
 Selective information such as route planning, accommodations, cultural events, special
attractions, etc
 Easily accessible information over the internet (web-based GIS)
 Interactive maps that correspond to user queries
 Advantages for development authorities
 To know where the customers are coming
 Planning like regional marketing, community infrastructure ( transportation, utilities
and zoning)
 Planning for new site selection
 As to know if one have the necessary space
 Utility of available resource
 Need to upgrade the transportation infrastructure to accommodate the additional
traffic
CONCLUSION
 GIS can input, store. Retrieve, manipulate, analyze and output
geospatial data
 ADVATAGES- It improves/enhances the effects of
physical/environmental growth
 better management of resources
 adding new value-added services
 perform analysis on spatial and non spatial components
 Do fast recall of data
 Perform complex analysis
 recalling of non spatial data through object location
 display of information in a different light/view
 multiple scenario in planning can be performed easily
 The applications of GIS at present is in scores of a hundred
and these are the mentioned only few
REFERENCE
 Basudeb Bhatta, 2008, 2011 Remote sensing and GIS, boblished by Oxford
University Press
 Paul A. Longley, Michael F. Goodchild, David J. Maguire, David W. Rhind,
Geographic Information Systems volume 1, 1999 by John Wiley and sons
 http://uregina.ca/piwowarj/geog303/12%20-%20Network%20Analysis.pdf
http://geog.hkbu.edu.hk/geog3600/Lect-10.pdf
http://www.esri.com/library/brochures/pdfs/gis-sols-for-env-mgmt.pdf
http://ifitt.org/admin/public/uploads/Avdimiotisfinal.pdf
http://www.aianta.org/uploads/FileLinks/94e1c28a87cc4792b0f74c481104e8
1a/A3_GIS_Tourism_Planning.pdf
http://www.geos.ed.ac.uk/~gisteac/gis_book_abridged/files/ch62.pdf
http://www.esri.com/library/bestpractices/sustainable-agriculture.pdf
http://www.doc.govt.nz/Documents/science-and technical/drds303entire.pdf
http://www.esri.com/library/bestpractices/wildlife-conservation.pdf
http://www.nrac.wvu.edu/classes/for326/GISInForestryReviewPaper.pdf
………..
Applications of gis
Applications of gis

Applications of gis

  • 1.
  • 2.
    CONTENTS 1. Introduction 2. Capabilitiesand modules of GIS 3. GIS Applications 4. Conclusion 5. Reference
  • 3.
    INTRODUCTION  GIS isan information system that is used to input, store, retrive, manipulate, analyze and output geographically referenced data or geospatial data in order to support decision making for planning and management of land use, natural resources, environment, transportation, urban facilities and other administrative records.  The components of GIS-
  • 5.
    CAPABILITIES AND MODULATIONOF GIS  The capabilities of GIS are shortlisted below 1. Data capture/input 2. Management 3. Manipulation 4. Analysis a. Queries b. Buffer c. Point in polygon d. Polygon overlay e. Geo-coding f. Network operations 5. Modeling a. Identify or predict a process b. Diffusion c. Interaction d. What-if scenario 6. Display/output- exploratory and cartography
  • 6.
    1. Geological mappingand interpretation  Different types of maps are used for different purposes and different maps can have many symbols or only one symbol depending on what one is trying to show  Maps might use nominal data, categorial data, ordinal data and numerical data  Example of a categorial data is as given below- points lines polygons
  • 7.
     Ordinal dataare those which are grouped by rank according to some quantitative measures  The data must be represented by unique values maps and colours must show or portray an increasing sense of value  Numerical data are those that represent continuous phenomena that fall along a regularly spaced interval -Rainfall, elevations, populations, chemical concentrations, etc.
  • 8.
    Unclassed map Classed map 1.Normalized data map 2. Dot density map 3. Chart map
  • 9.
    RASTAR DATA THEMATIC RASTARIMAGE RASTAR DISCRETE CONTINUOUS STRETCHED COMPOSED Uses unique value classificatio n. Each value has its unique color. Eg- geological map CLASSIFIED STRETCHED The values are divided into classes and the classes are given color Values are scaled to one of 256 colors Applied to single band width images.eg- grey scale images Varies value from 0 to 255 per bandwidth
  • 10.
    a.Stretching the valueson a single and image- a one std dev. stretch b) Stretched by one std dev. c) same image not stretched a.Stretched green bandwidth b.RGB composite
  • 11.
    2. Mining andmineral exploration  GIS play a very important role in the mining and exploration of minerals.  The two most important contributions of GIS in this area is its time efficiency and cost benefits  TIME EFFICIENCY- 1. Can combine data and databases from different sources with ease 2. Can incorporate historical data from GSI records efficiently 3. Can link directly from modeling software to databases of results ensuring the most recent assay information from analytical testing 4. Can model quickly and easily in 3D the resource one is exploring from both historical and modern drill hole data stored in the database  COST BENEFITS- 1. Less man hours are spent digitizing to incorporate data into models 2. There are variety of GIS analysis methods on quantitative and rastar data for anomalous areas 3. Old data of different types can be captured and viewed as analytical layers 4. Ability to utilize free historical and modern data in current projects
  • 12.
     Using GISin mineral exploration encourages a more efficient use already existing data which is cost effective  Exploration cost are rising, exploration drilling can be expensive, rate of discovery of large world class ore bodies is decreasing- however re analysis of existing data both modern and historical through GIS 3D modeling allows for more targeted and cost effective drilling operations  Pipelines, electric lines, roads, ramps, and other mining facilities change frequently  Engineers and operations staff use GIS for facility planning applications  Keeping track of existing infrastructure and integrating it with the mine plan and block models can be achieved with GIS  GIS can also be used to integrate recent survey data with block models or mine design data from other mining software packages such as Geo Soft, Vulcan, Mine Sight, SURPAC Range, or Mining Visualization System (MVS).
  • 13.
    3. Ground waterexploration and water resource evaluation  GIS in groundwater management involve certain processes  Issues , mandates and opportunities pertaining to groundwater management are- Public Education, Nonpoint Source Pollutant Loadings, Storm water Management, Flood Damage Reductions, Surface Water Control Plans, Water Quality Assessment, Open Space for Watershed Protection, Water Supply Management, Wastewater Management, Land Development Management, Aquatic Habitat Restoration  Application for analysis are Soils, Impervious surfaces, Land use/landcover, Groundwater recharge, Riparian areas, Open space  The usual scale include basins, sub-basins, watershed, sub-watershed, mini watershed and micro watershed.  The following information can be derived by linking soils data with the Soil Survey Geographic Database 1. Erodibility 2. Agricultural capability 3. Development suitability – Septic absorption fields – Lawns and landscaping – Dwellings – Small commercial buildings – Local roads and streets DEFINE THE ISSUE GENERATE STRATEGIES INCORPORATE GIS APPLICATION
  • 14.
     Impervious surfaceestimations can be derived from land use/land cover data.  The chart on the right can be used as a guide to develop strategies for preservation, restoration or management, depending on the level of impervious surface.  Landuse/landcover data can be used to calculate change in over a period of time of the following land use/landcover types: – Urban land – Agricultural land – Forest – Water – Wetlands – Barren land  These data can be used to inform analyses, such as groundwater recharge, riparian areas and open space.  Ground water recharge combines land use/landcover, soils and precipitation data to estimate the amount of groundwater recharge for any area
  • 15.
     Riparian areadata are created by combining relevant features into one GIS data set- water, adjacent wetlands, wetland transition areas, flood areas, adjacent hydric and alluvial soil  To quantify riparian area, areas of development are removed using landuse/landcover data  To evaluate riparian health, determine the extent of forest crown closure, impervious surfaces and barriers and alterations to stream flow such as managed stream segments, dams and road crossings.  To visualize and prioritize future open space acquisitions, view GIS data that fit the specified objectives for acquisition with existing open space, easement and parcel data. Water, wetlands, transition areas, flood hazard areas, Forests, steep slopes, farmlands, wildlife habitats, etc. The data are not limited and include many other
  • 16.
    TOPOGRAPHIC SHEET SATELLITE DATA FIELDDATA EXISTING DATA DIGITAL IMAGE PROCESSING GW SAMPLING CHEMICAL ANALYSIS GIS AND THEMATIC MAP GENERATION SPATIAL ANALYSIS FOR DRINKING WATER SPATIAL INTEGRATION SPATIAL ANALYSIS FOR IRRIGATION WATER GW QUALITY MAP Fig. Methodology used for integrated groundwater quality mapping
  • 17.
    4. Environmental analysis The main aim of doing environment analysis is to accumulate information pertaining to the environment and to understand the environmental processes and linkages  The main objective is to gather information pertaining to environmental phenomena and processes and also to gain understanding and insight
  • 18.
     Environmental problemsare spatial problems  Environmental data can almost always be geo-referenced and therefore GIS serves as an ample tool for environmental analysis  GIS for environmental analysis is used to explore the spatial relationships, patterns and process of geographic, biological and physical phenomena  Geospatial analysis offers insight about the environment and reveals management options through surface interpolation, temporal analysis and 3D analysis
  • 19.
    5. Disaster management Disasters are unpredictable extreme spatial events in the natural or man-made environment  Disasters cannot be foreseen but can be dealt in such a way that the impact can be reduced to great extent by strategic planning and making use of the available analysis tools developed by the advancement in software technology  Any disaster management activity will have broadly six phases in a cycle DISASTER MANAGEMENT 2. PREVENTION 1. PREDICTION 6. DISASTER RECOVERY AND REHABILITATION 3. PREPAREDNESS 4. MITIGATION 5. EMERGENCY MANAGEMENT AND RESCUE
  • 20.
     Any rescuemanagement system will involve-  Locating the sites accurately in the least permissible time  Reduces the critical time element involved in the activities  Accurate data about the resource available at the place of interest  Accessibility of information between source and destination  Correct means of alarming the resources  Real time visualization of the area of interest  Advantages of GIS in disaster management  Locating the site of accident become very simple and accurate  The accessibility can be analyzed more accurately  Finding out required resources become simple, speedy and accurate  Finding out optimum routes between different resource locating to accident site  Helps in topographic and demographic analysis to improve the effectiveness in planning and implementation activities  Provides buffer analysis to facilitate effective dynamic planning  Provides easy means to add and update the records of database  Improved operational efficiency as spatial and non-spatial data on individual database
  • 21.
    6. Transport system The GIS used for transport application is known as the Geographic information systems for transportation (GIS-T)  GIS-T applications are currently used broadly by transportation analysts and decision makers in different areas of transportation , planning and engineering, from infrastructure planning, design and management, traffic safety analysis, transportation impact analysis, and public transit planning and operations to intelligent transportation systems (ITS).  Topics related to GIS-T can be grouped into three categories. They are  GIS-T Data Representations  GIS-T Analysis and Modeling  GIS-T applications  In data representation, GIS-T studies have employed both vector and raster GIS data models to represent the relevant geographic data.  One critical component of GIS-T is how we can best represent transportation- related data in a GIS environment in order to facilitate and integrate the needs of various transportation applications  Existing GIS data models provide a good foundation of supporting many GIS-T applications.
  • 22.
  • 23.
     Like manyother fields, transportation has developed its own unique analysis methods and models. Examples include – shortest path and routing algorithms, – spatial interaction models, – network flow problems, – facility location problems, – travel demand models, and – land use-transportation interaction models.  GIS-T application GIS-T APPLICATION Manage Land Records Marketing Trade Area Analysis Customer Profiling Urban Planning Risk Analysis Sales ManagementSite Selection Asset Management Transportation/Logistics Manage Land Records
  • 24.
    7. Demographic analysis GIS in demographic analysis is done for population estimation  Related spatial analytic tools are used to provide greater understanding of the spatial patterning of demographic trends over time  Population estimate can be done both by direct method and indirect method  Direct method tracks construction and occupation of housing units  Indirect method tracks the component of change through an accounting procedure- births, deaths, migration of individual in and out of a given geography  Population estimation is done based on accurate allocation of events through a process known as geo-coding which converts descriptive locations (addresses) to geo referenced locations (X, Y coordinates)  This is achieved by referencing an address to a location on a road network. The process is also known as road network
  • 25.
    8. Agricultural development The ability of GIS to analyze and visualize agricultural environments and workflows has proved to be very beneficial to those involved in the farming industry.  From mobile GIS in the field to the scientific analysis of production data at the farm manager's office, GIS is playing an increasing role in agriculture production throughout the world by helping farmers increase production, reduce costs, and manage their land more efficiently.  The natural inputs in farming cannot be controlled however, they can be better understood and managed with GIS applications such as crop yield estimates, soil amendment analyses, and erosion identification and remediation  Crop-specific maps, created by combining survey data and satellite images, literally provides the lay of the land for farmers and agribusinesses such as seed and fertilizer companies  Reliable crop information is vital to the functioning of grain markets. It is used to inform decisions on planting, marketing, and policy.  Applying GIS to the process of preparing crop estimates has improved accuracy while lowering costs.
  • 26.
     The aerialsurvey determines which crop is planted in the field represented by each sample point  The field observer notes which crop is planted at the sample point and whether it is dry land or irrigated cultivation. Additional information, such as growth problems or areas of double-cropping is also captured  The field data is captured and stored in shape file format. This data is uploaded to a central server on a daily basis and imported into a SQL Server database. Expansion statistics are used to calculate estimates of the area planted in each grain crop on a provincial basis.  The use of GIS has greatly improved crop estimates in many countries and resulted in more cost- effective, accurate, and objective grain area estimates.
  • 27.
    Producer Independent CropEstimate System (PICES)  The Producer Independent Crop Estimate System (PICES) was developed in 2005  PICES uses crop field boundaries digitized from satellite imagery with a point frame sampling system to objectively estimate the area planted with grain crops.  The PICES process consists of the following steps: 1. Obtain satellite imagery. 2. Digitize crop field boundaries from satellite imagery. 3. Design the point frame and select random sample point. 4. Use aerial survey sample points to capture crop data. 5. Perform statistical analysis.  Digitized fields are stratified based on the probability of finding a crop.
  • 29.
    9. Forestry  Withthe help of GIS effective forest managers monitor the changing conditions and make intelligent decisions for sustainable care  Historical analysis, identification of soil types, changing weather patterns and land-use patterns can be assessed  GIS modeling enables the users to test and consider options in both temporal and spatial contexts. These geospatial records provide forest managers with a baselines for evaluating plans  ESRI provides array of tools to assist forestry to assess forestry profession with data management, analysis, decision making and monitoring  GIS provides options to forest managers for the use and management of spatial data on mobile devices, internal networks and web based systems  Helps in planning for sustainability, forest structure management, timber sale establishment planning process, recreational purposes, forest inventory etc
  • 31.
    10. Tourism  GISin tourism holds many advantages to both tourists and tourism management authorities  Advantages for the tourists-  Visualization of tourist sites. Ie, seeing what is available in the area they want to see  Valuable information on tourist location can be embedded in the GIS- videos, photos, product brochures  Selective information such as route planning, accommodations, cultural events, special attractions, etc  Easily accessible information over the internet (web-based GIS)  Interactive maps that correspond to user queries  Advantages for development authorities  To know where the customers are coming  Planning like regional marketing, community infrastructure ( transportation, utilities and zoning)  Planning for new site selection  As to know if one have the necessary space  Utility of available resource  Need to upgrade the transportation infrastructure to accommodate the additional traffic
  • 33.
    CONCLUSION  GIS caninput, store. Retrieve, manipulate, analyze and output geospatial data  ADVATAGES- It improves/enhances the effects of physical/environmental growth  better management of resources  adding new value-added services  perform analysis on spatial and non spatial components  Do fast recall of data  Perform complex analysis  recalling of non spatial data through object location  display of information in a different light/view  multiple scenario in planning can be performed easily  The applications of GIS at present is in scores of a hundred and these are the mentioned only few
  • 34.
    REFERENCE  Basudeb Bhatta,2008, 2011 Remote sensing and GIS, boblished by Oxford University Press  Paul A. Longley, Michael F. Goodchild, David J. Maguire, David W. Rhind, Geographic Information Systems volume 1, 1999 by John Wiley and sons  http://uregina.ca/piwowarj/geog303/12%20-%20Network%20Analysis.pdf http://geog.hkbu.edu.hk/geog3600/Lect-10.pdf http://www.esri.com/library/brochures/pdfs/gis-sols-for-env-mgmt.pdf http://ifitt.org/admin/public/uploads/Avdimiotisfinal.pdf http://www.aianta.org/uploads/FileLinks/94e1c28a87cc4792b0f74c481104e8 1a/A3_GIS_Tourism_Planning.pdf http://www.geos.ed.ac.uk/~gisteac/gis_book_abridged/files/ch62.pdf http://www.esri.com/library/bestpractices/sustainable-agriculture.pdf http://www.doc.govt.nz/Documents/science-and technical/drds303entire.pdf http://www.esri.com/library/bestpractices/wildlife-conservation.pdf http://www.nrac.wvu.edu/classes/for326/GISInForestryReviewPaper.pdf ………..