Download as PDF, PPTX


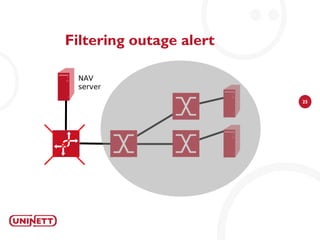
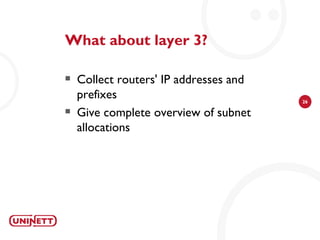


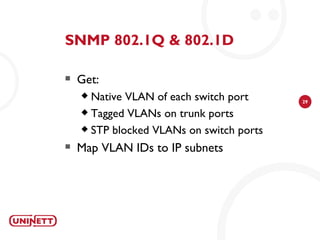
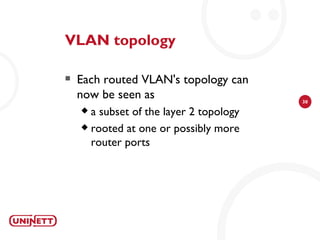
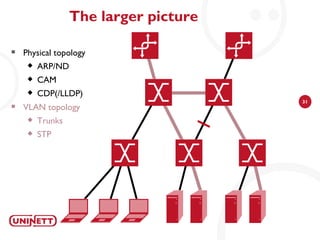
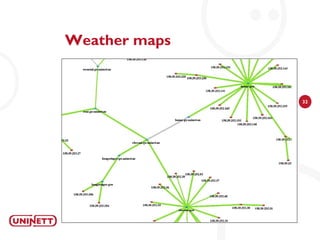


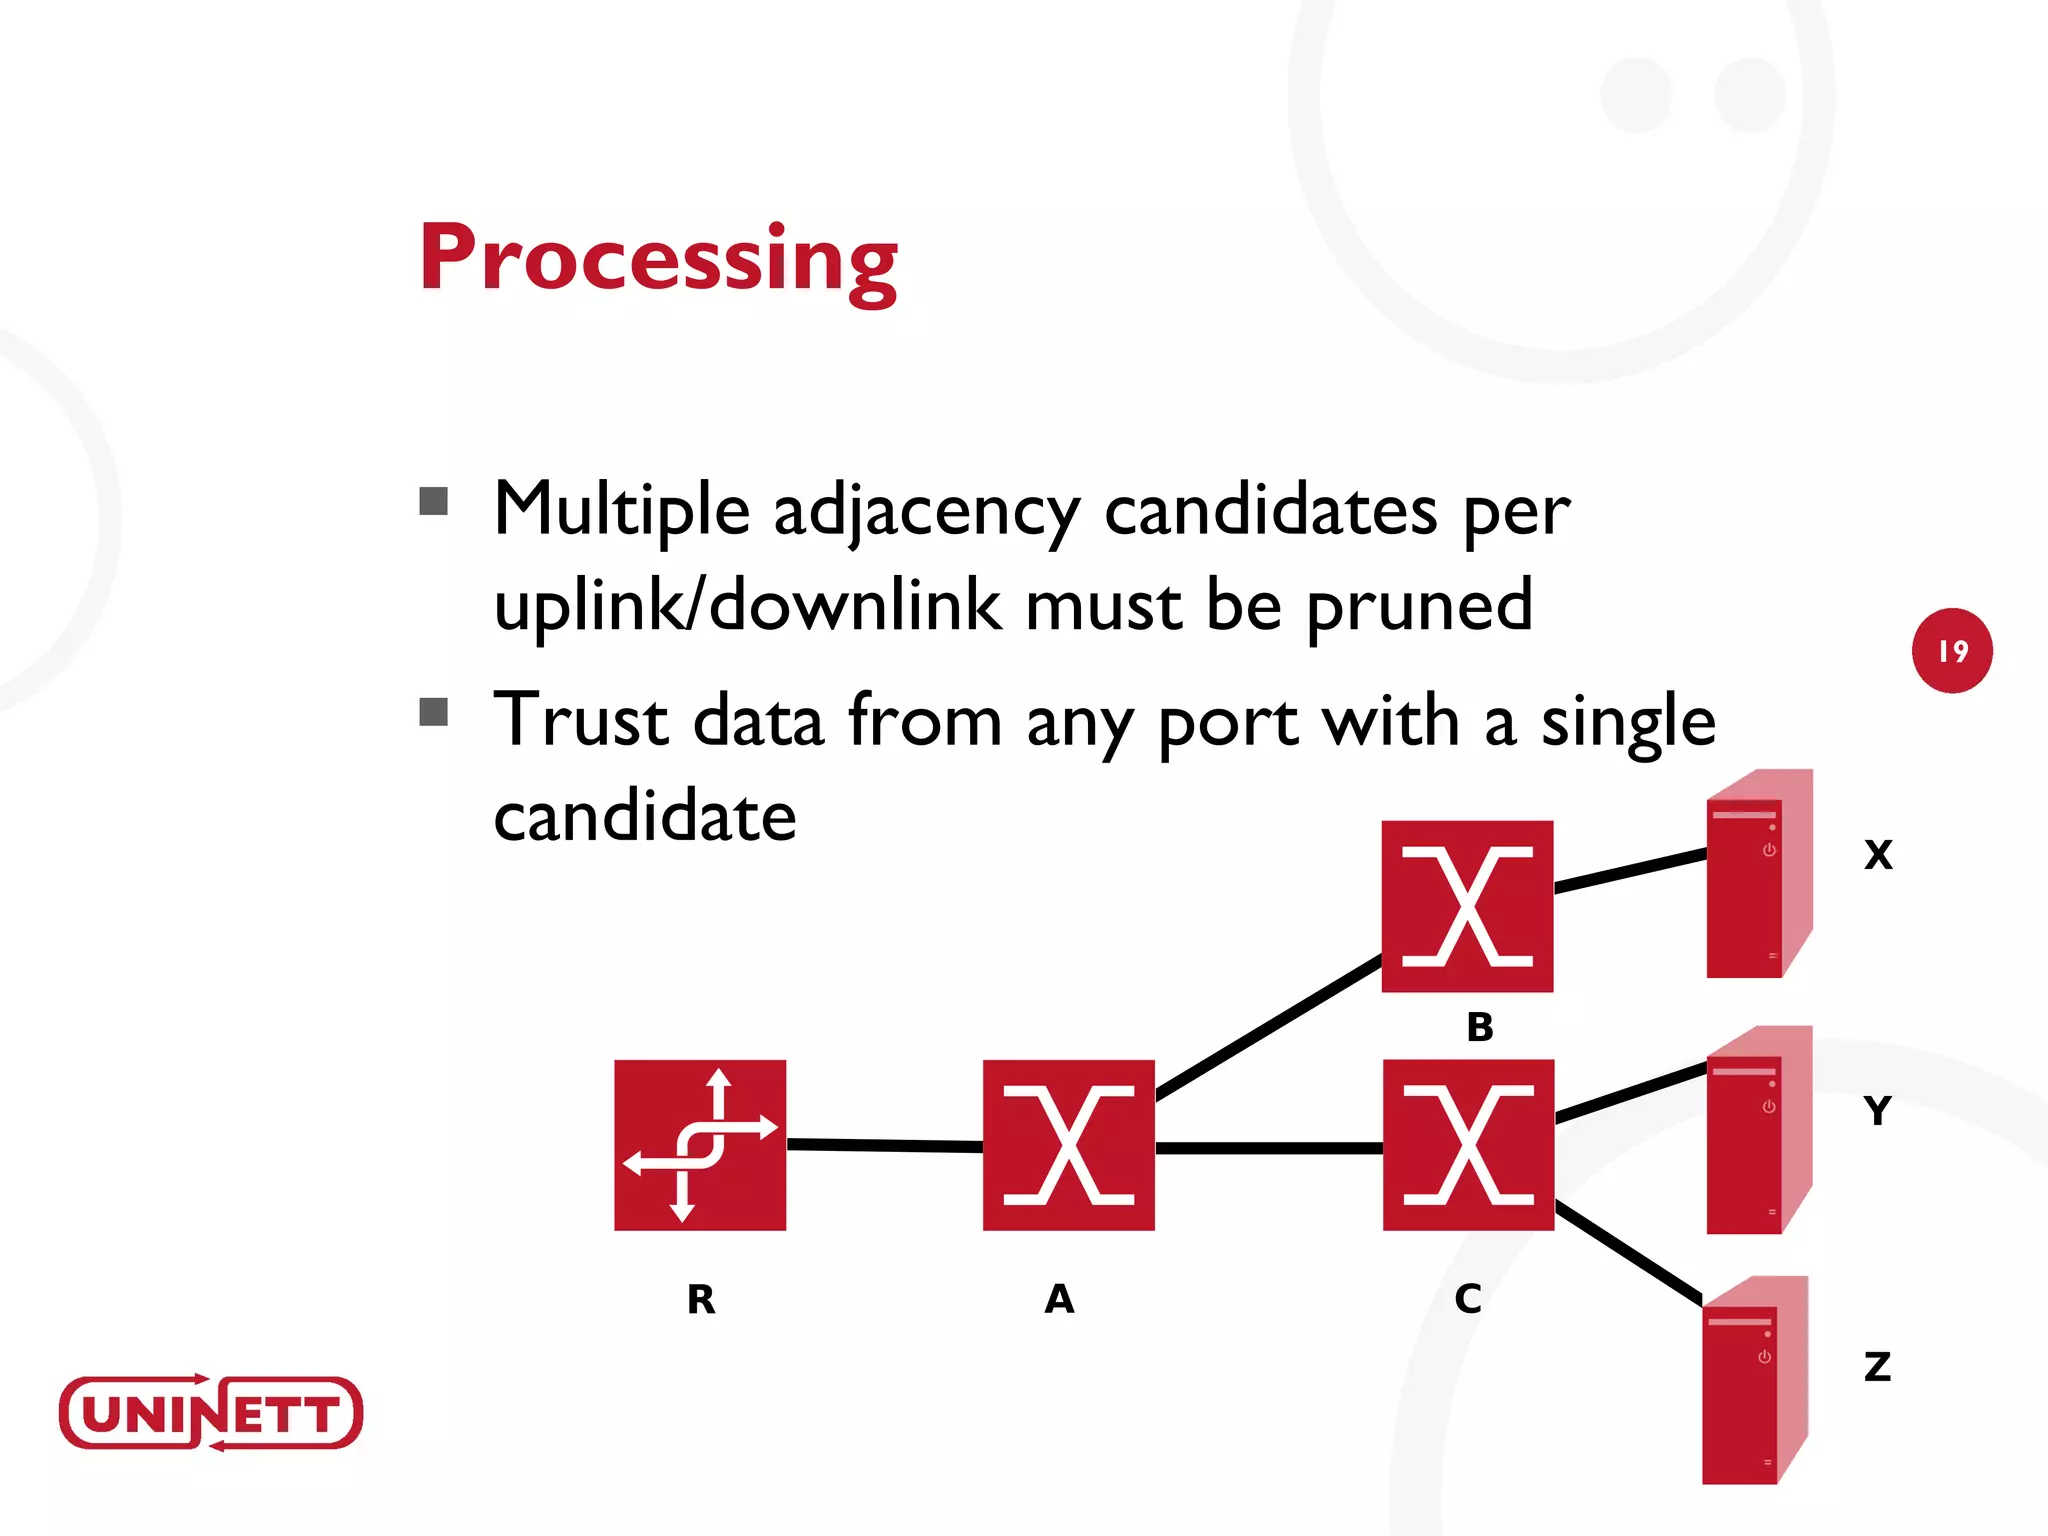


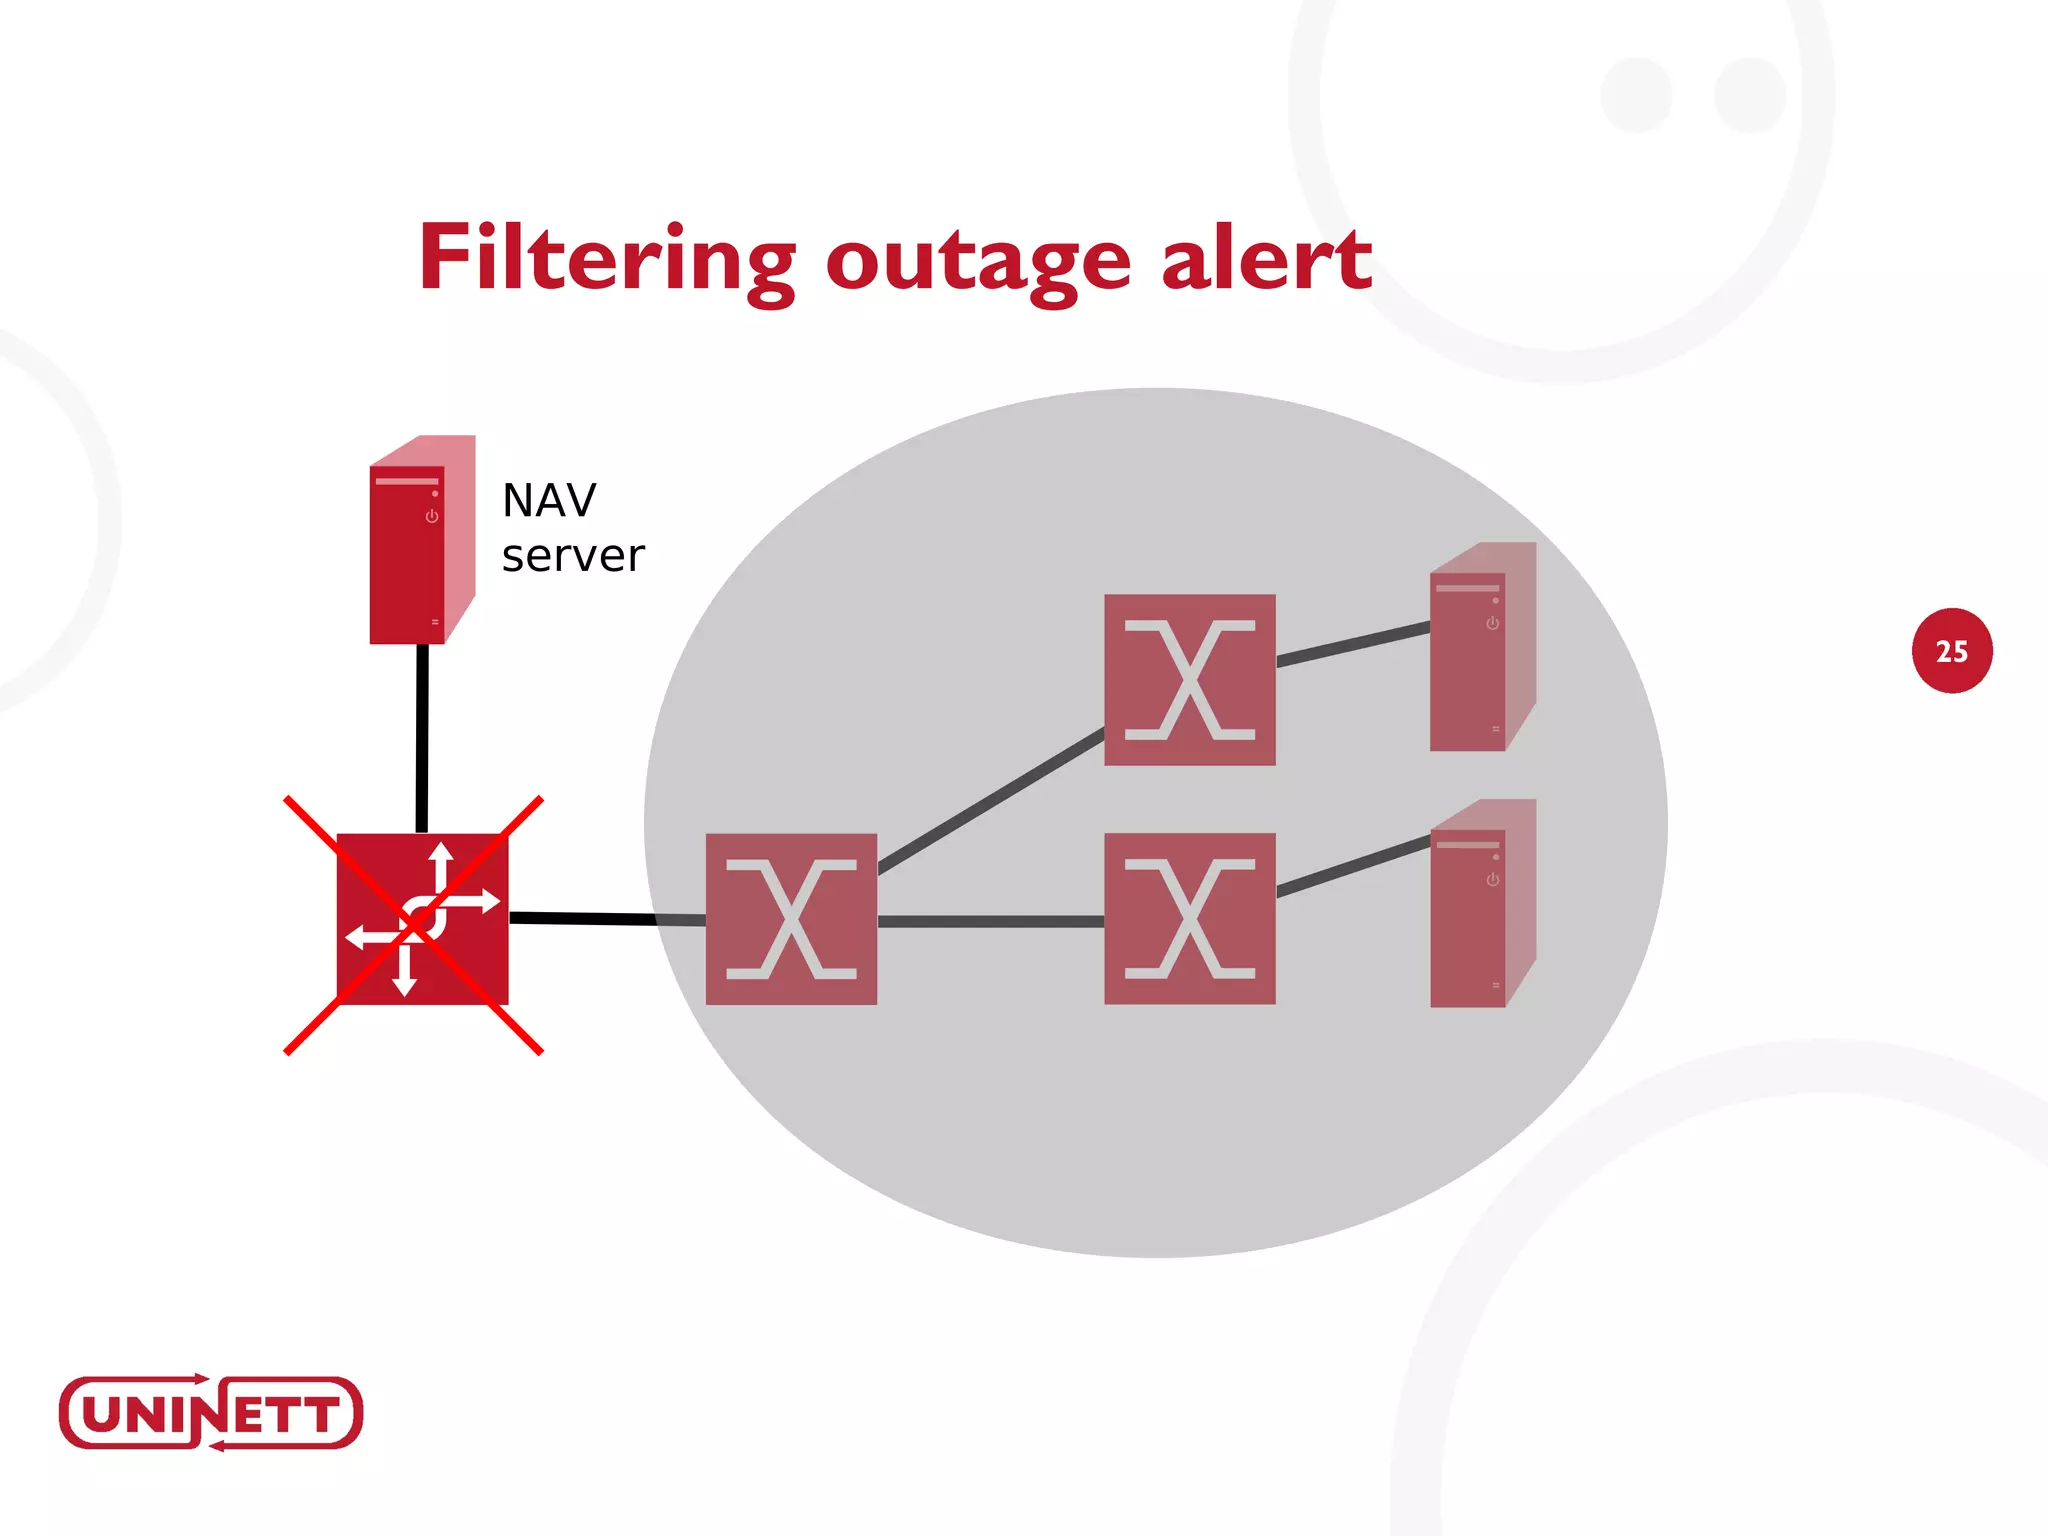
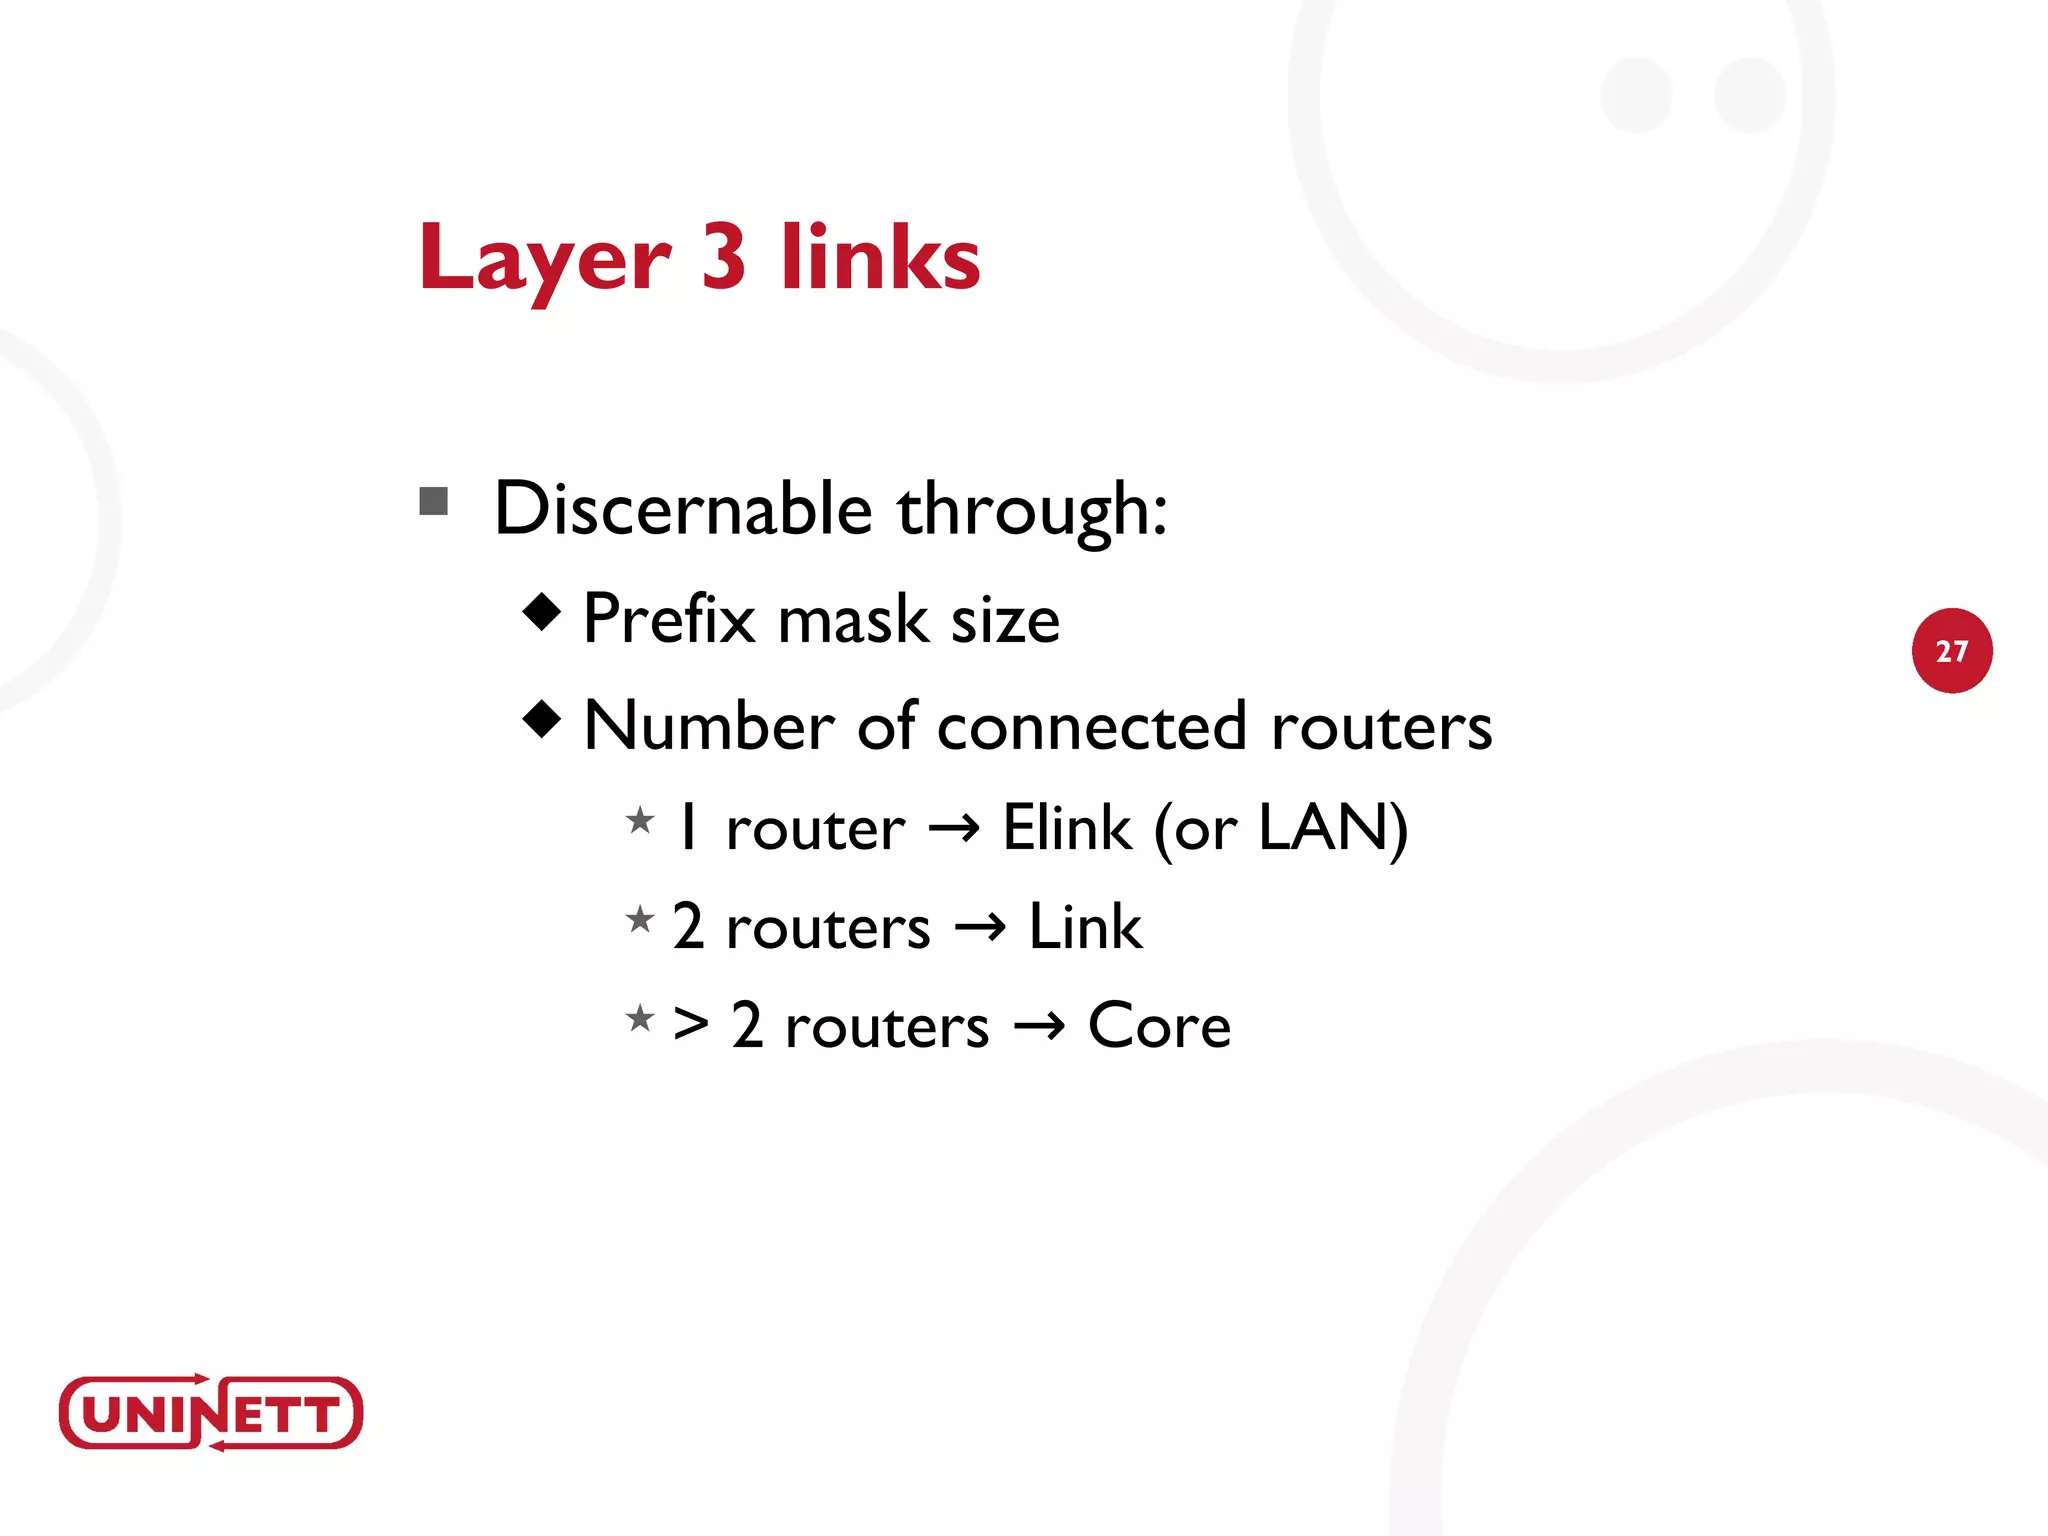

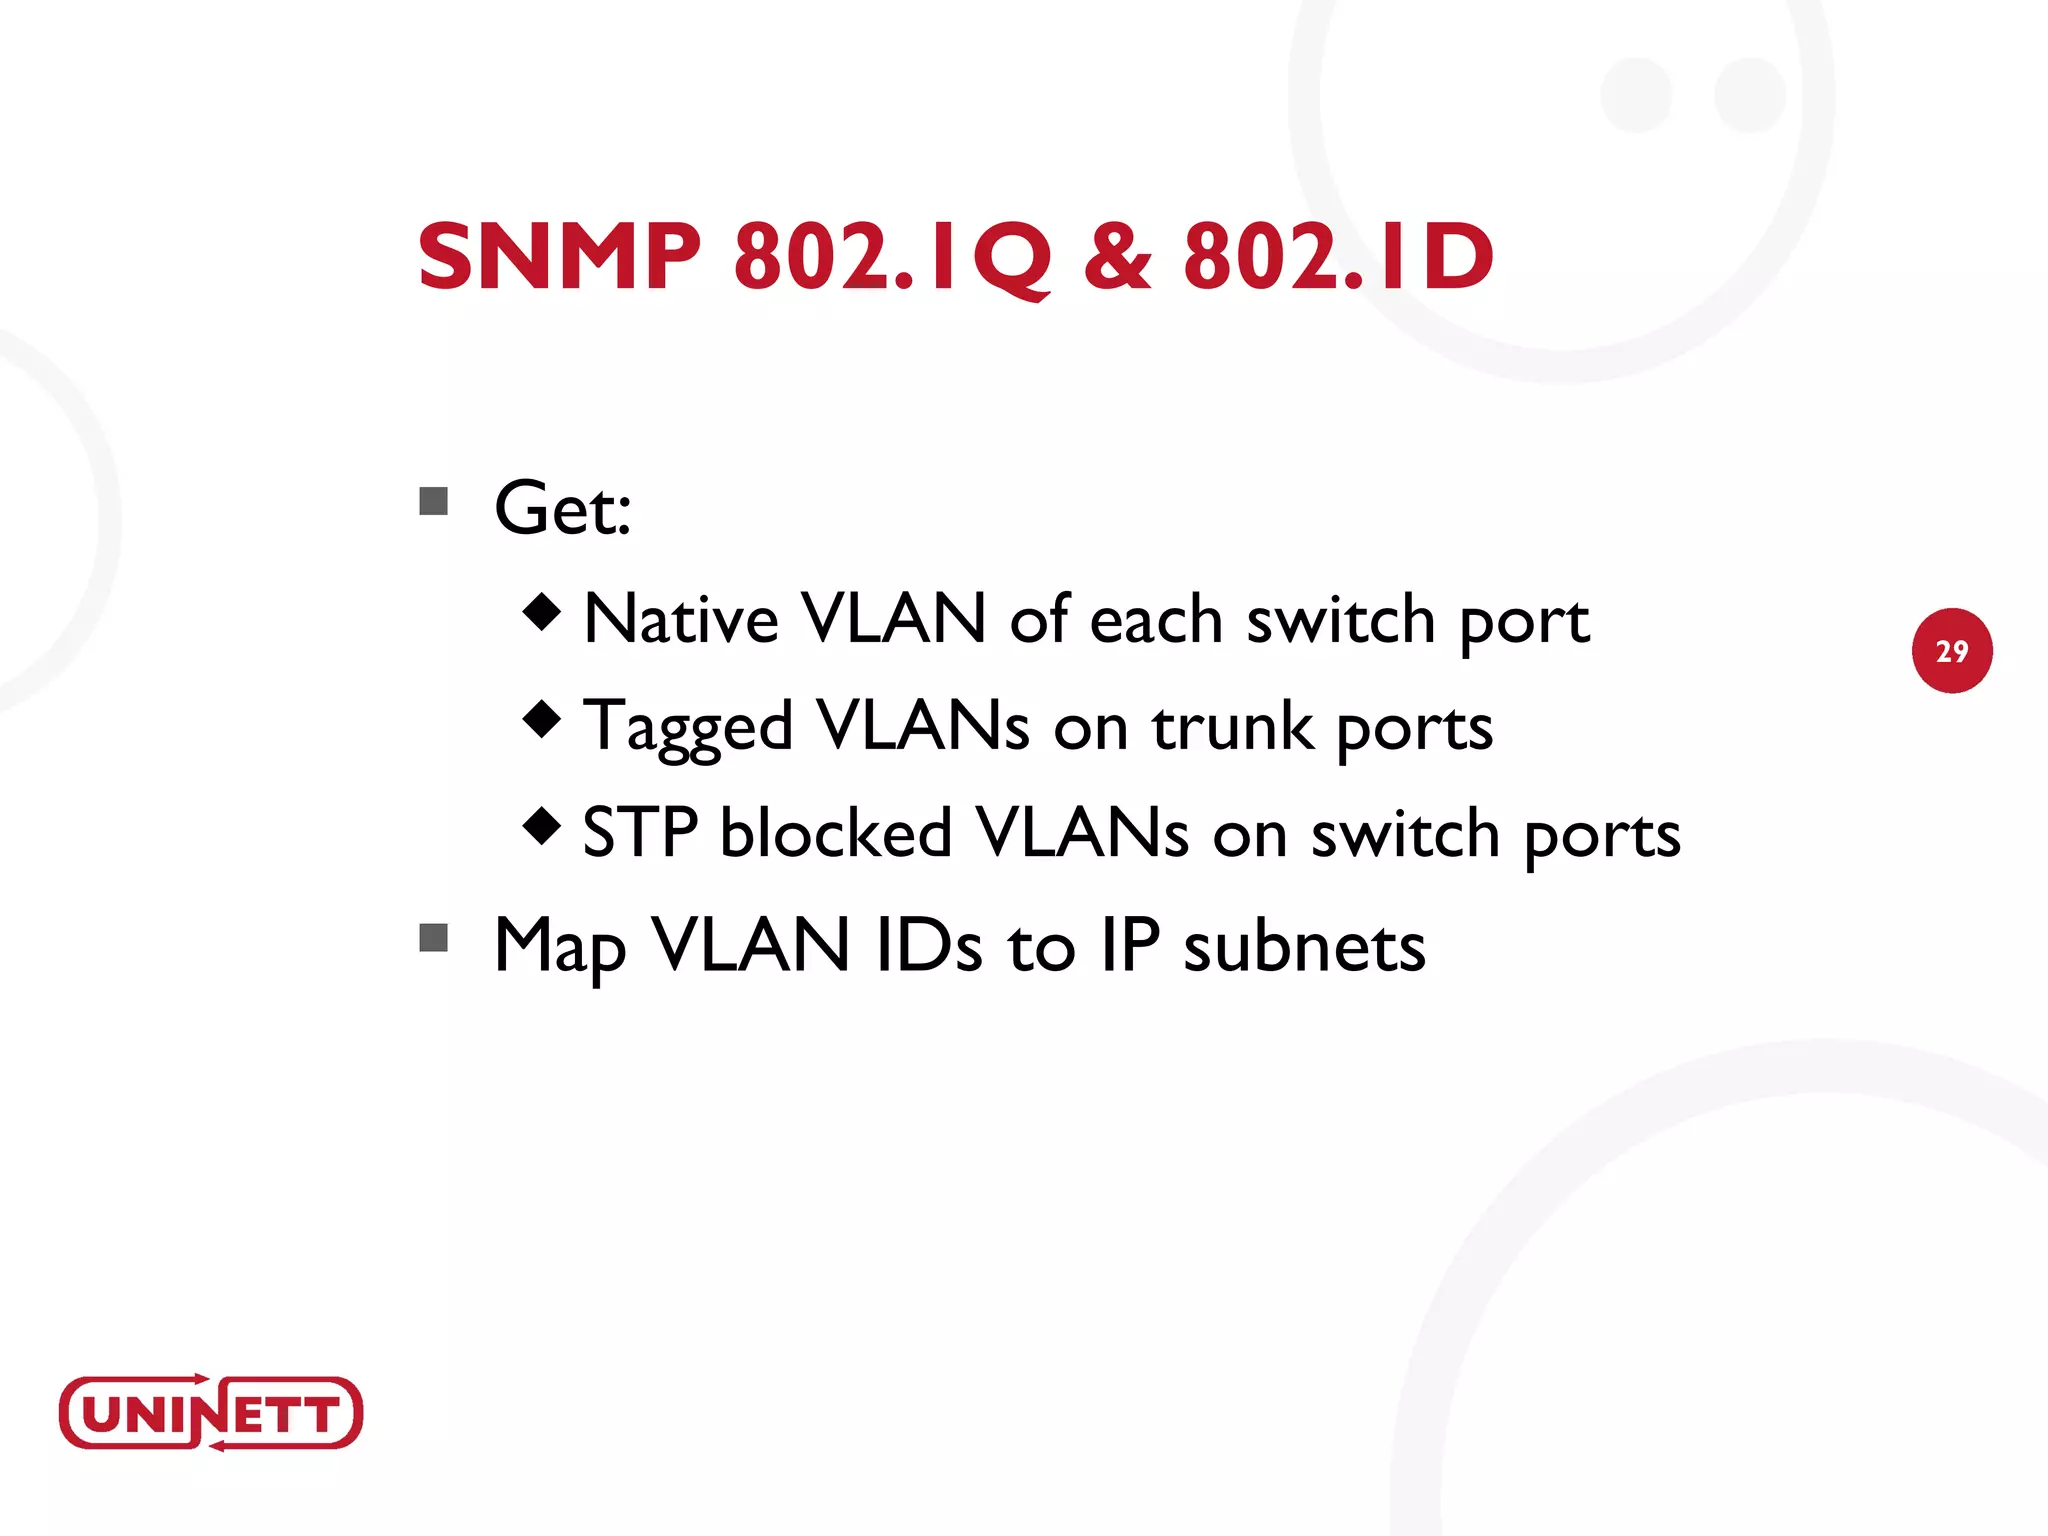
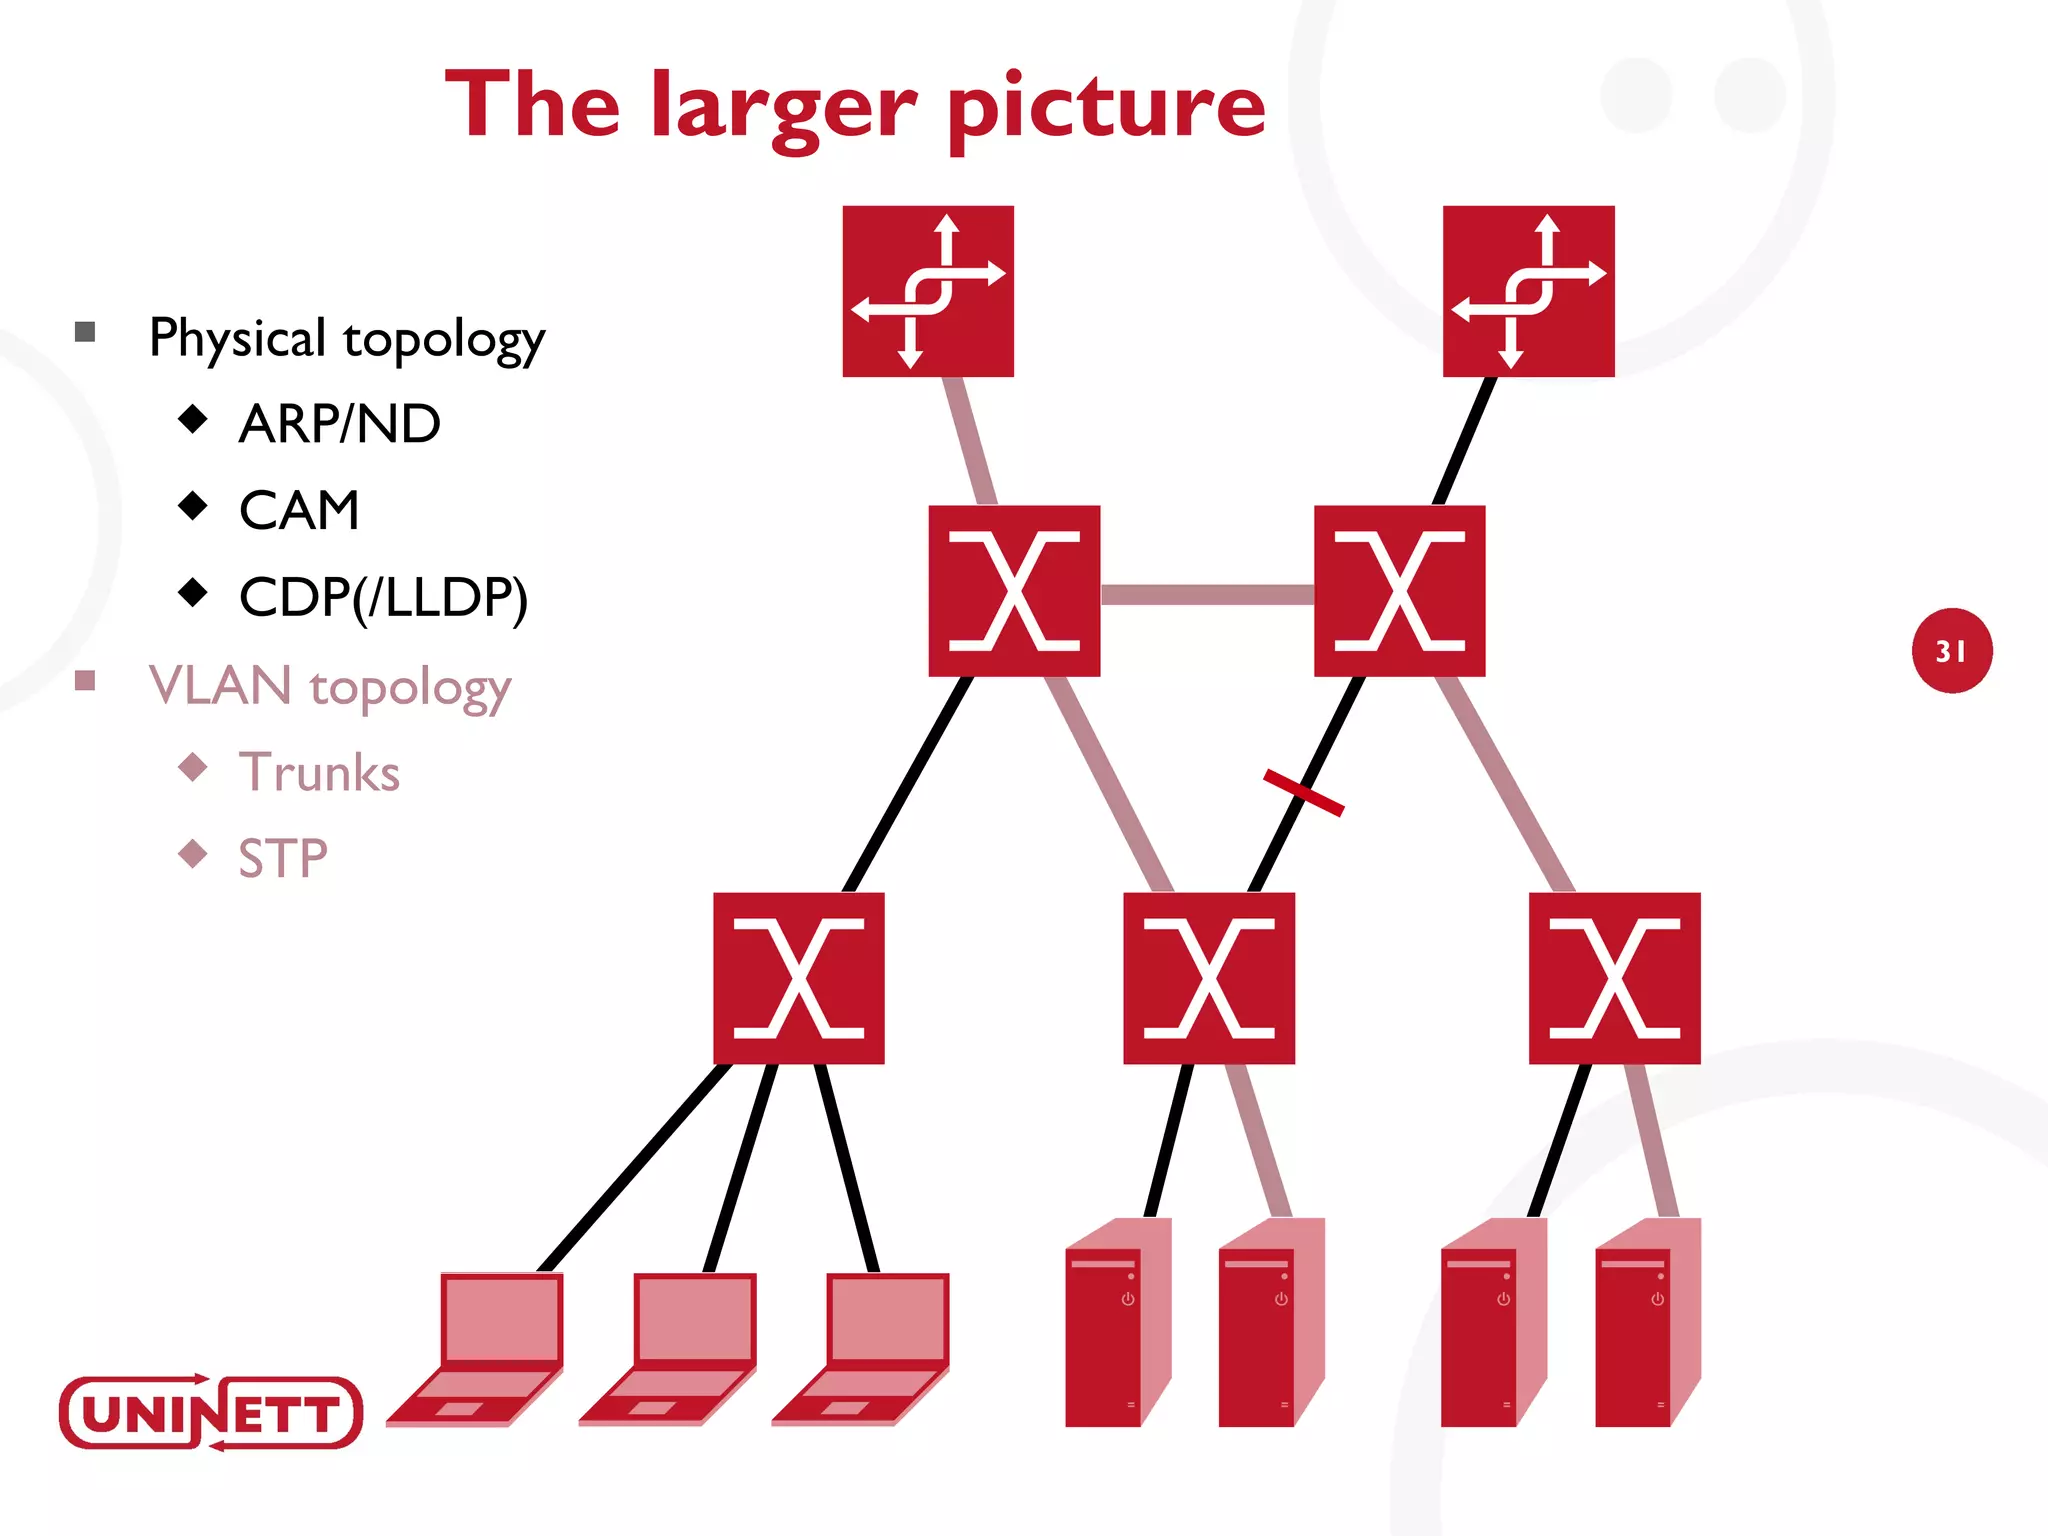

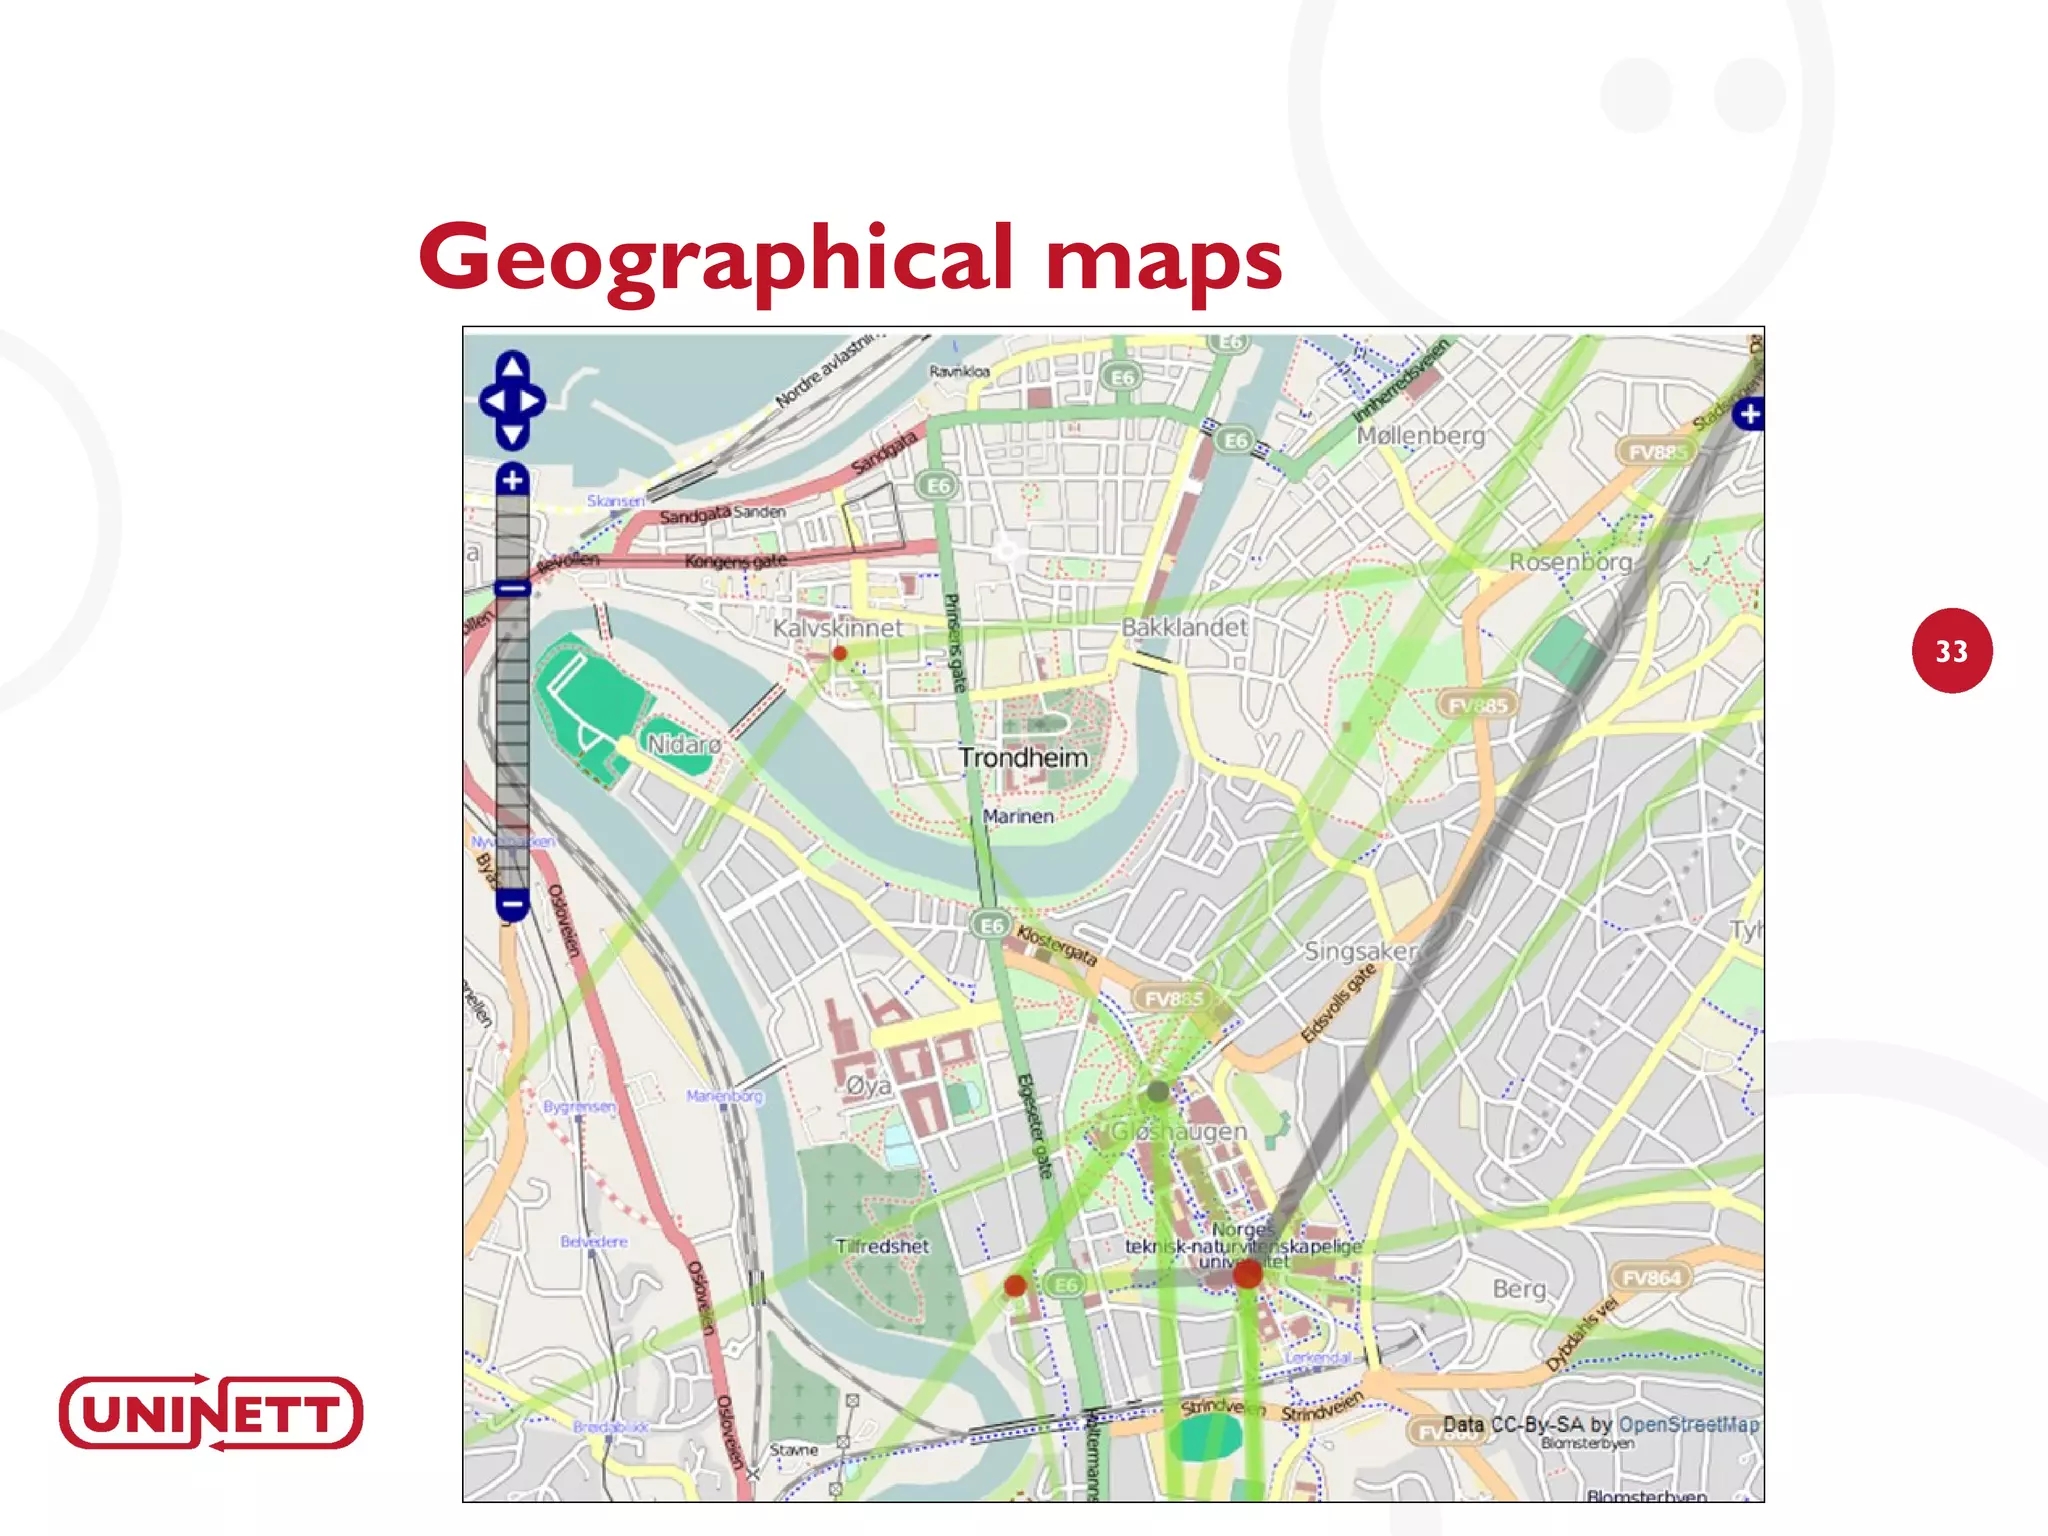
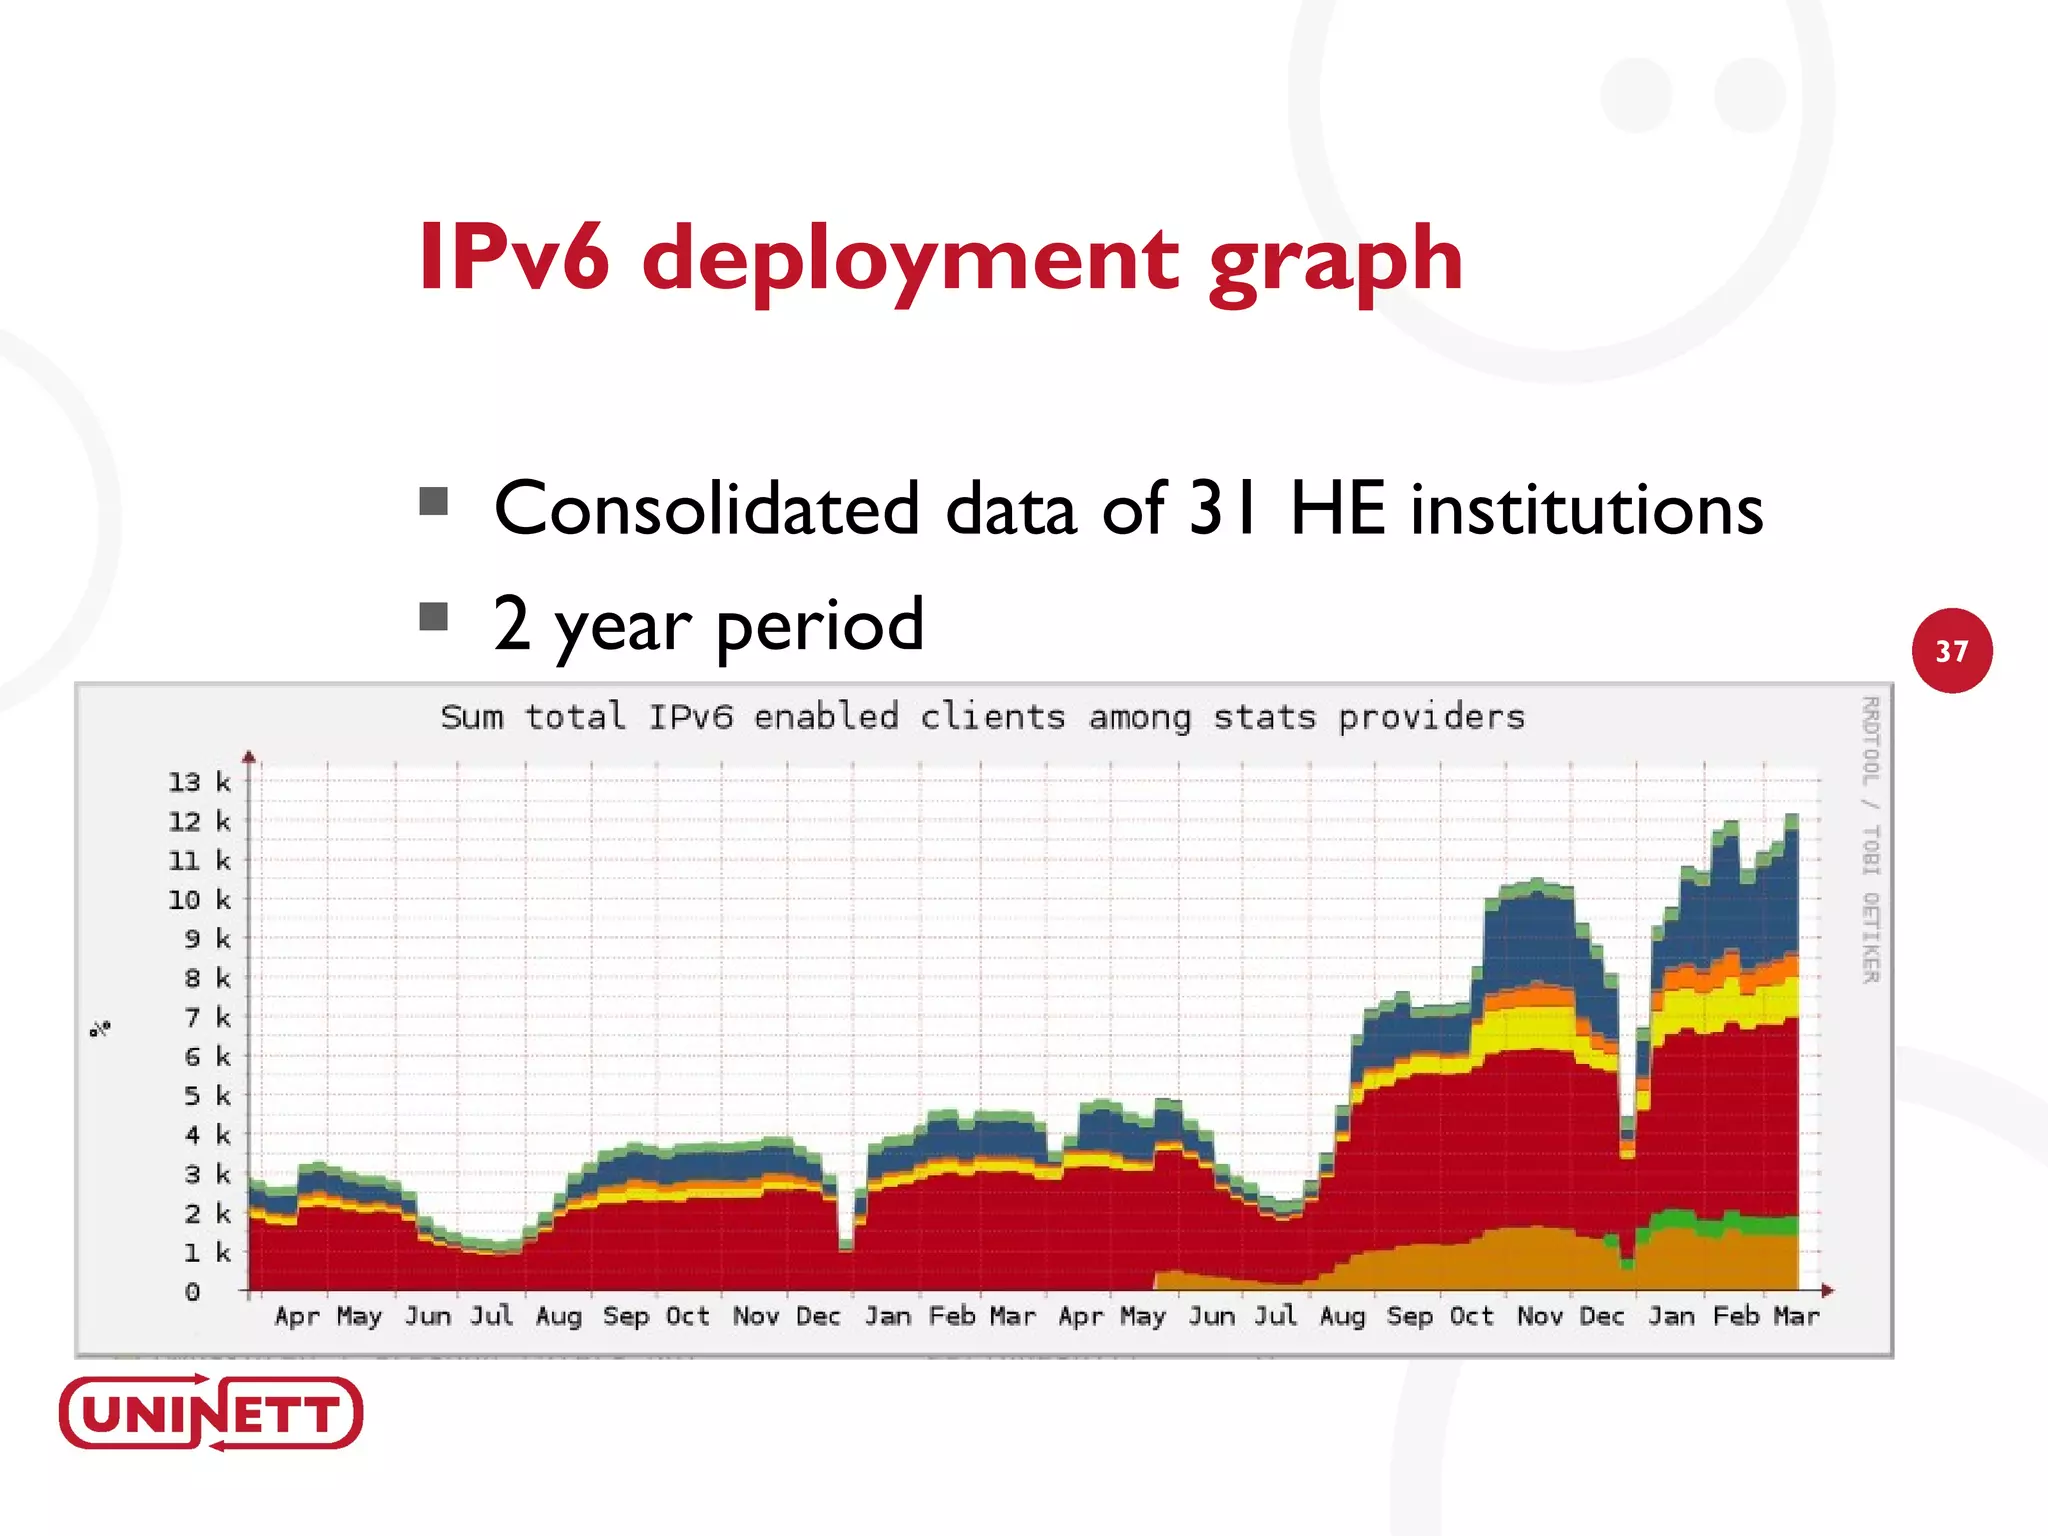


The document discusses how NAV (Network Administration Visualized) was developed to automatically detect network topologies using SNMP to collect data from routers and switches. NAV processes the data to map layer 2 and layer 3 topologies as well as VLAN configurations to provide network monitoring, outage alerts, and statistics. It maps IP and MAC addresses to end users' switch ports and logs their connectivity. NAV was later expanded to include features like weather maps, IPv6 deployment statistics, and support across Norwegian universities.


