Downloaded 18 times


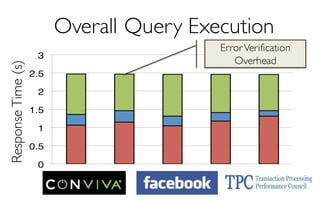
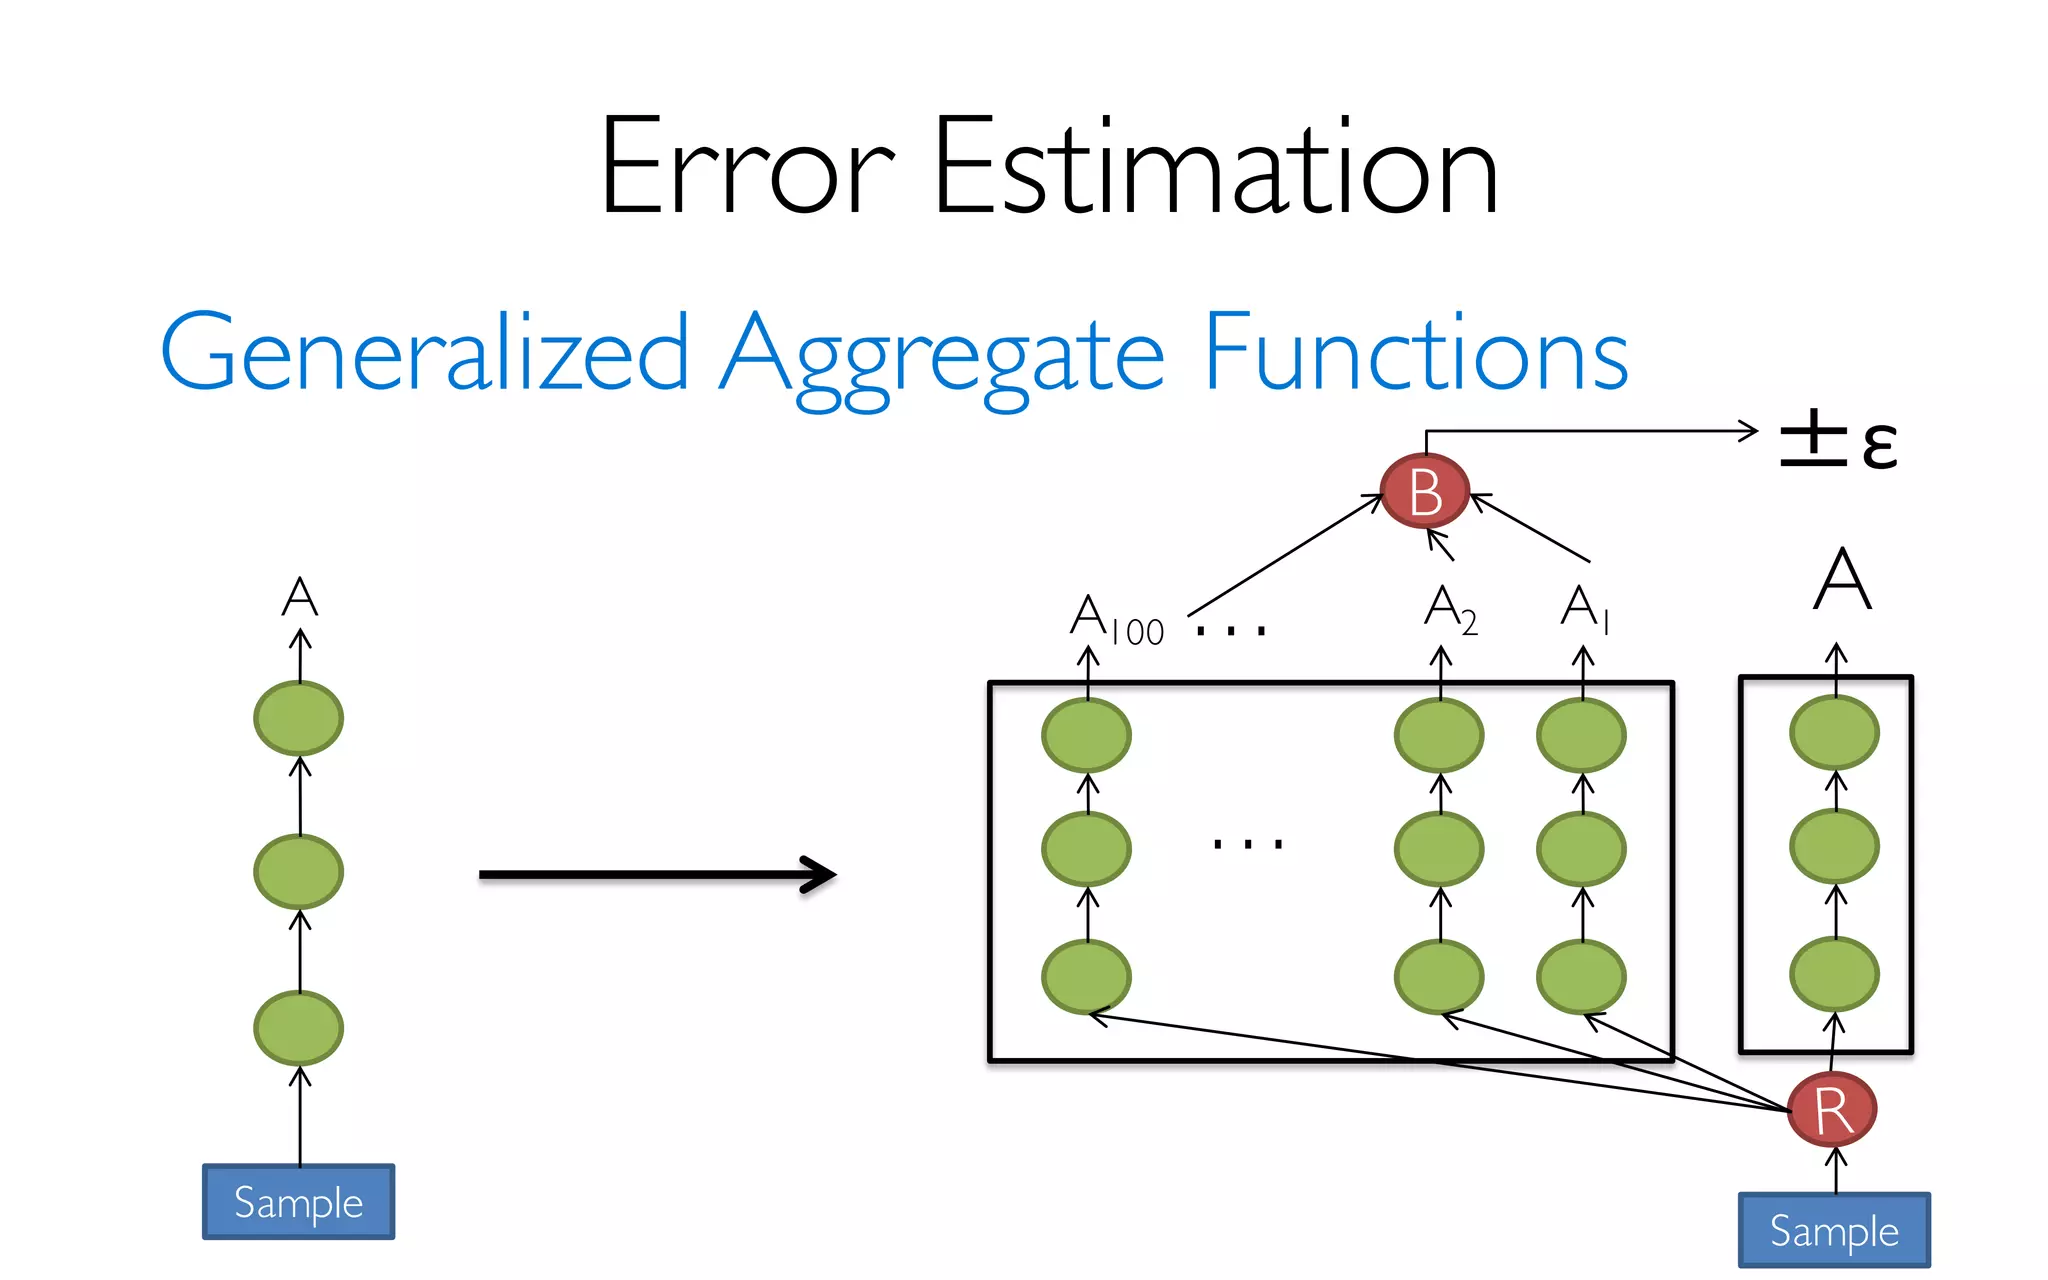
![ErrorVerificationError
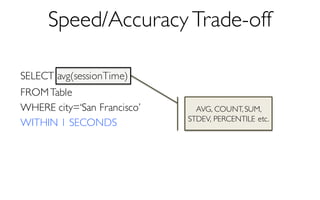
Sample Size
More Data à Higher Accuracy
300 Data Points à 97% Accuracy
[KDD’13] [SIGMOD’14]](https://image.slidesharecdn.com/11-24-2015blinkdb-meetup-151201073306-lva1-app6891/85/BlinkDB-Approximate-Queries-on-Very-Large-Data-43-320.jpg)

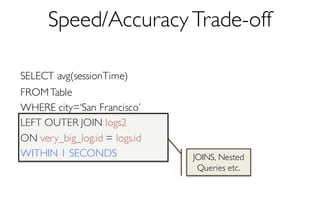
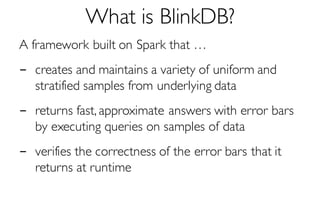
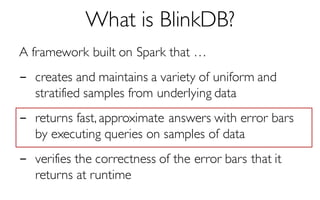
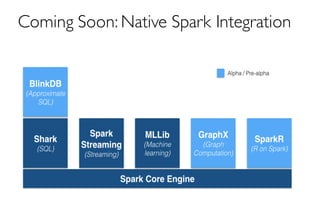
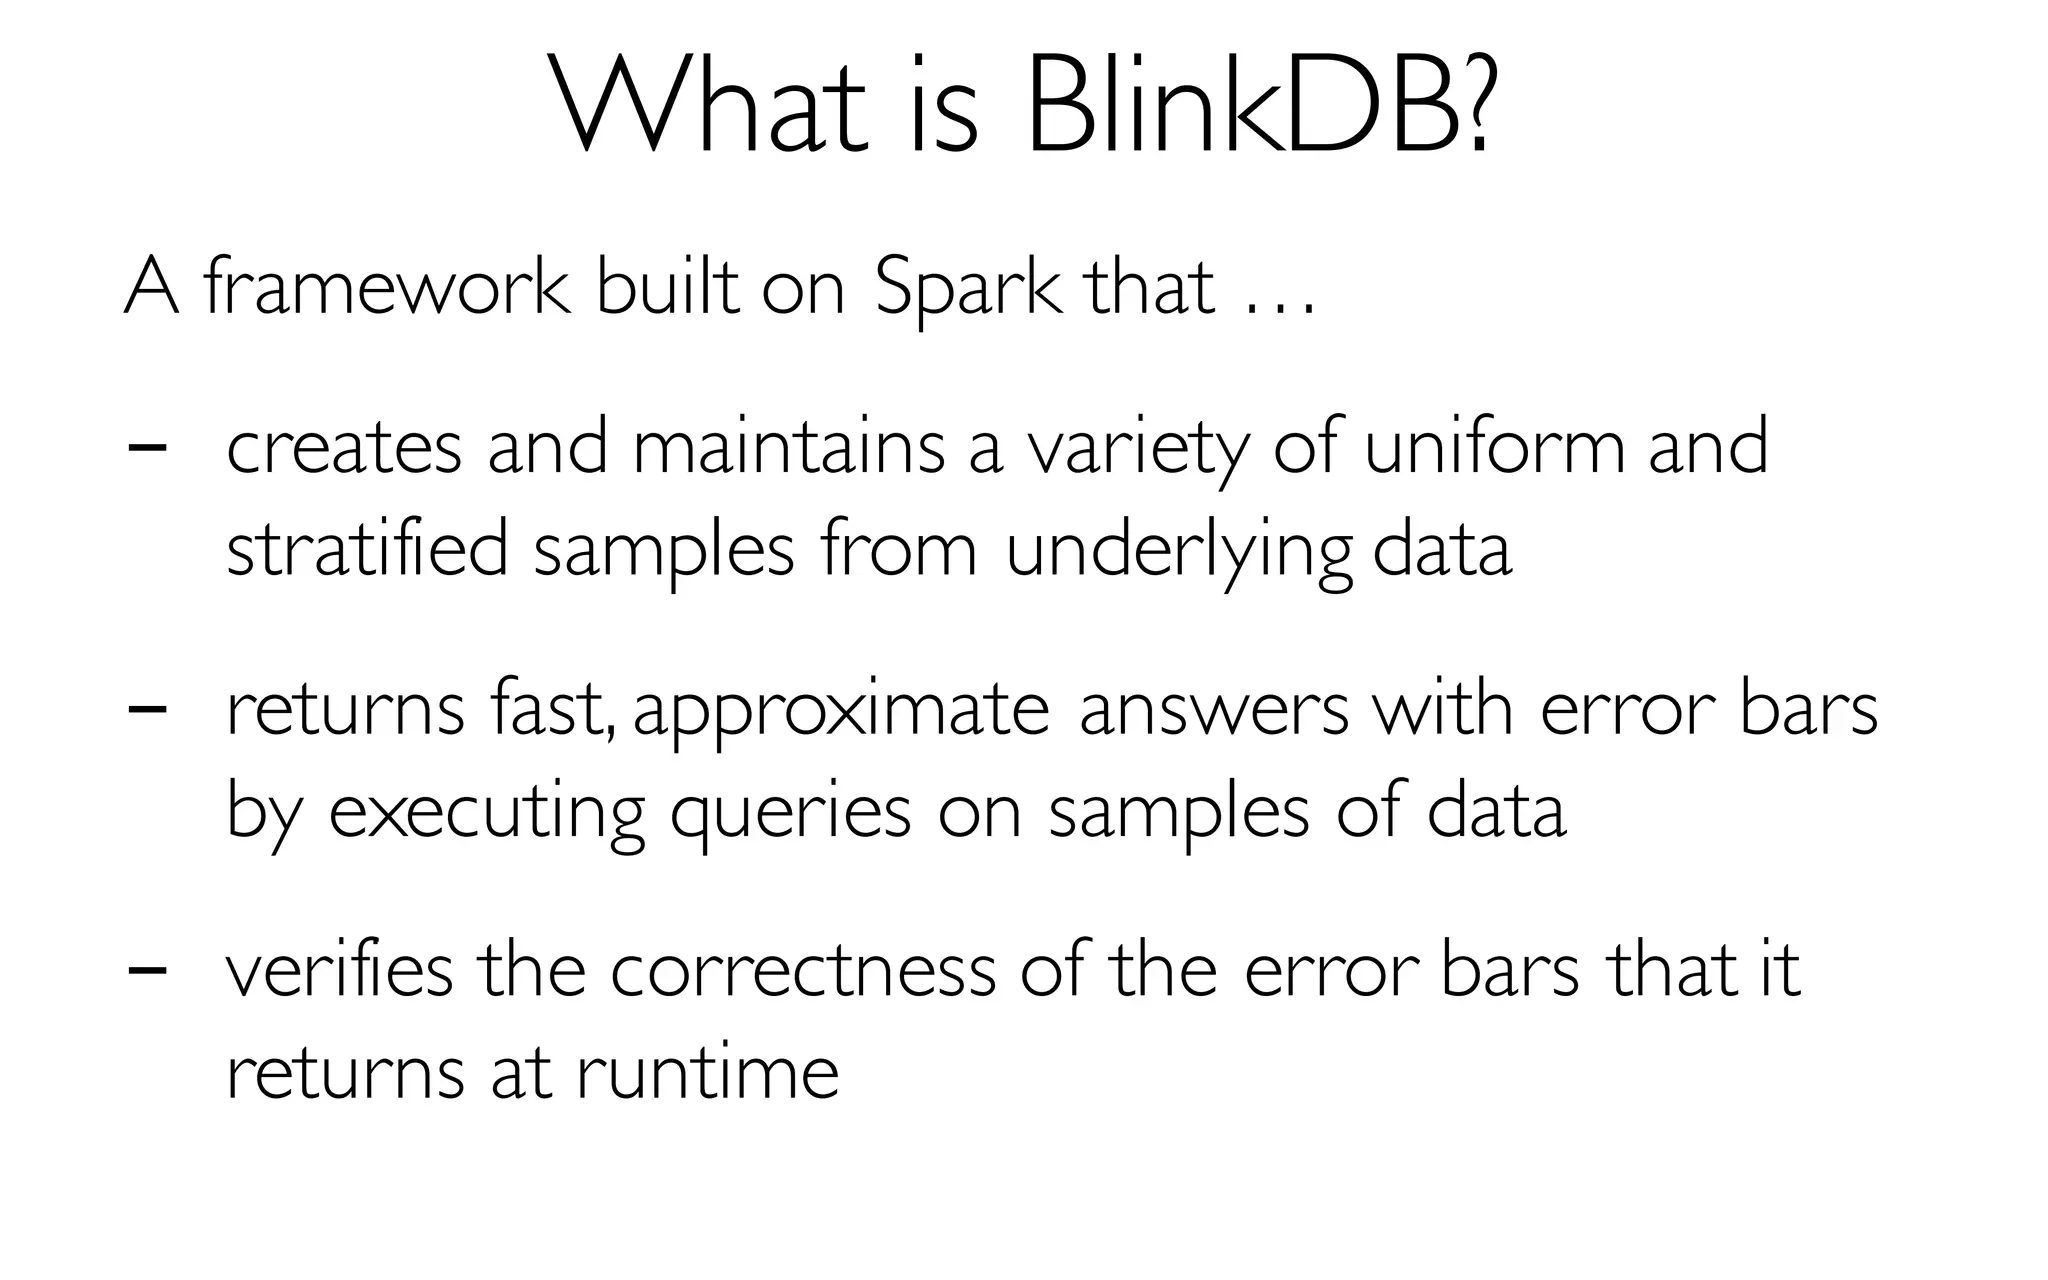
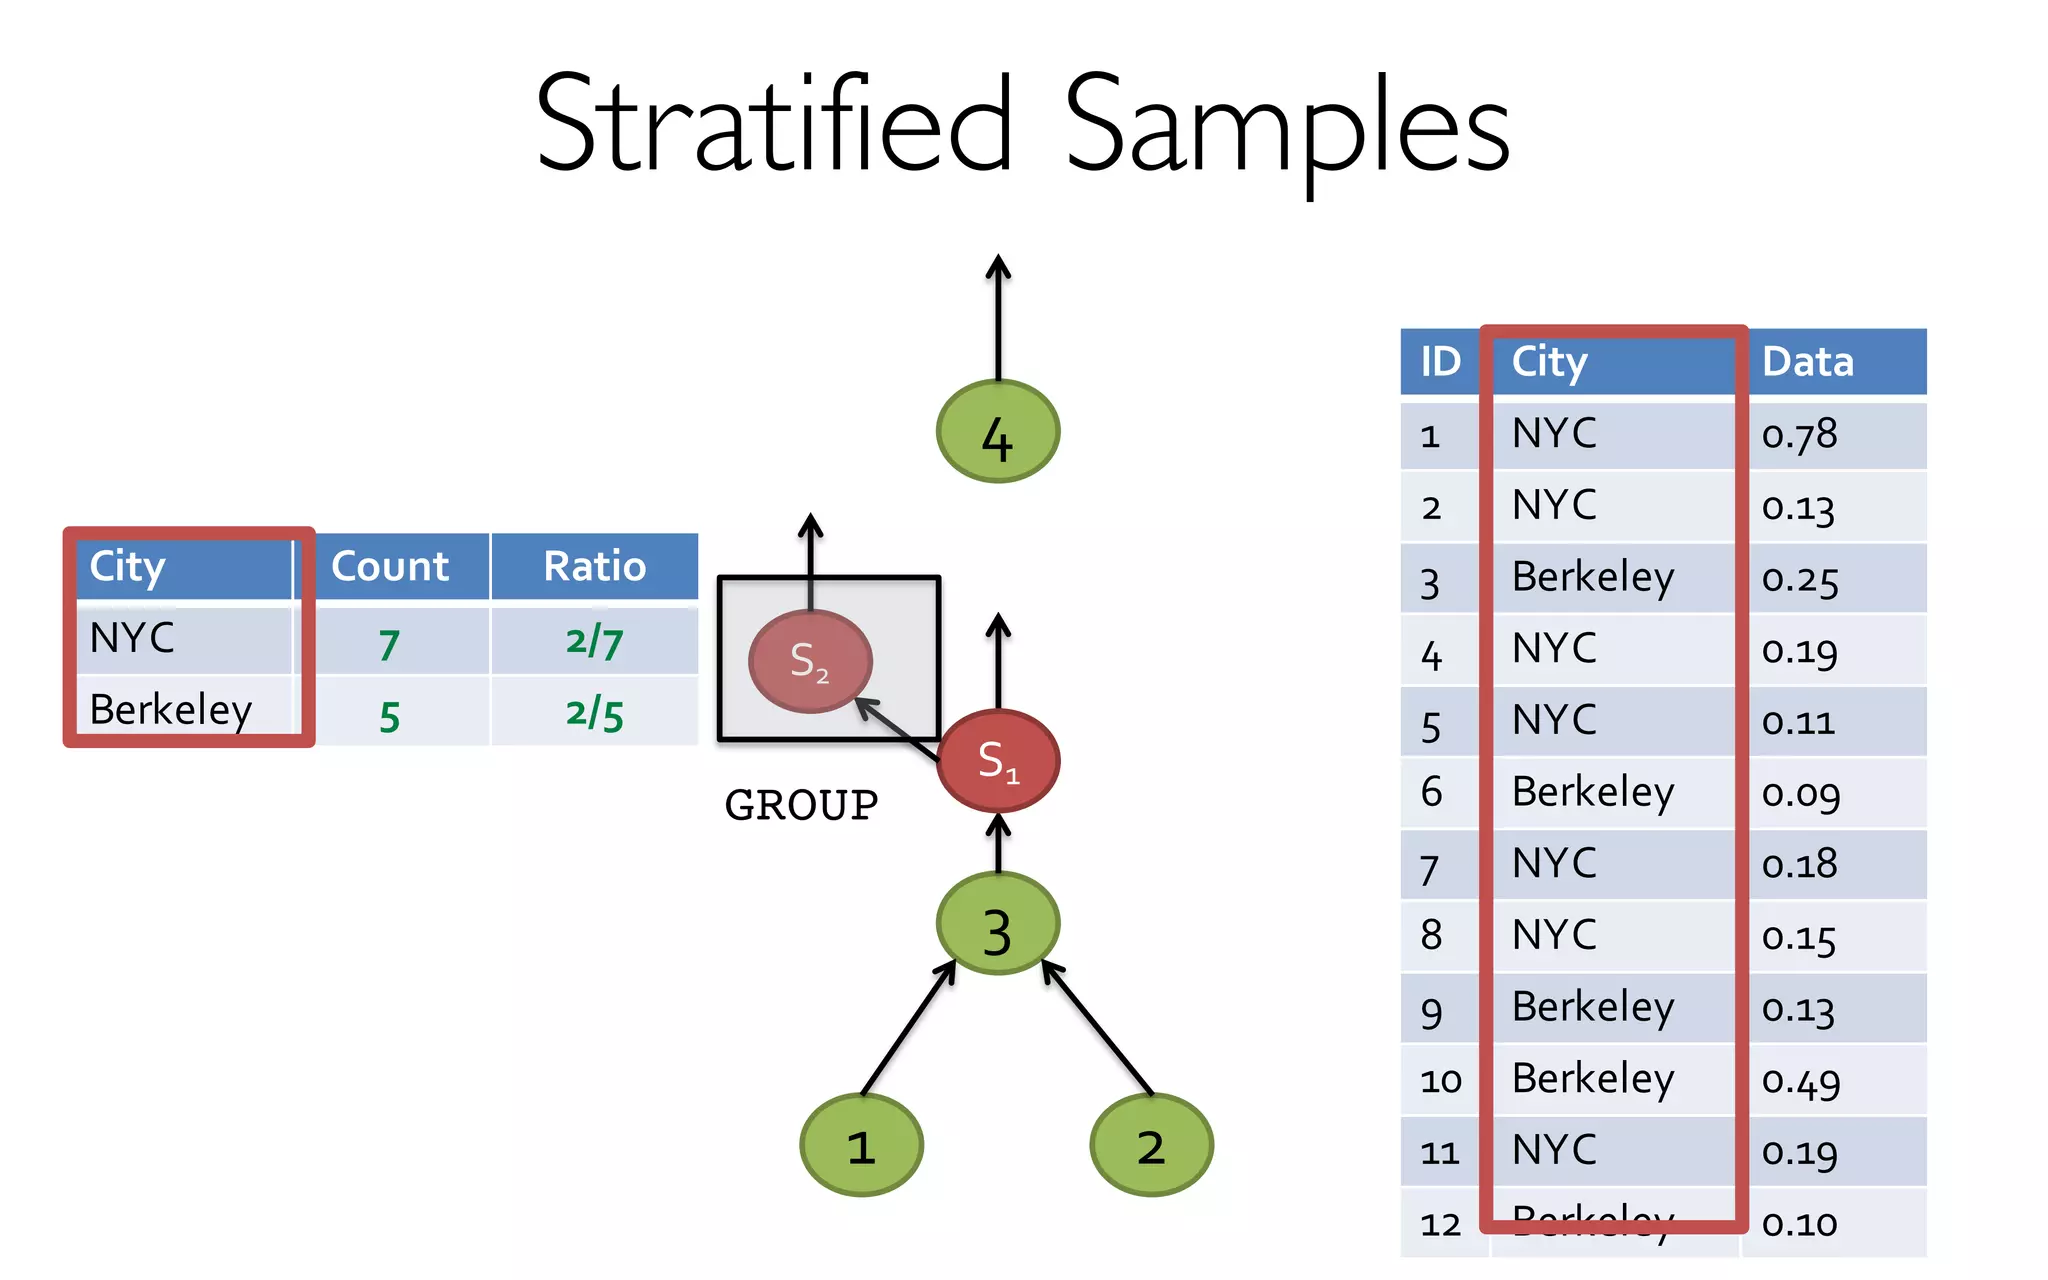
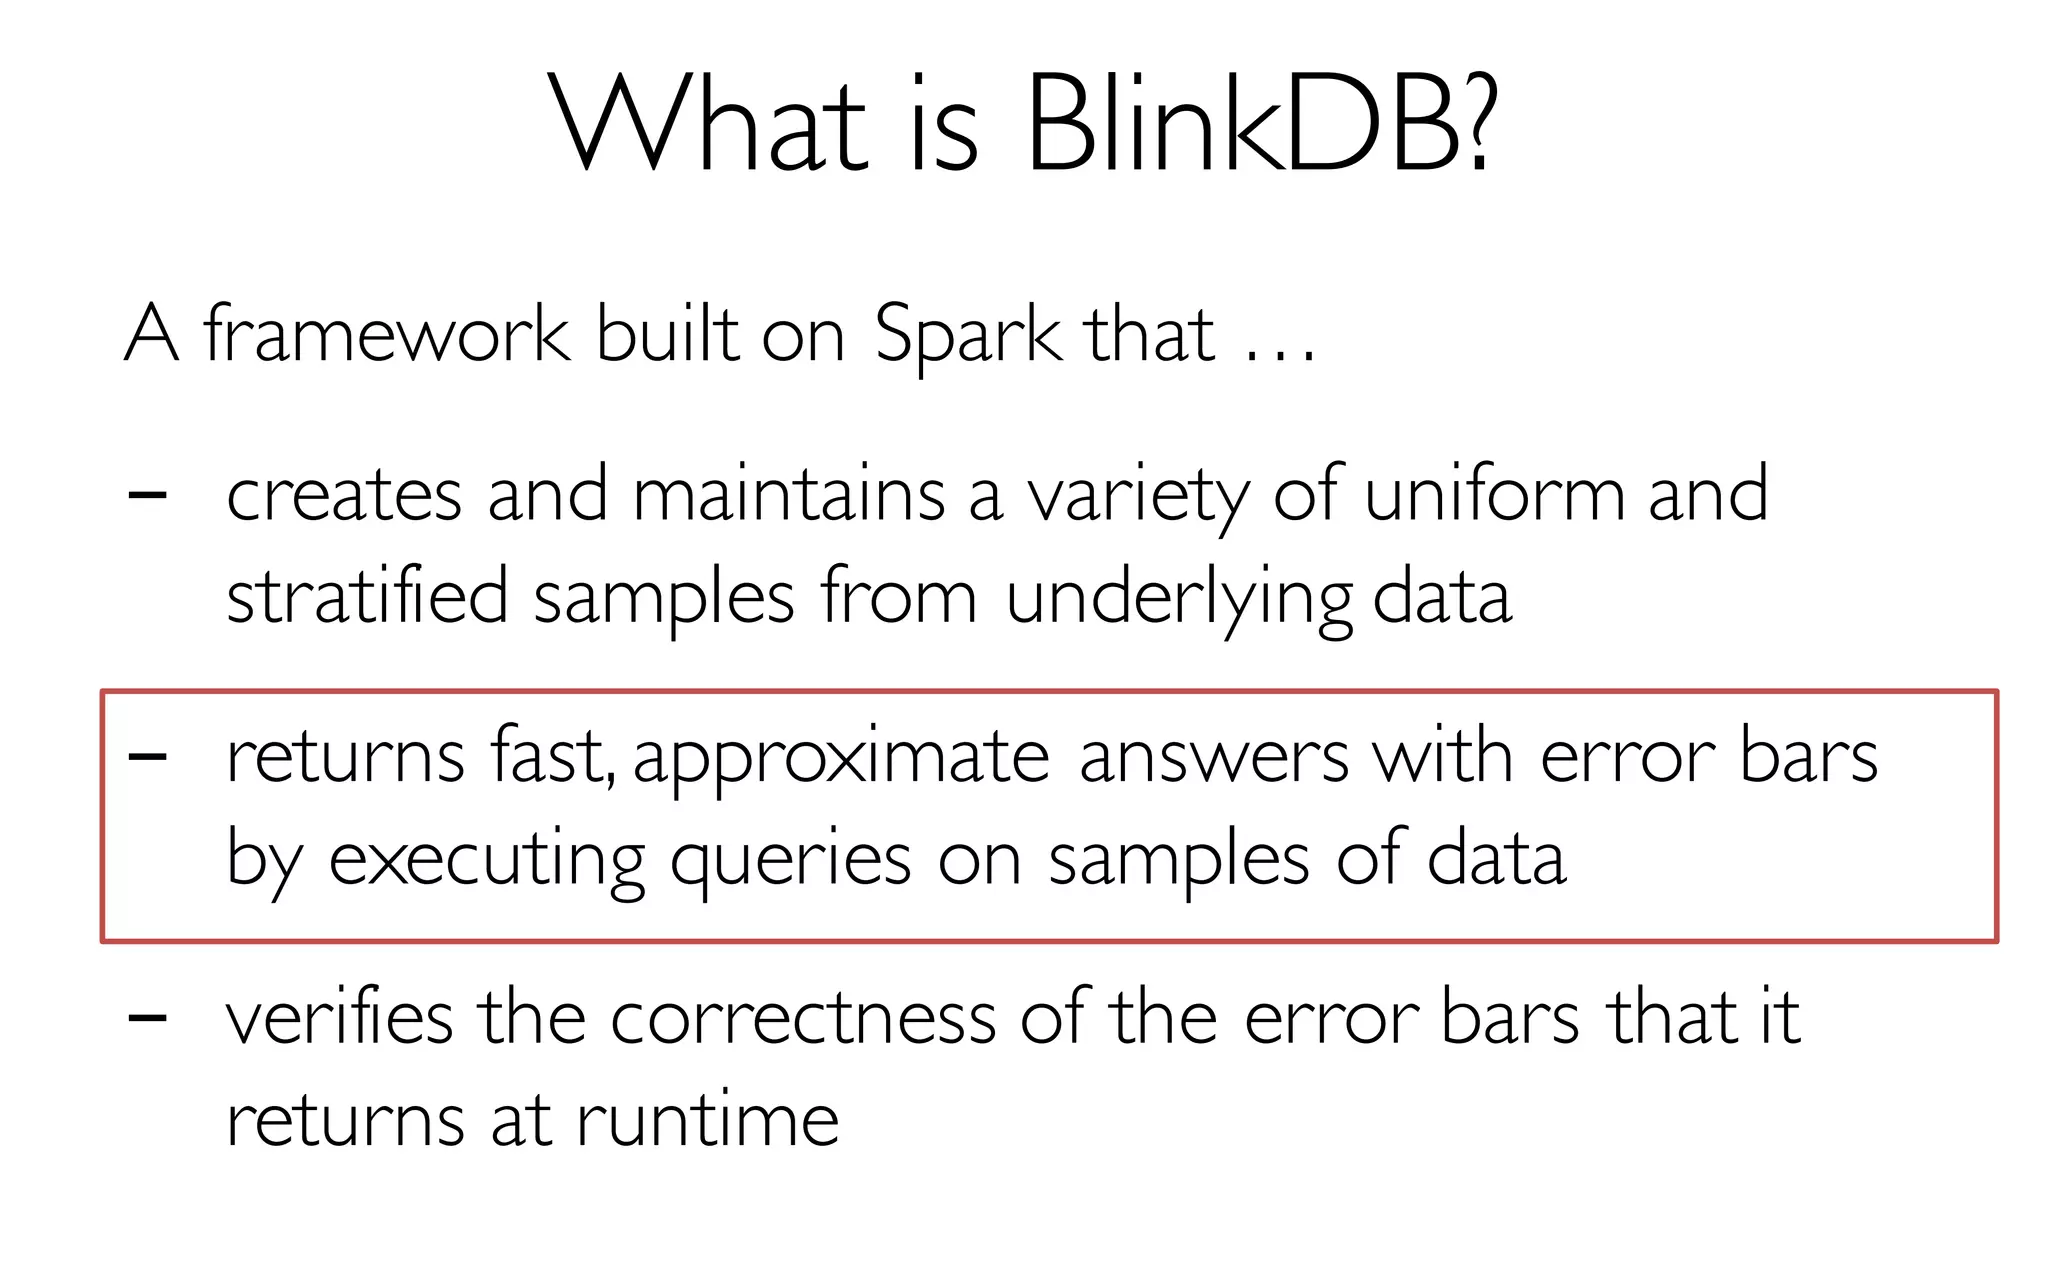
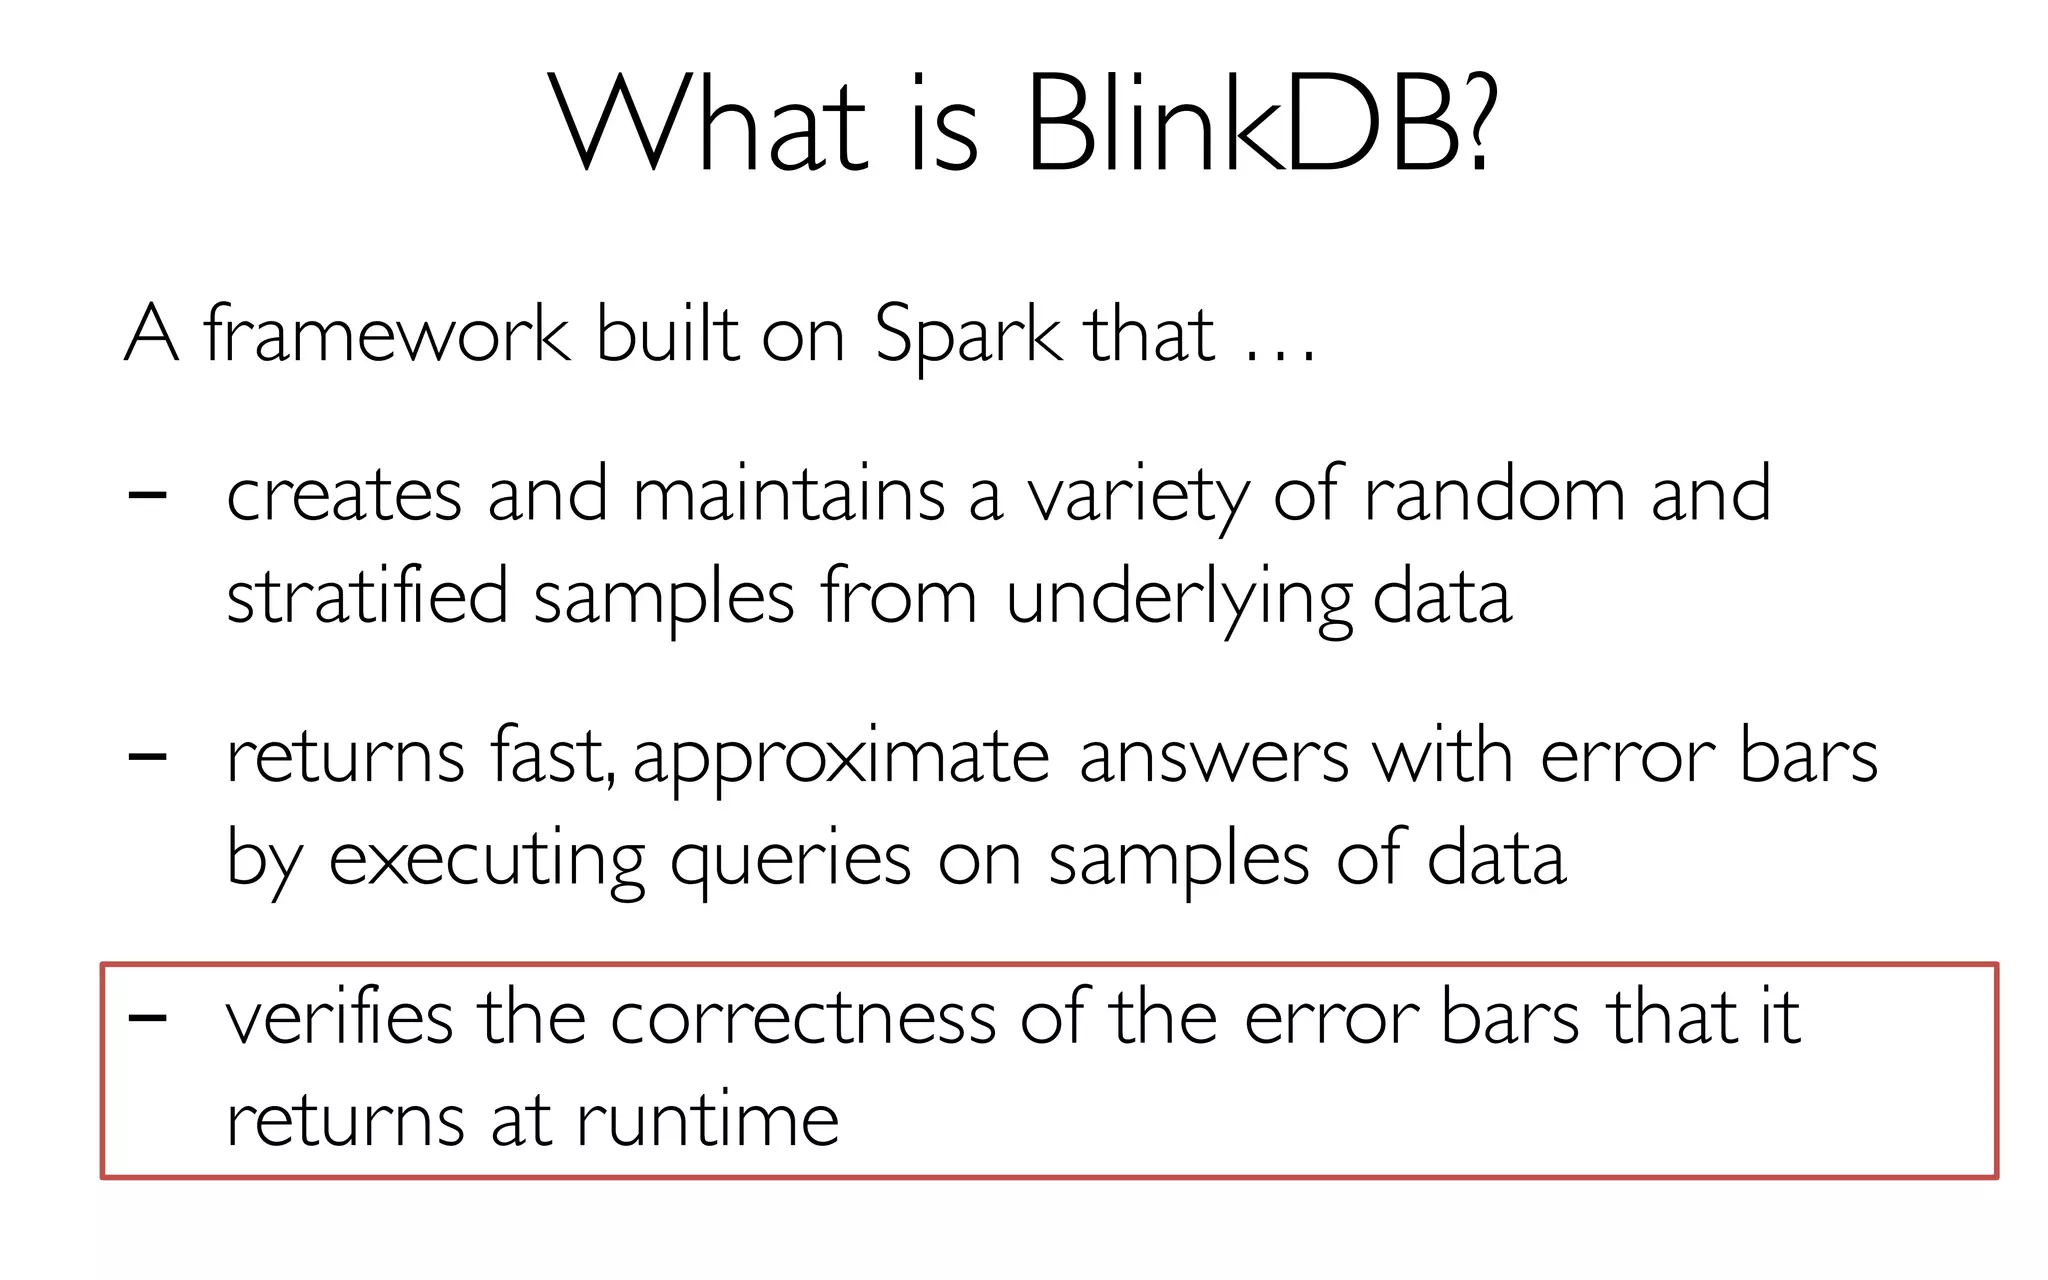
![What is BlinkDB?
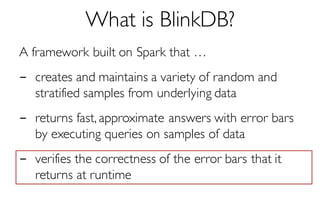
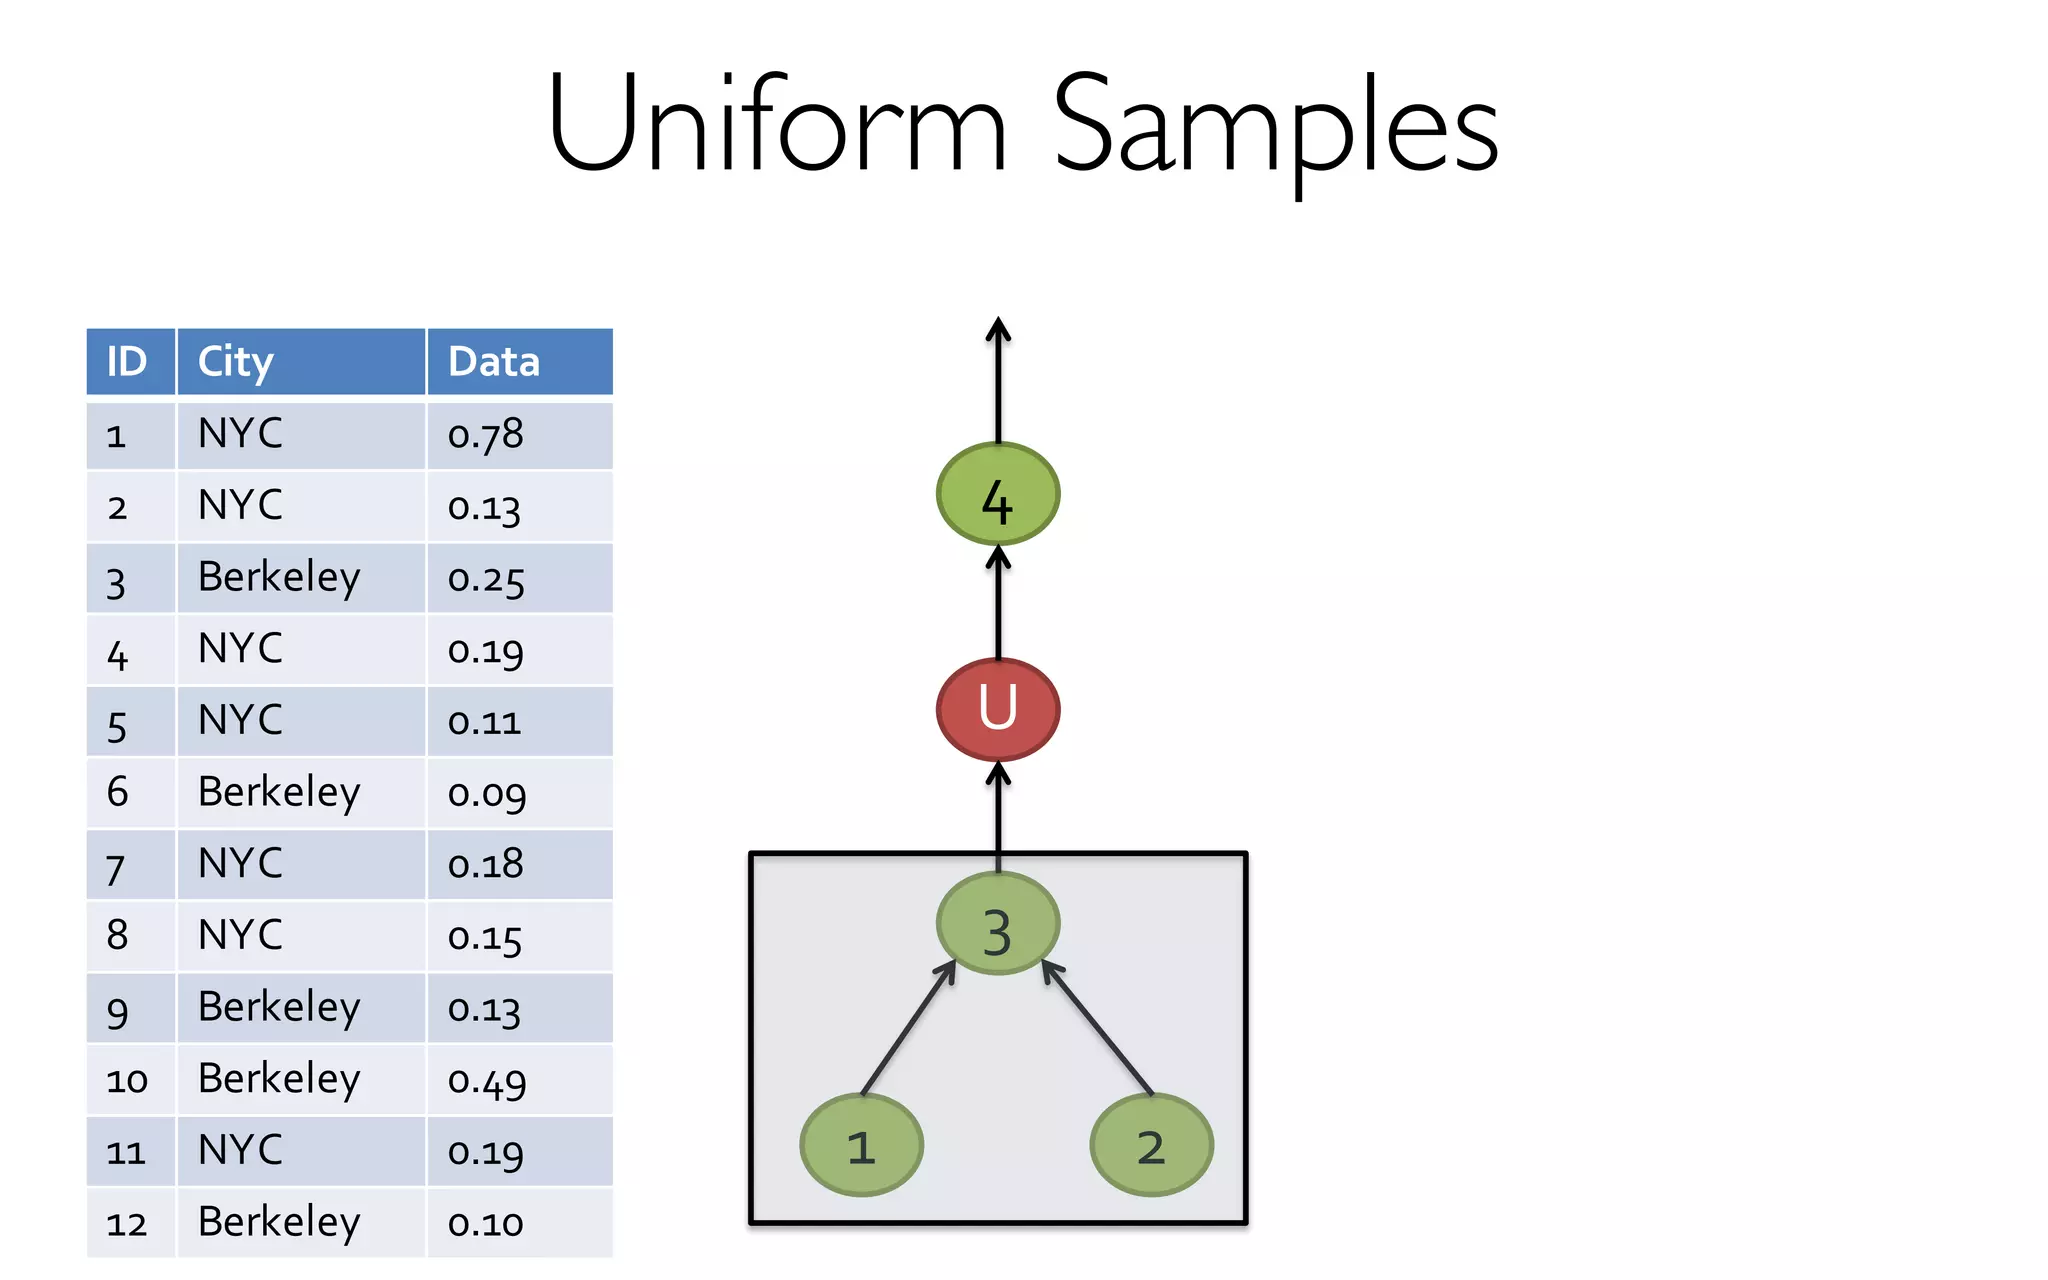
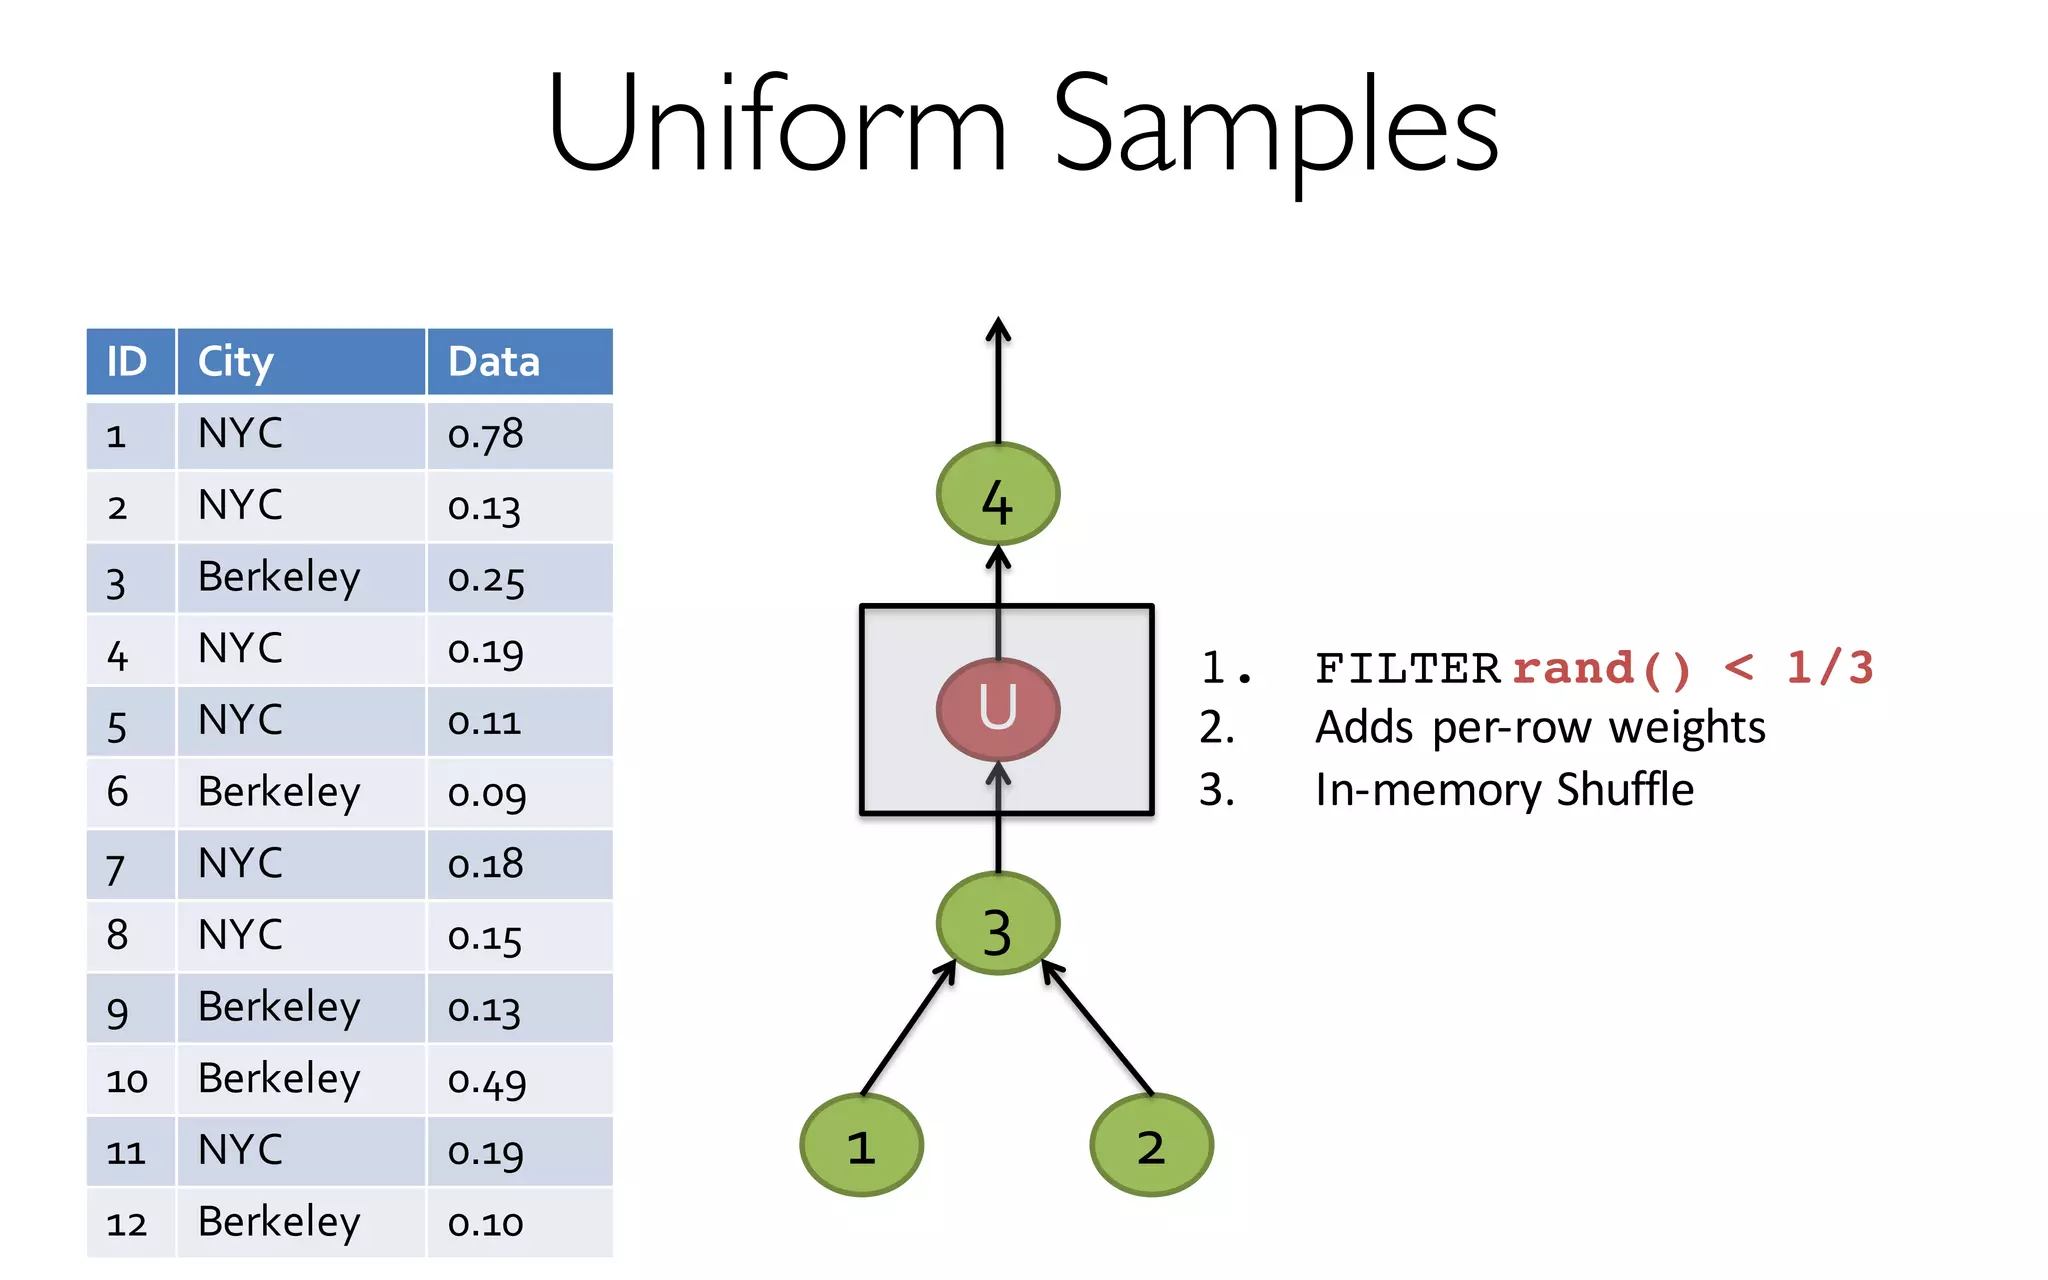
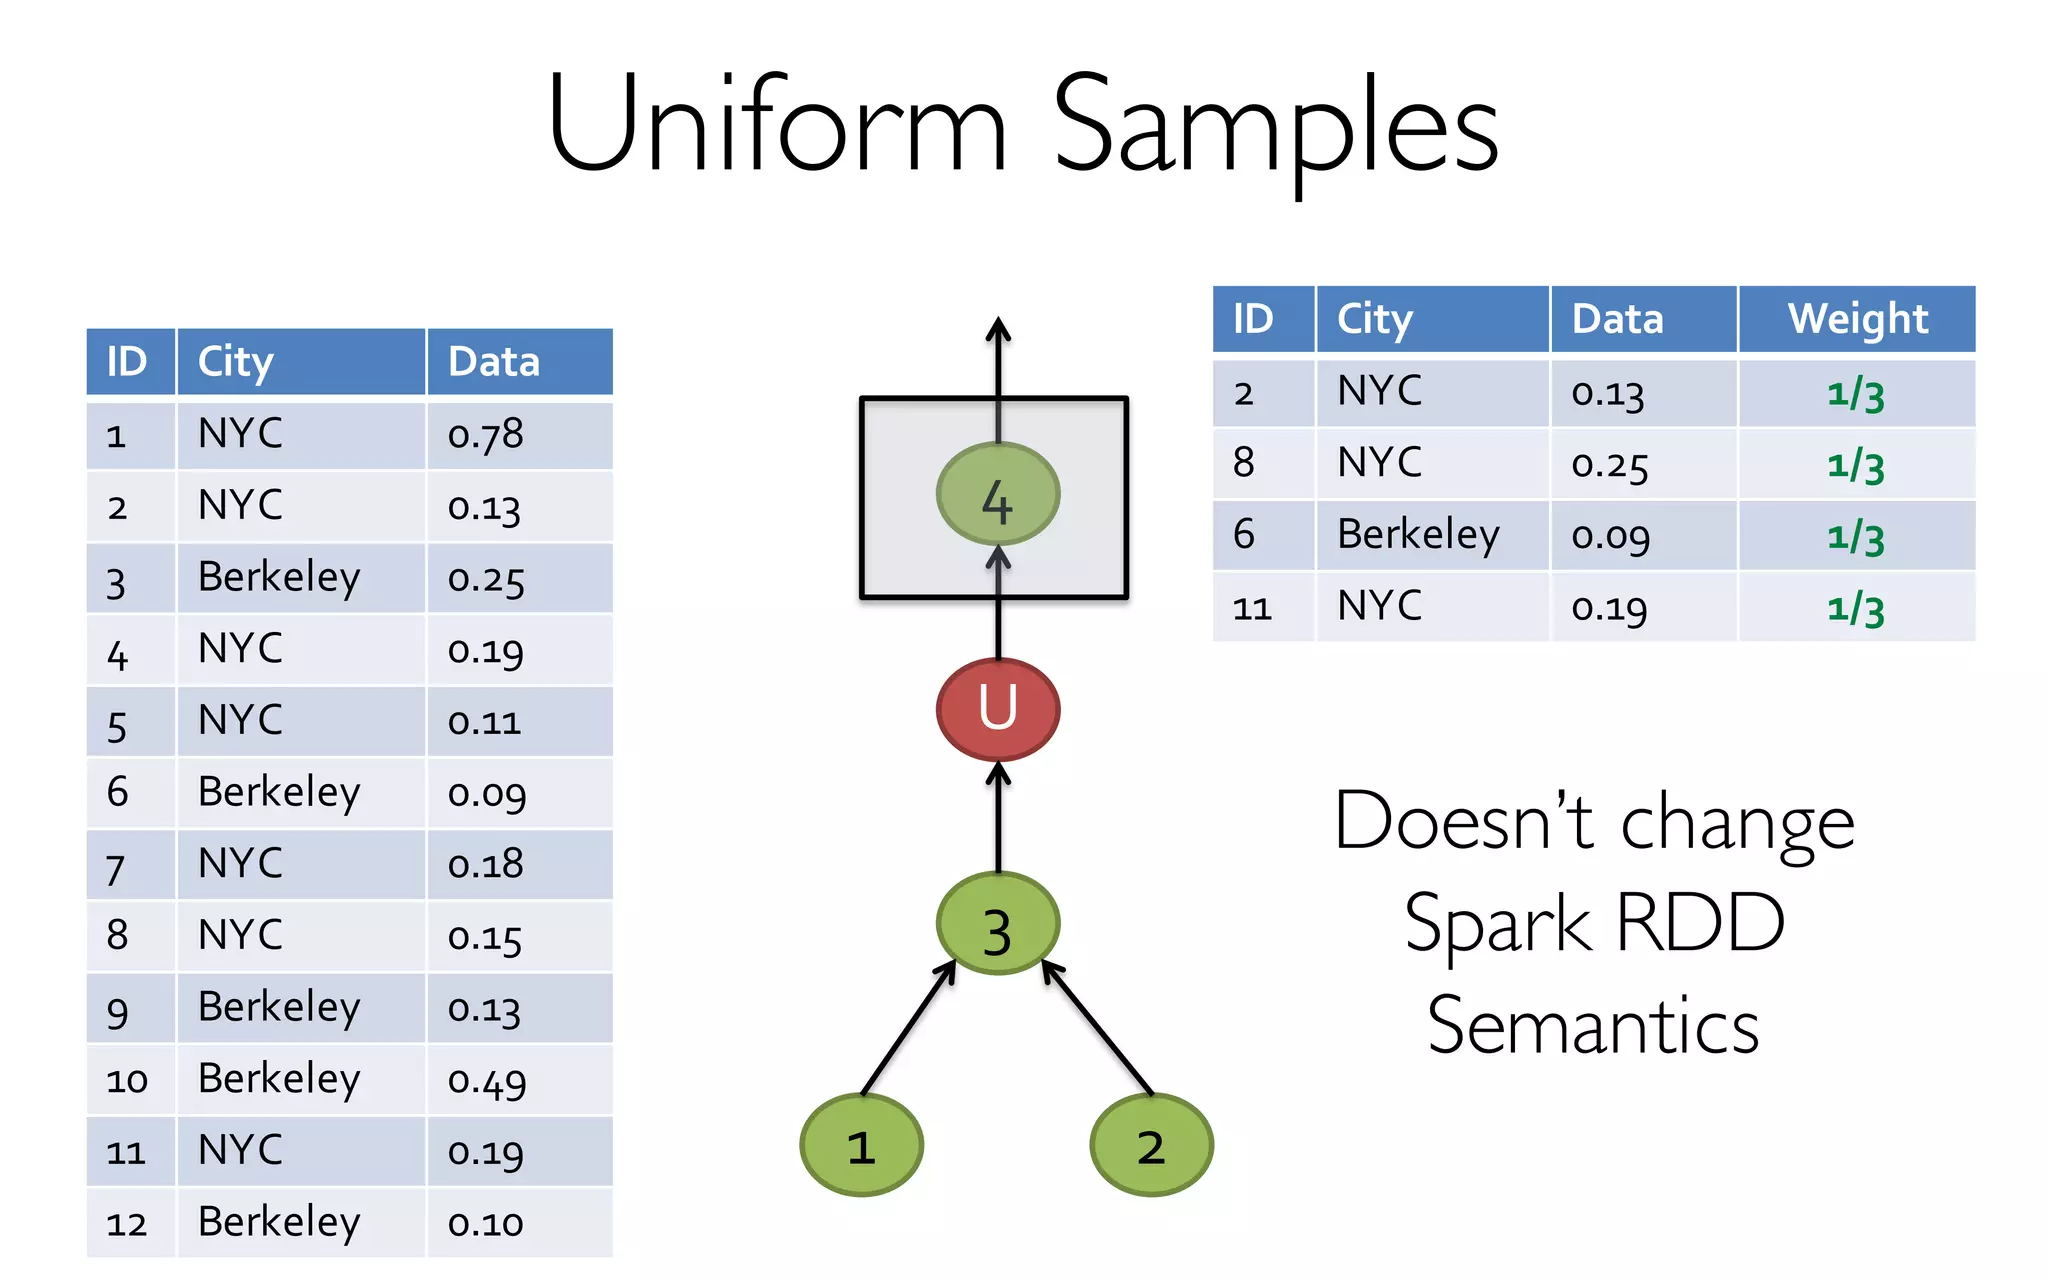
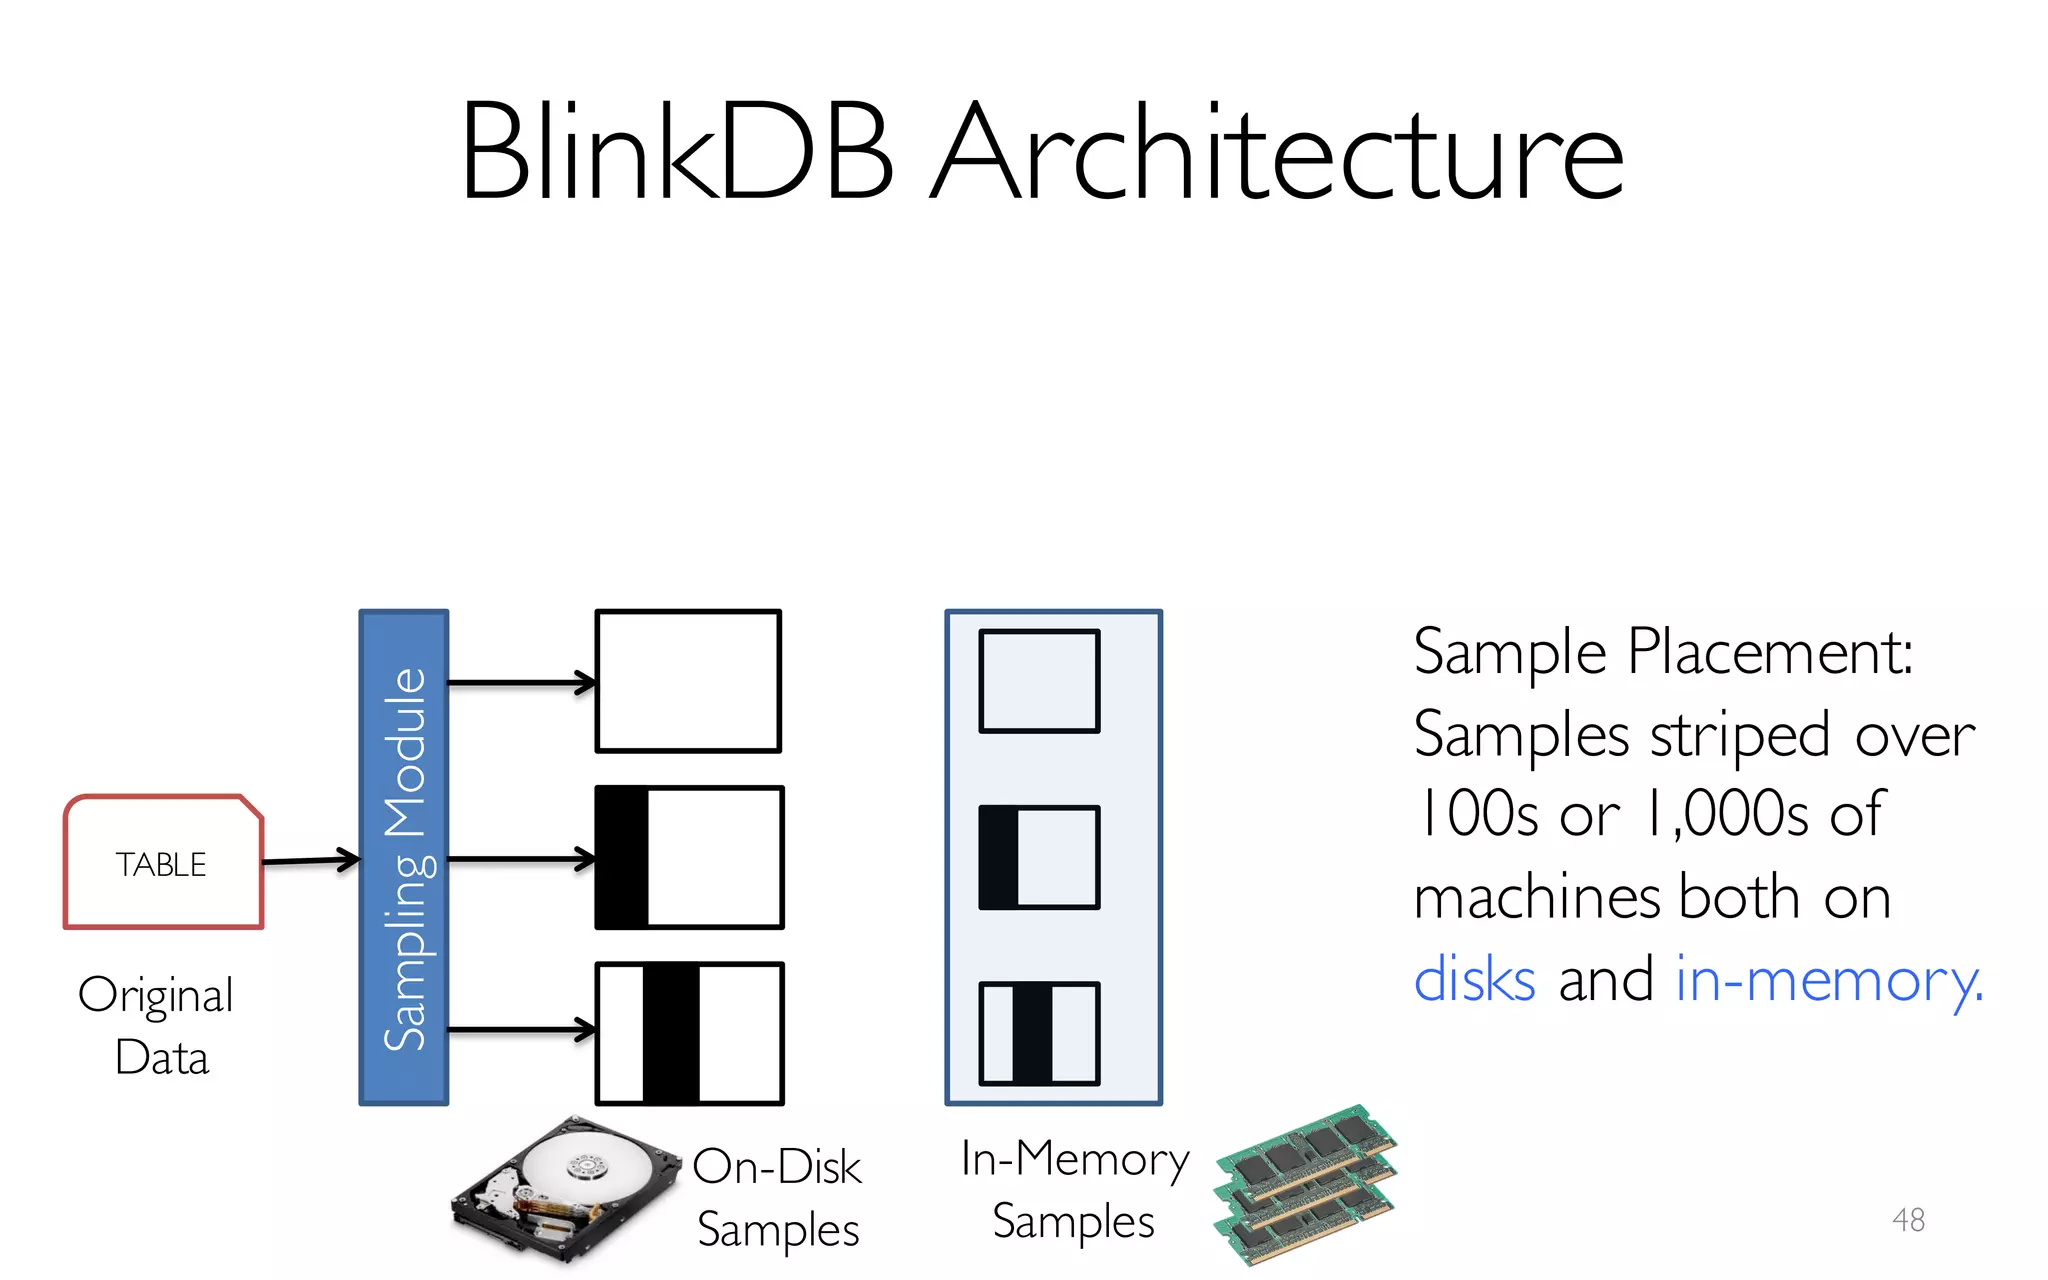
A framework built on Spark that …
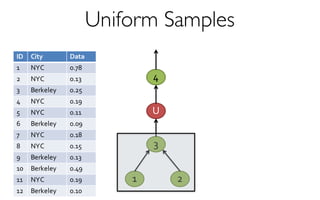
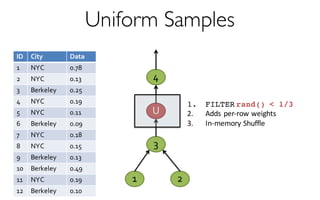
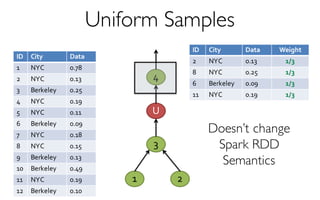
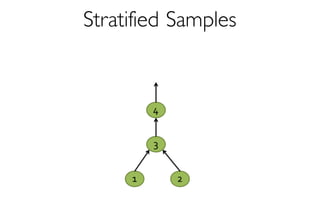
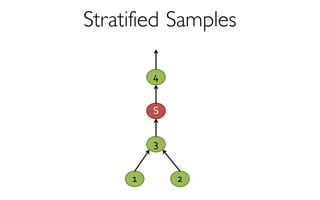
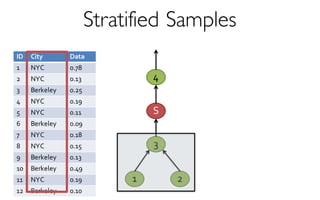
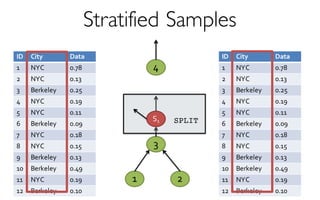
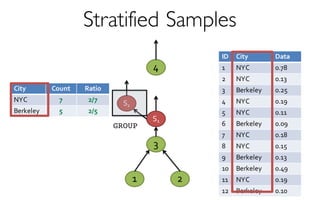
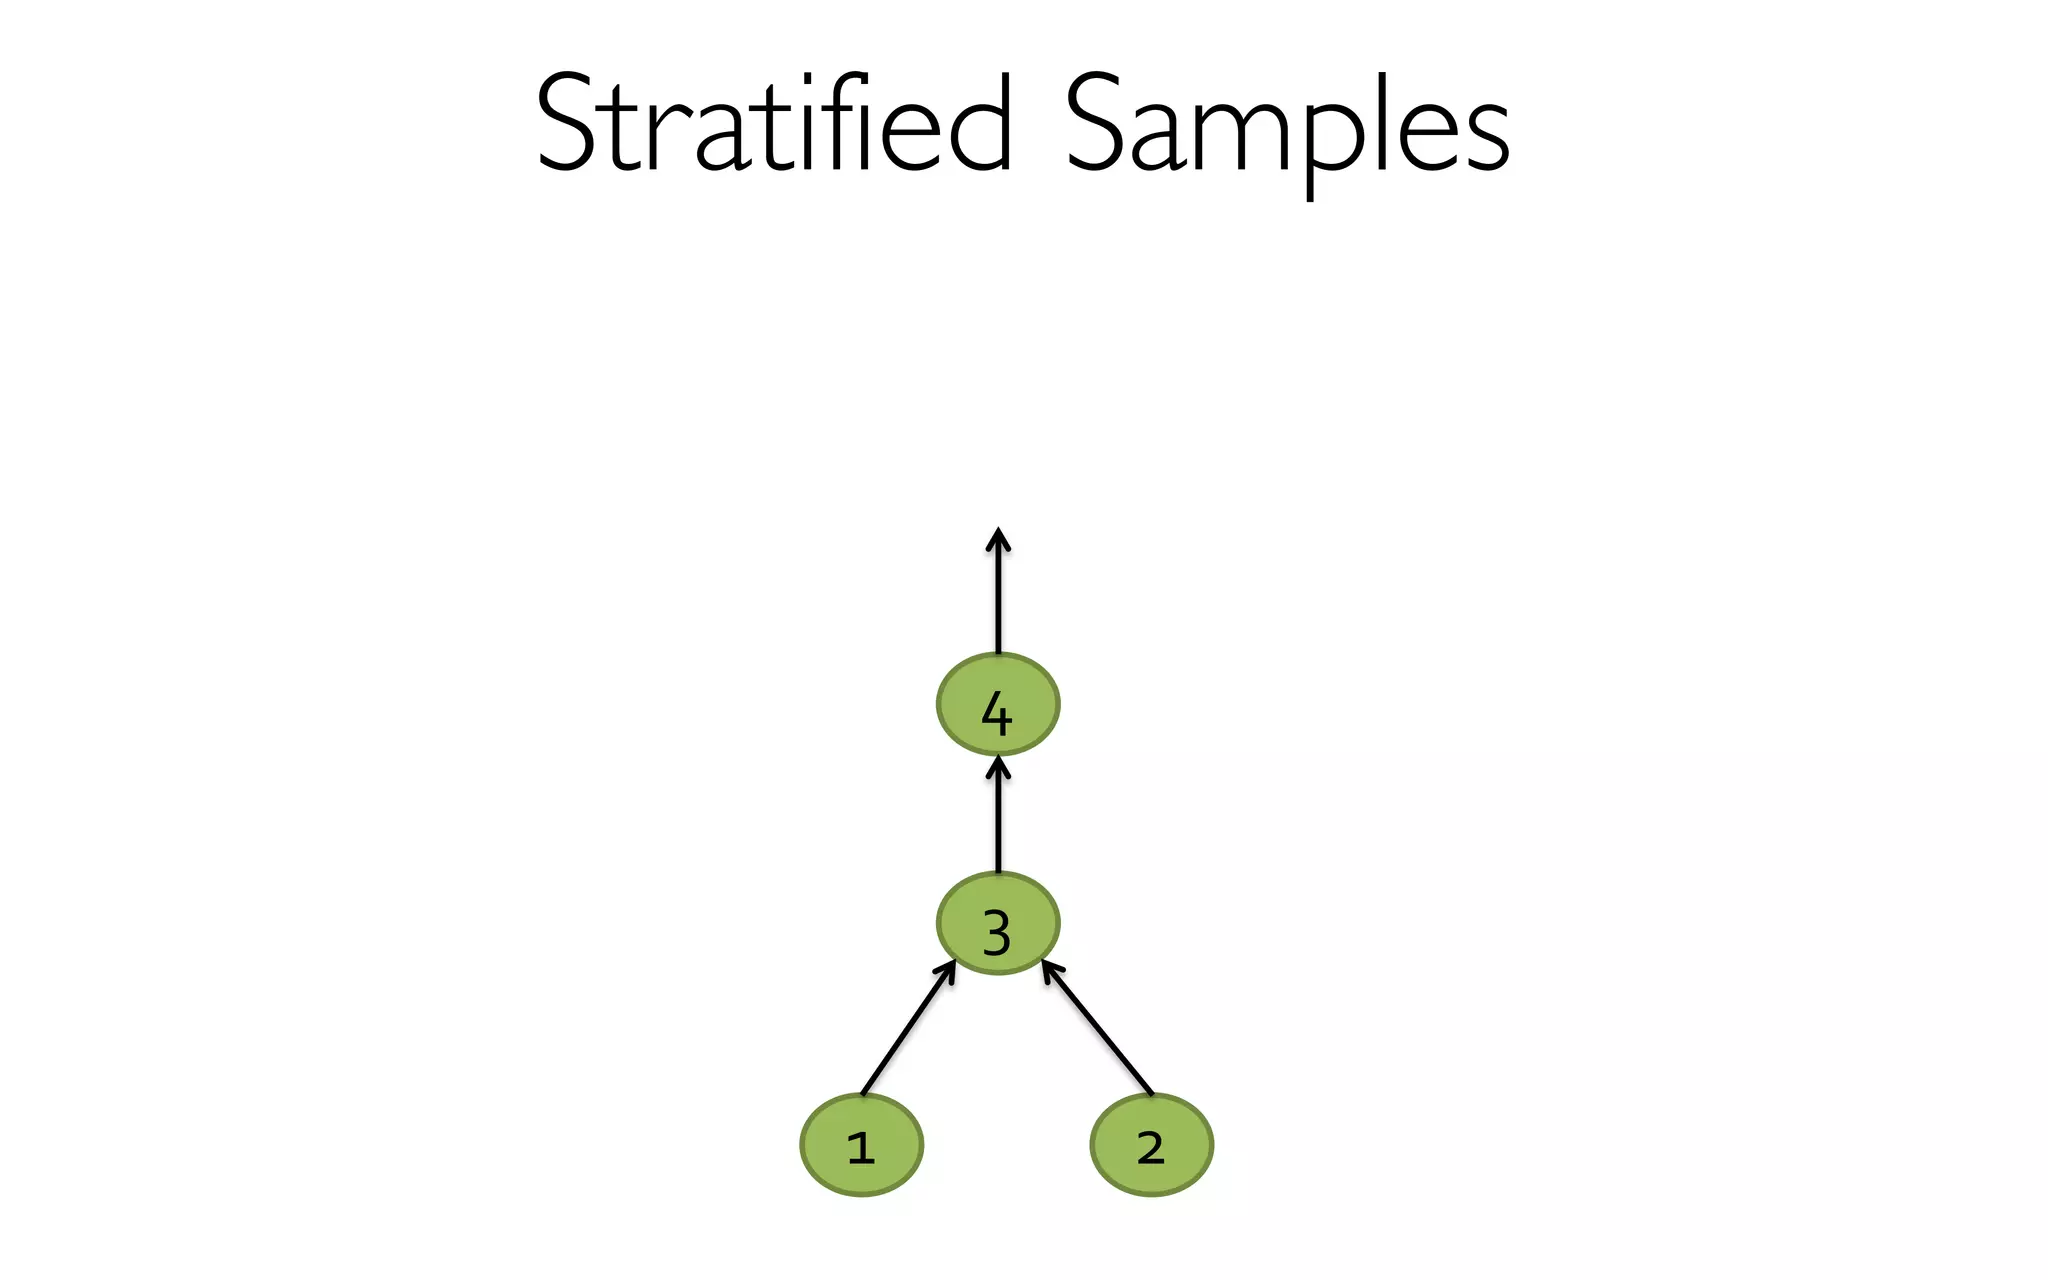
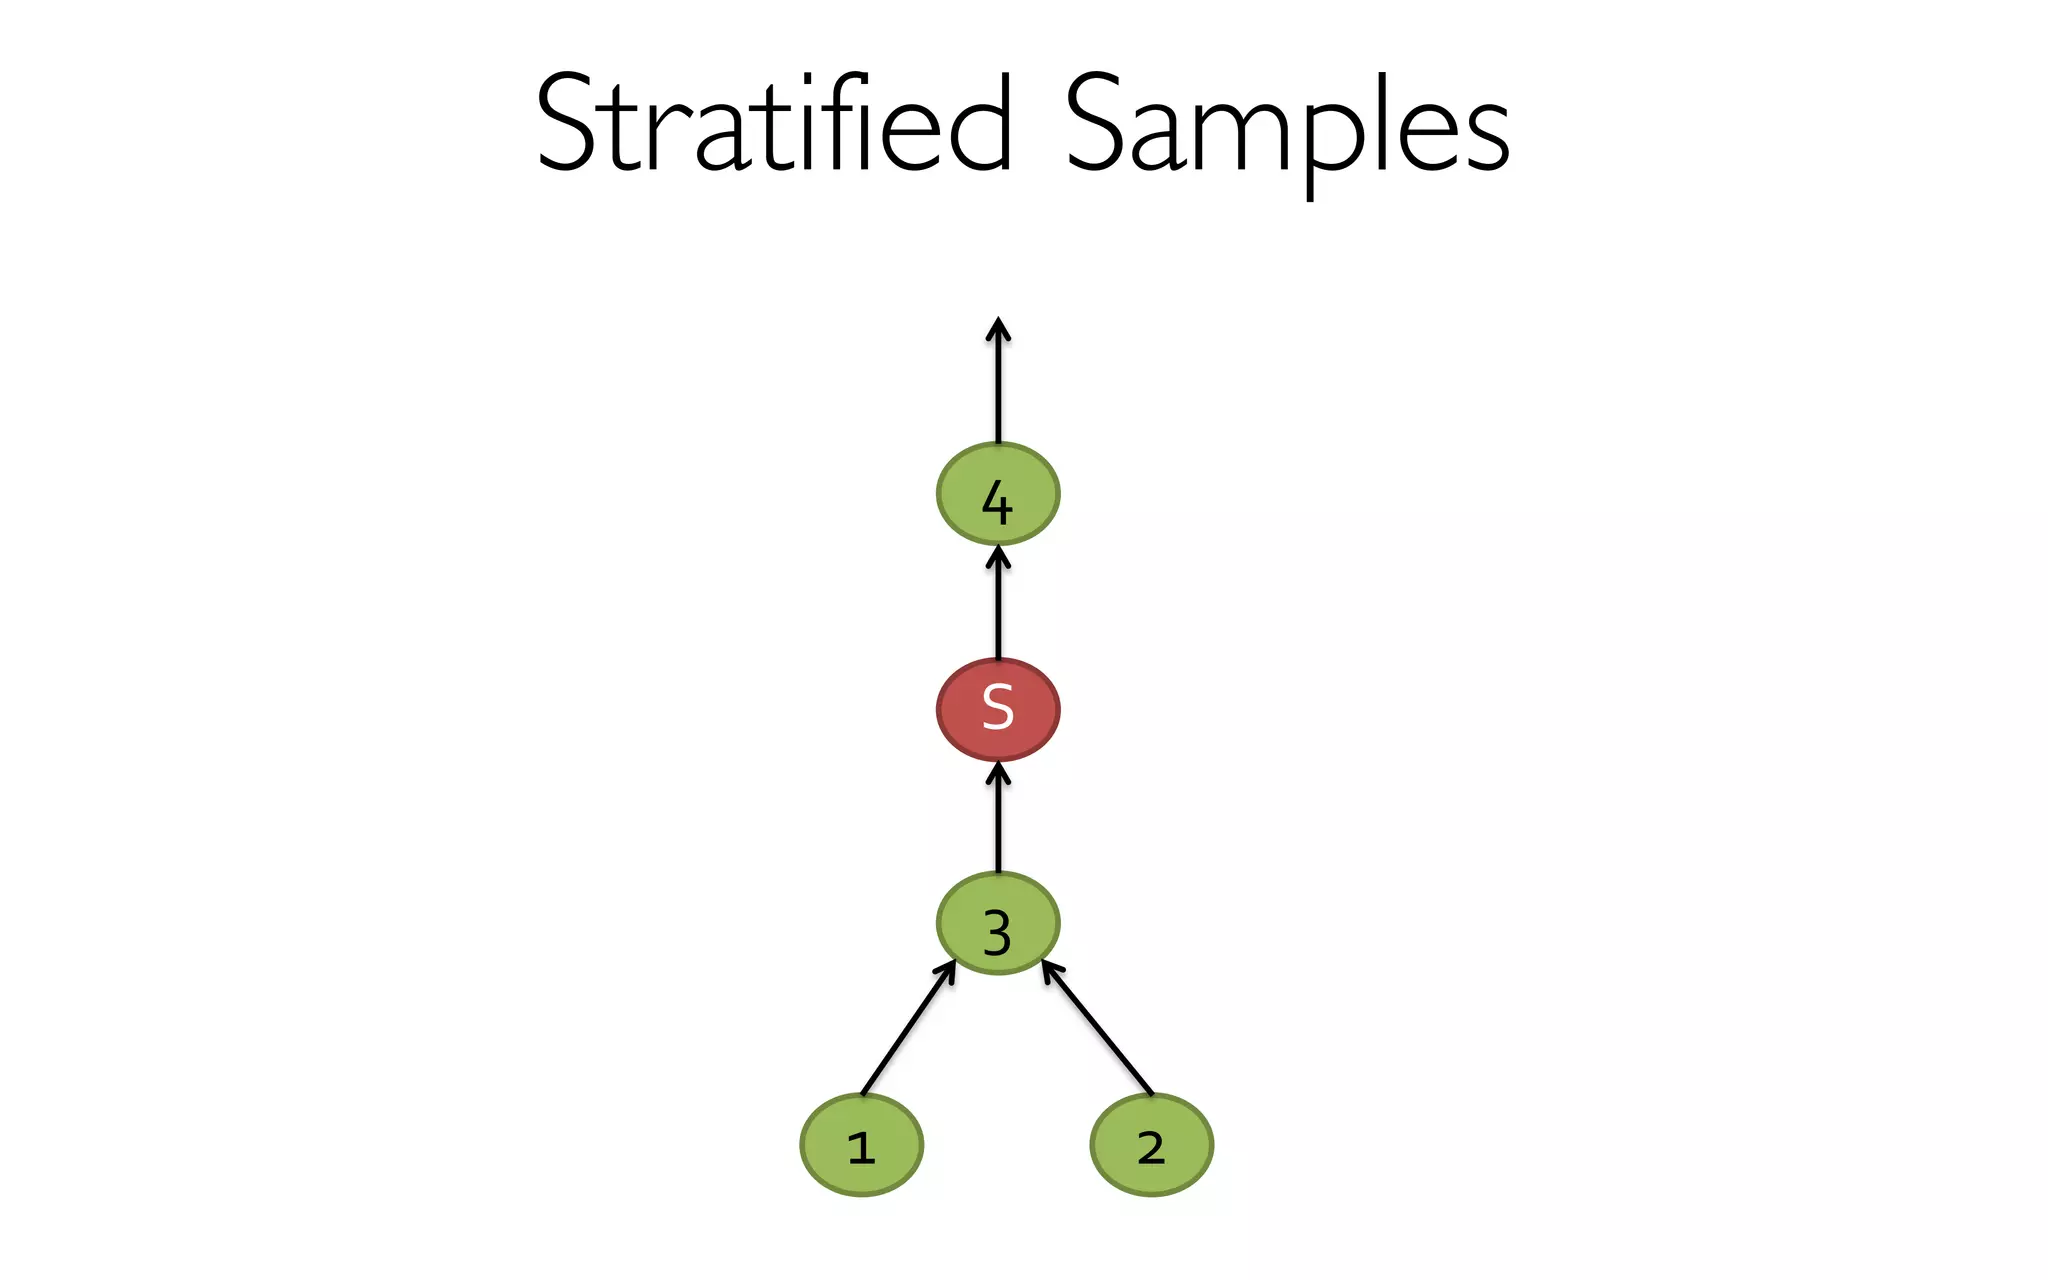
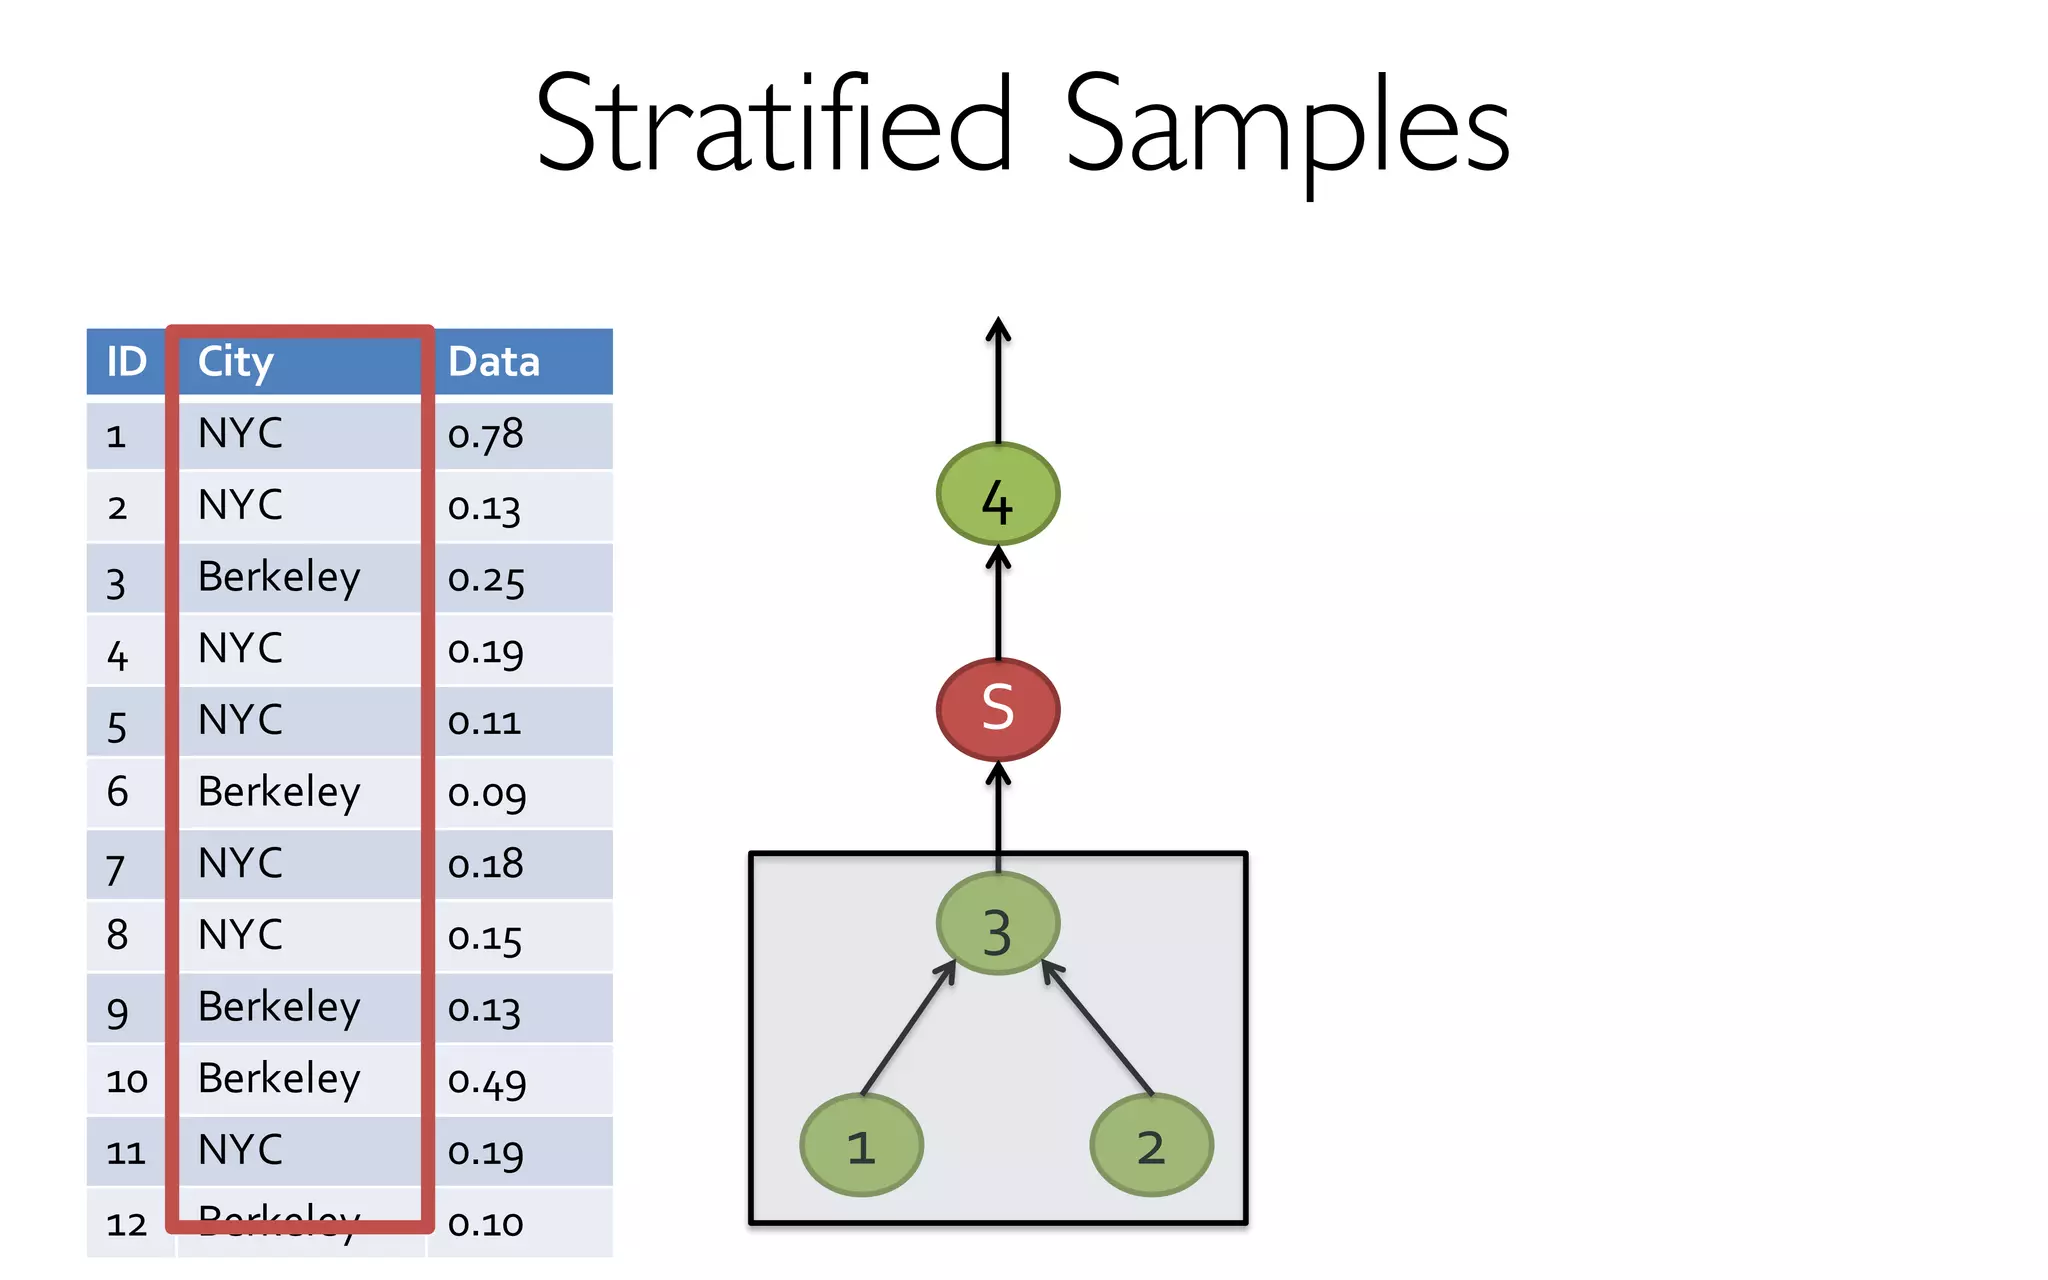
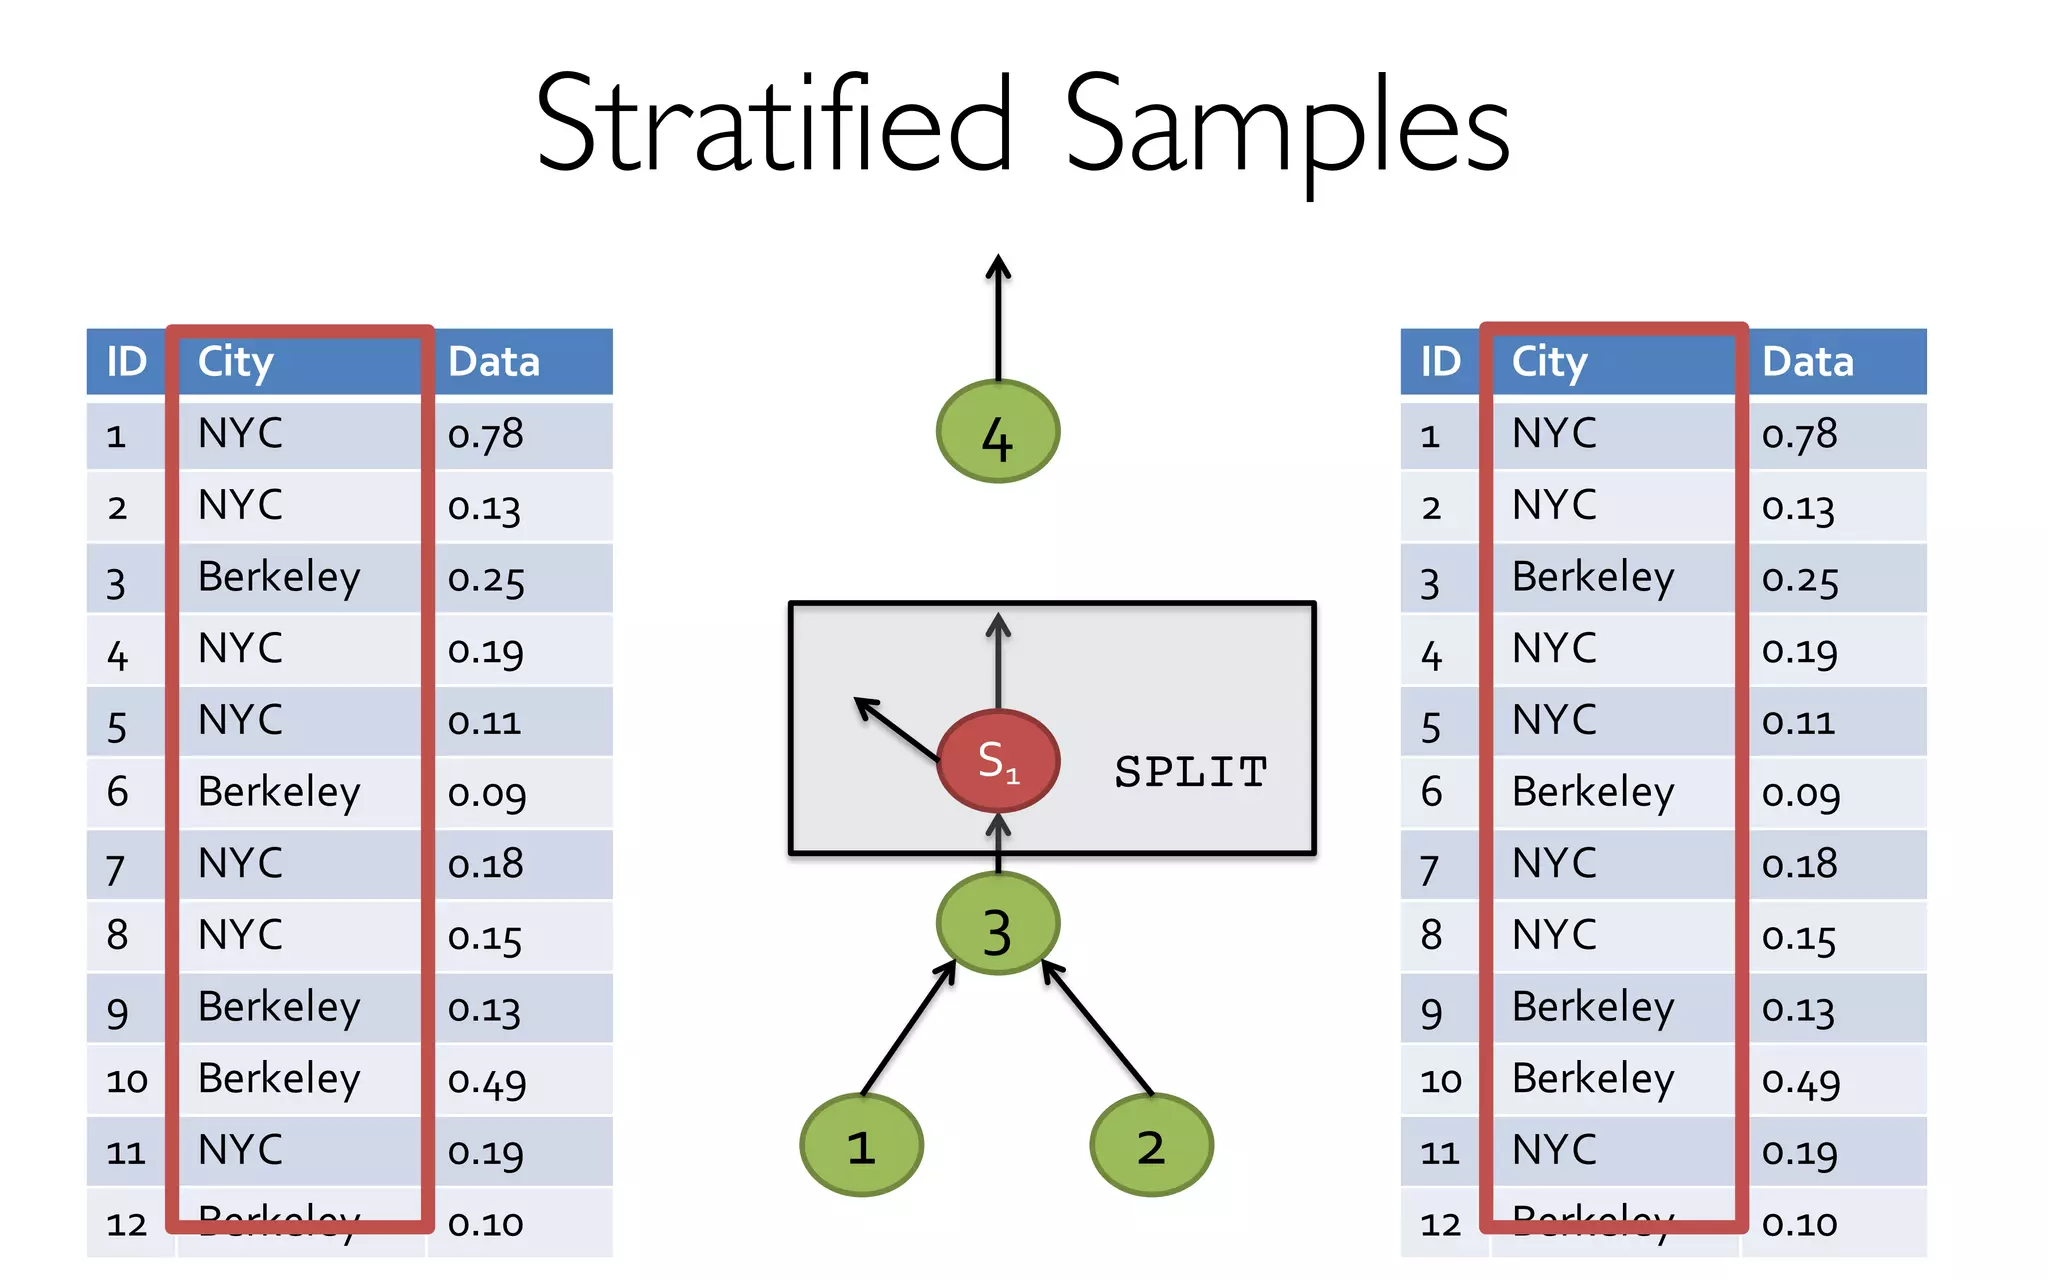
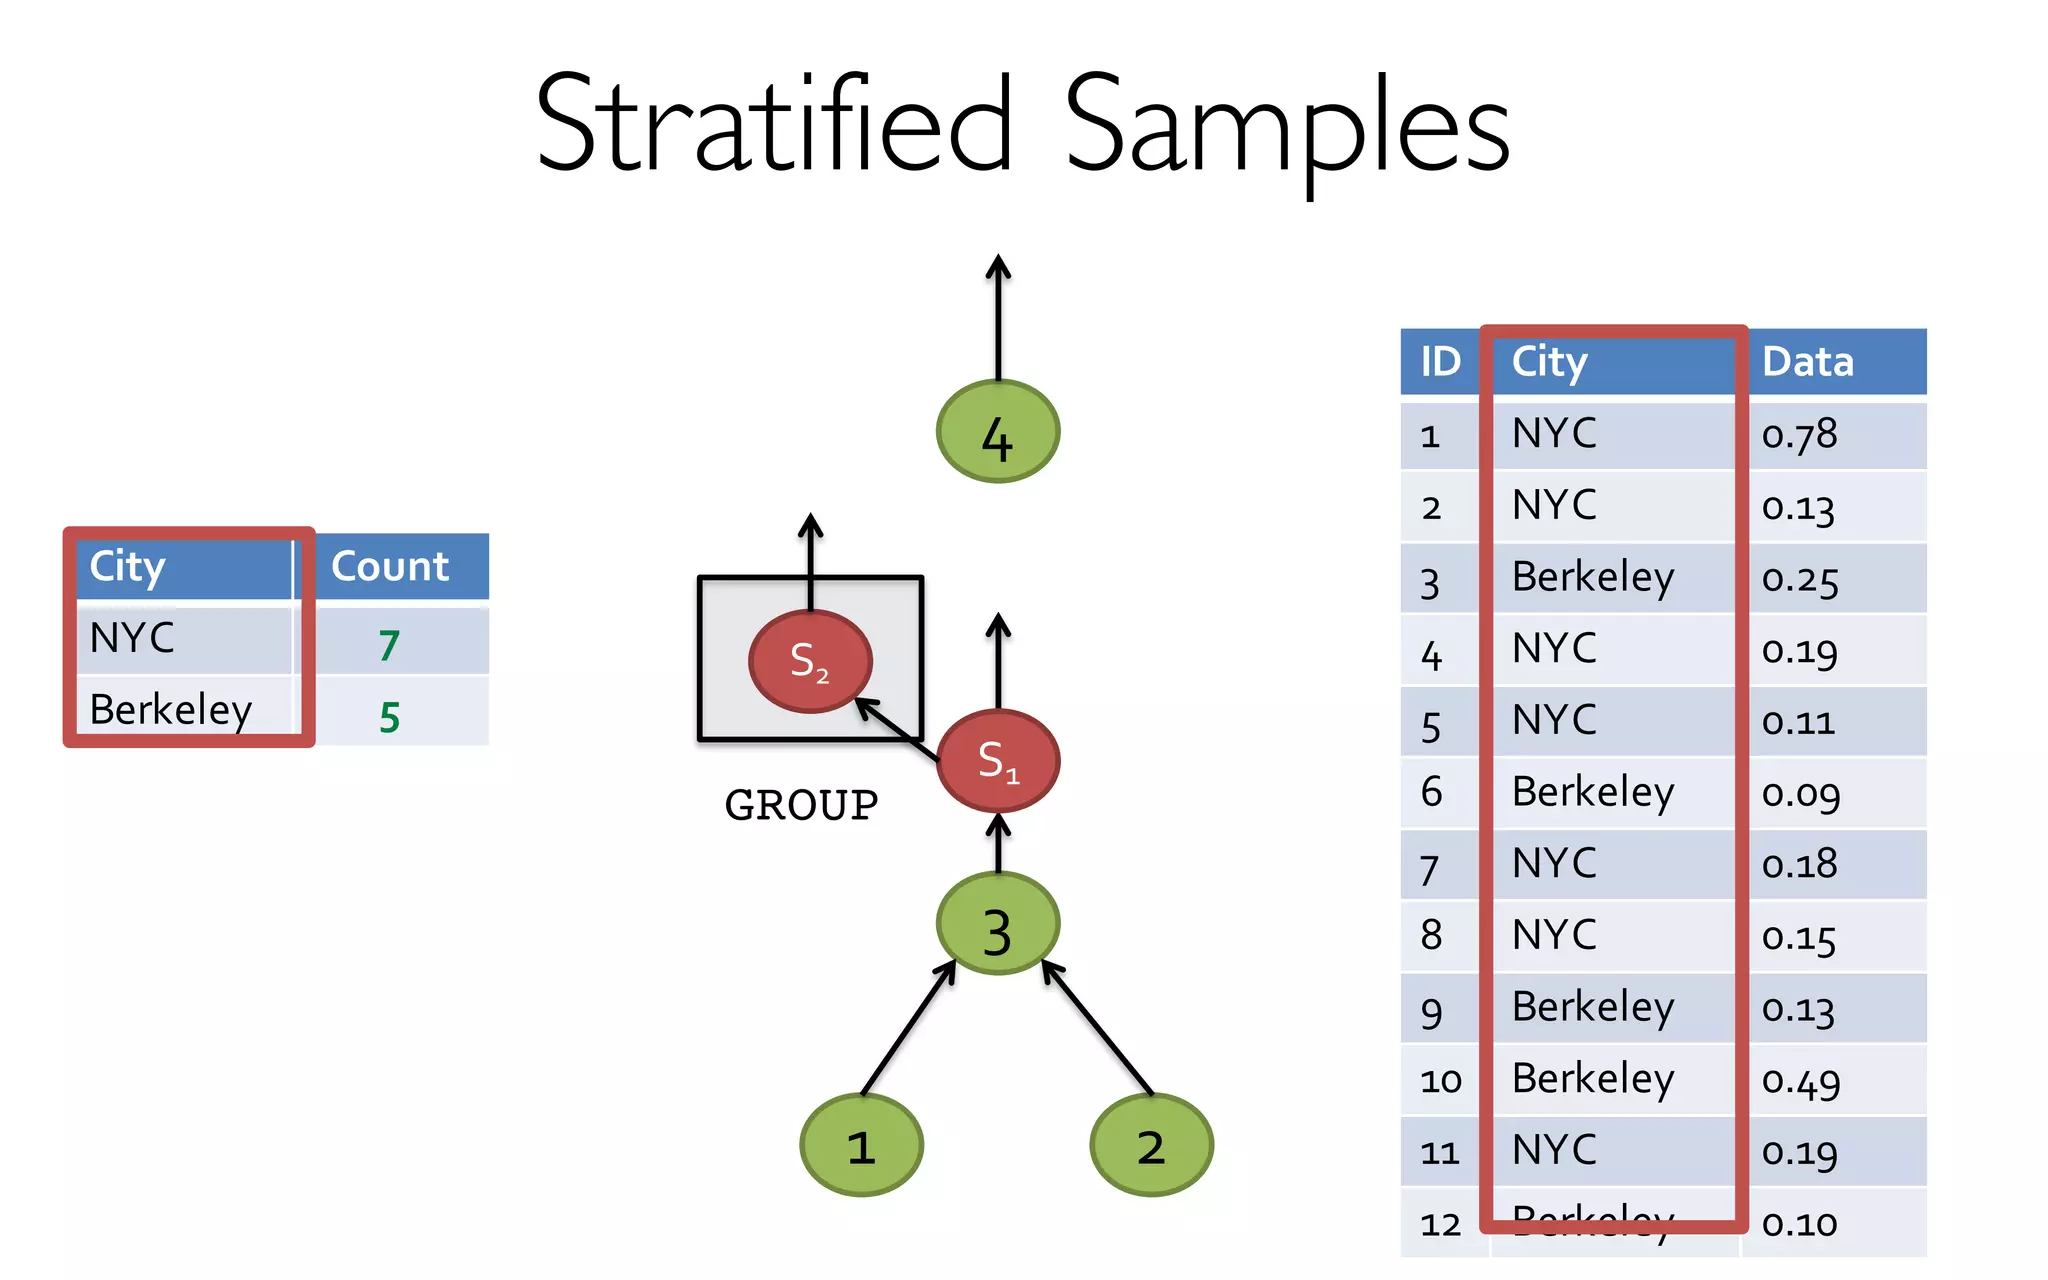
- creates and maintains a variety of uniform and
stratified samples from underlying data
- returns fast, approximate answers with error bars
by executing queries on samples of data
- verifies the correctness of the error bars that it
returns at runtime
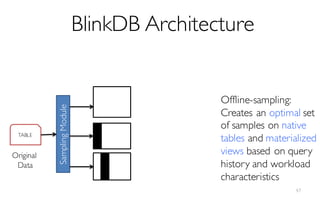
[Offline Process]](https://image.slidesharecdn.com/11-24-2015blinkdb-meetup-151201073306-lva1-app6891/85/BlinkDB-Approximate-Queries-on-Very-Large-Data-45-320.jpg)
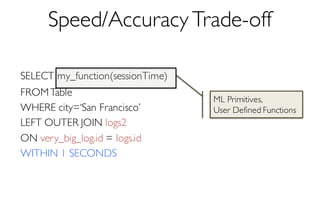
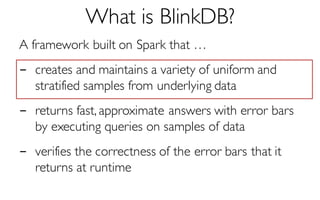
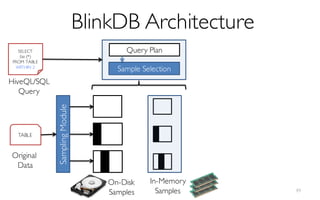
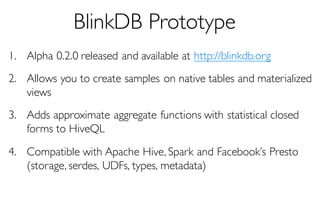
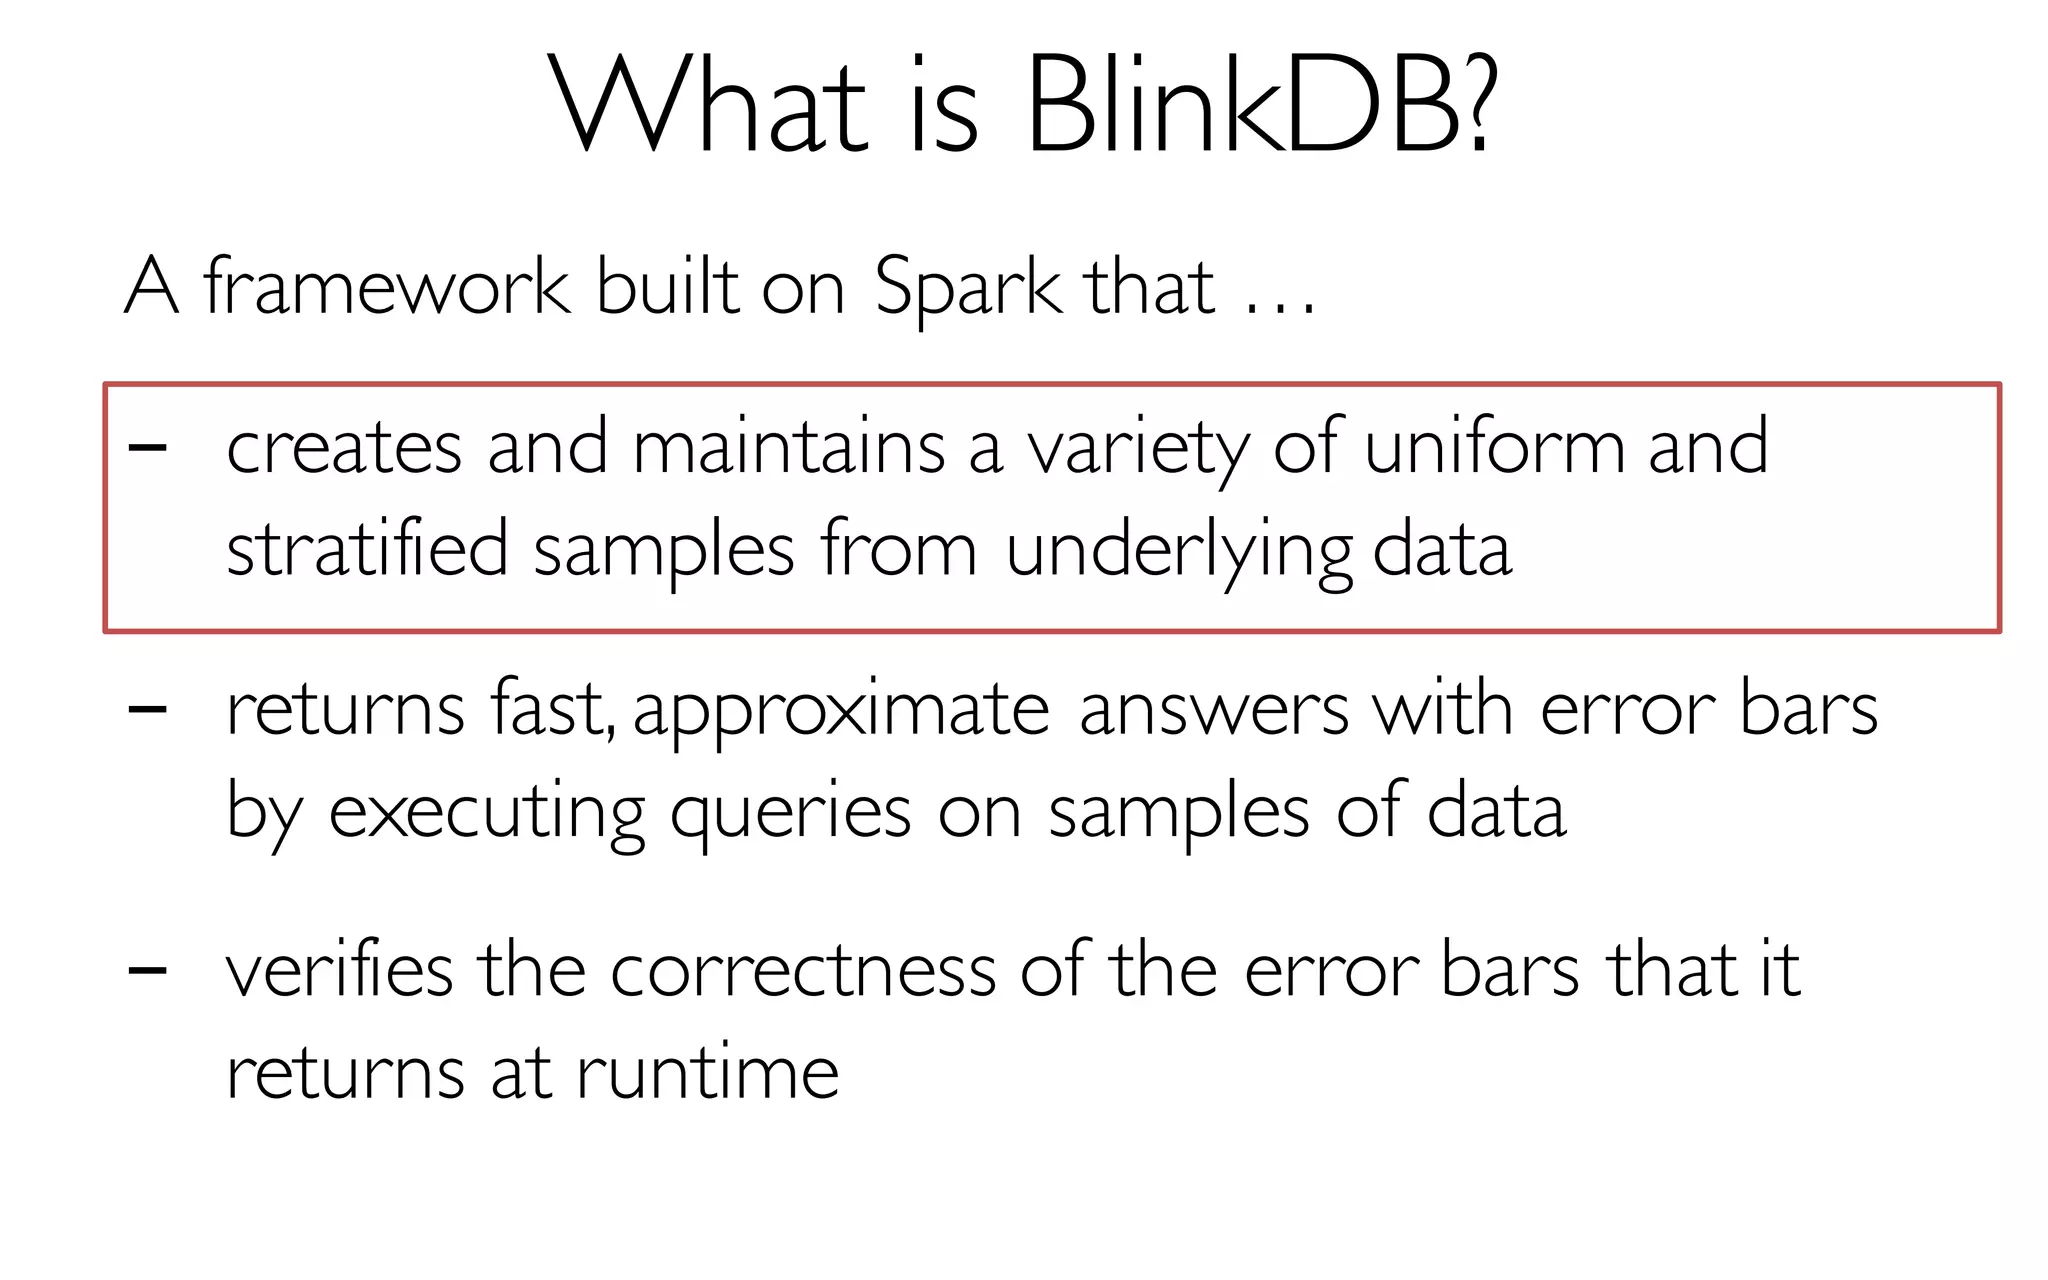
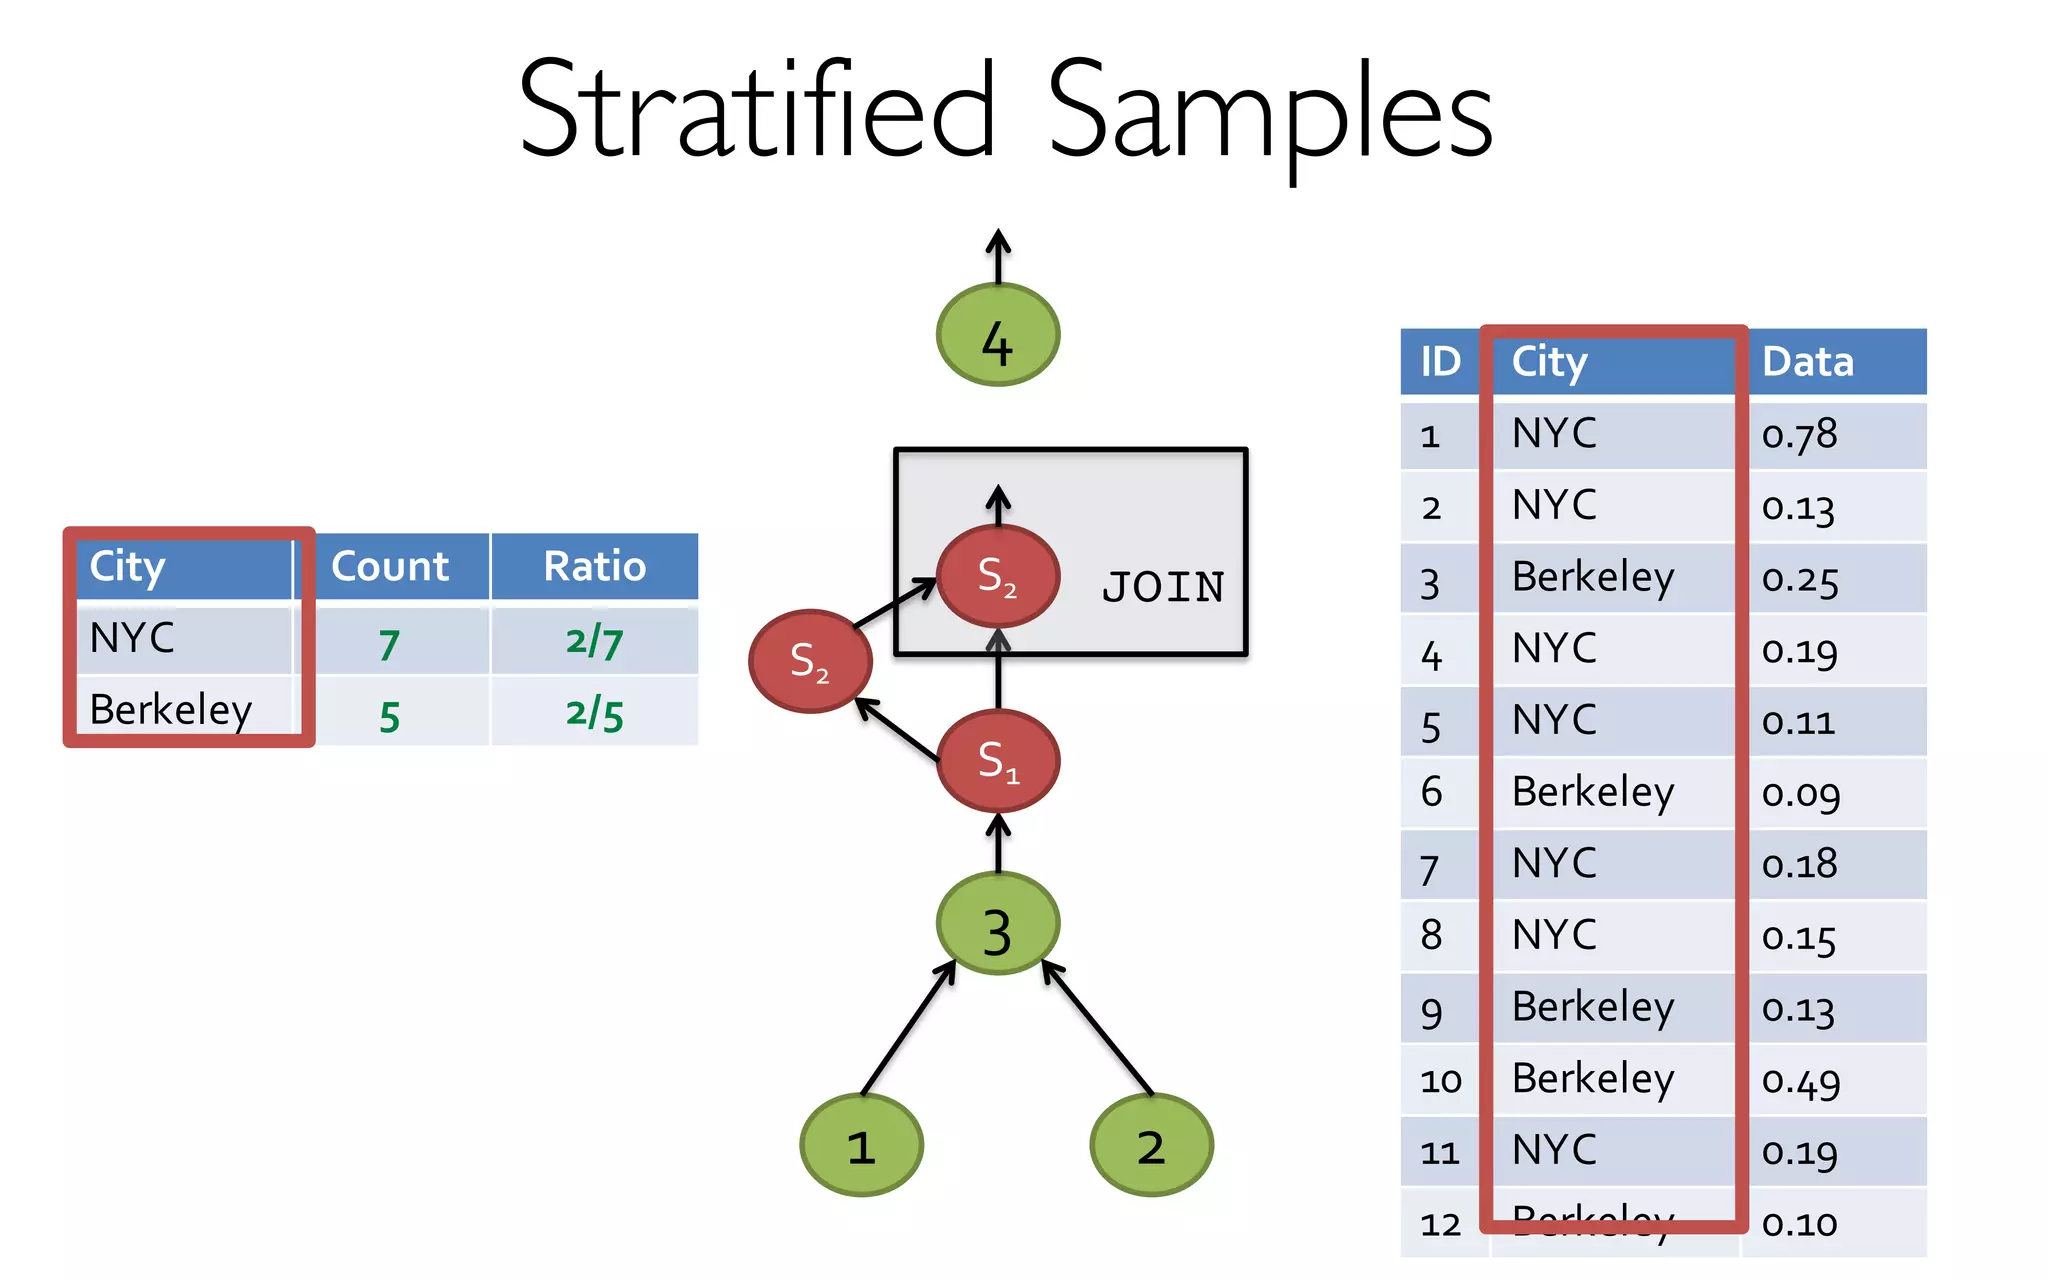
![What is BlinkDB?
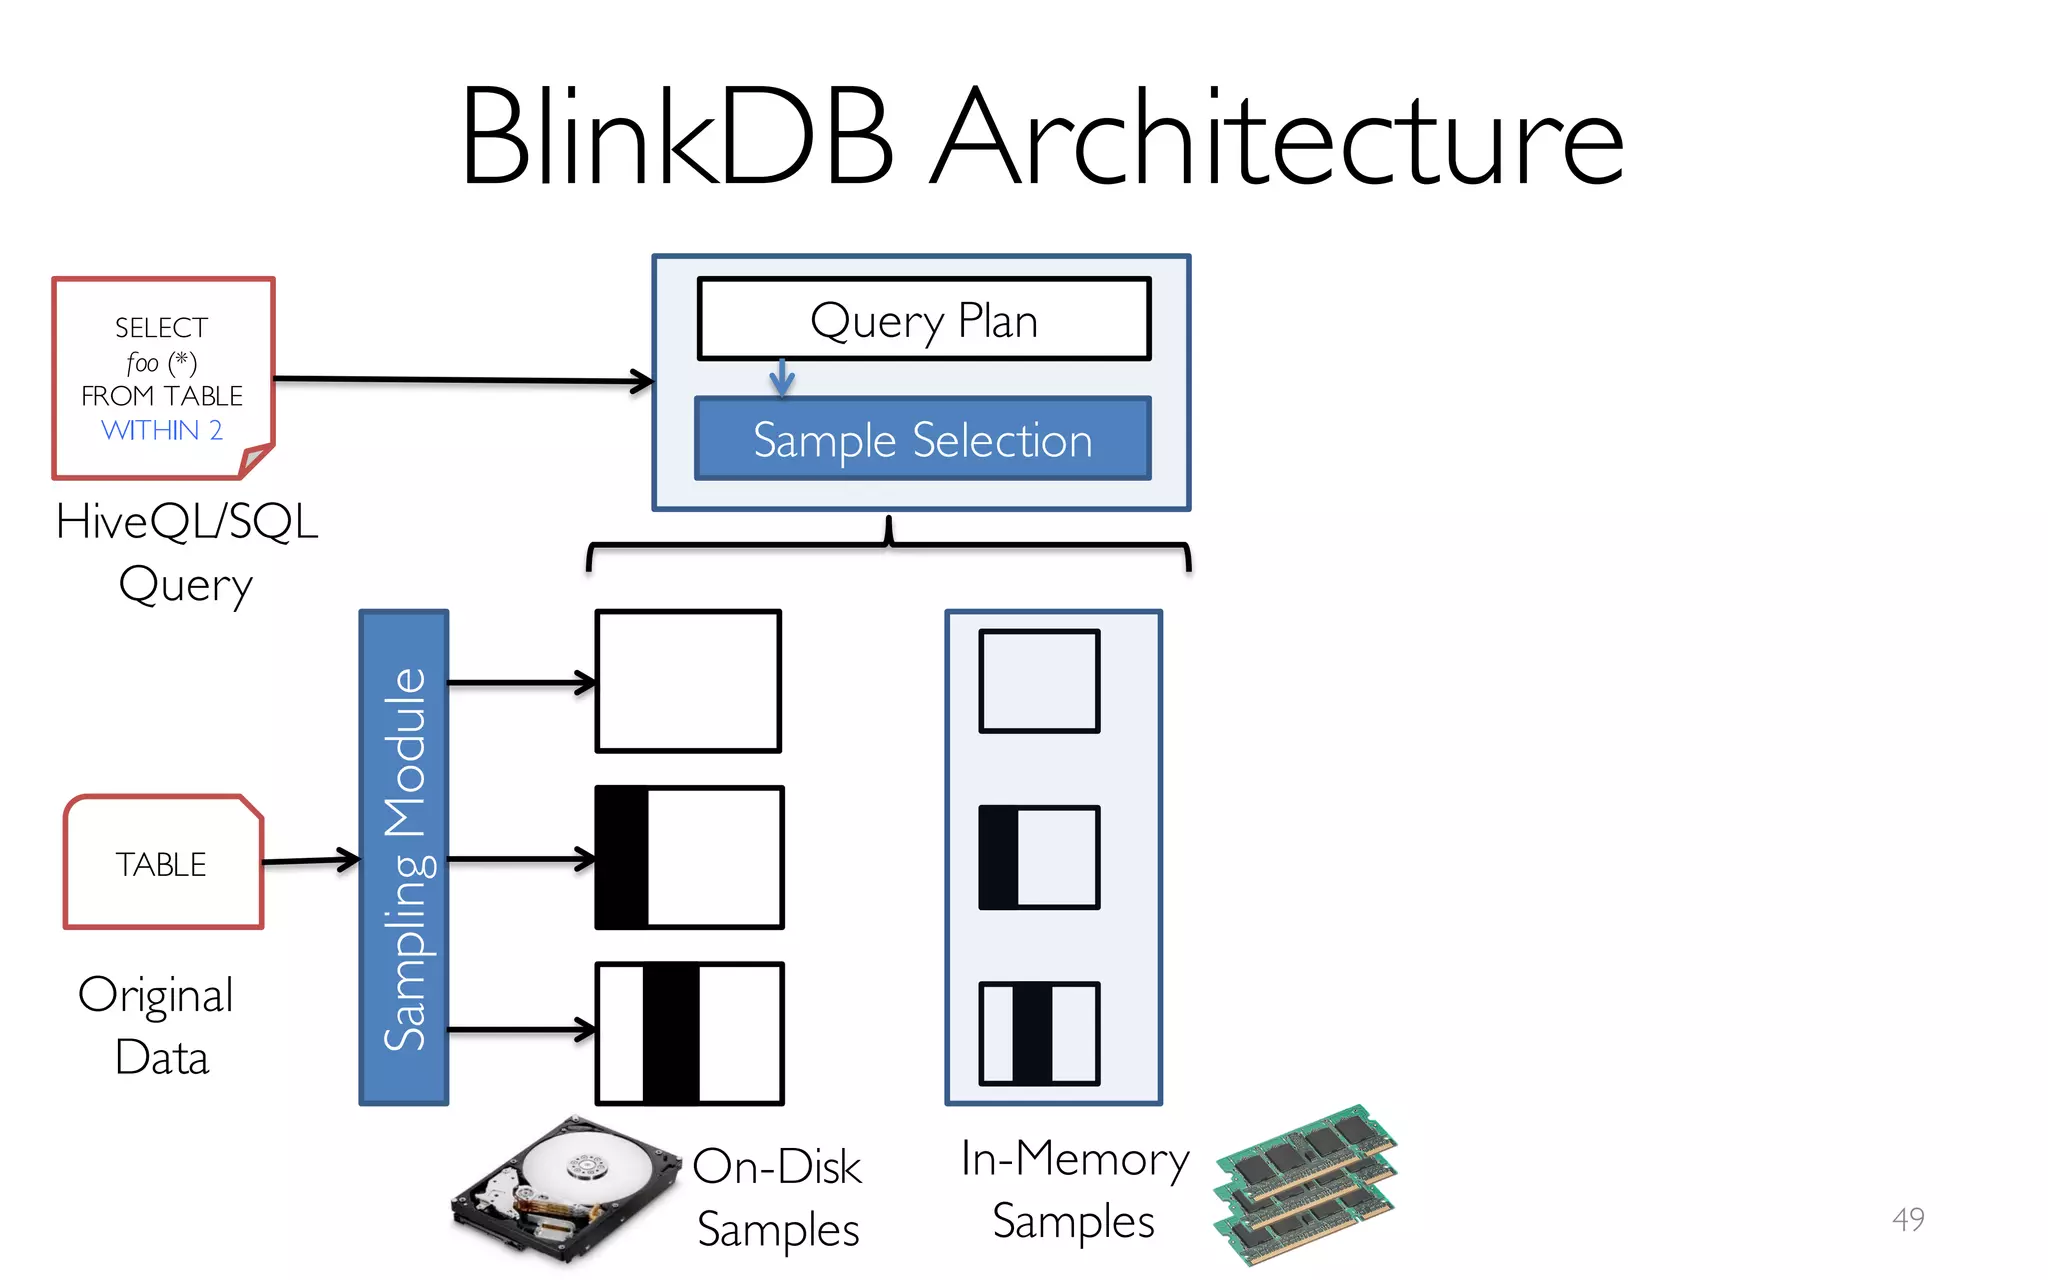
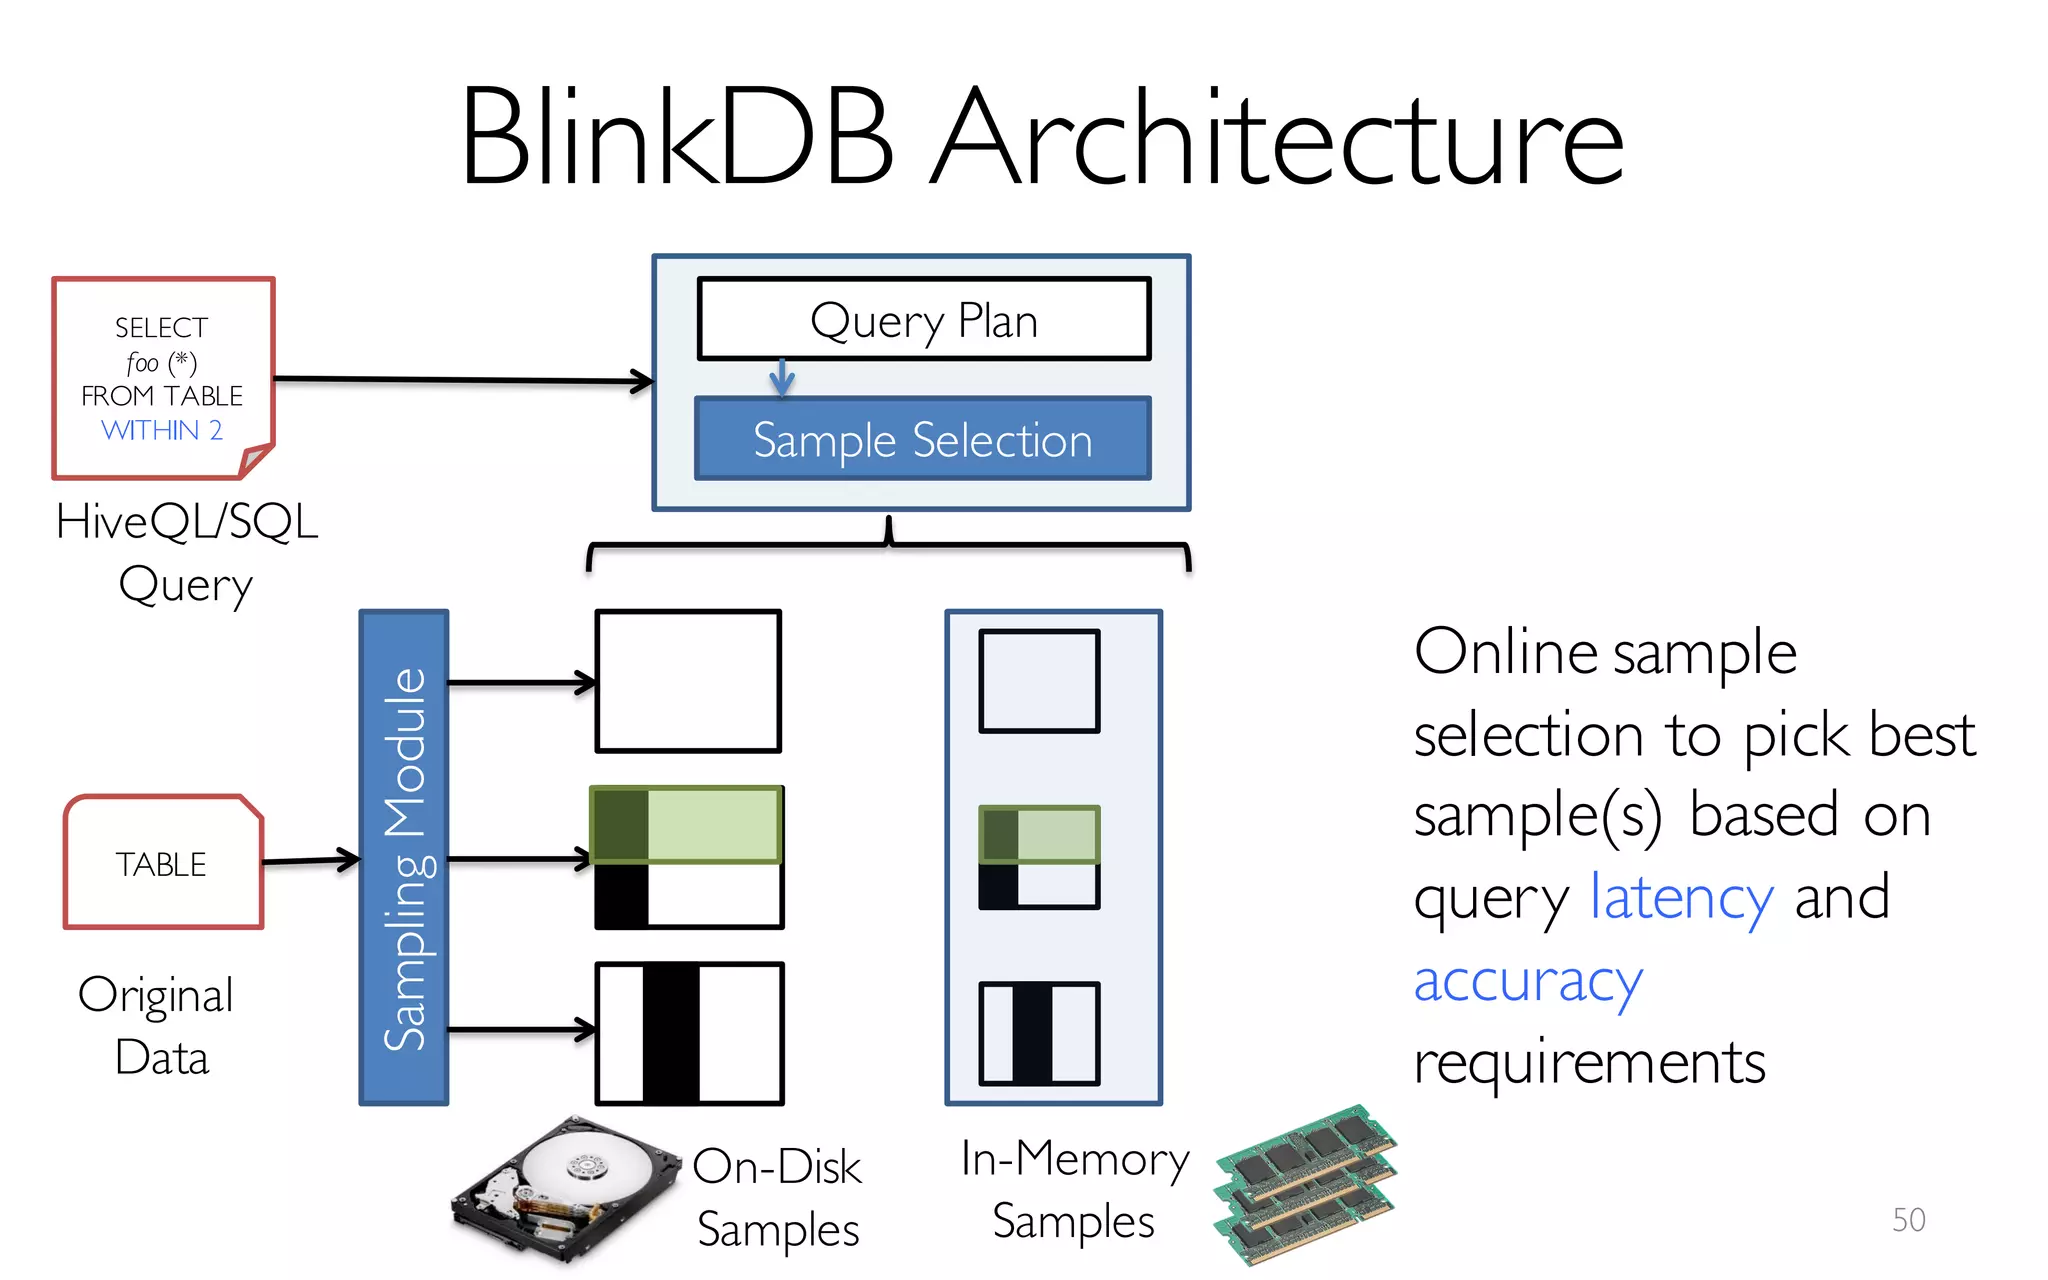
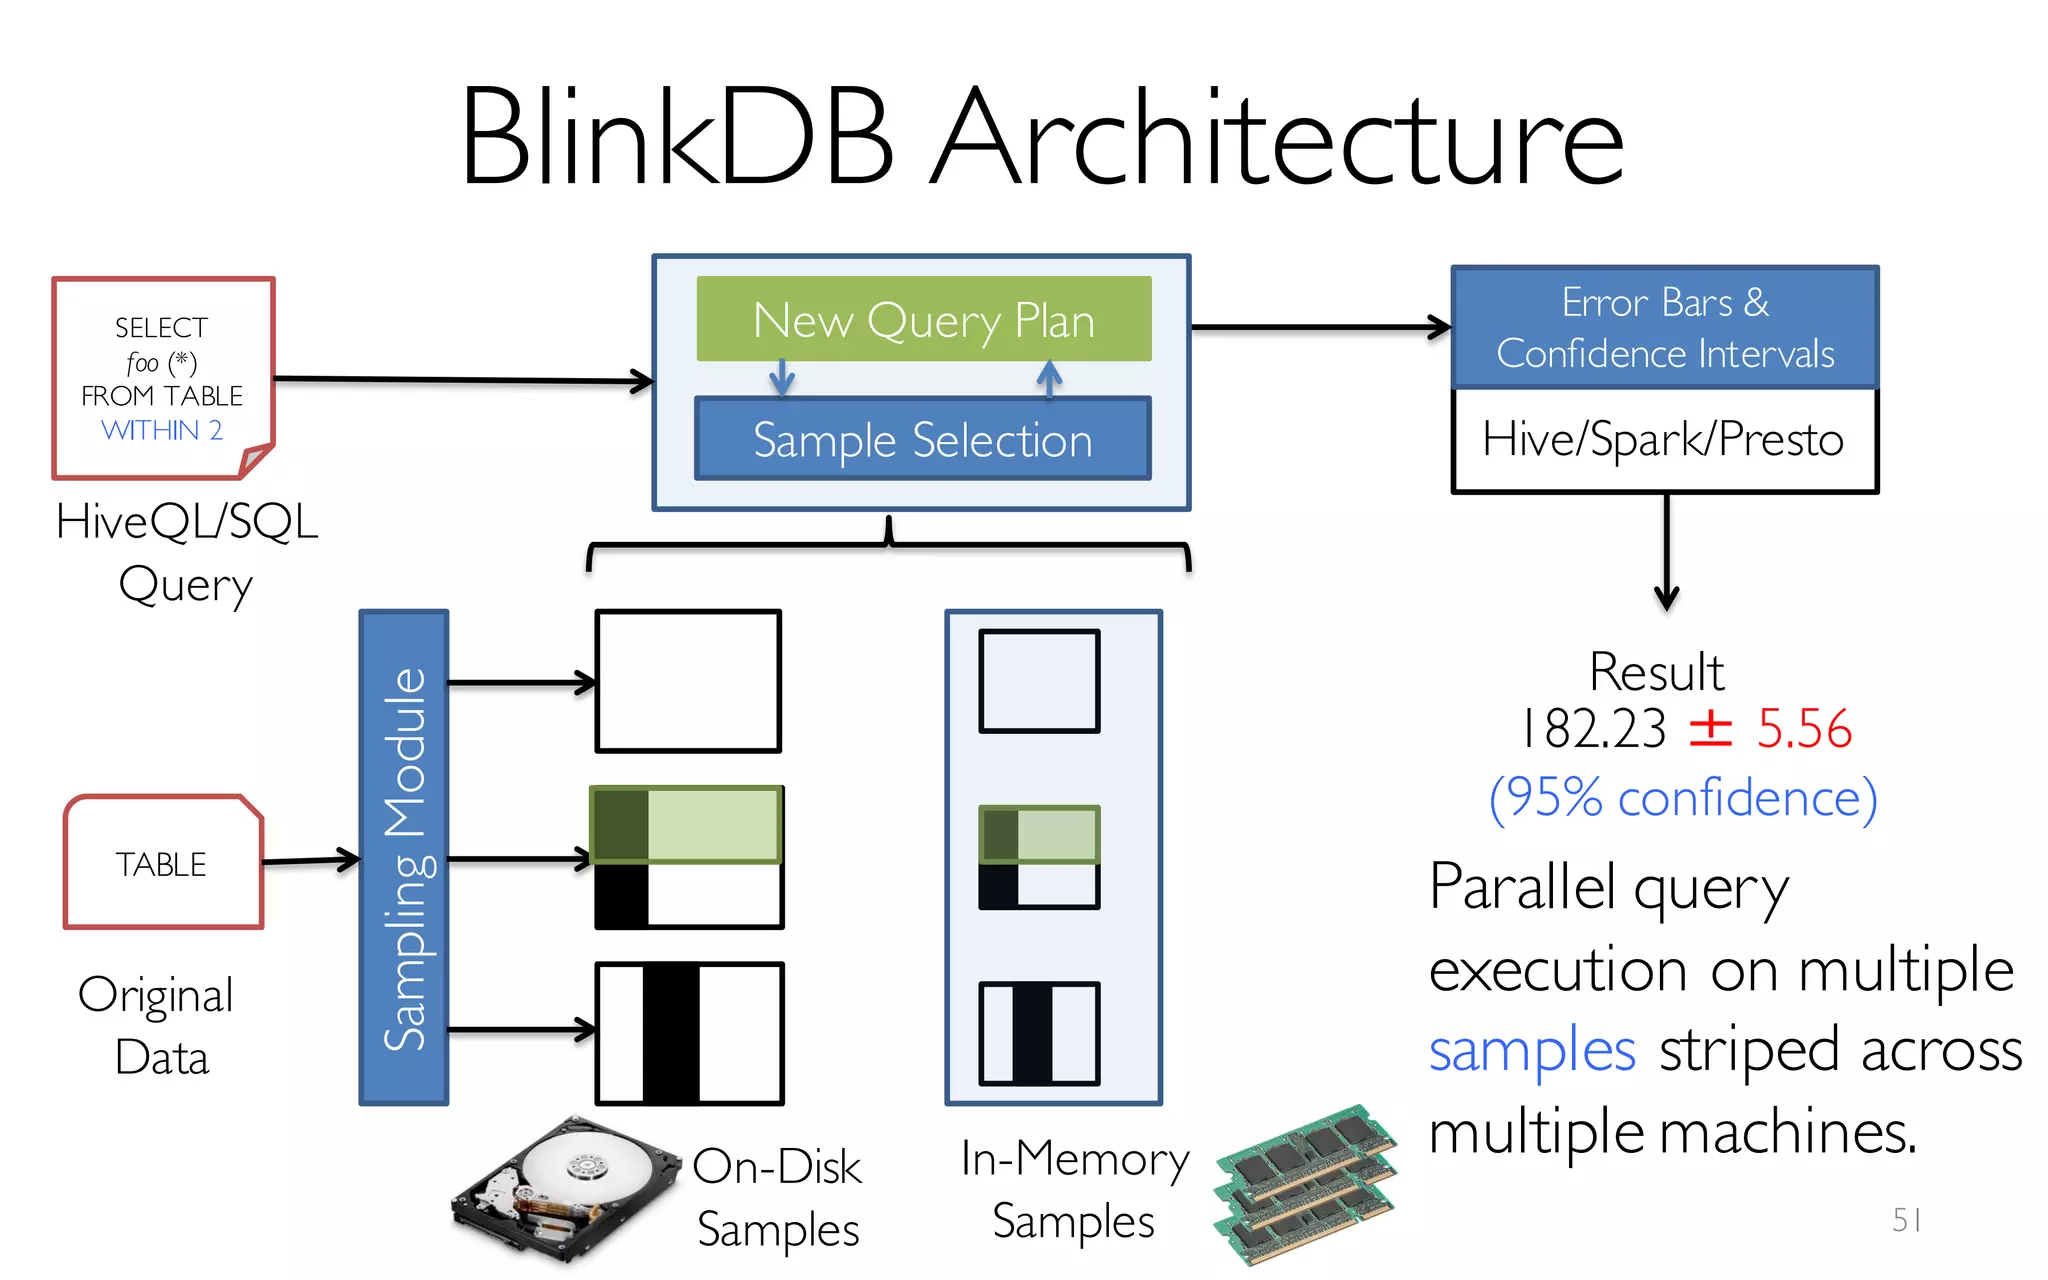
A framework built on Spark that …
- creates and maintains a variety of uniform and
stratified samples from underlying data
- returns fast, approximate answers with error bars
by executing queries on samples of data
- verifies the correctness of the error bars that it
returns at runtime
[Online Process]](https://image.slidesharecdn.com/11-24-2015blinkdb-meetup-151201073306-lva1-app6891/85/BlinkDB-Approximate-Queries-on-Very-Large-Data-46-320.jpg)


![ErrorVerificationError
Sample Size
More Data à Higher Accuracy
300 Data Points à 97% Accuracy
[KDD’13] [SIGMOD’14]](https://image.slidesharecdn.com/11-24-2015blinkdb-meetup-151201073306-lva1-app6891/75/BlinkDB-Approximate-Queries-on-Very-Large-Data-43-2048.jpg)
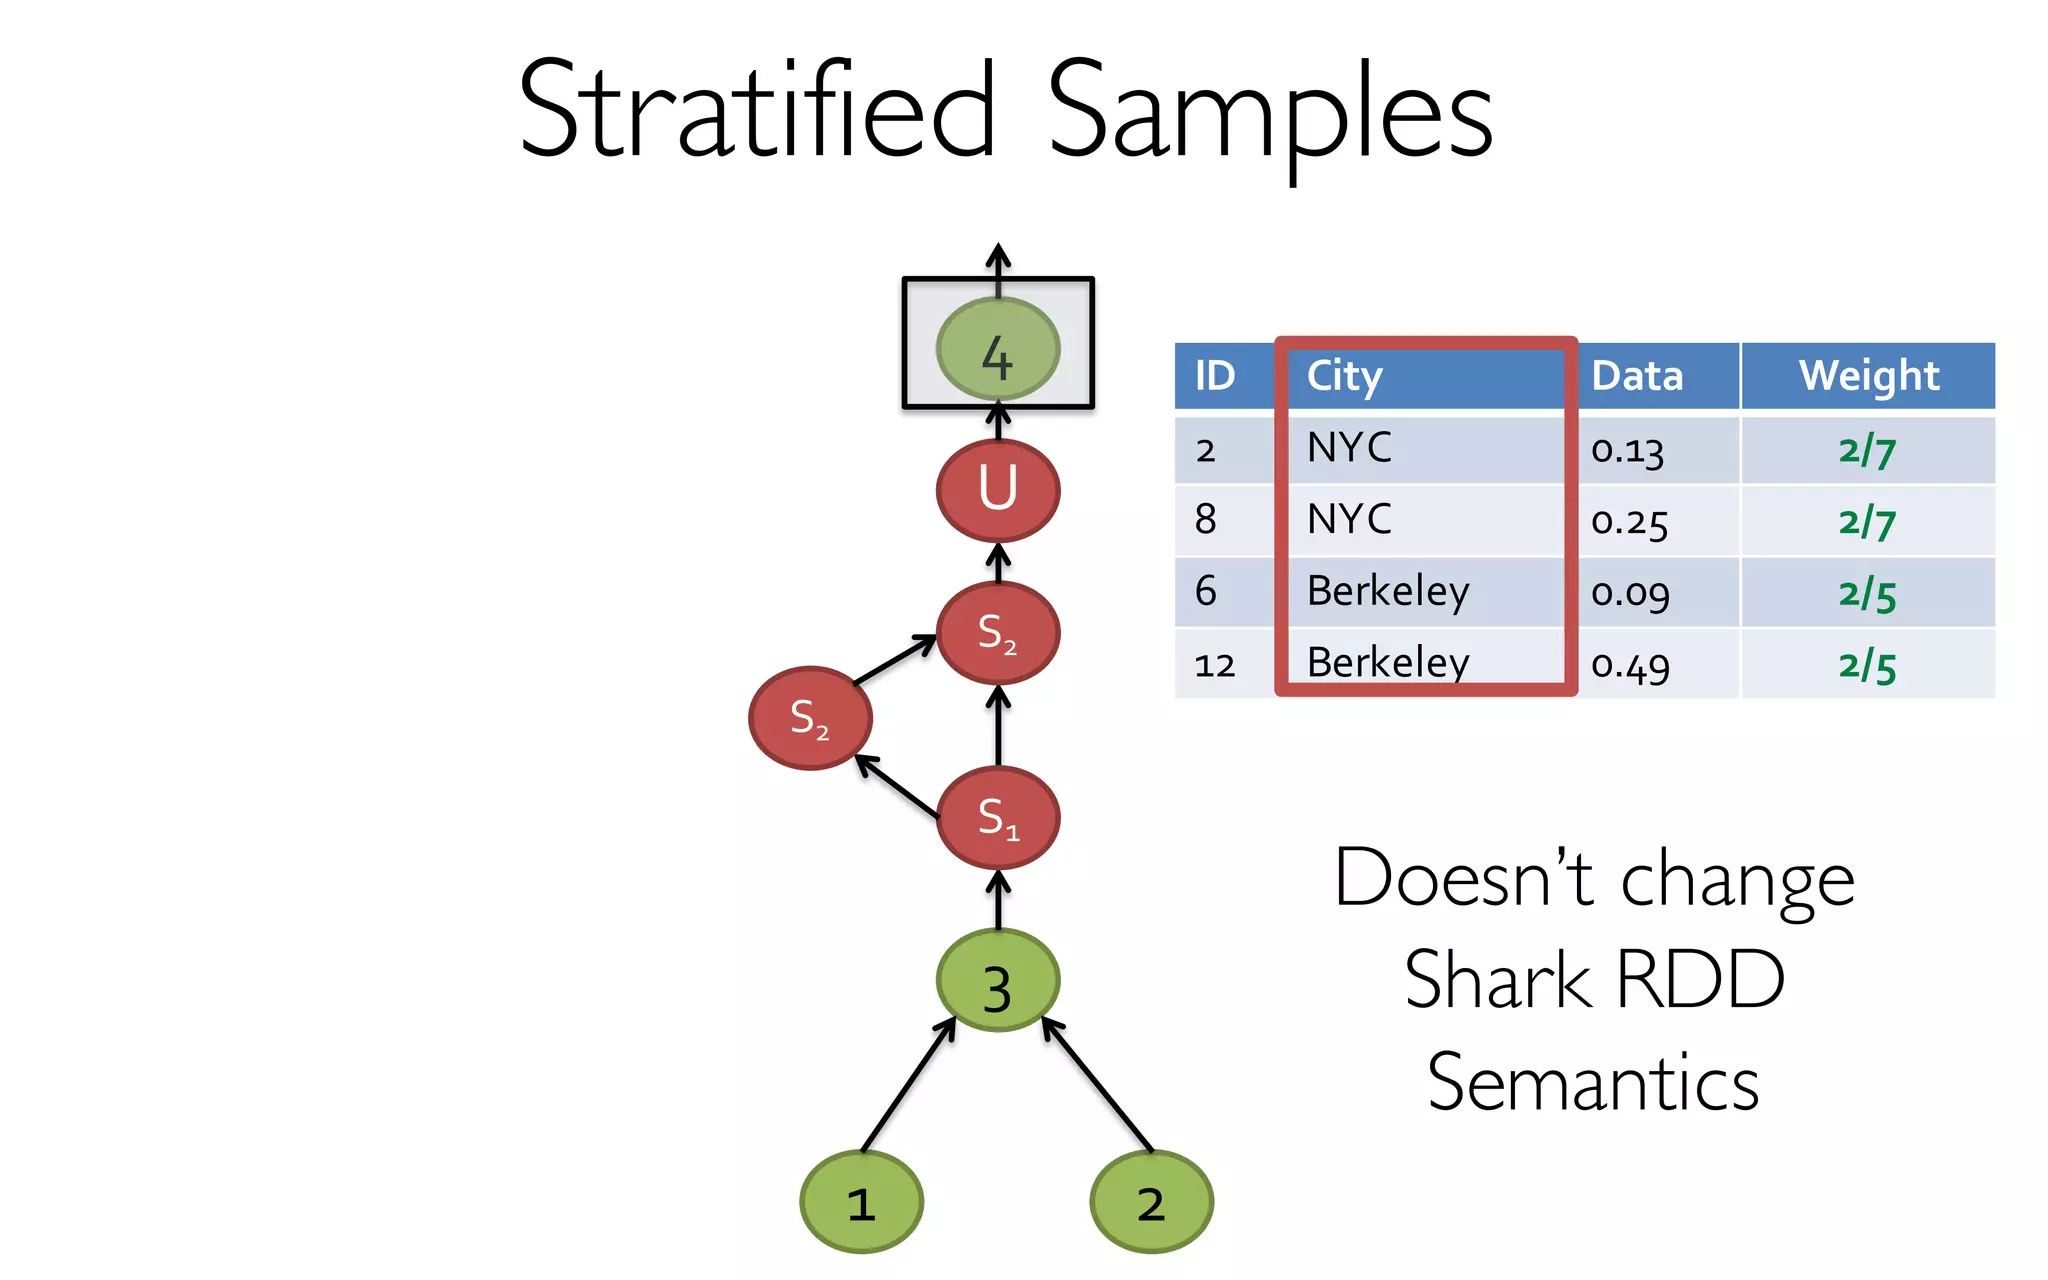
![What is BlinkDB?
A framework built on Spark that …
- creates and maintains a variety of uniform and
stratified samples from underlying data
- returns fast, approximate answers with error bars
by executing queries on samples of data
- verifies the correctness of the error bars that it
returns at runtime
[Offline Process]](https://image.slidesharecdn.com/11-24-2015blinkdb-meetup-151201073306-lva1-app6891/75/BlinkDB-Approximate-Queries-on-Very-Large-Data-45-2048.jpg)
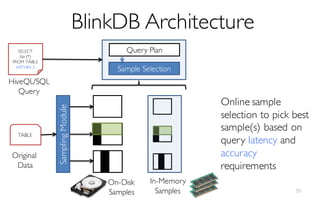
![What is BlinkDB?
A framework built on Spark that …
- creates and maintains a variety of uniform and
stratified samples from underlying data
- returns fast, approximate answers with error bars
by executing queries on samples of data
- verifies the correctness of the error bars that it
returns at runtime
[Online Process]](https://image.slidesharecdn.com/11-24-2015blinkdb-meetup-151201073306-lva1-app6891/75/BlinkDB-Approximate-Queries-on-Very-Large-Data-46-2048.jpg)
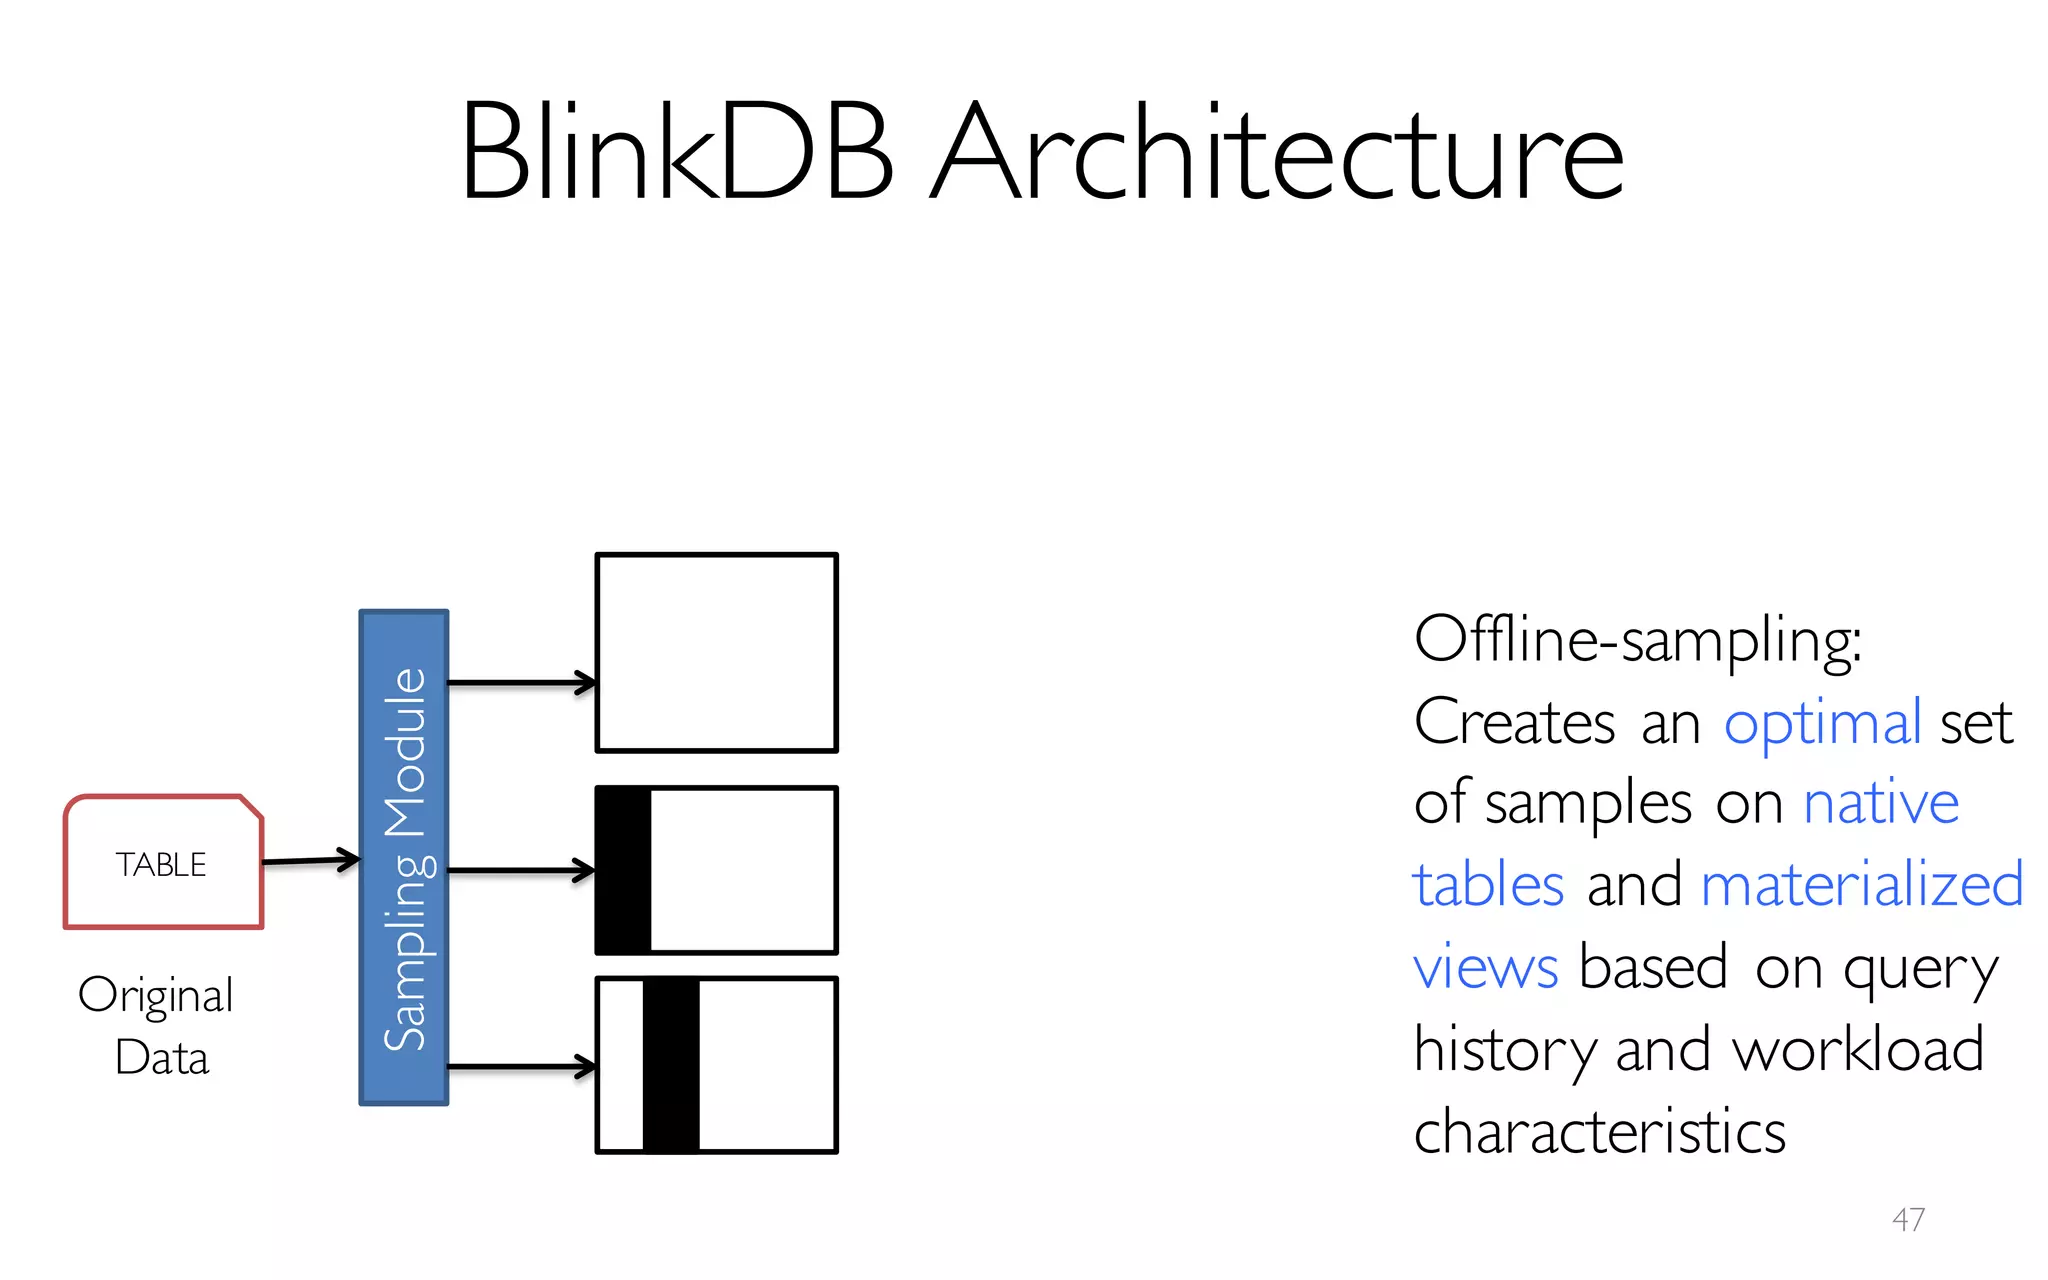

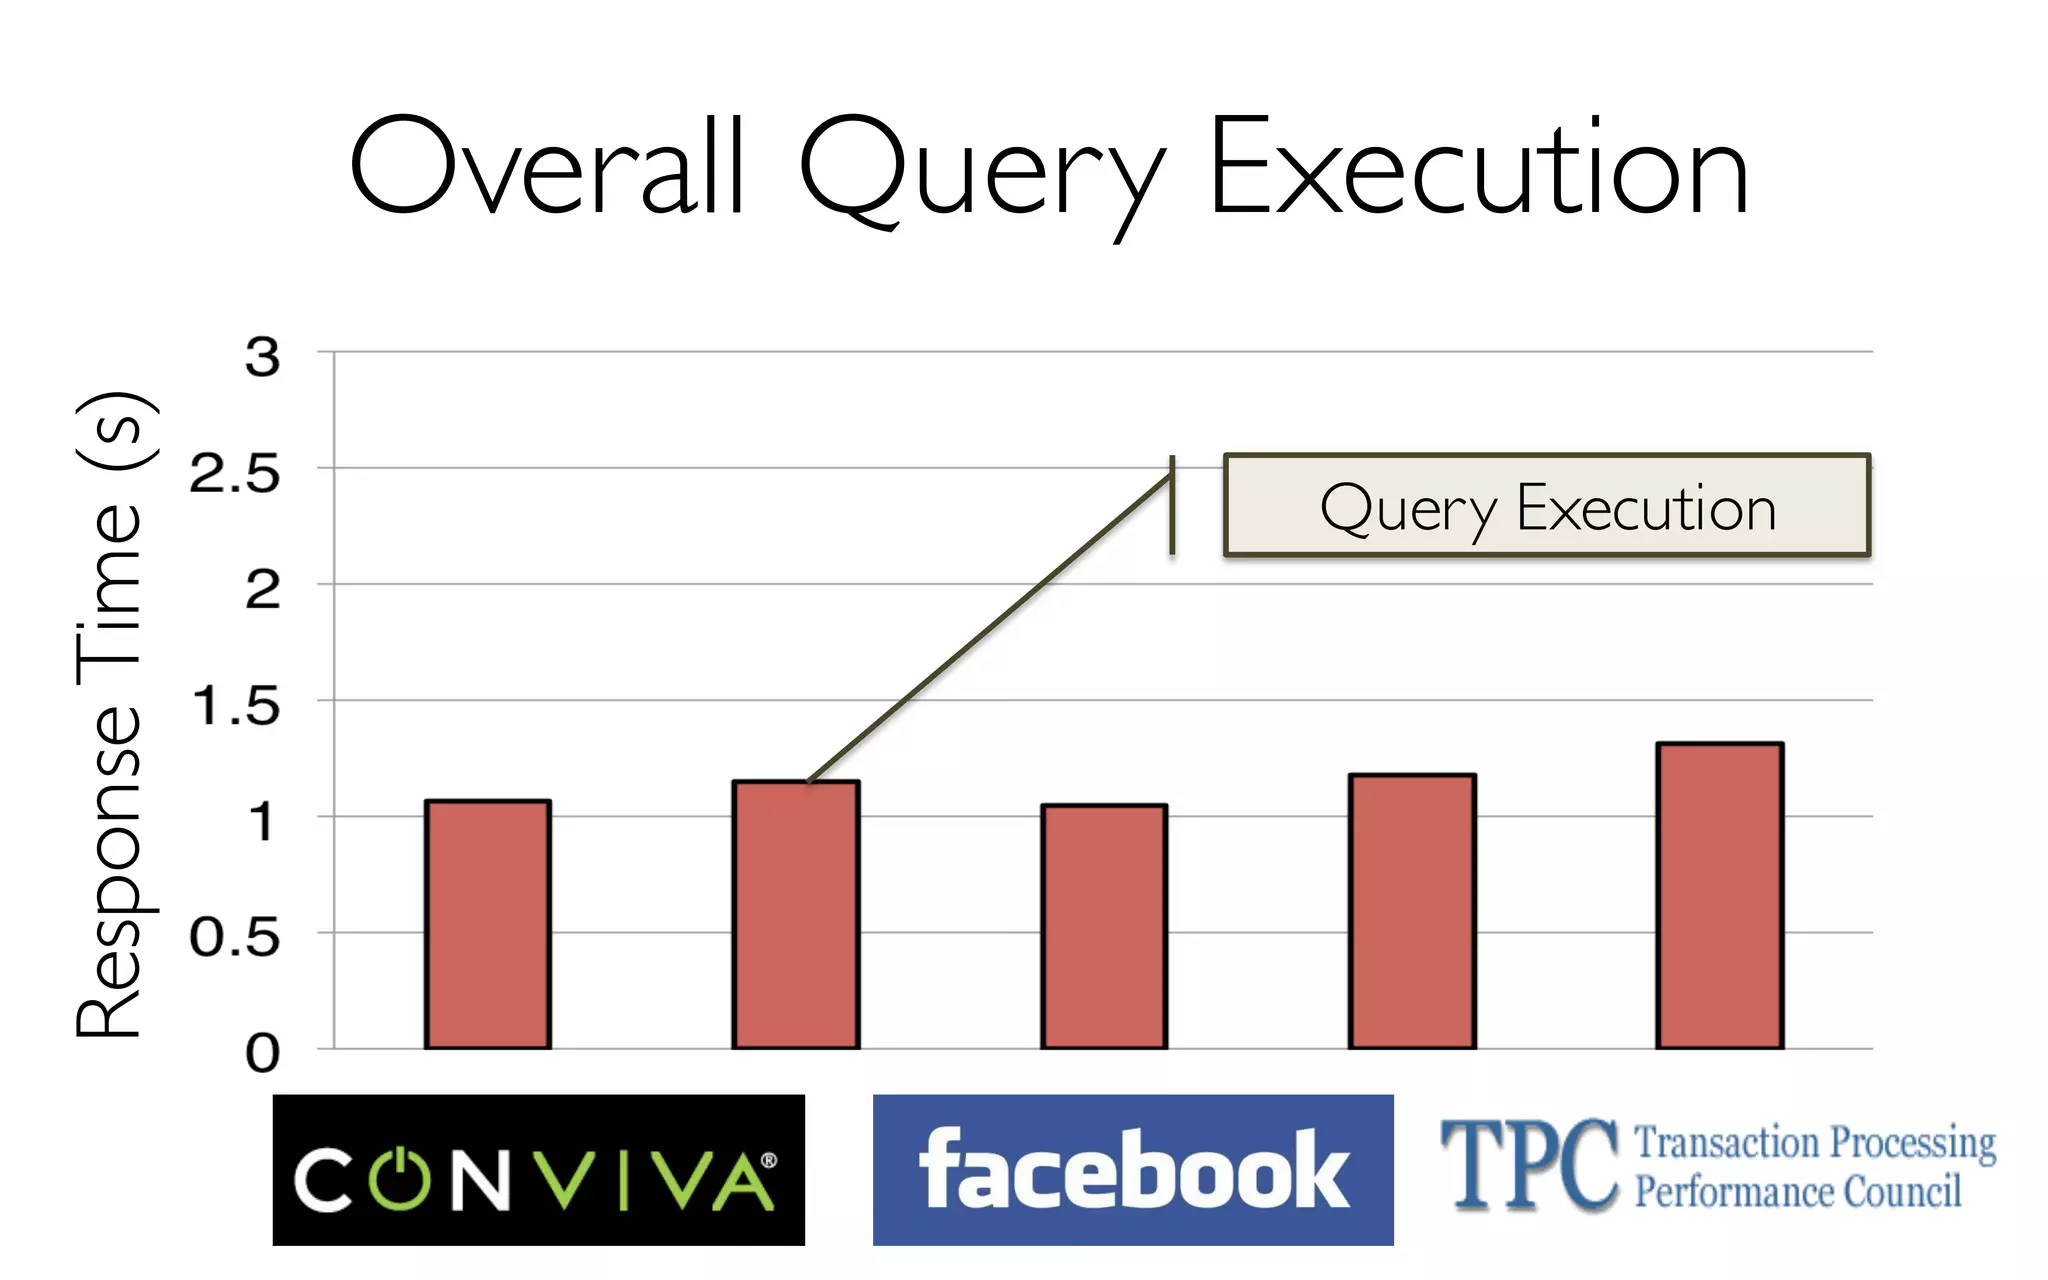
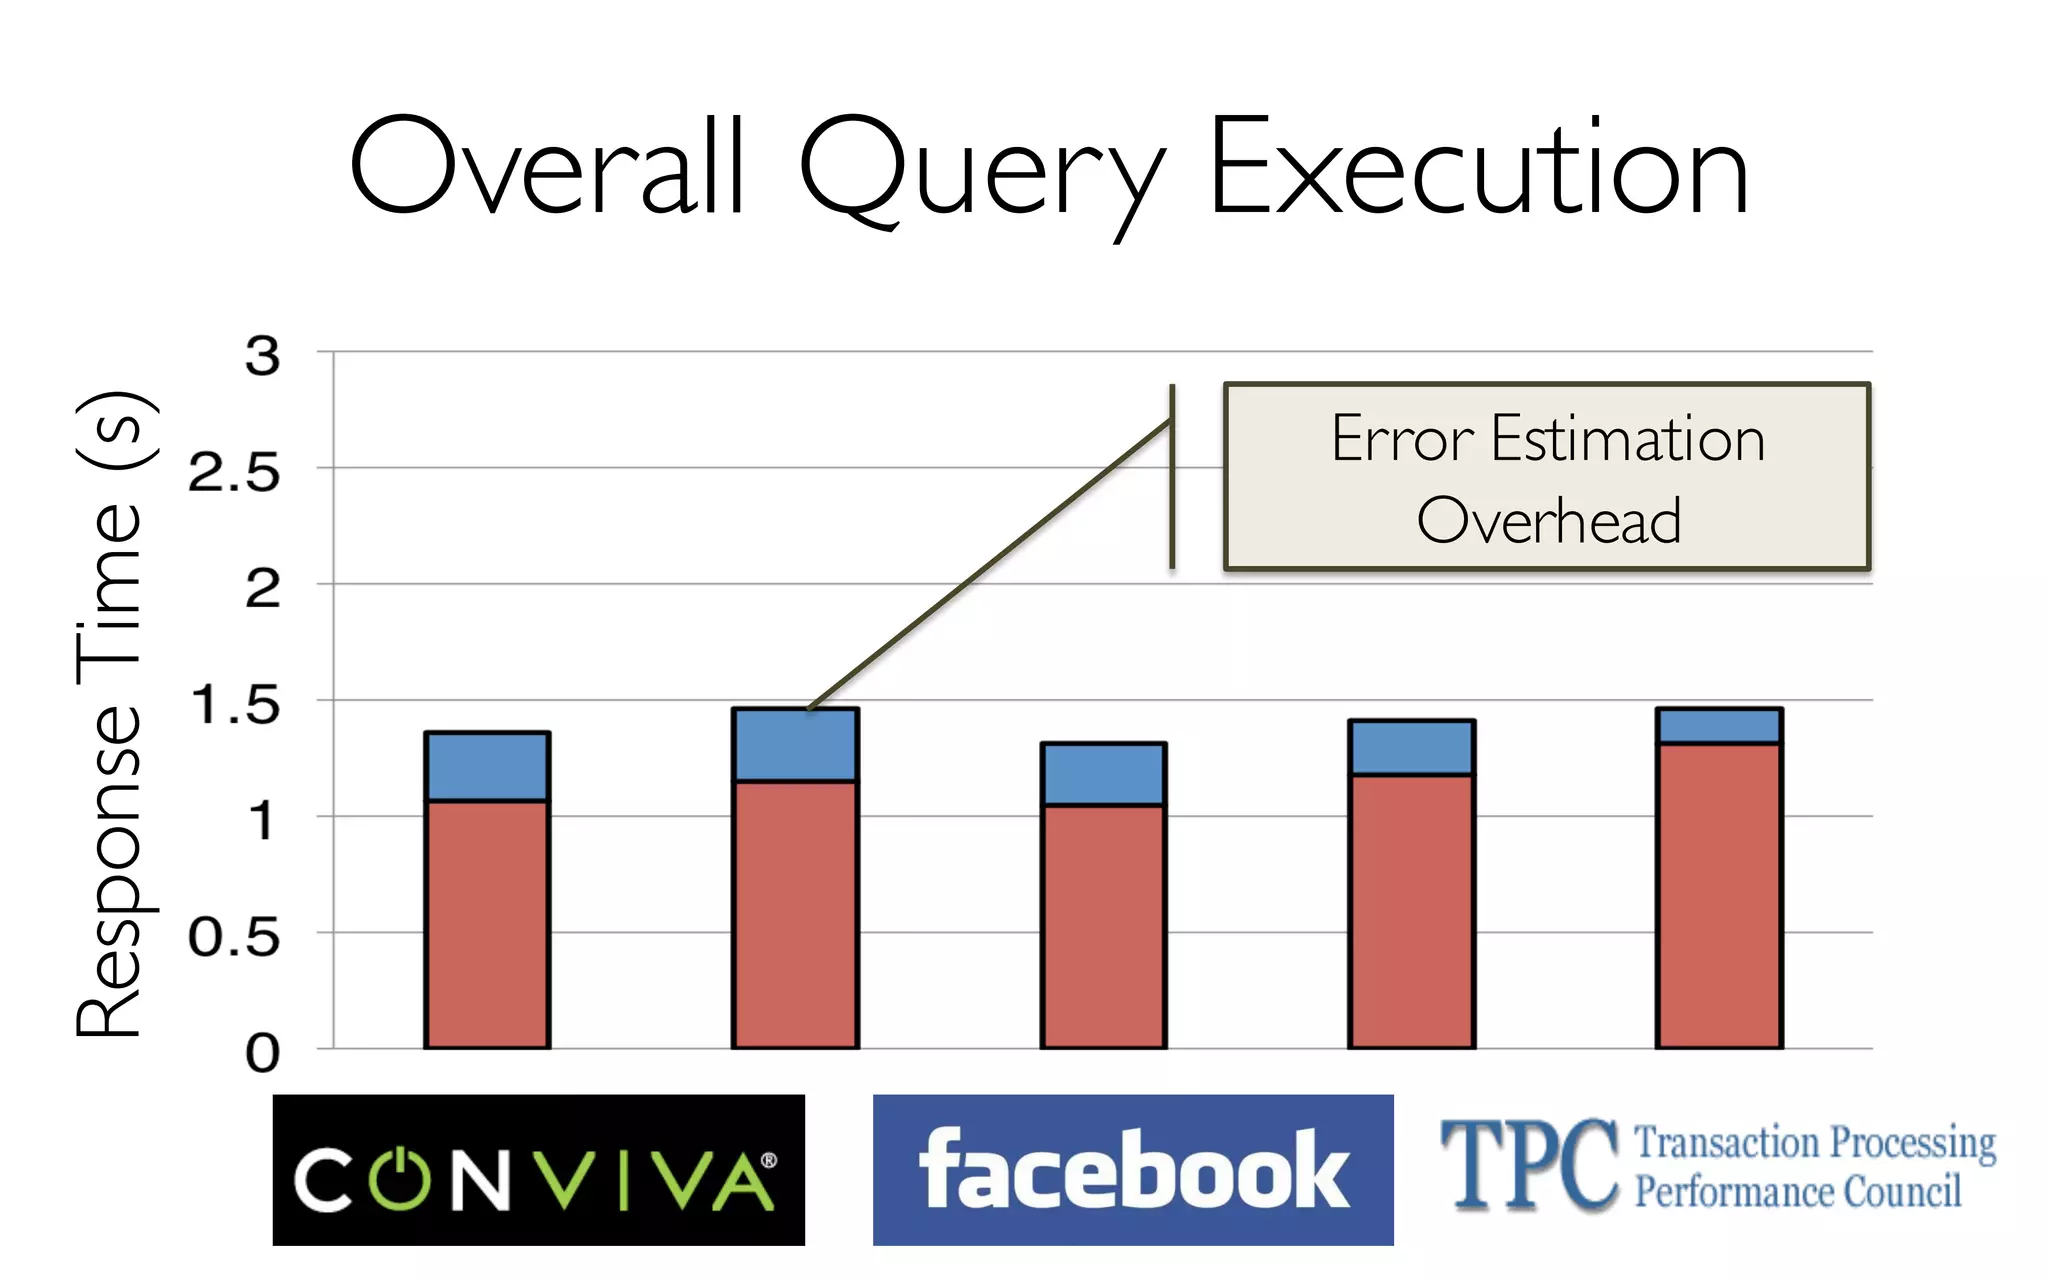


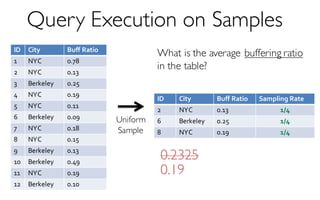
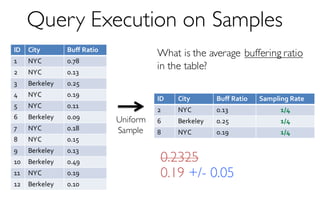
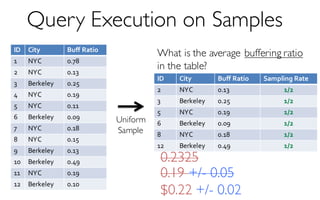
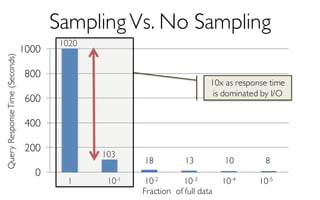
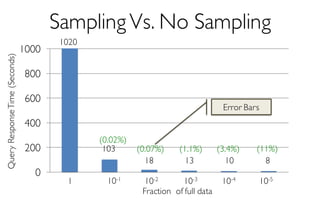
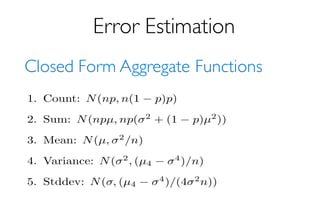
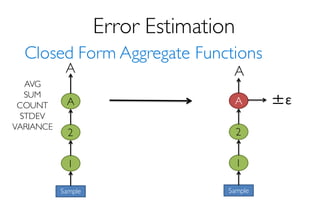
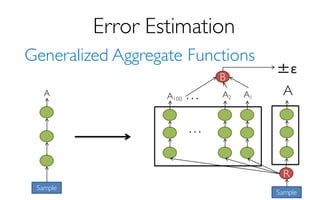
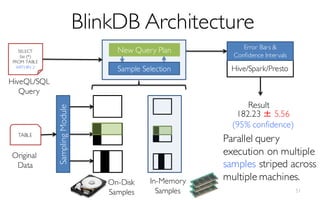
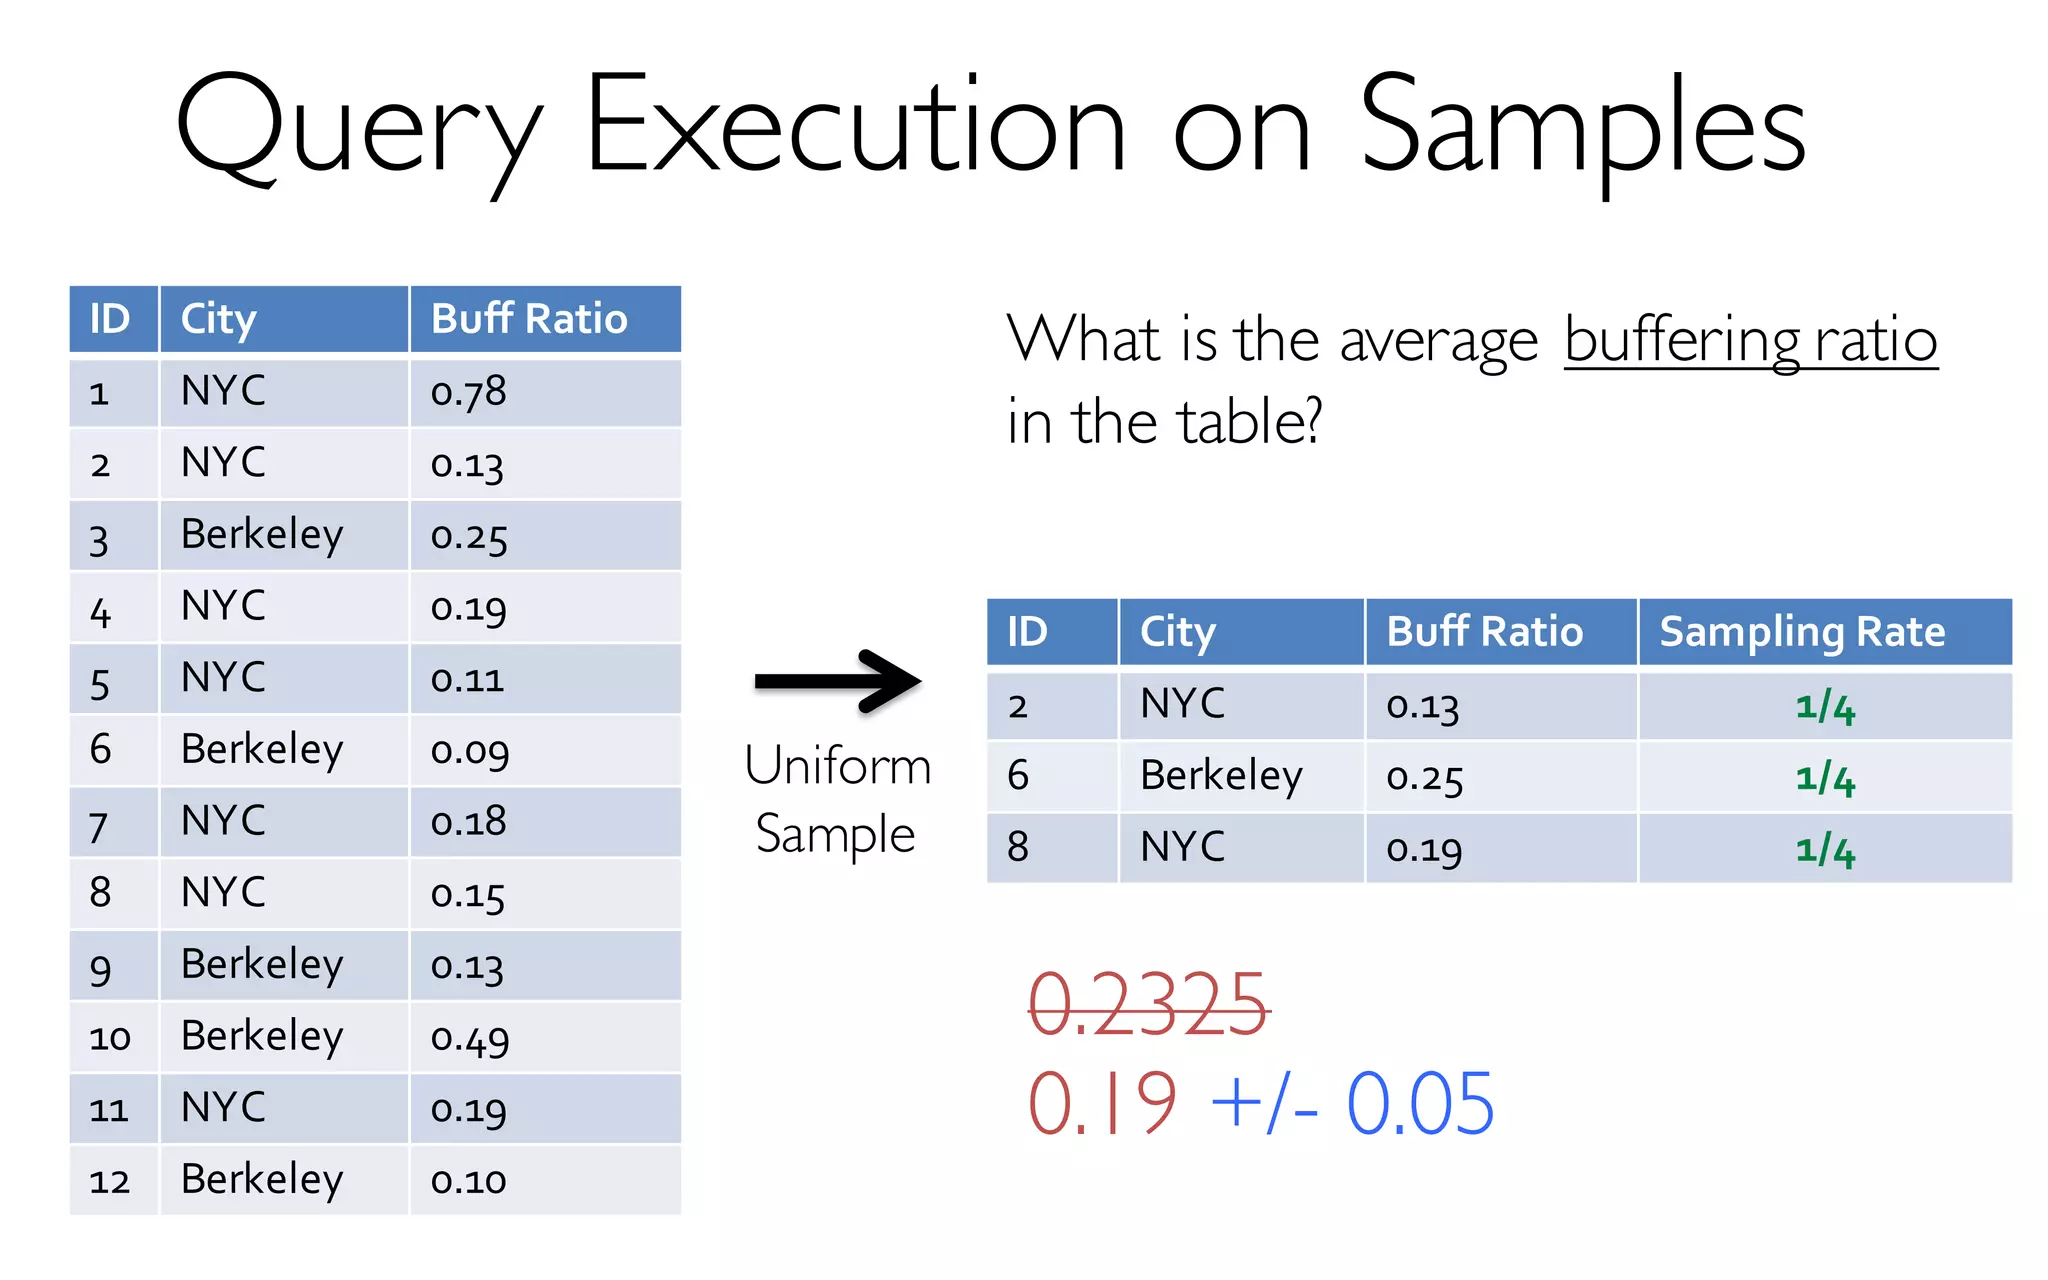
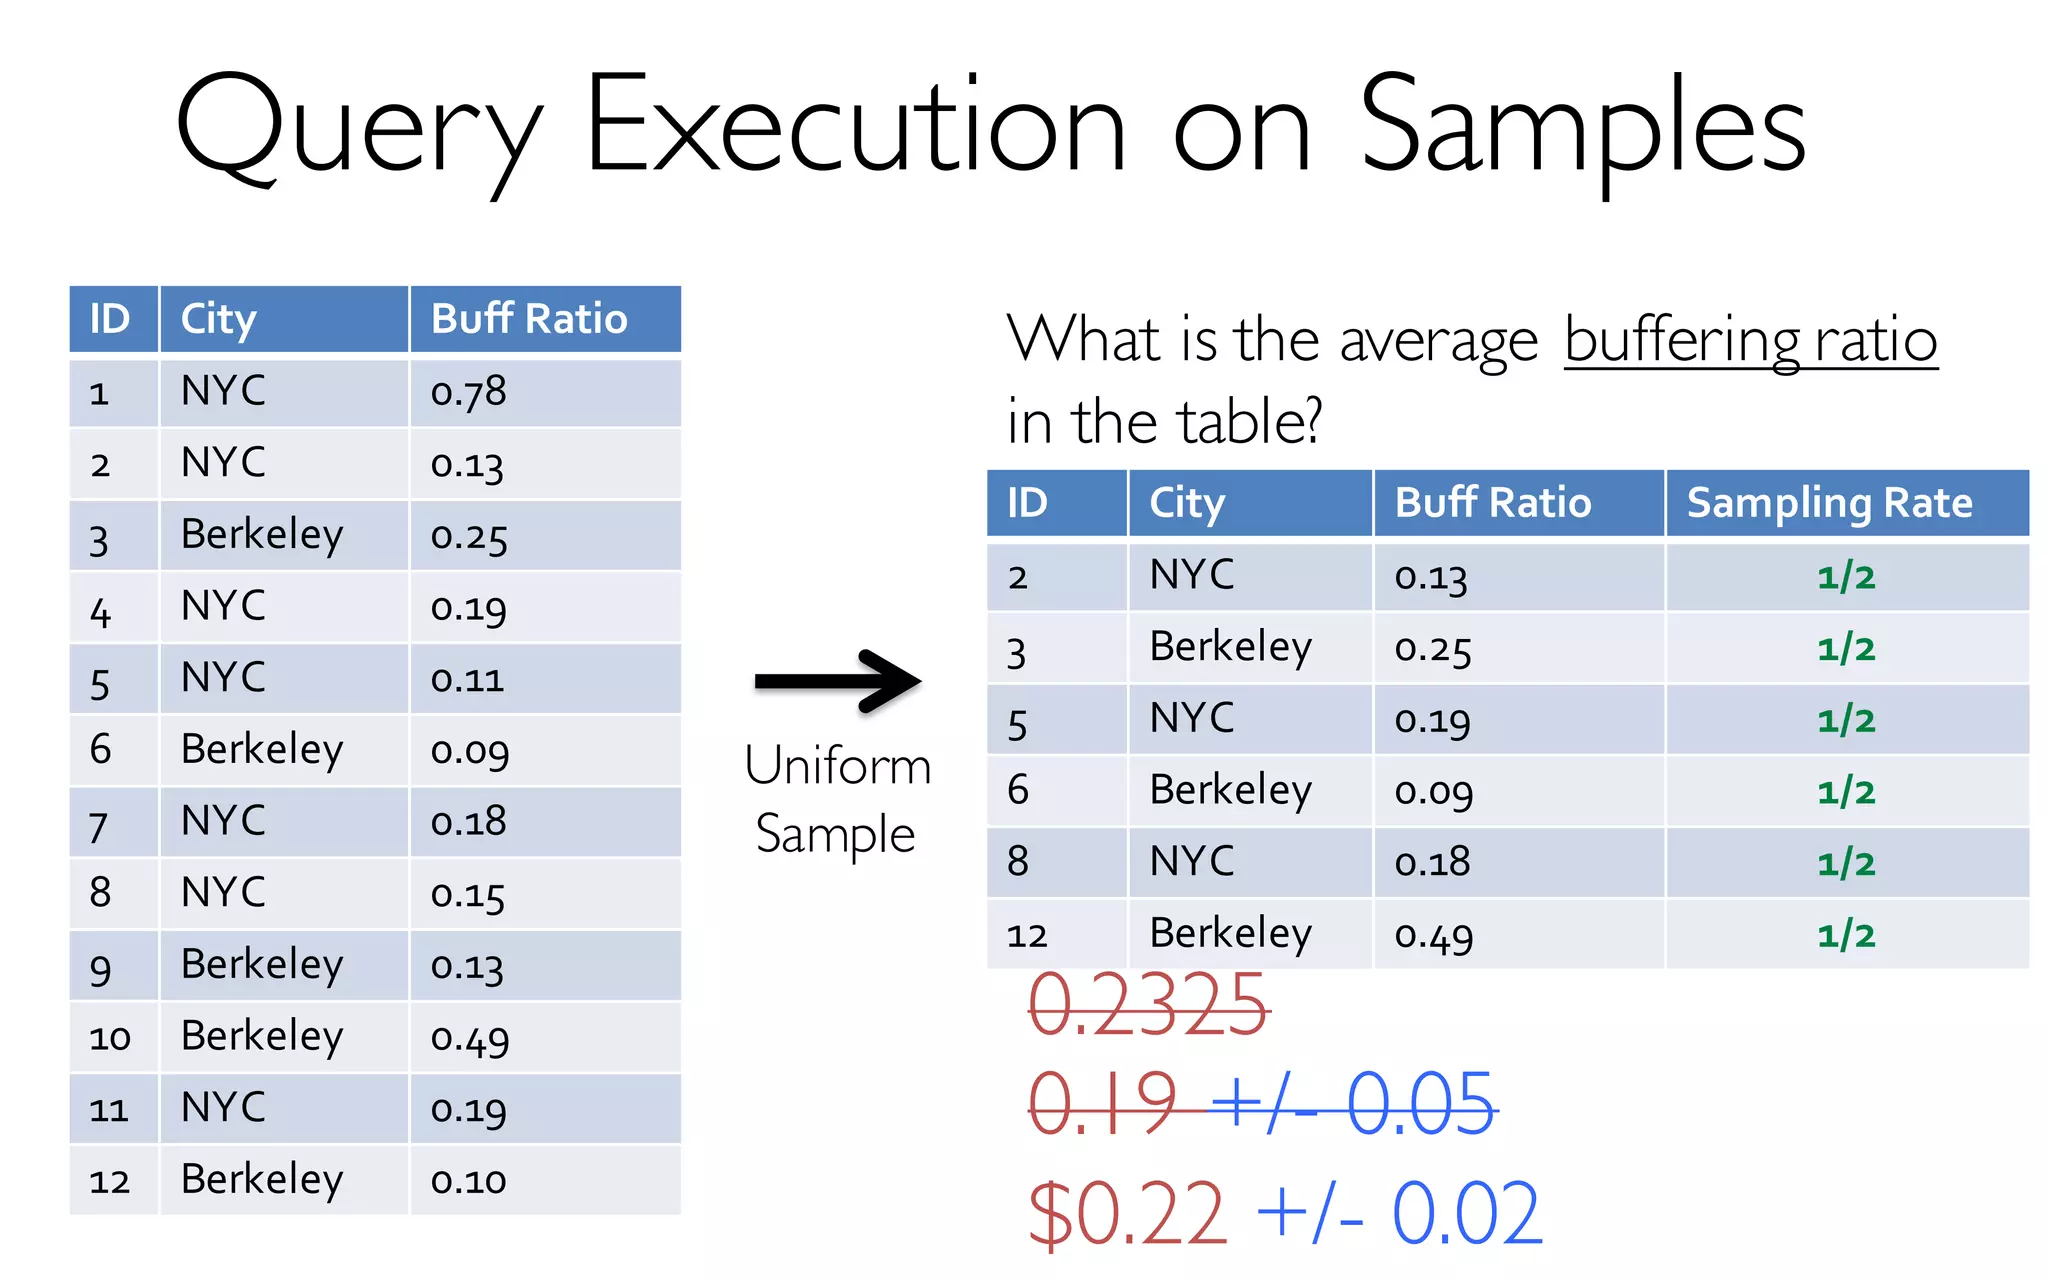
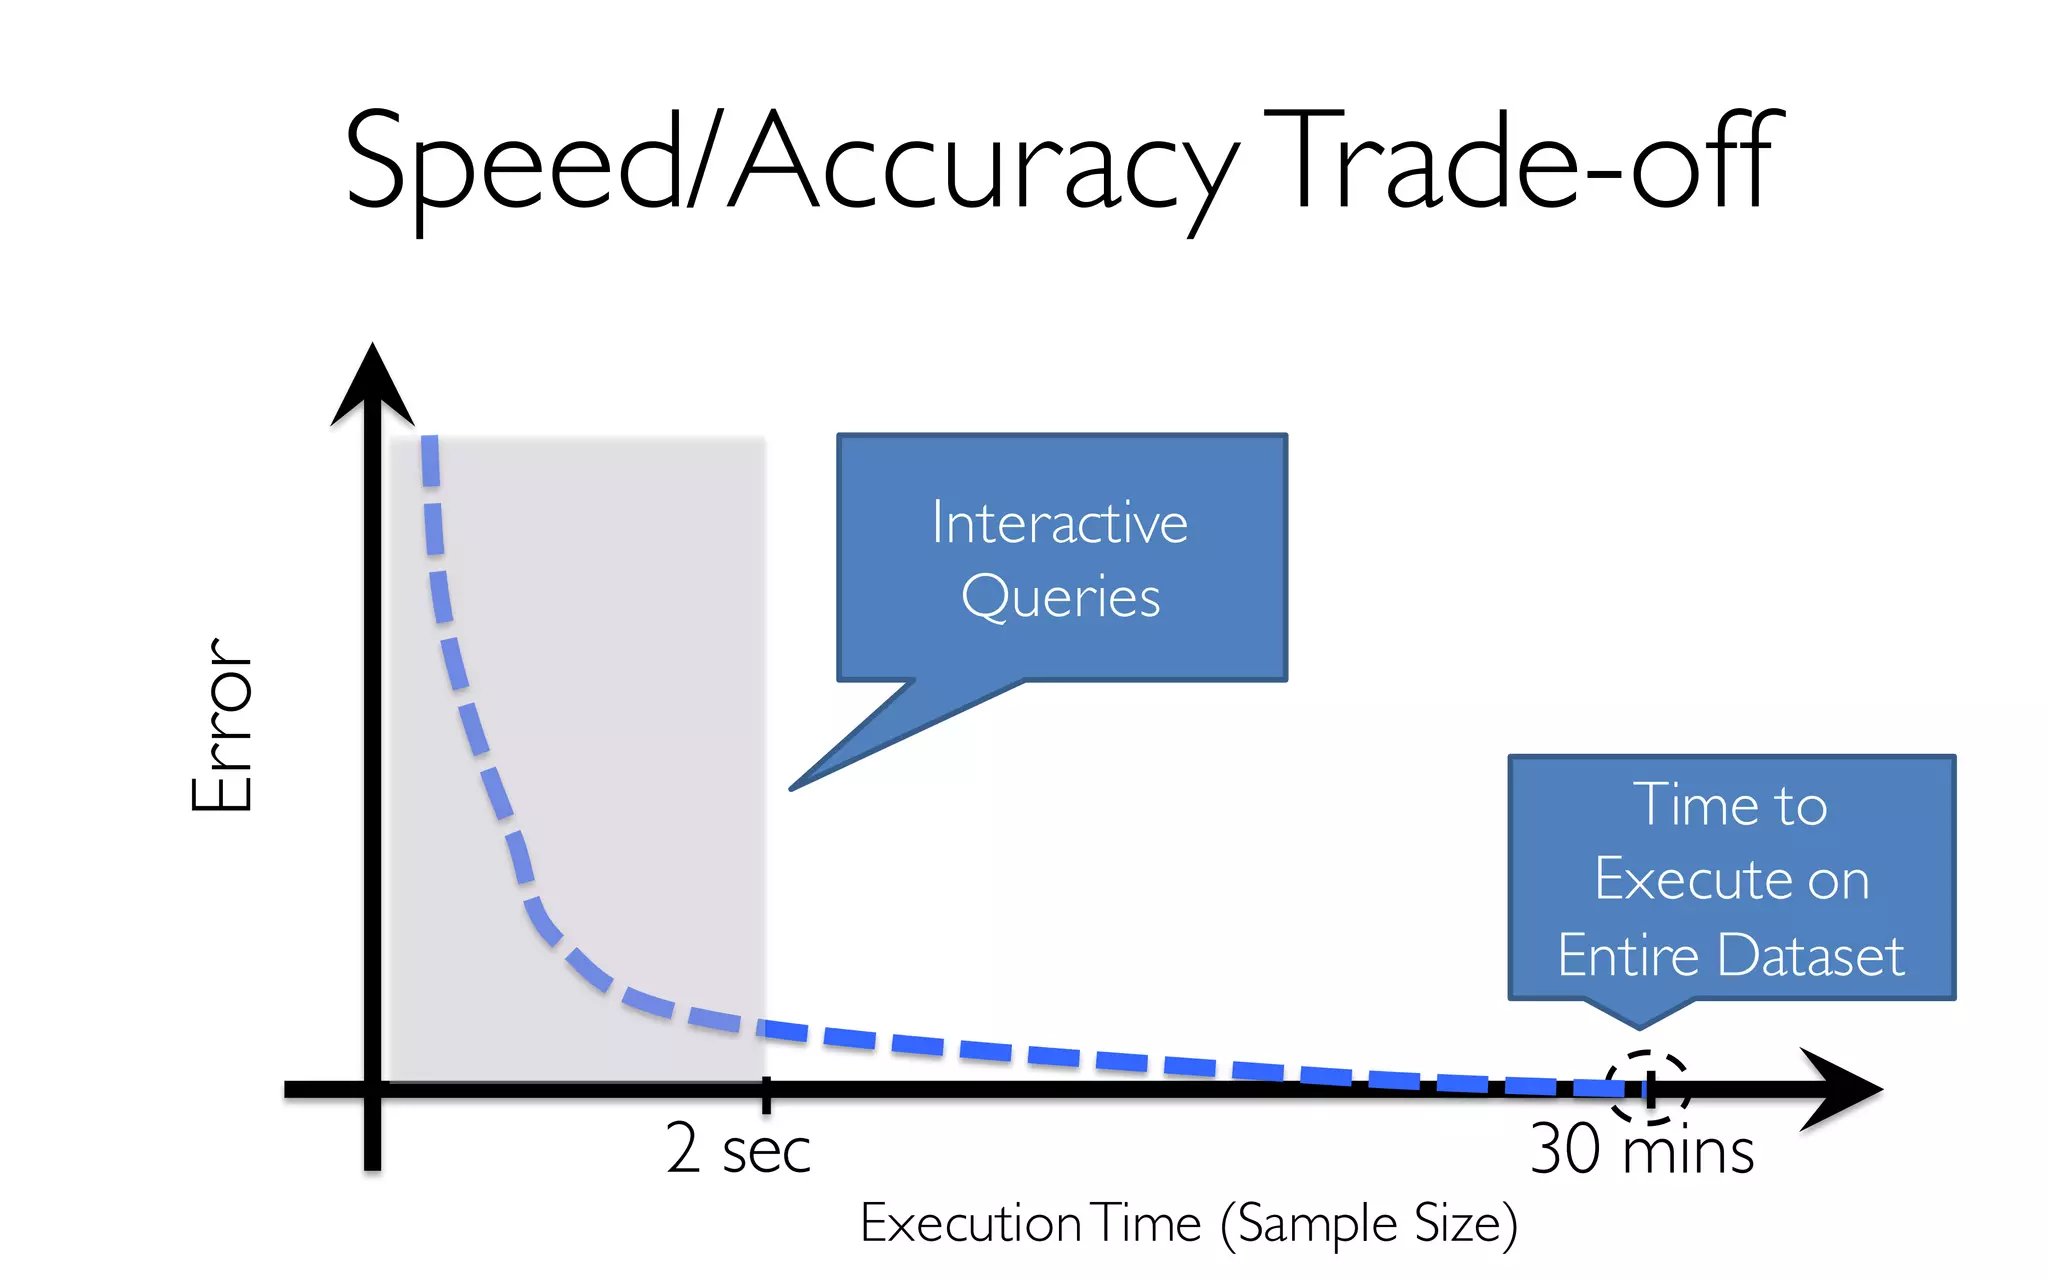
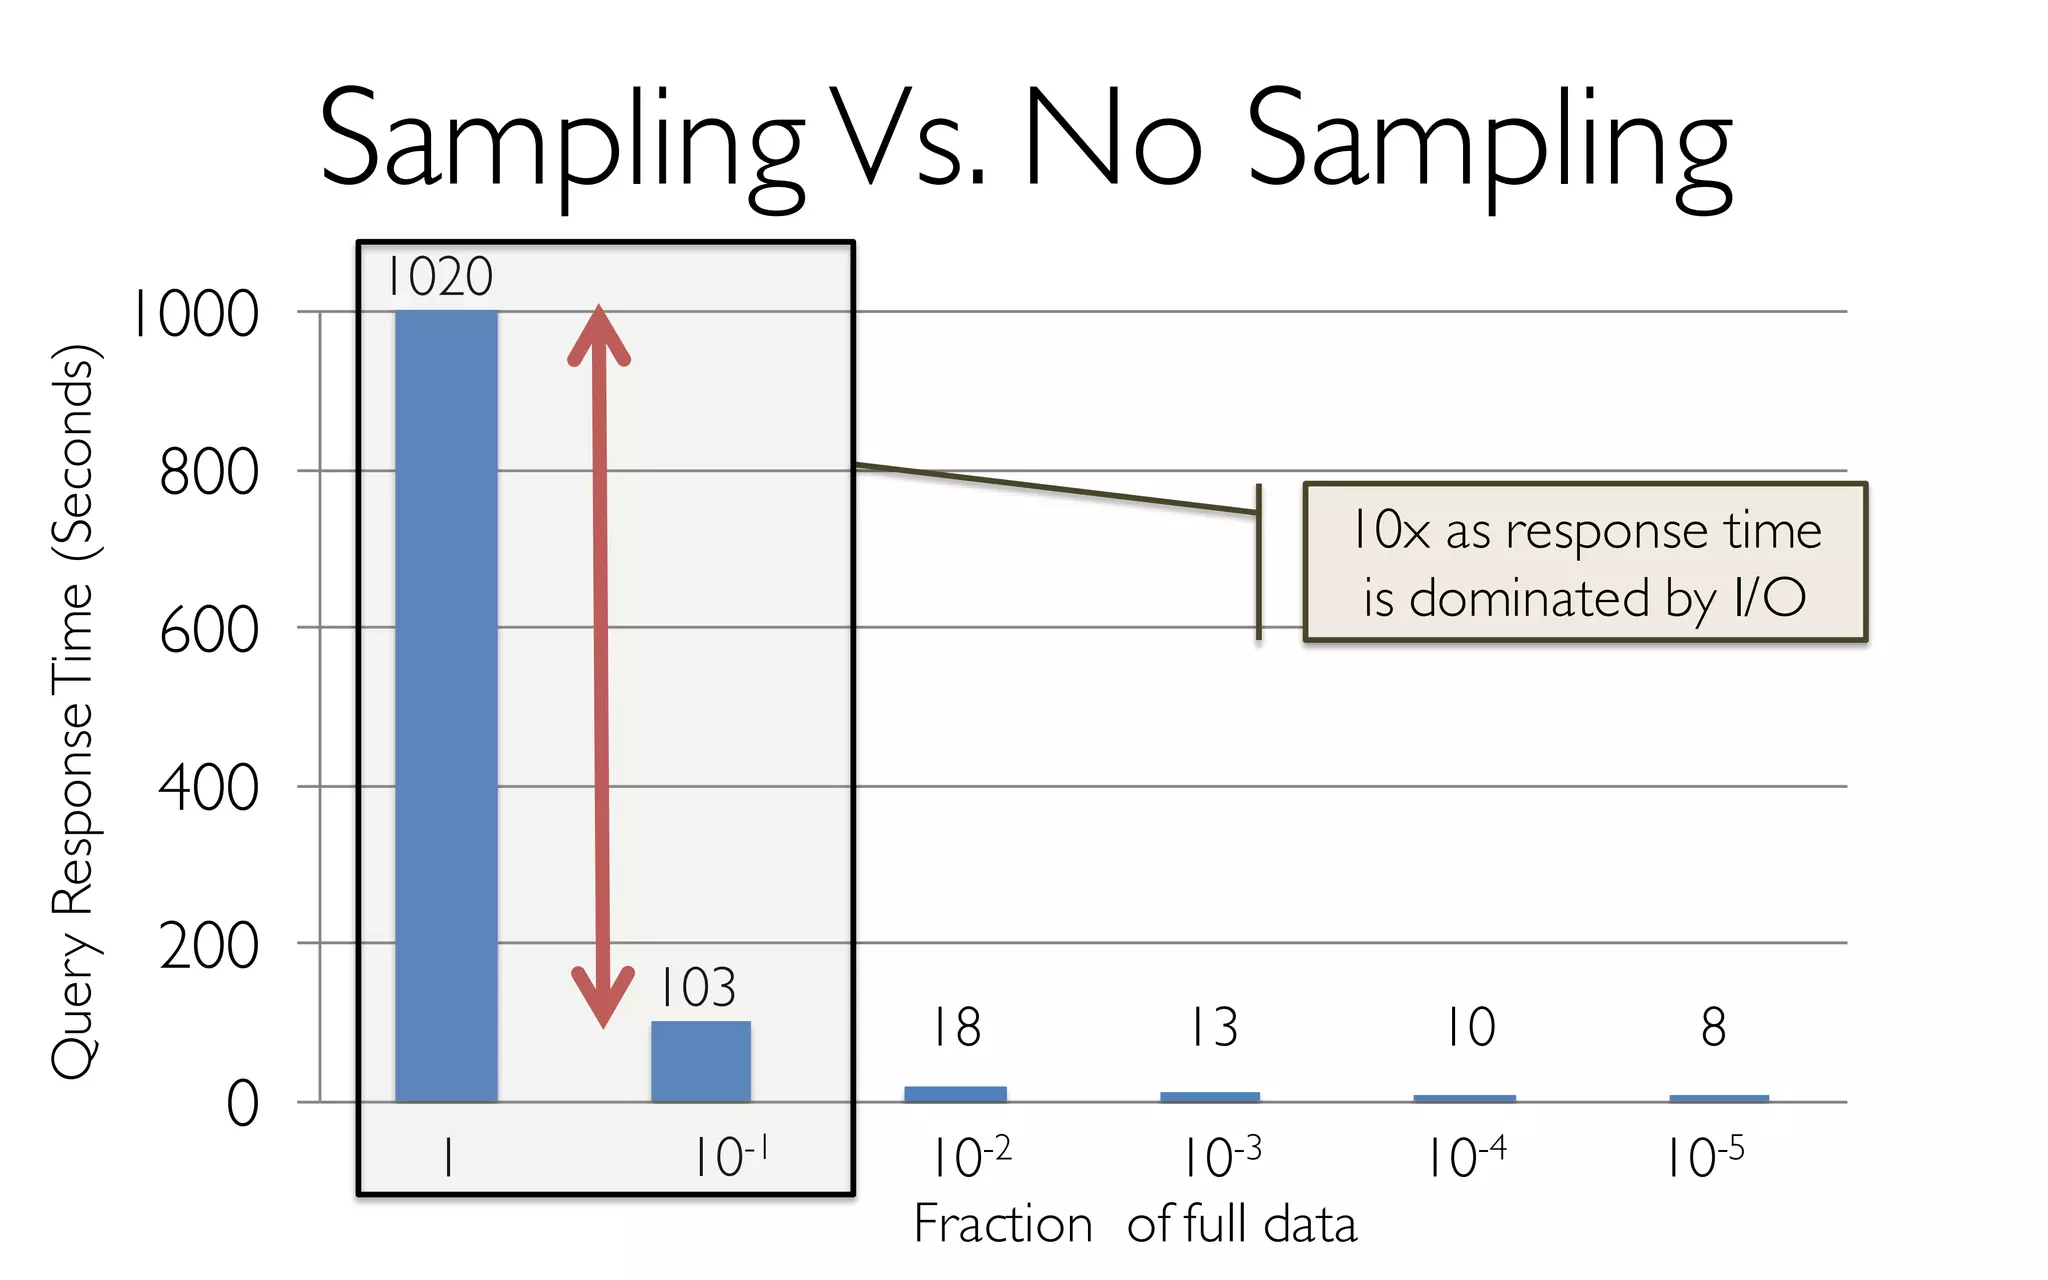
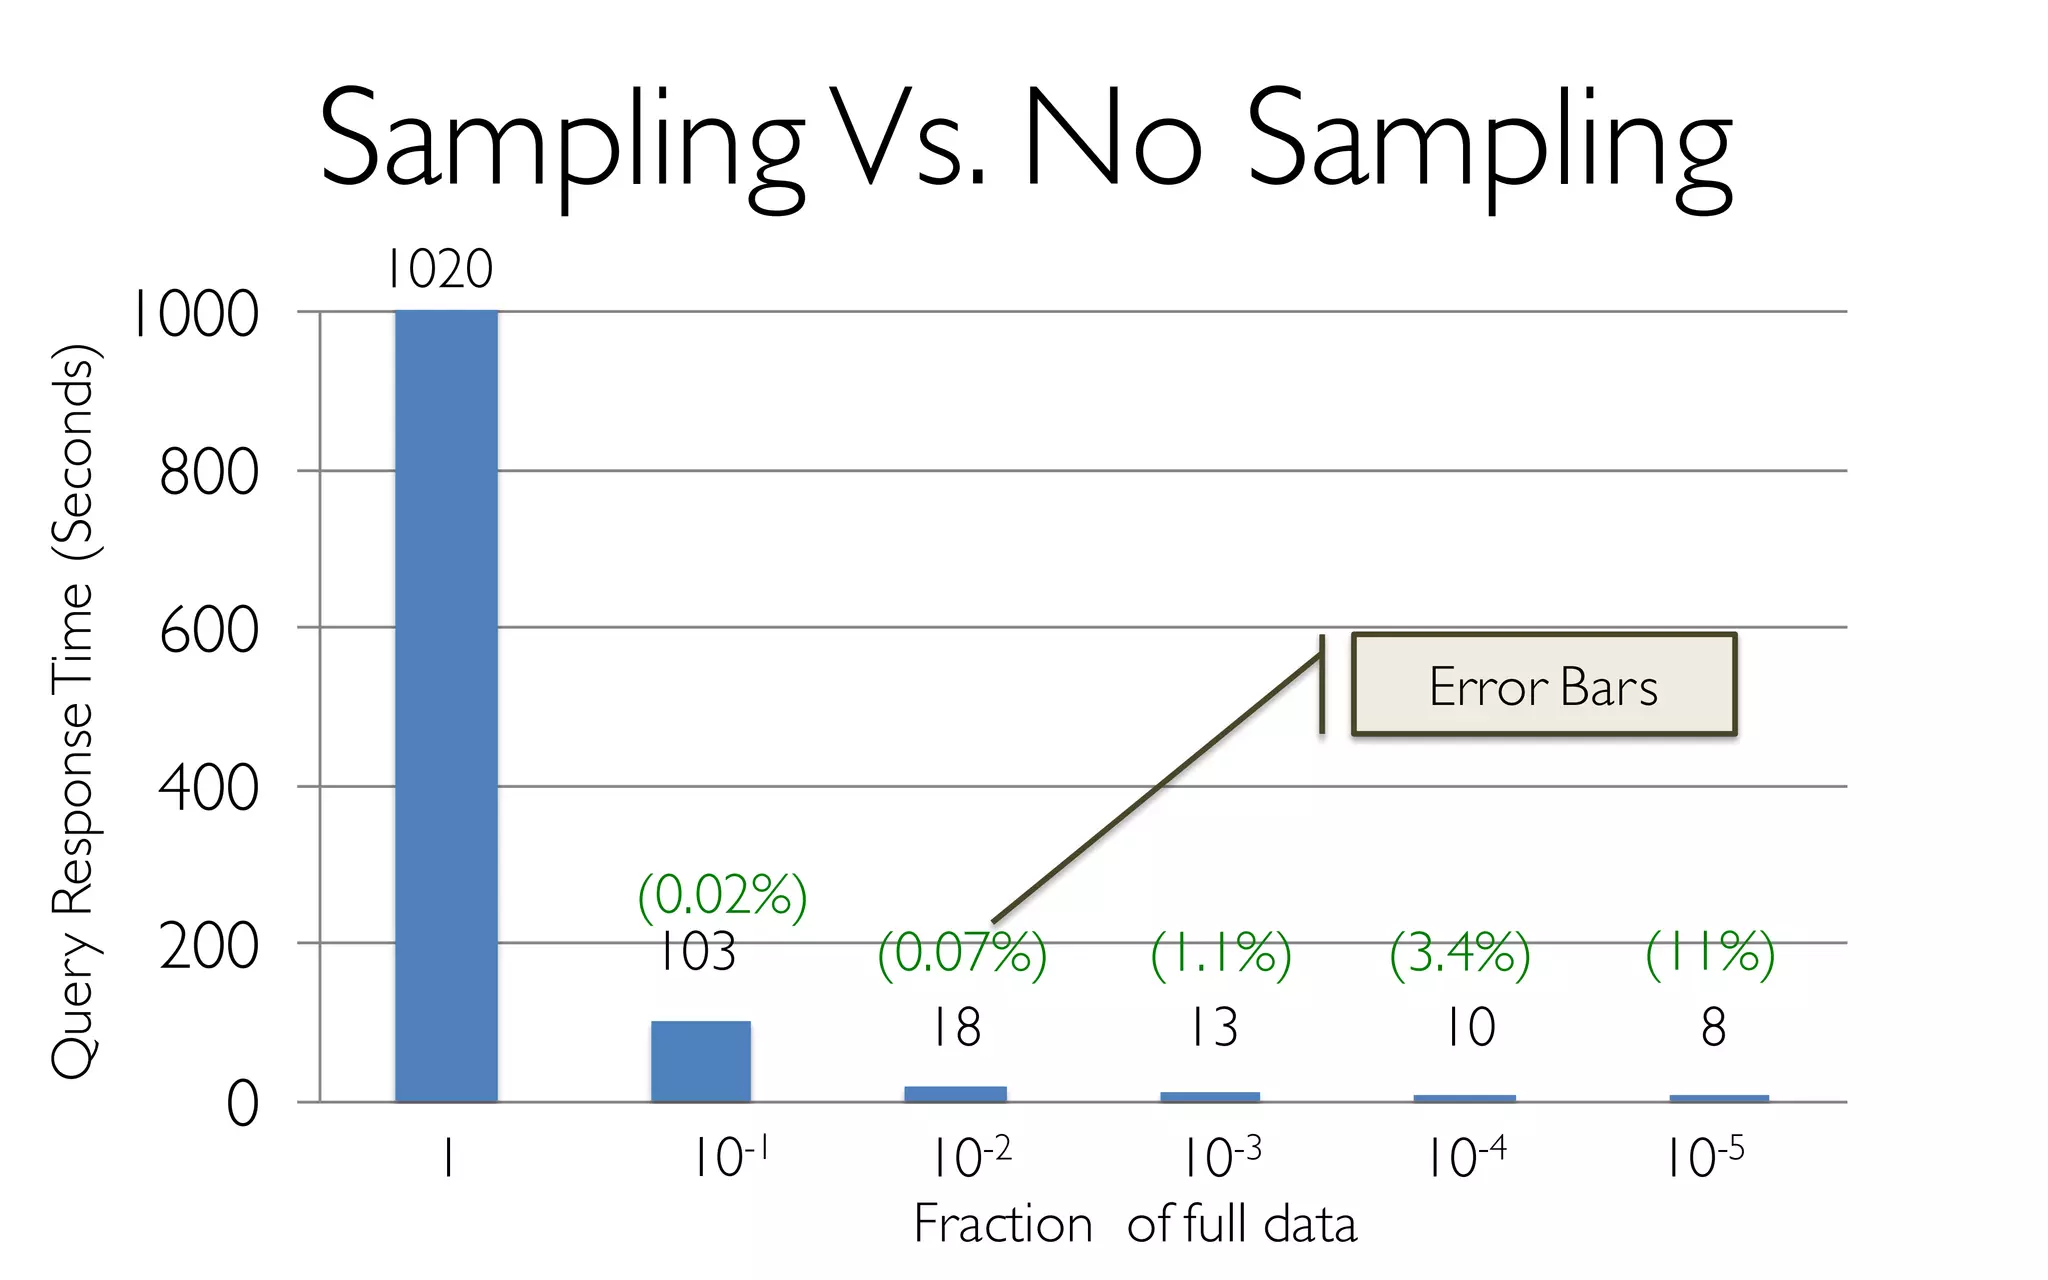
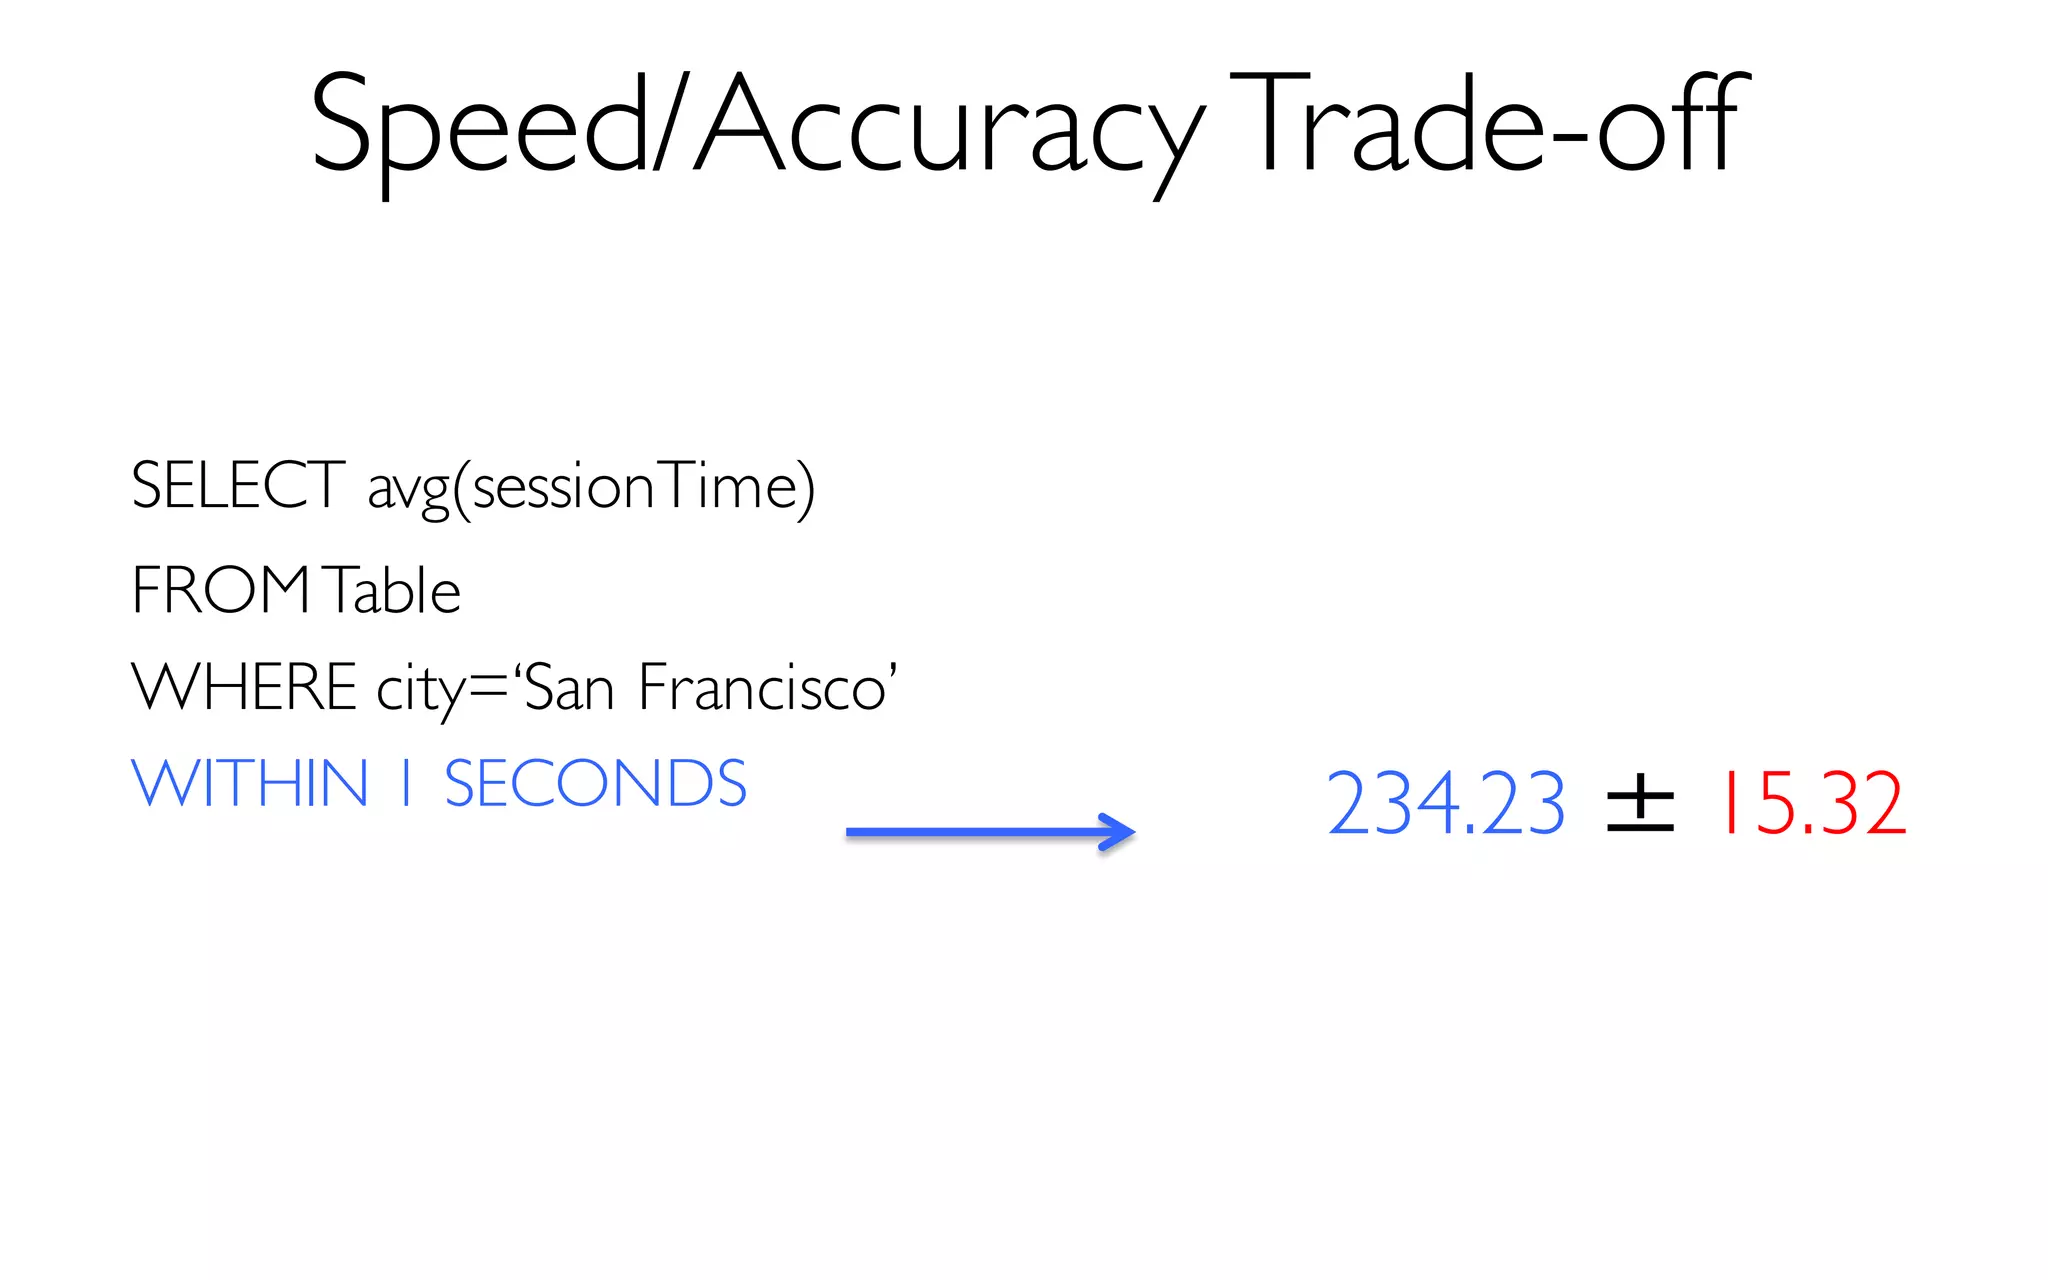
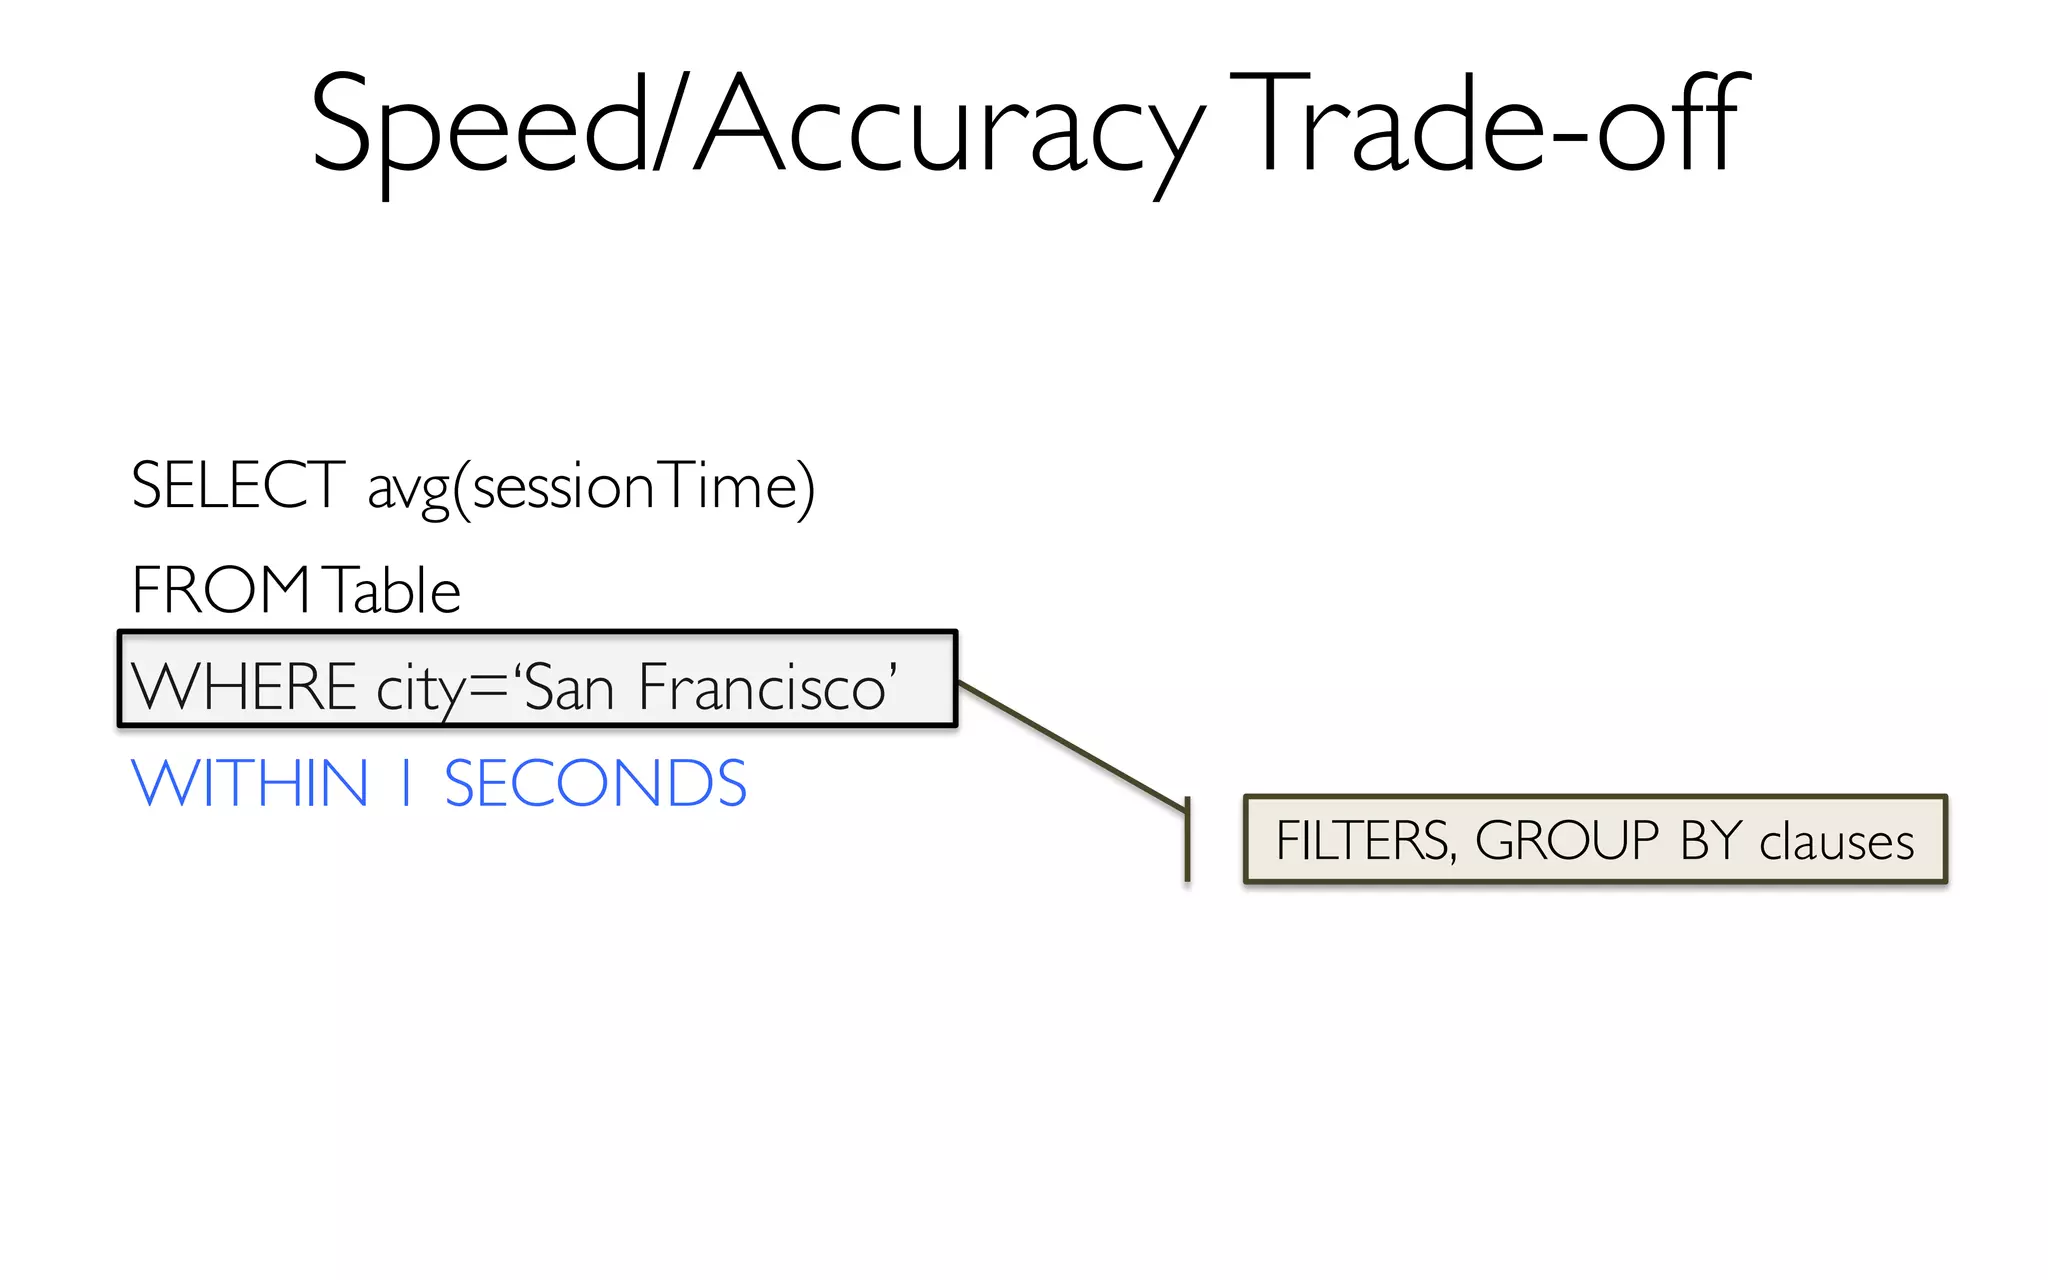
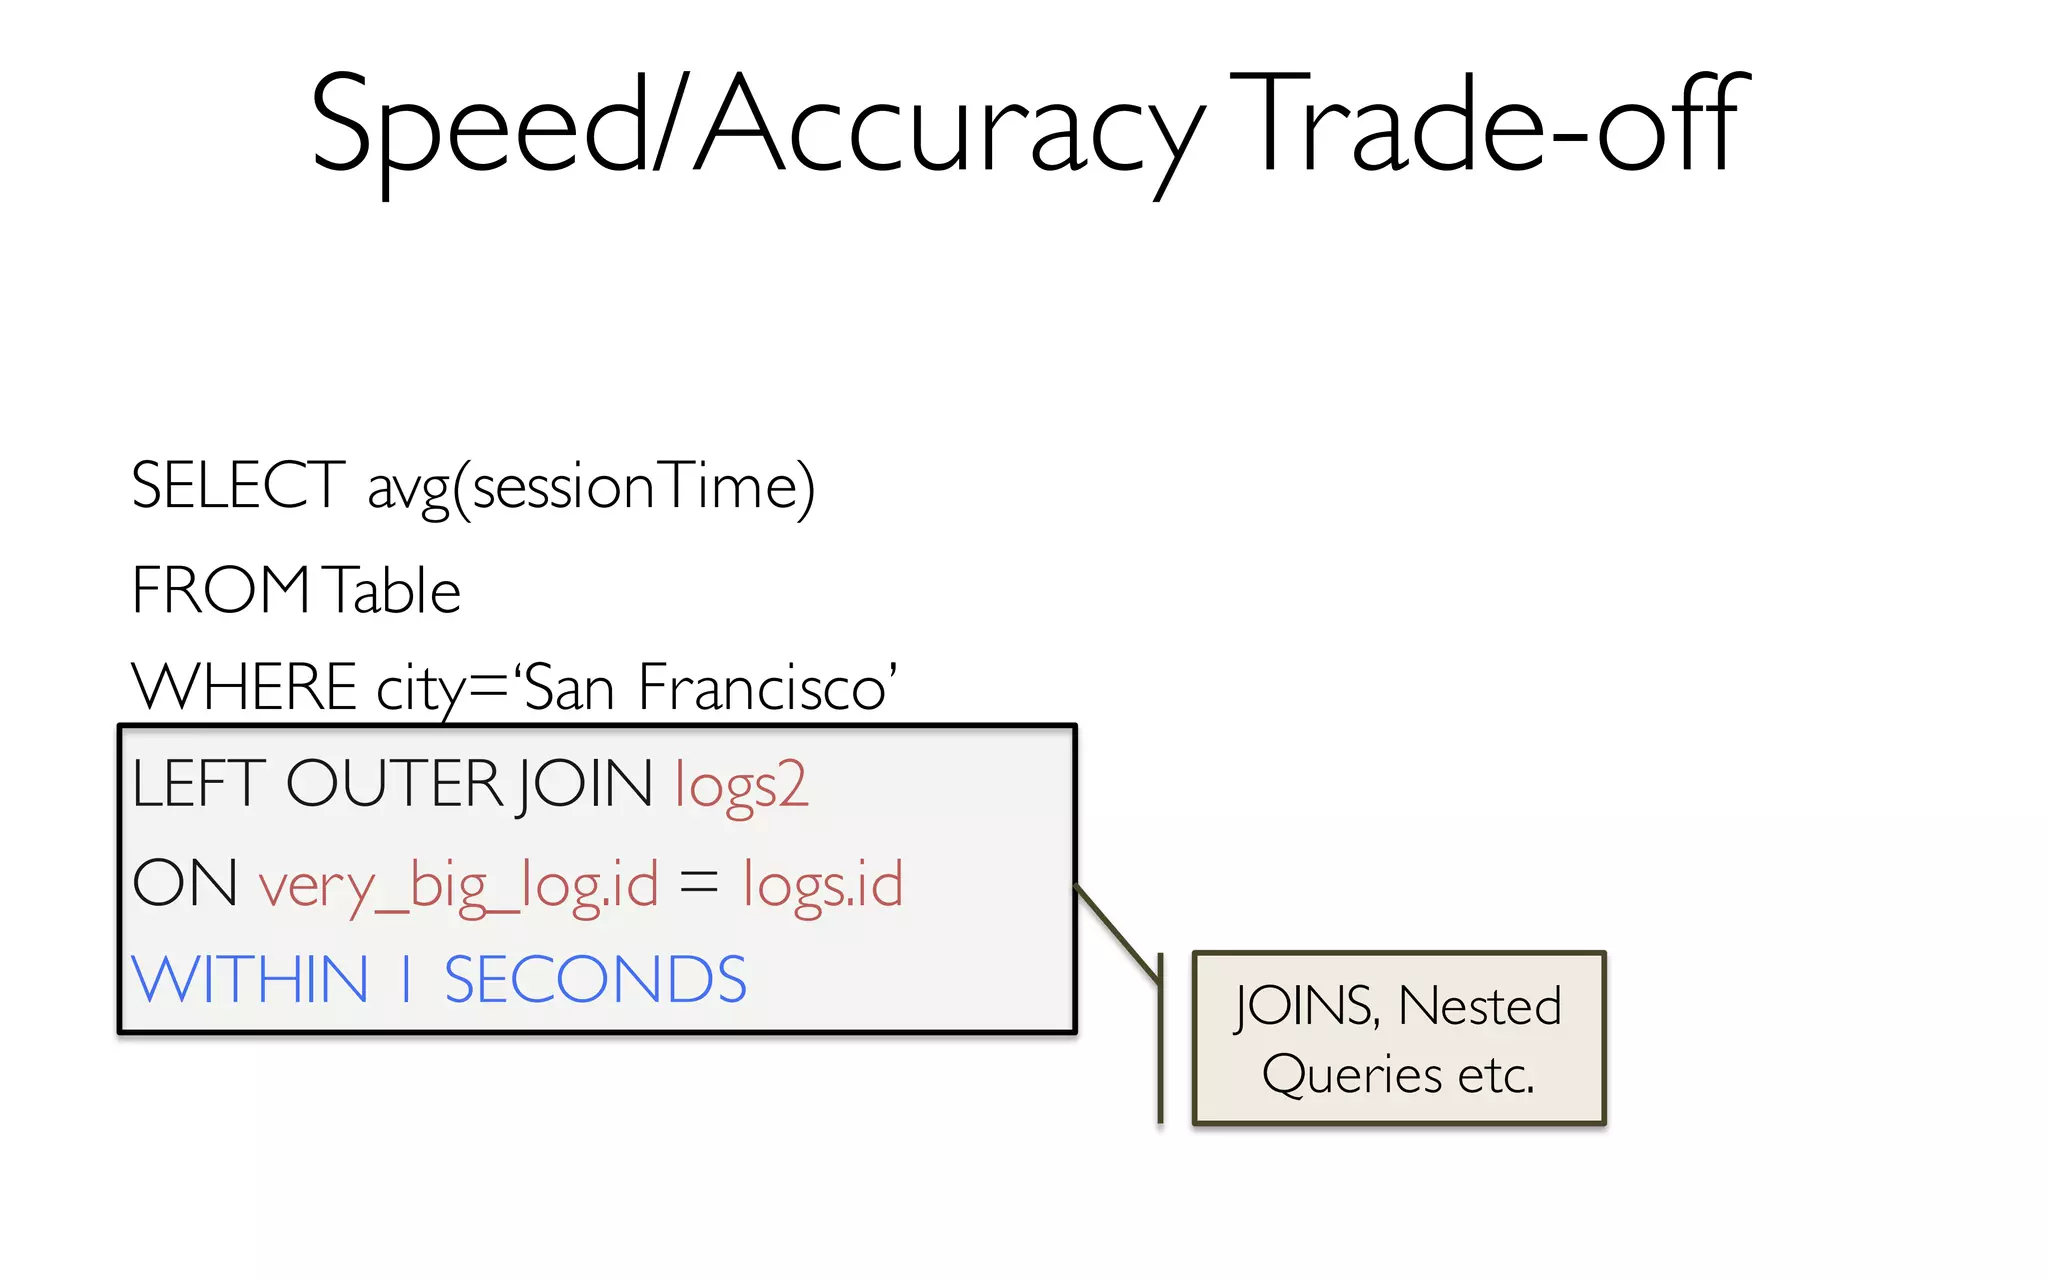
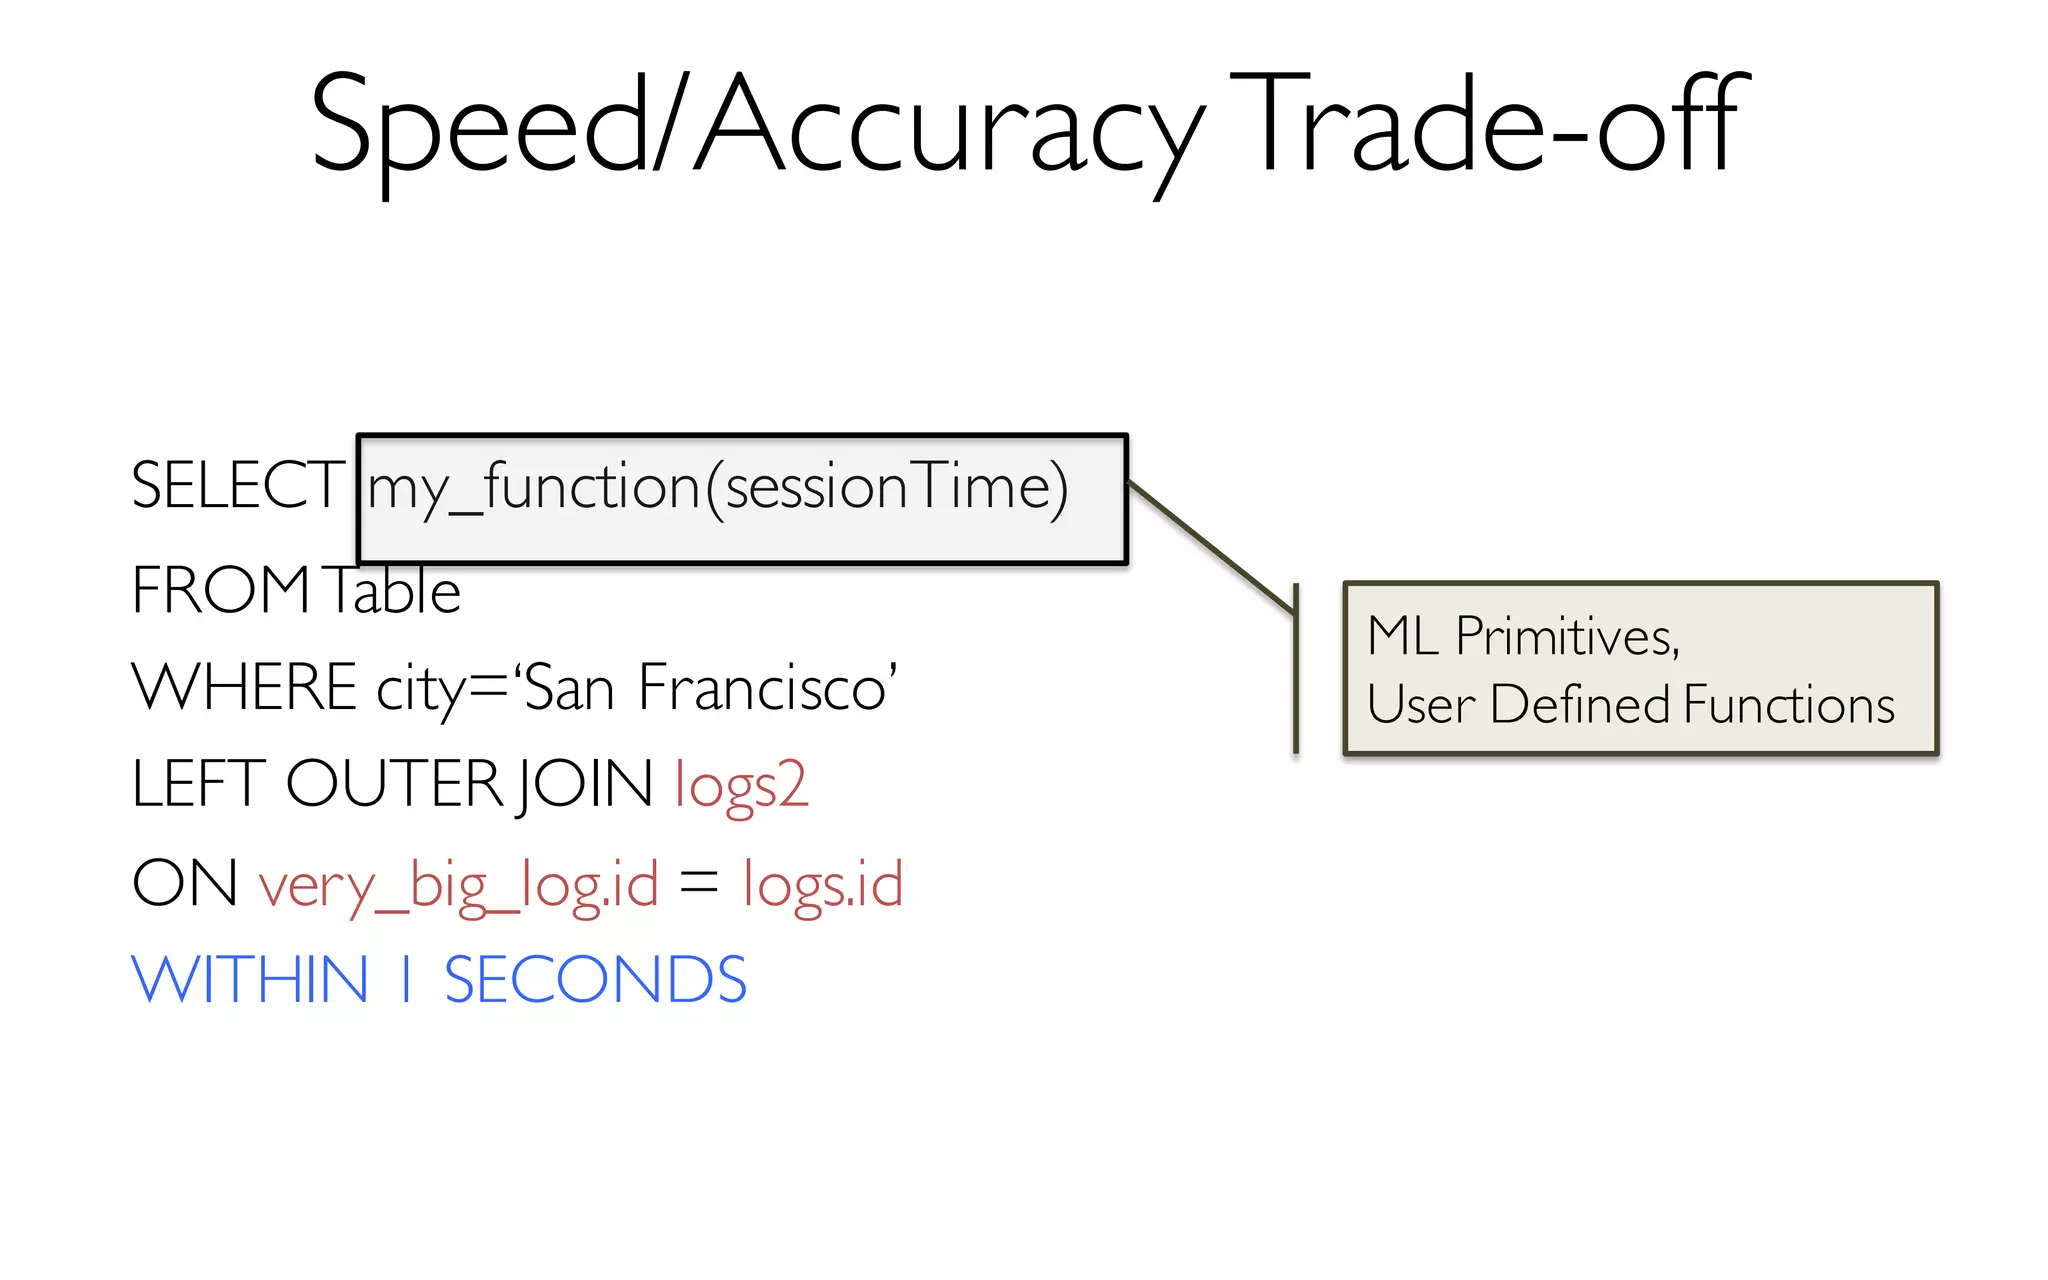
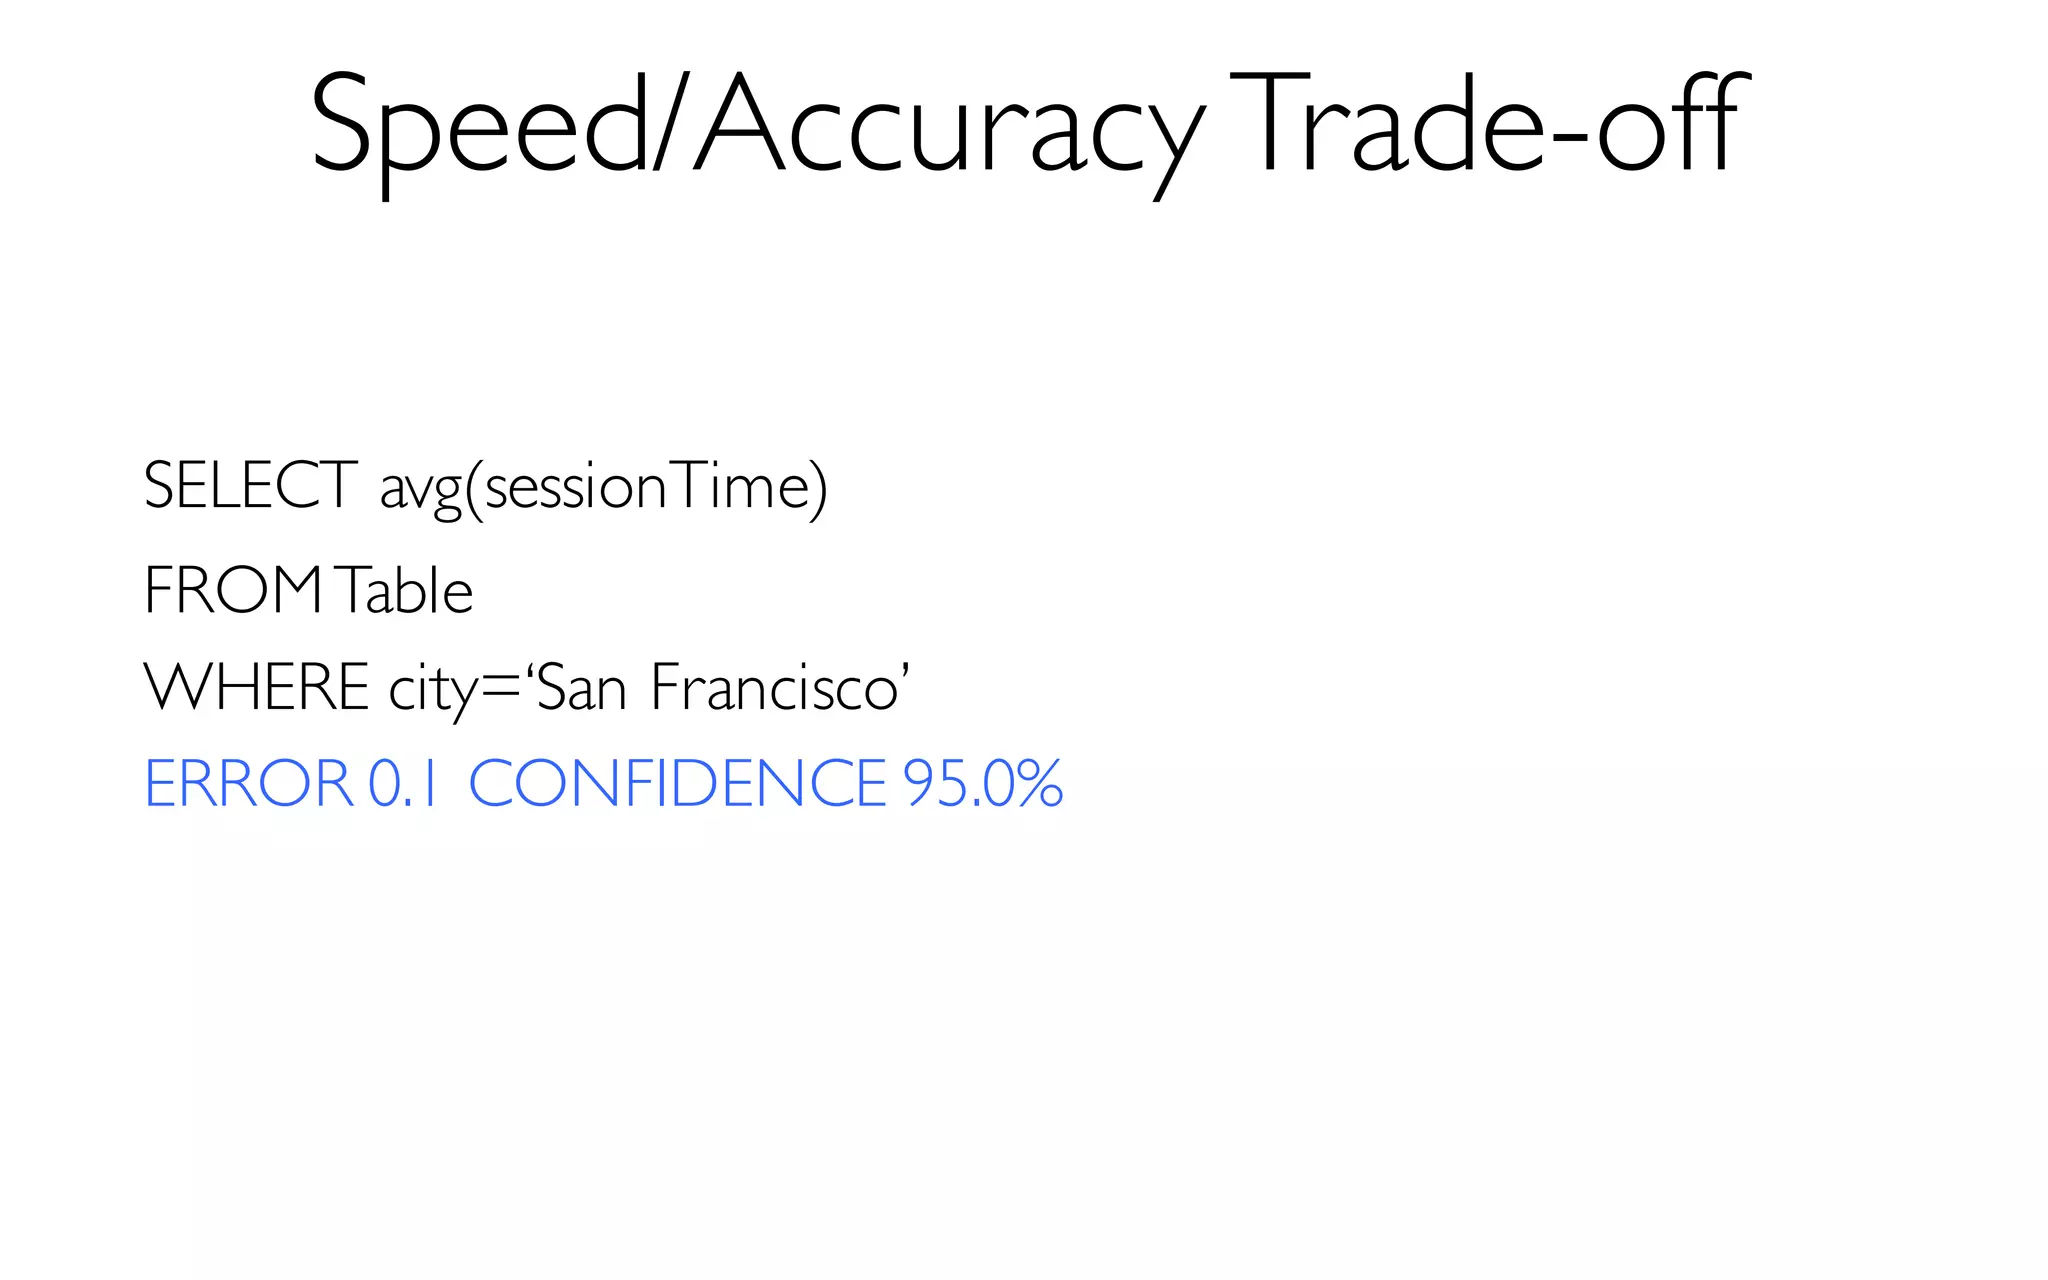
The document discusses BlinkDB, a framework built on Spark that efficiently creates and manages uniform and stratified samples from large datasets, providing fast approximate query answers with associated error bars. It highlights the sampling methods, accuracy trade-offs, performance metrics, and the architecture involved in query processing. The content is based on research and development from UC Berkeley and various contributors in the field of database systems.


