Download as PDF, PPTX
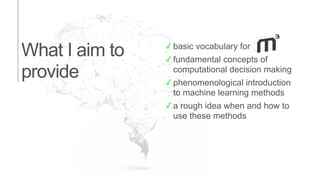


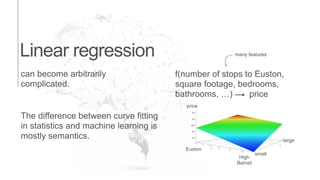


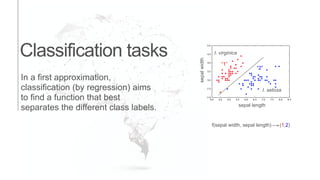


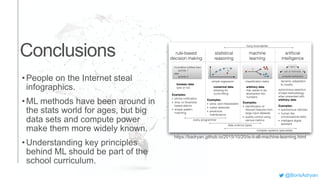

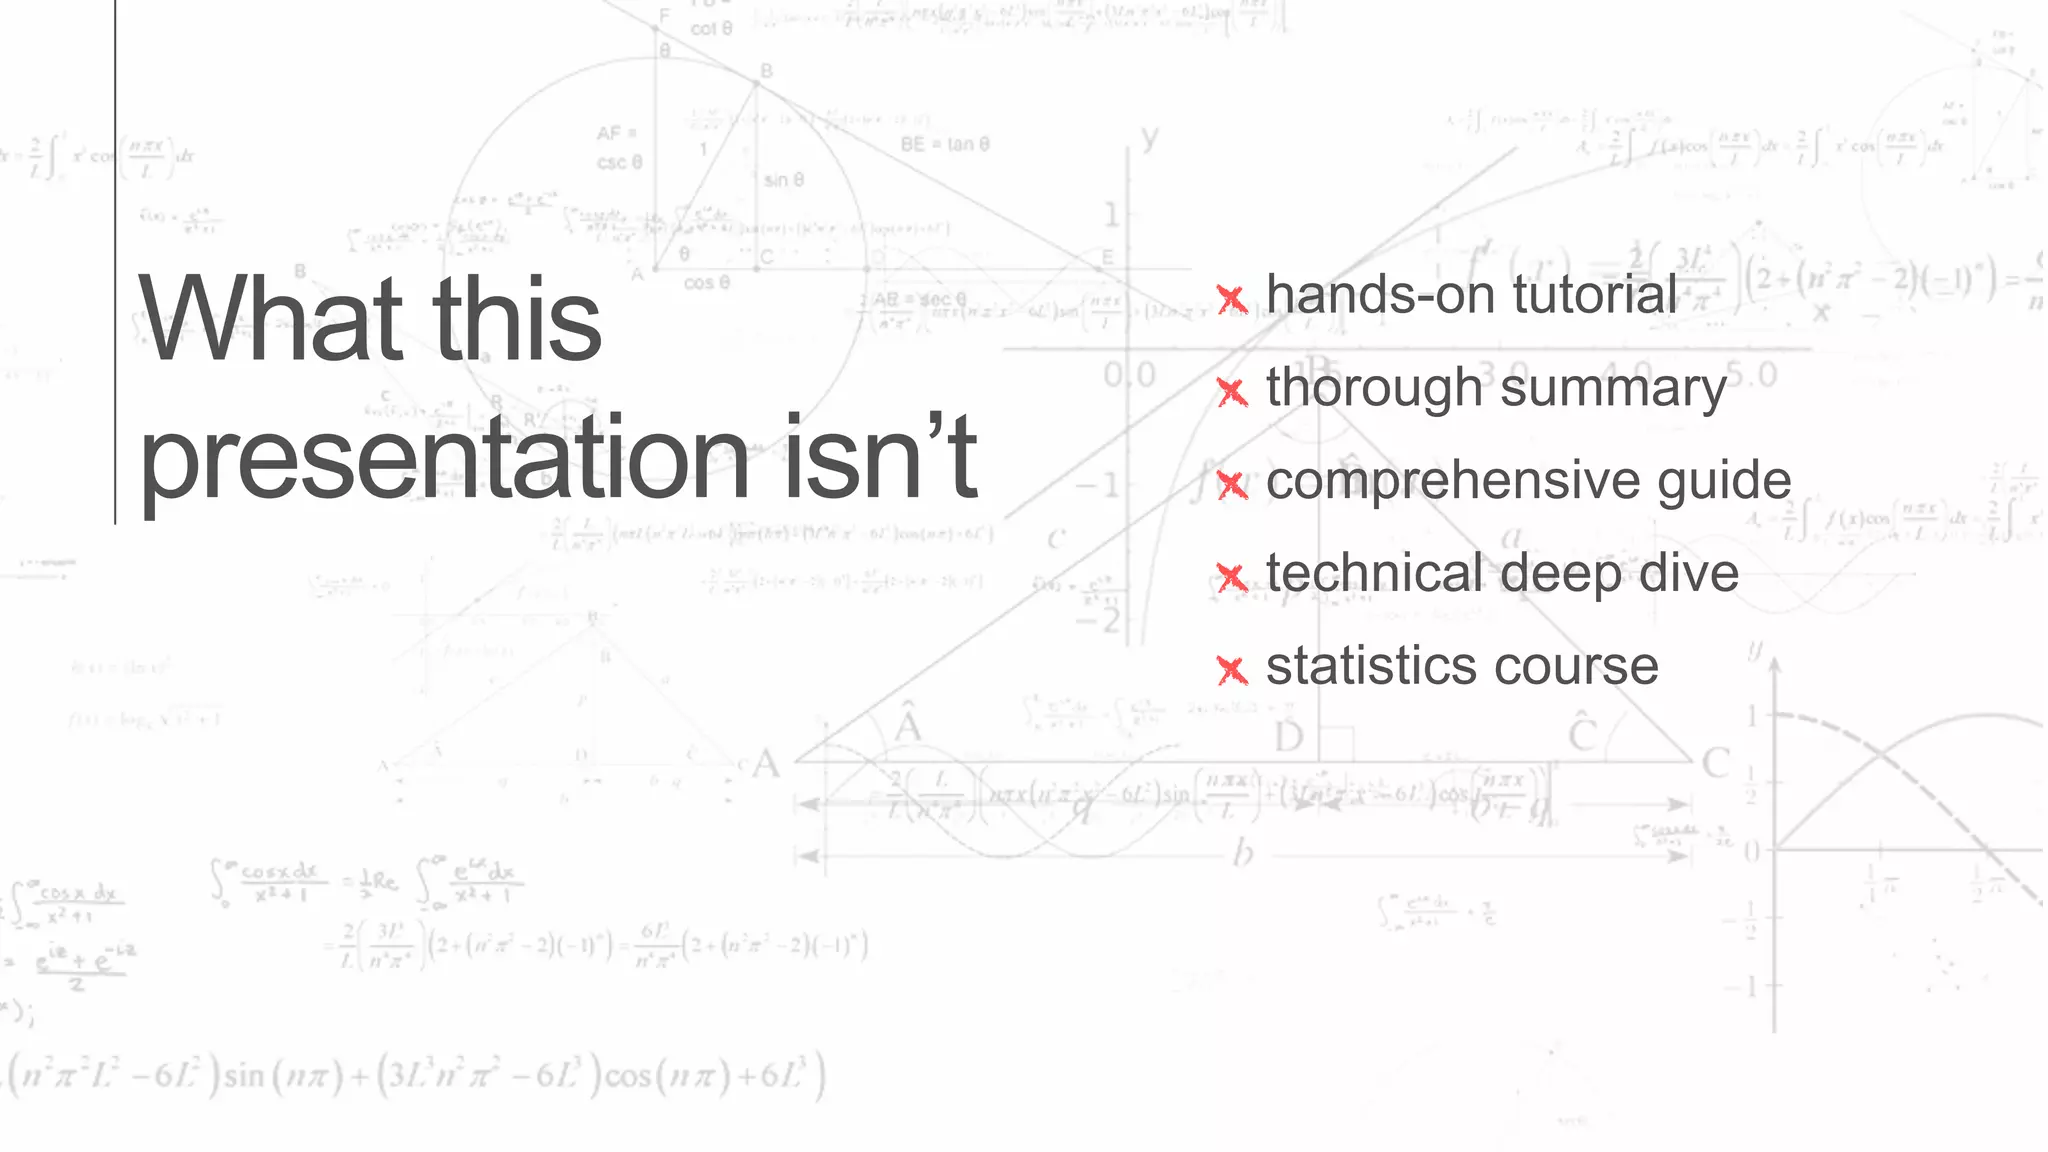


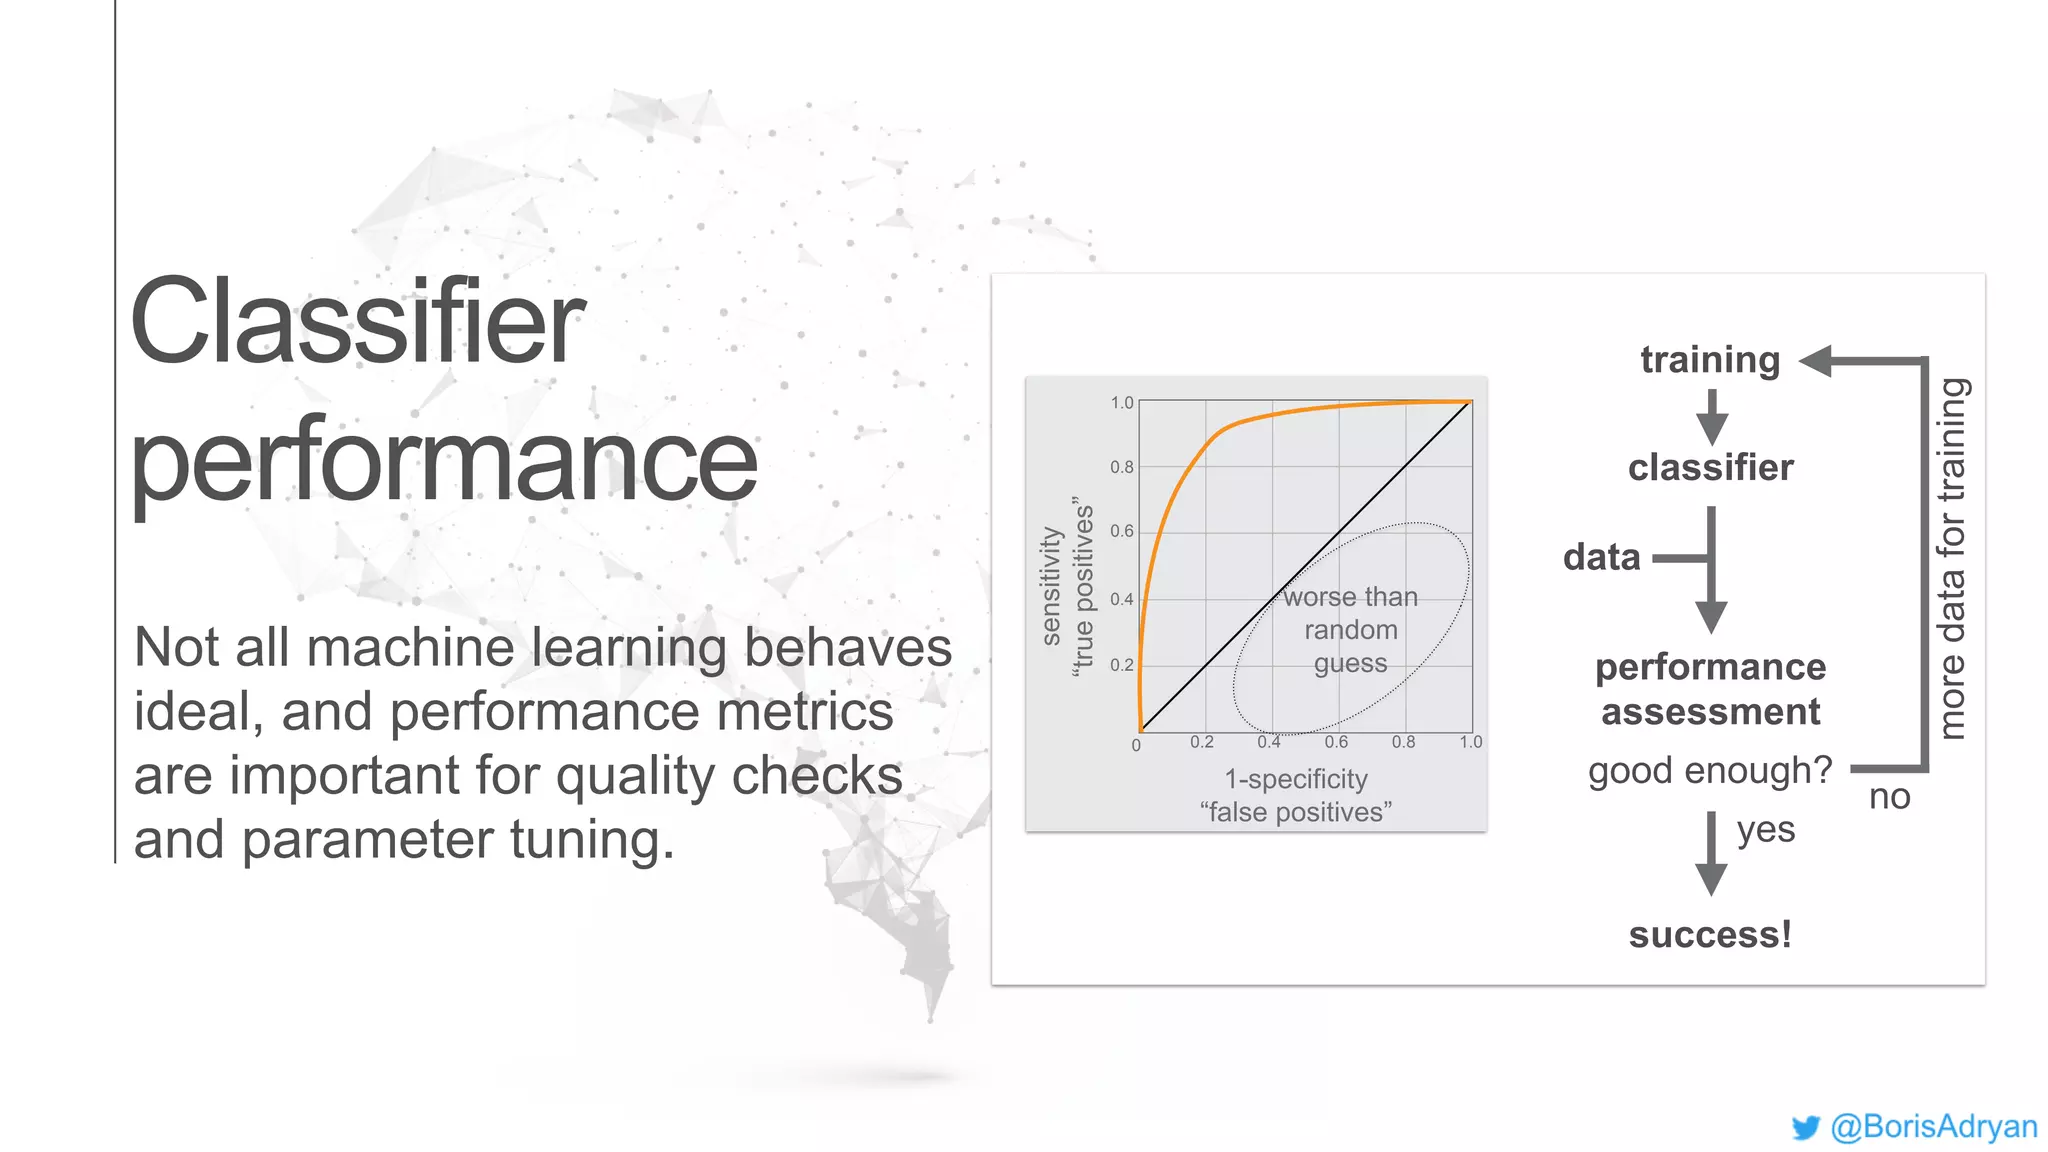
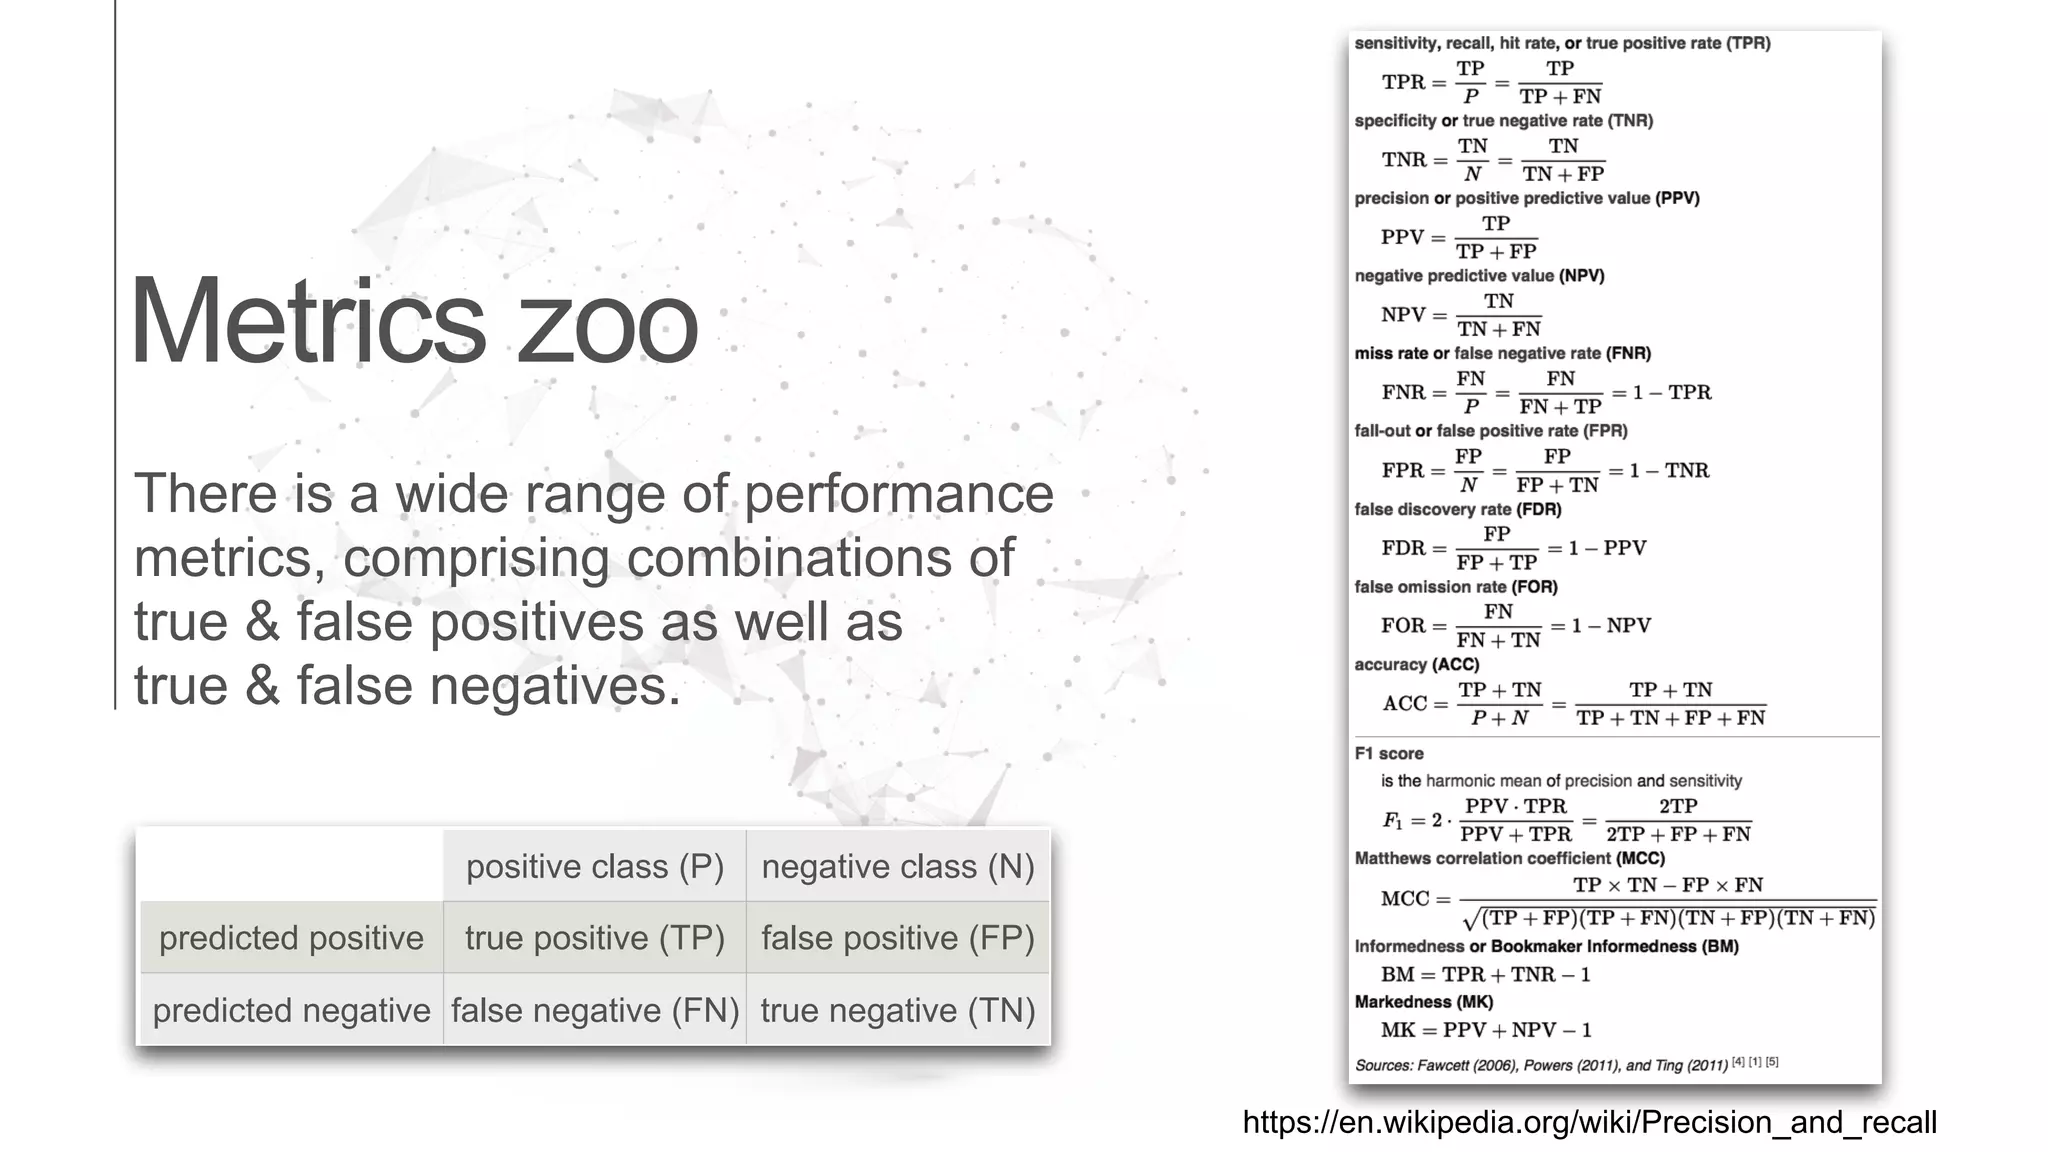
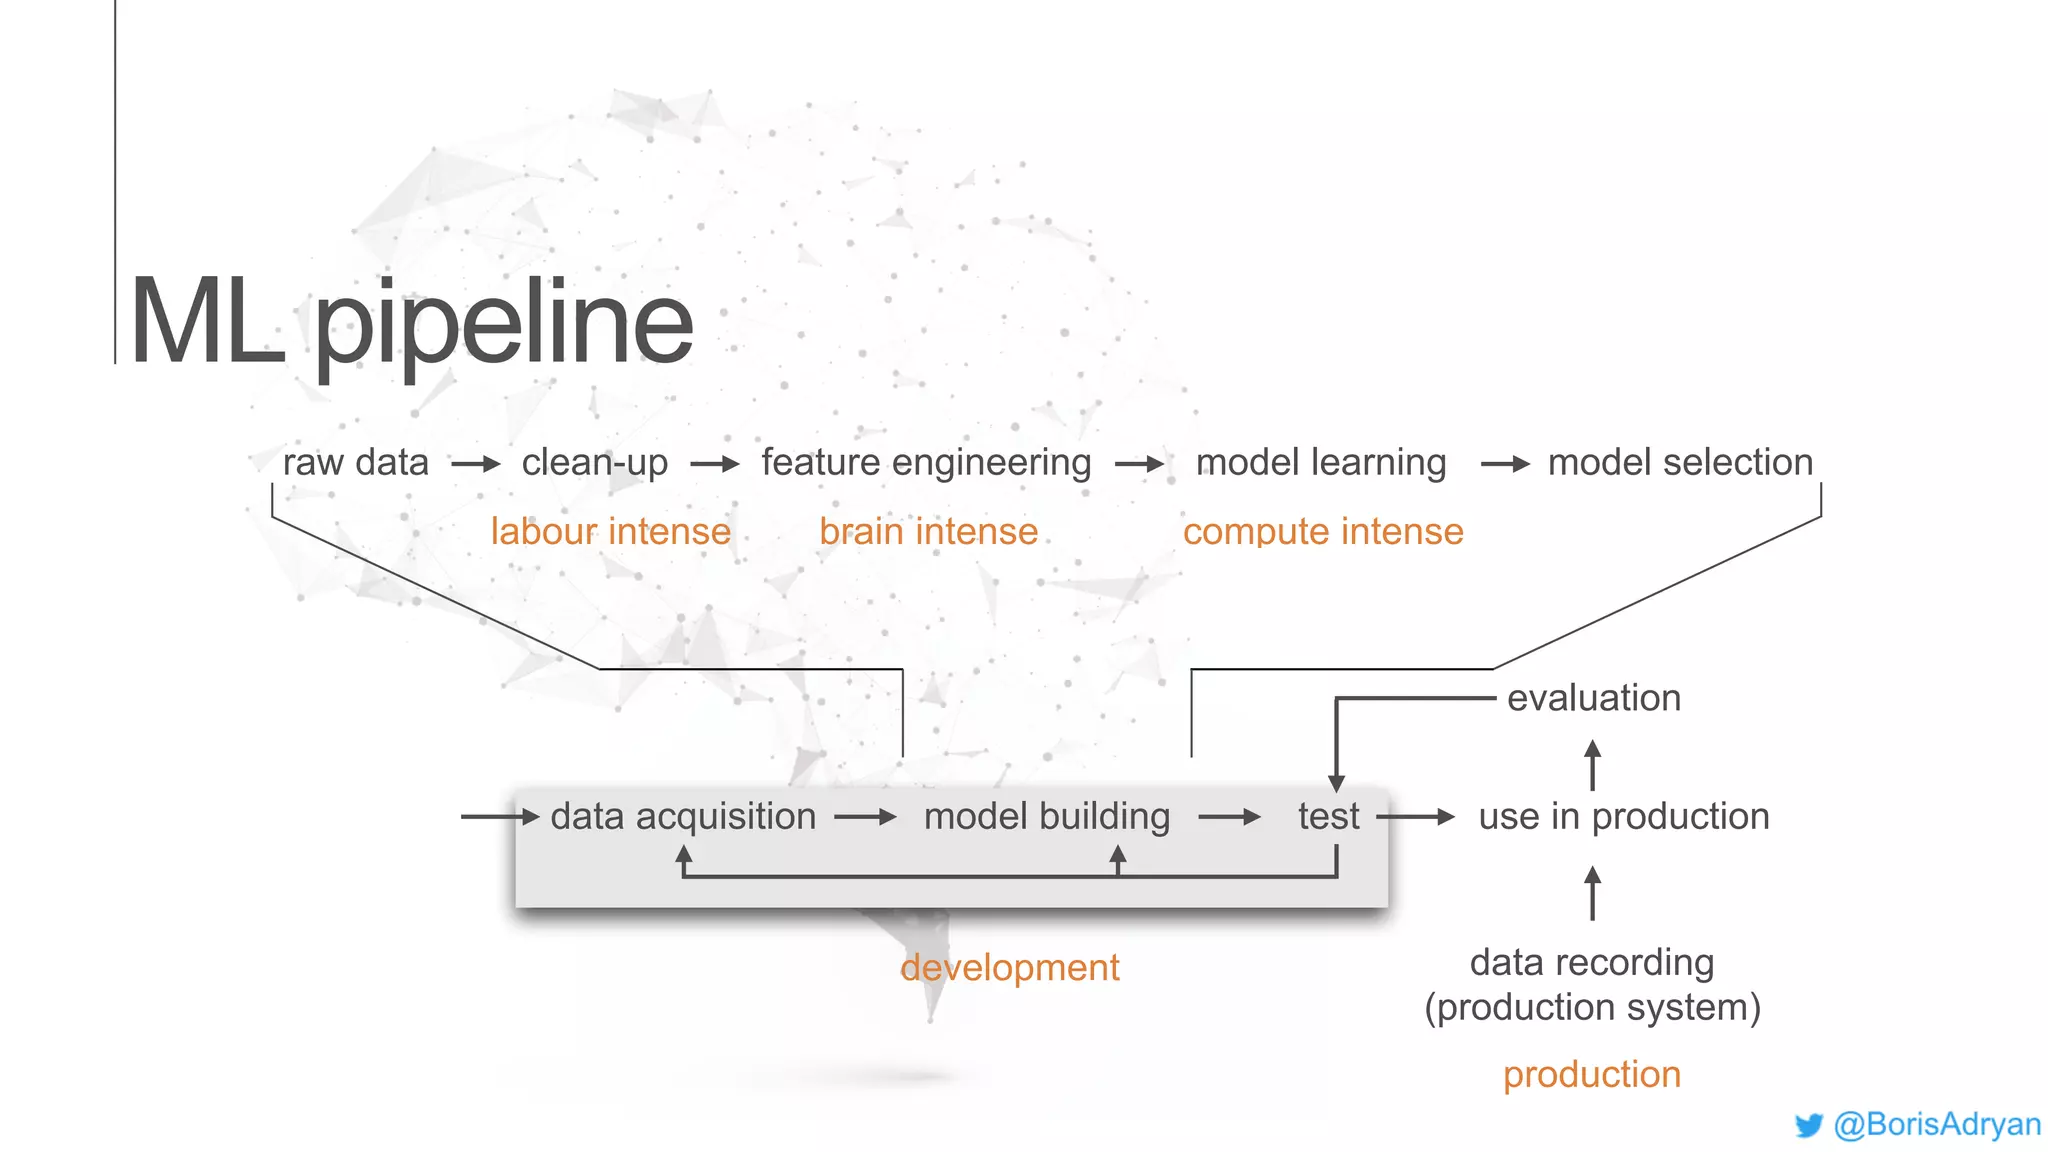
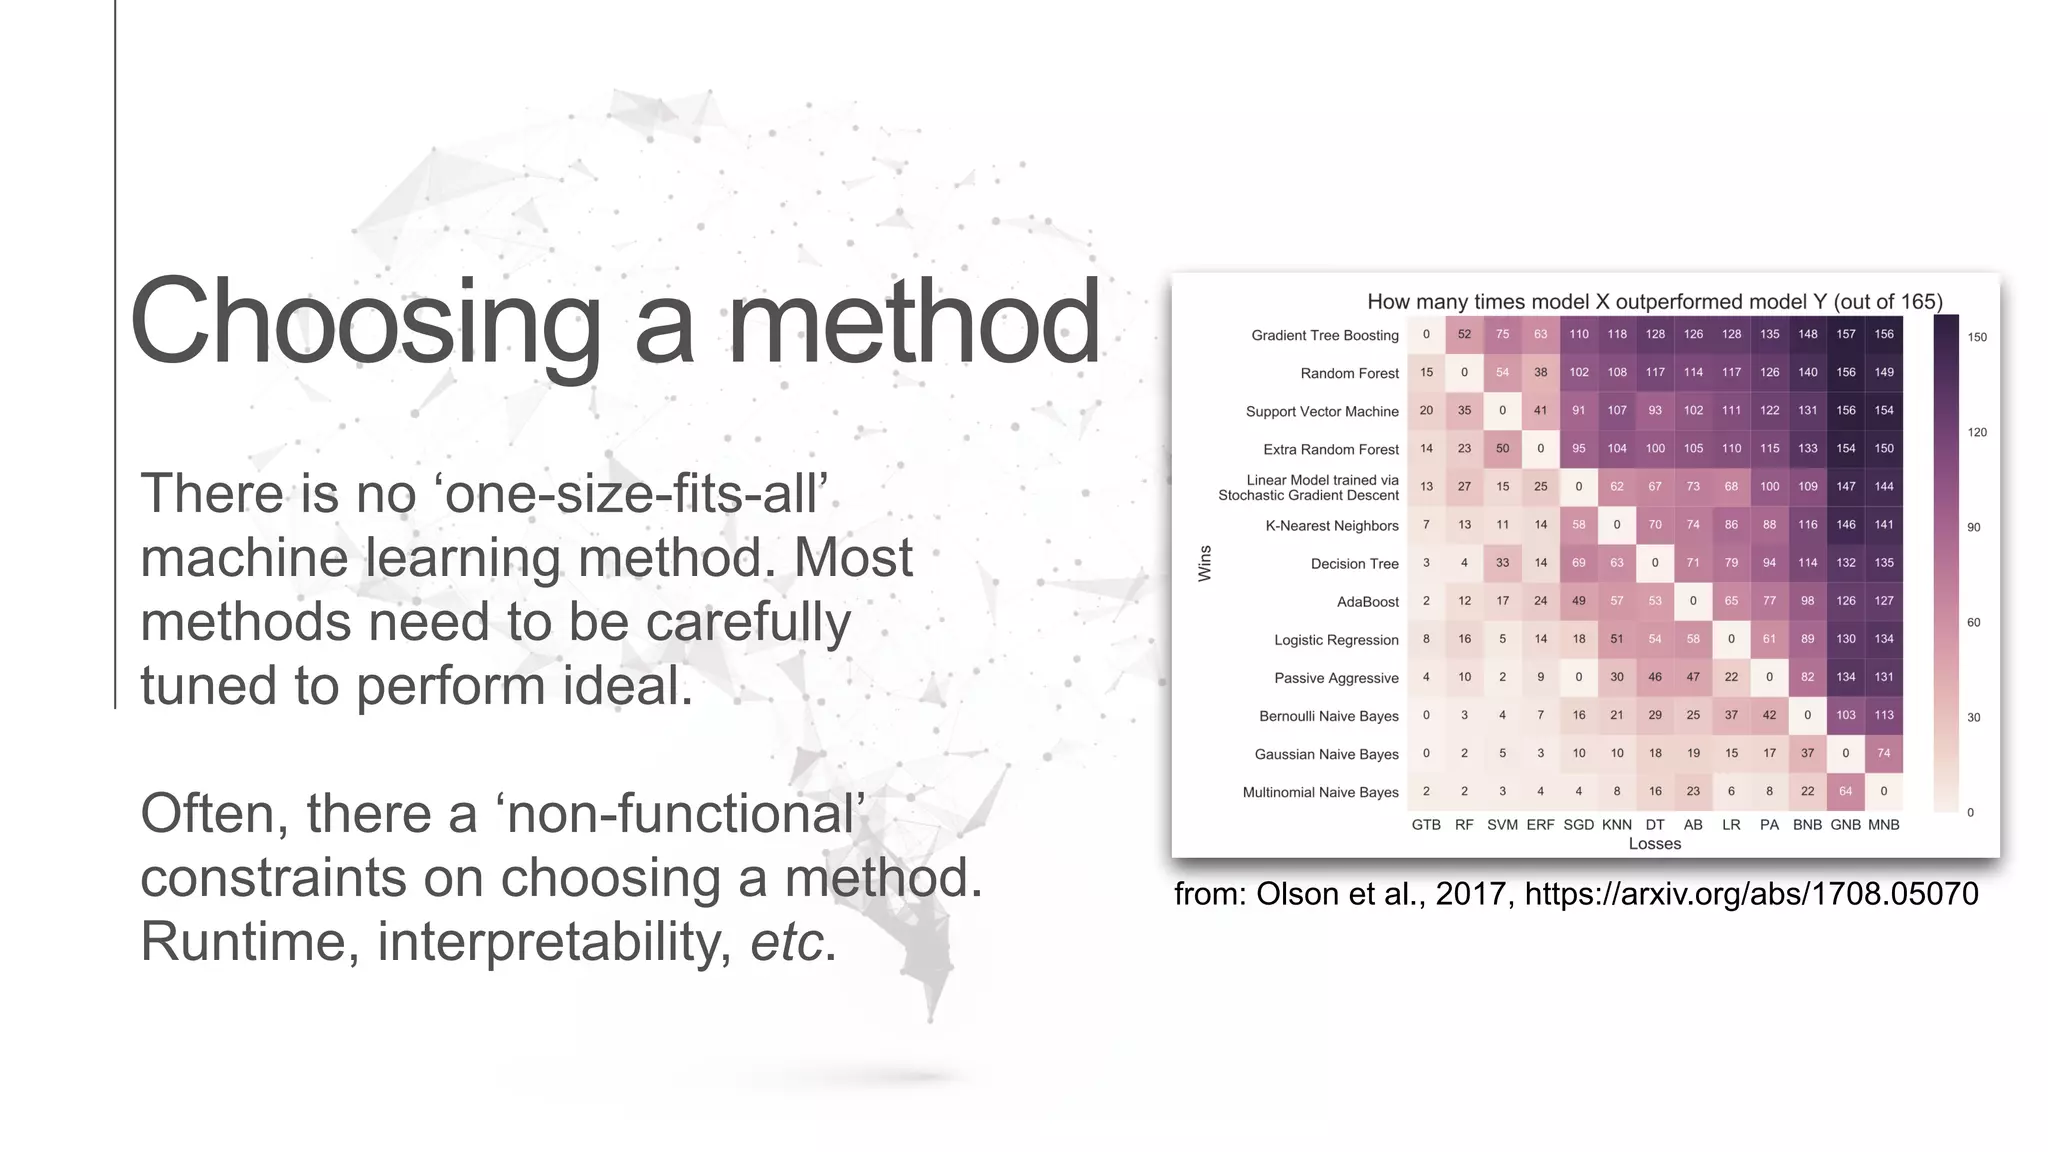
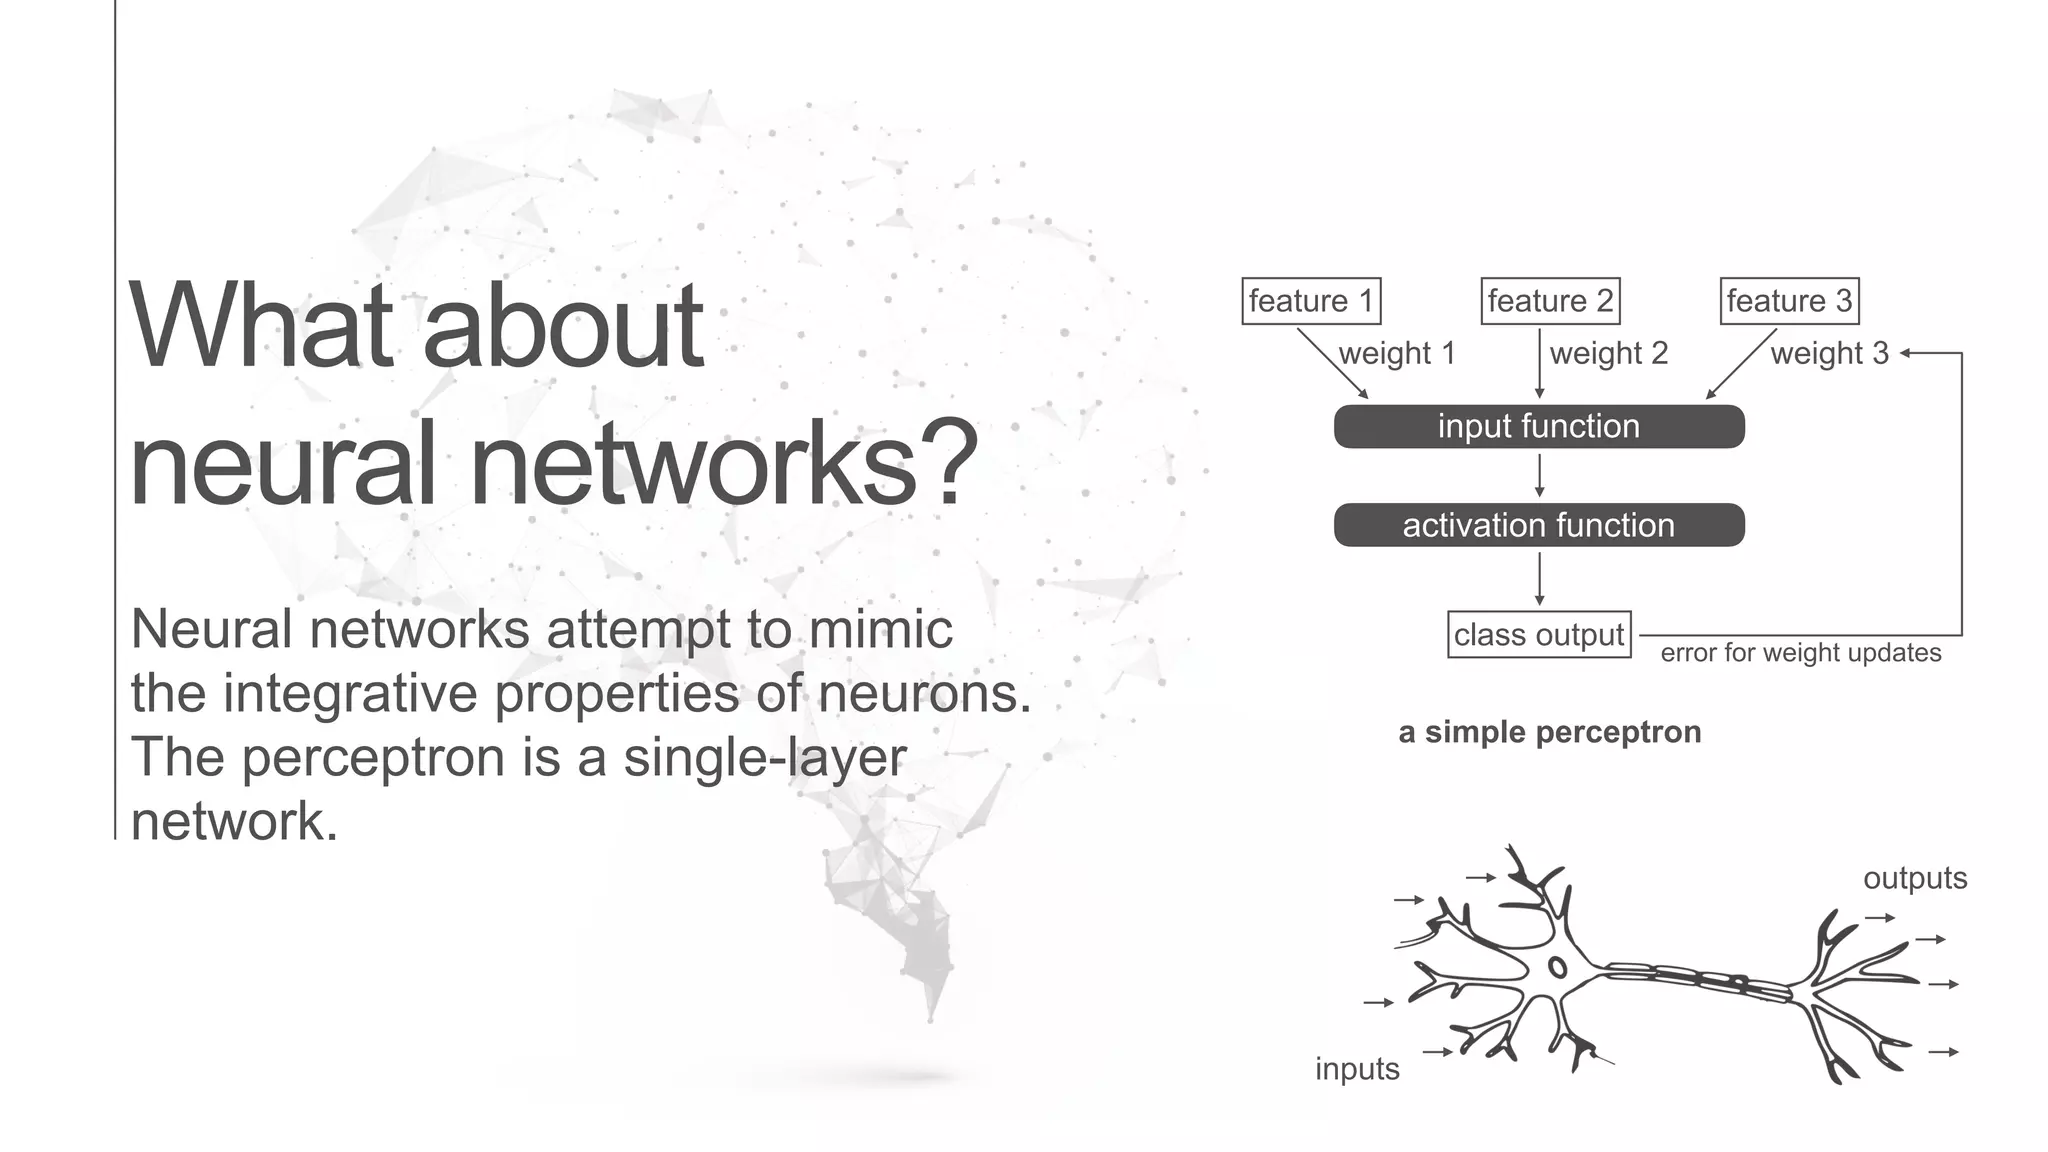
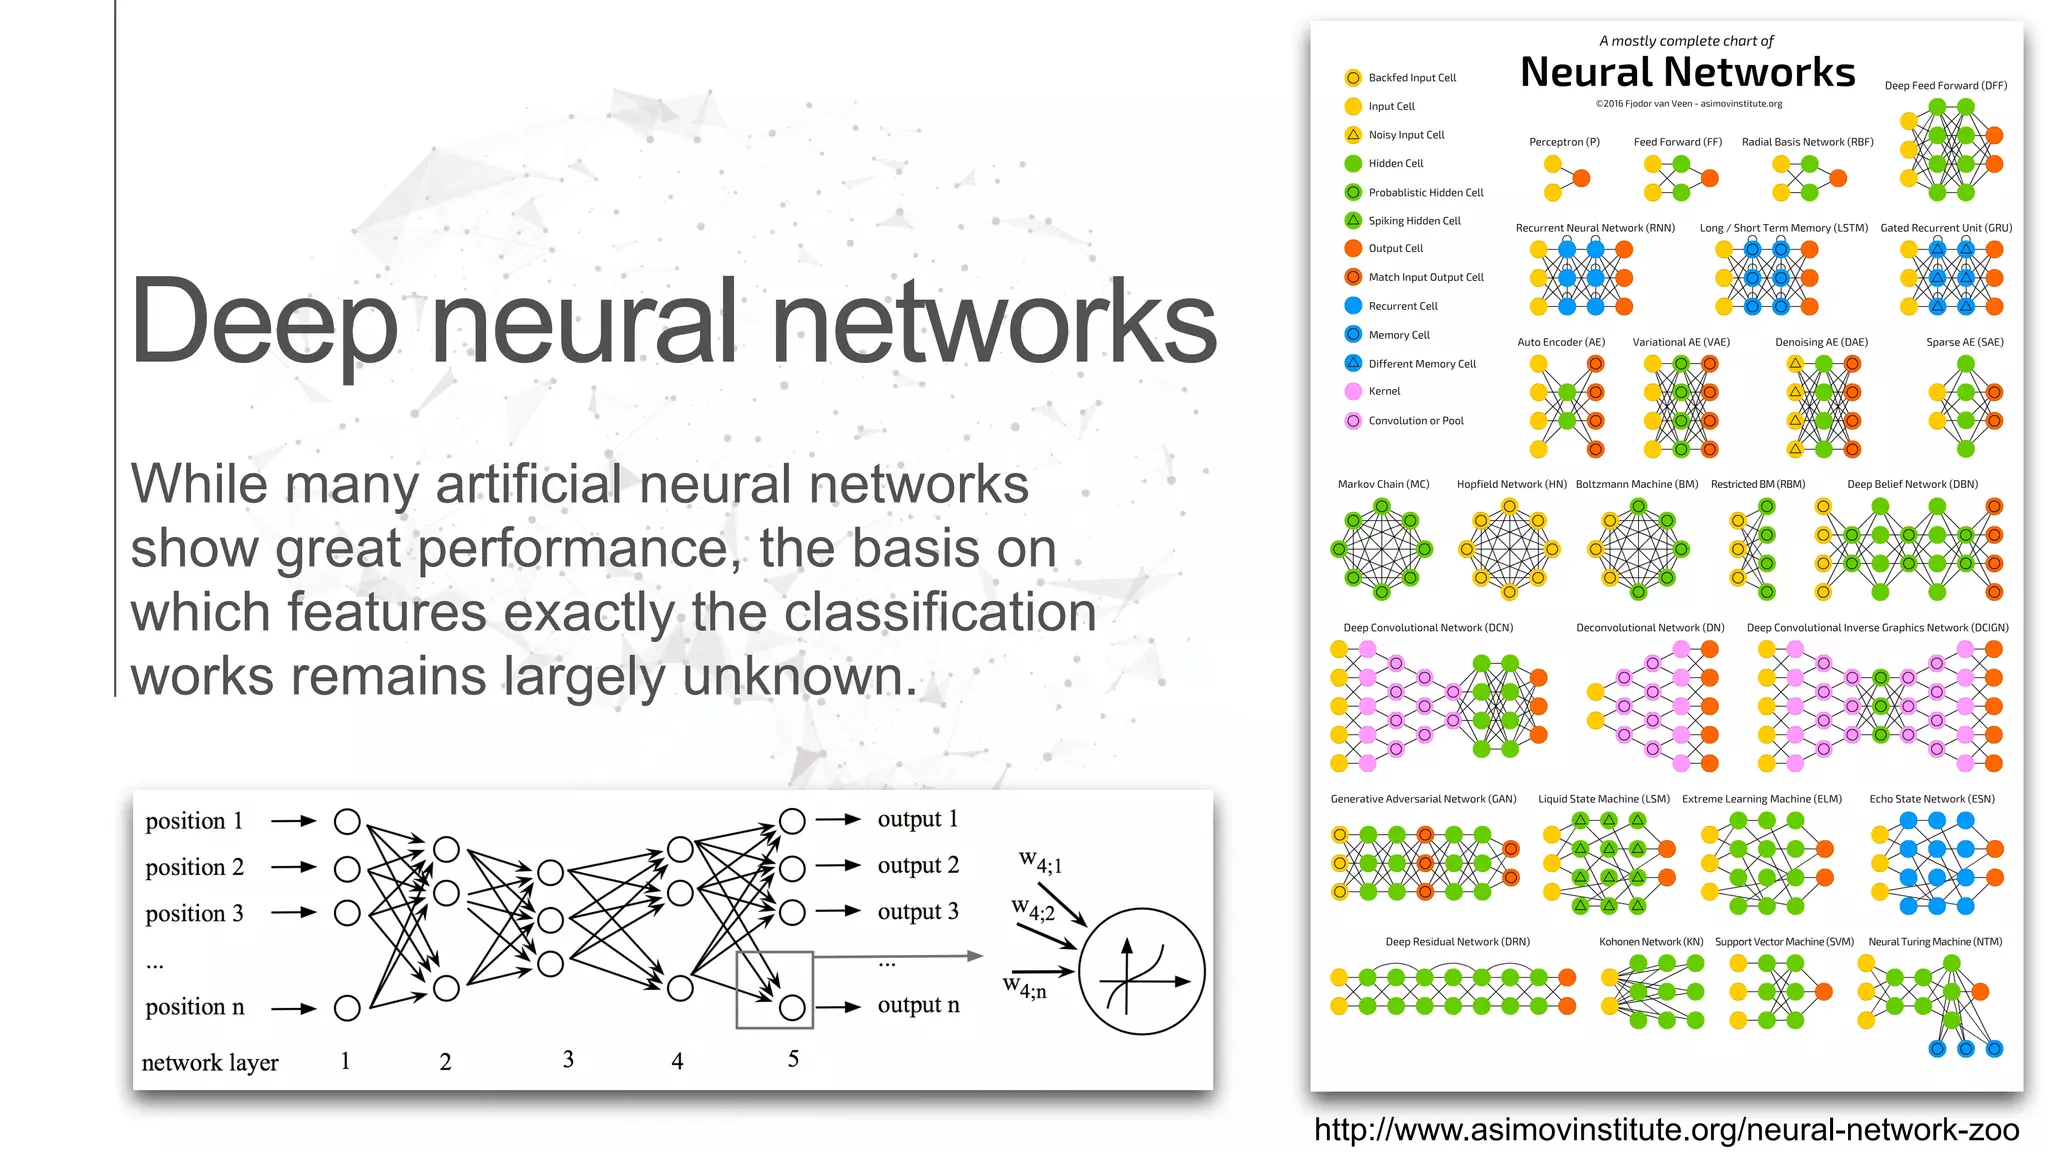
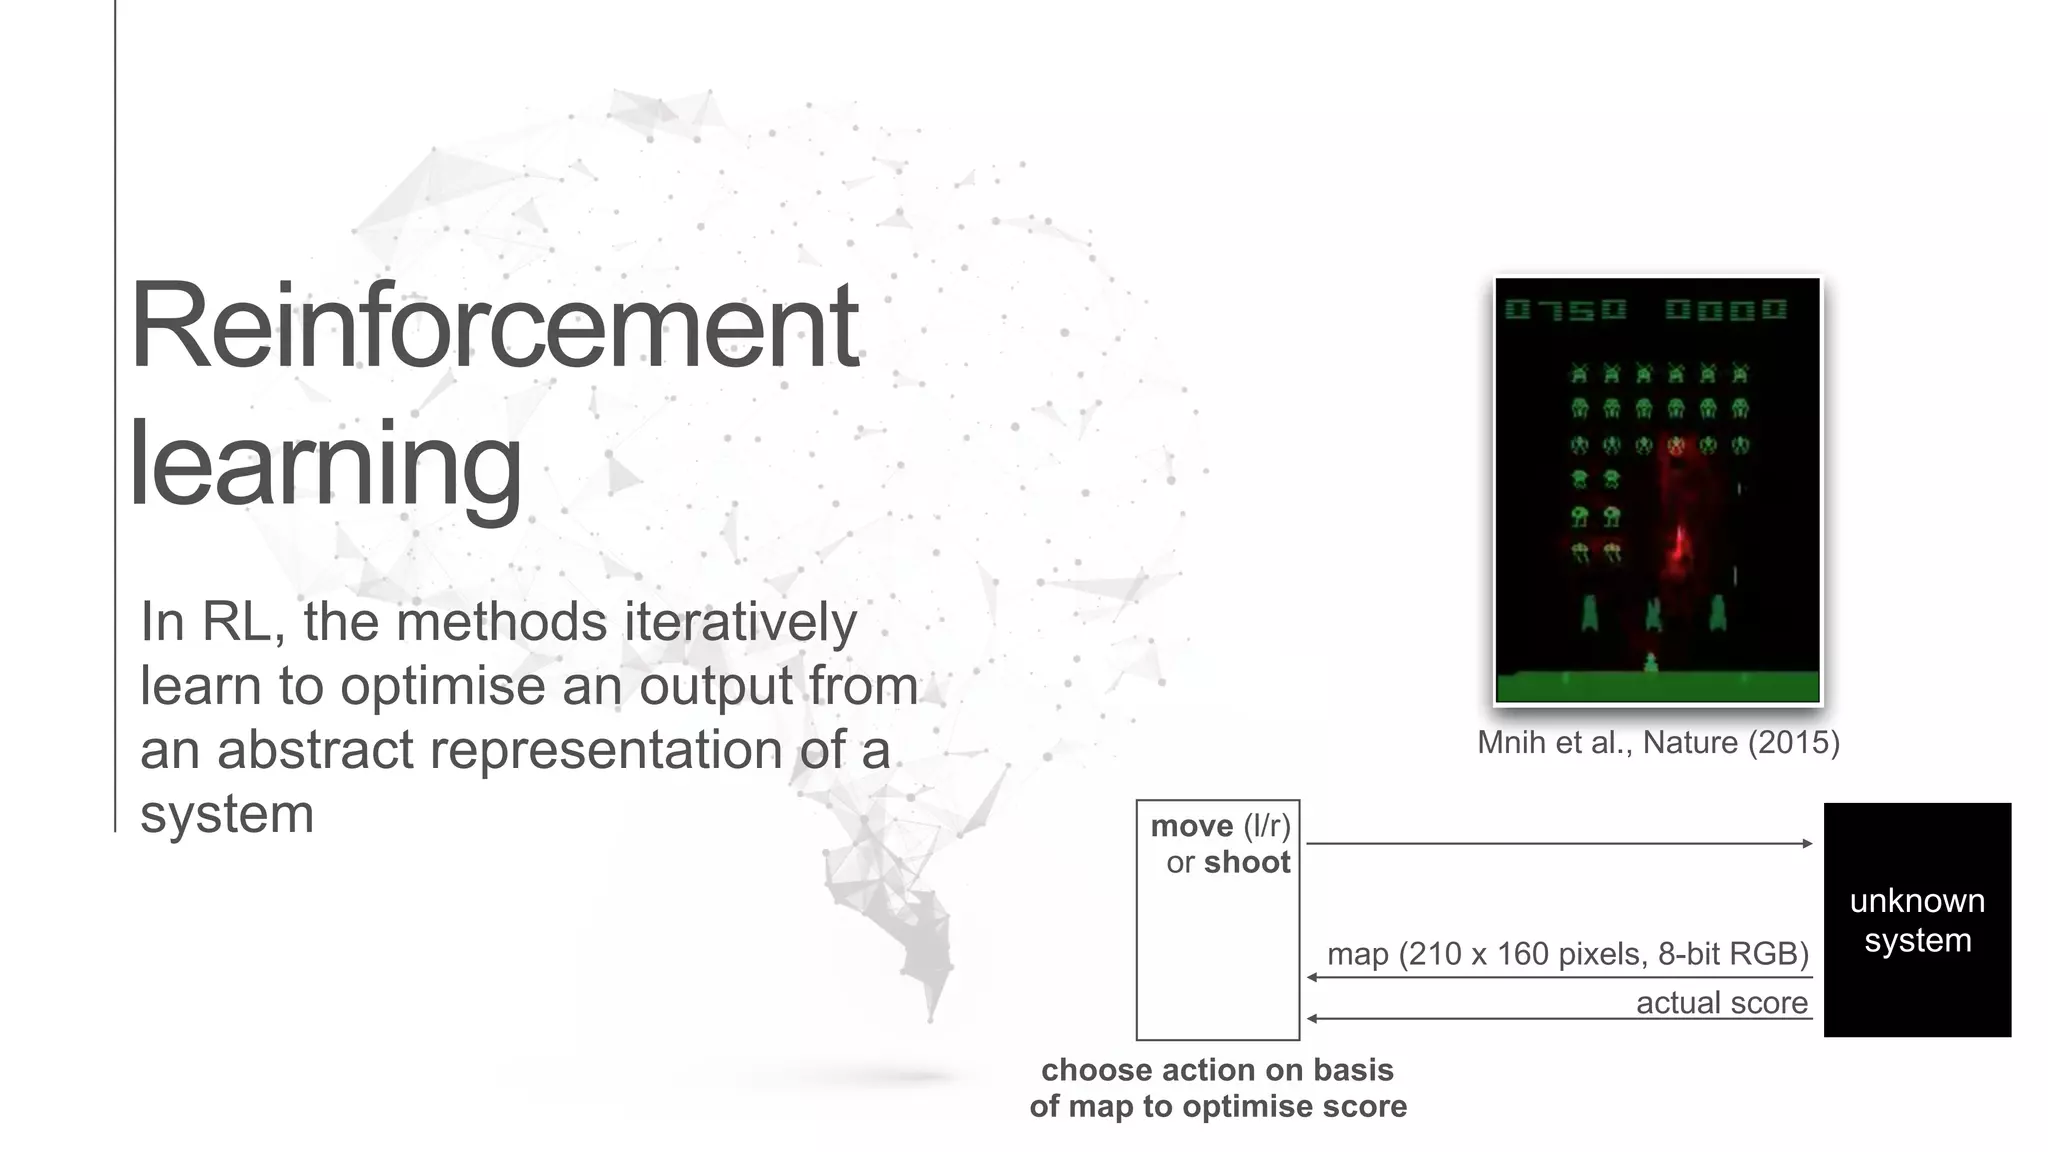
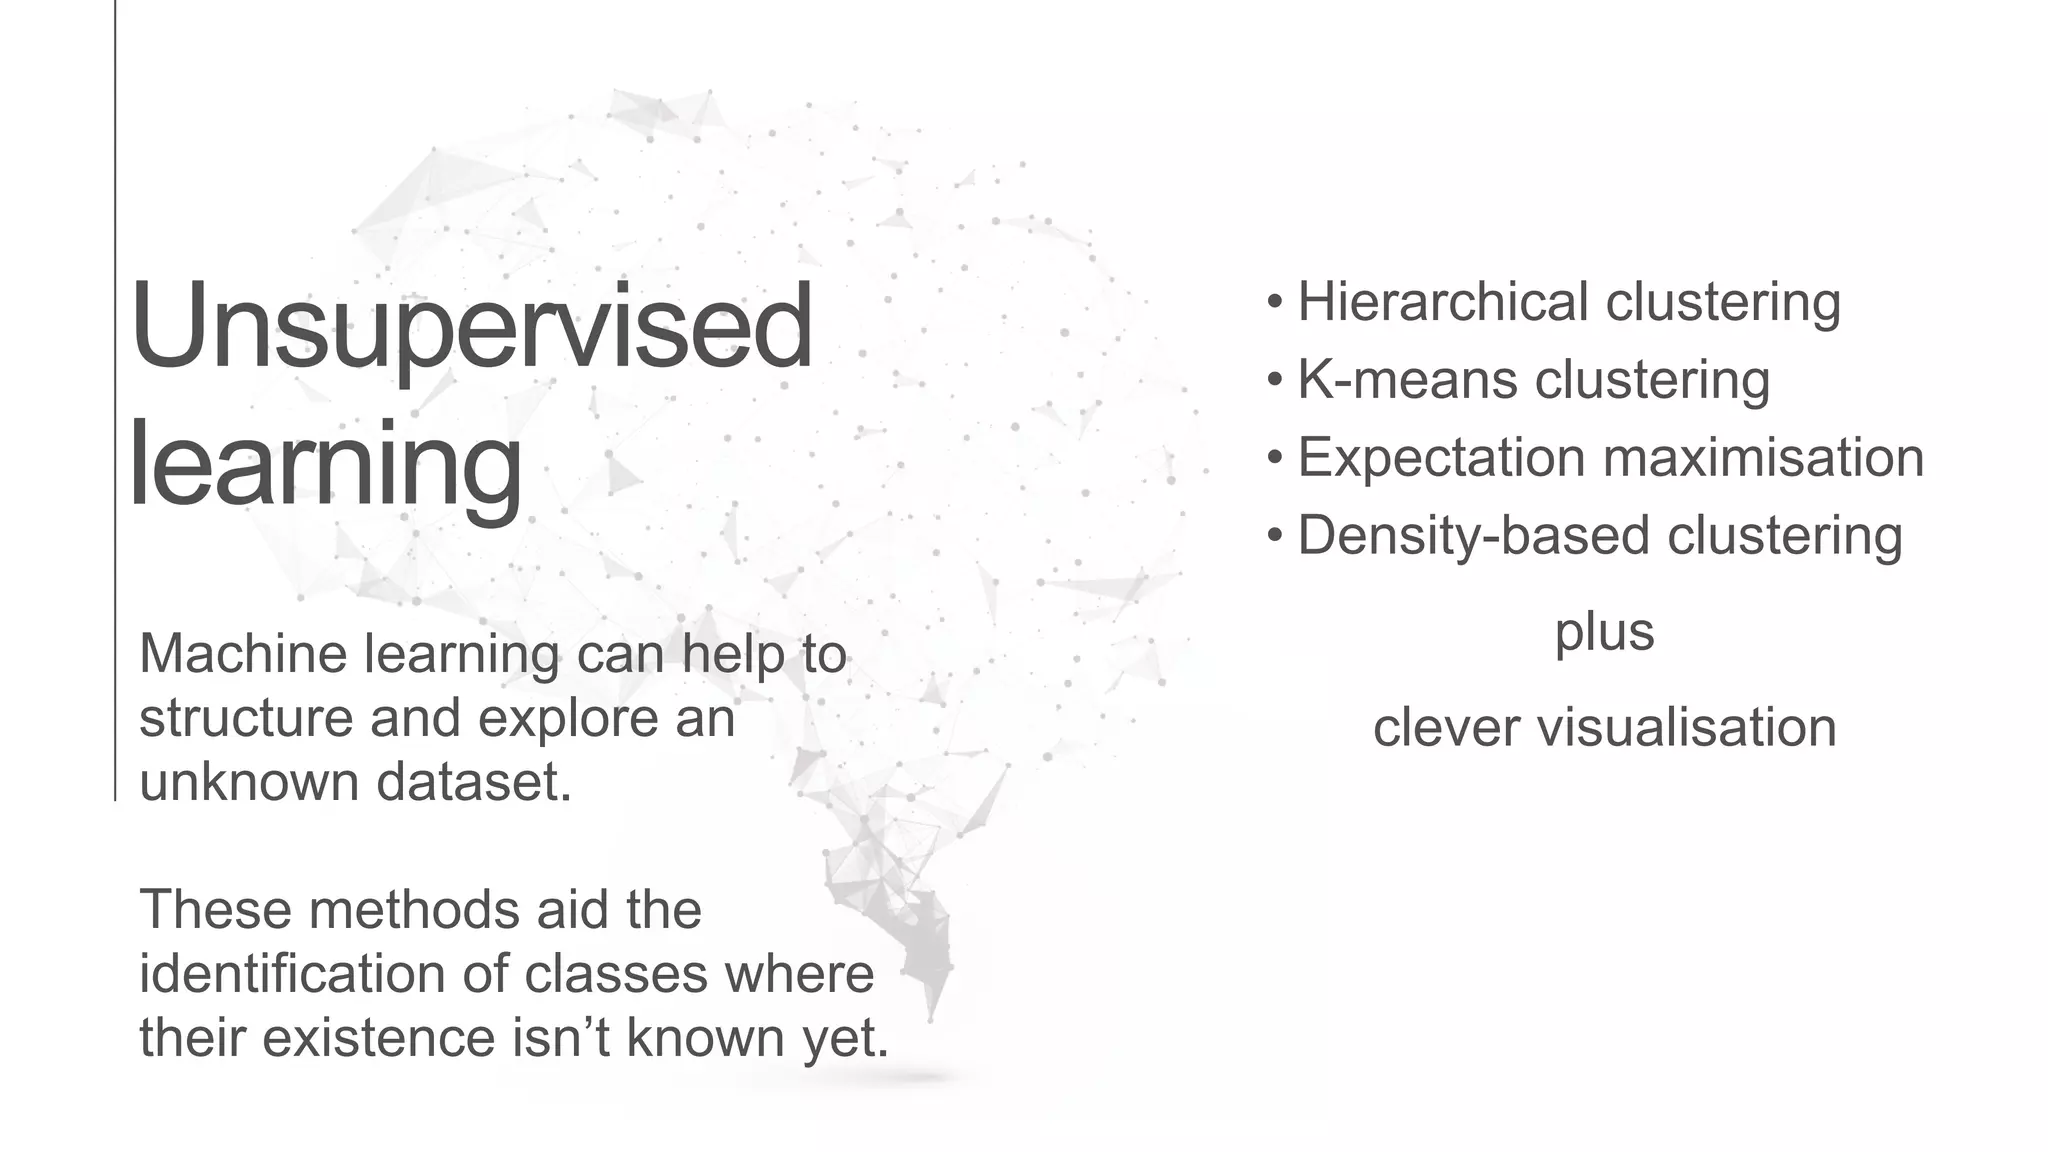
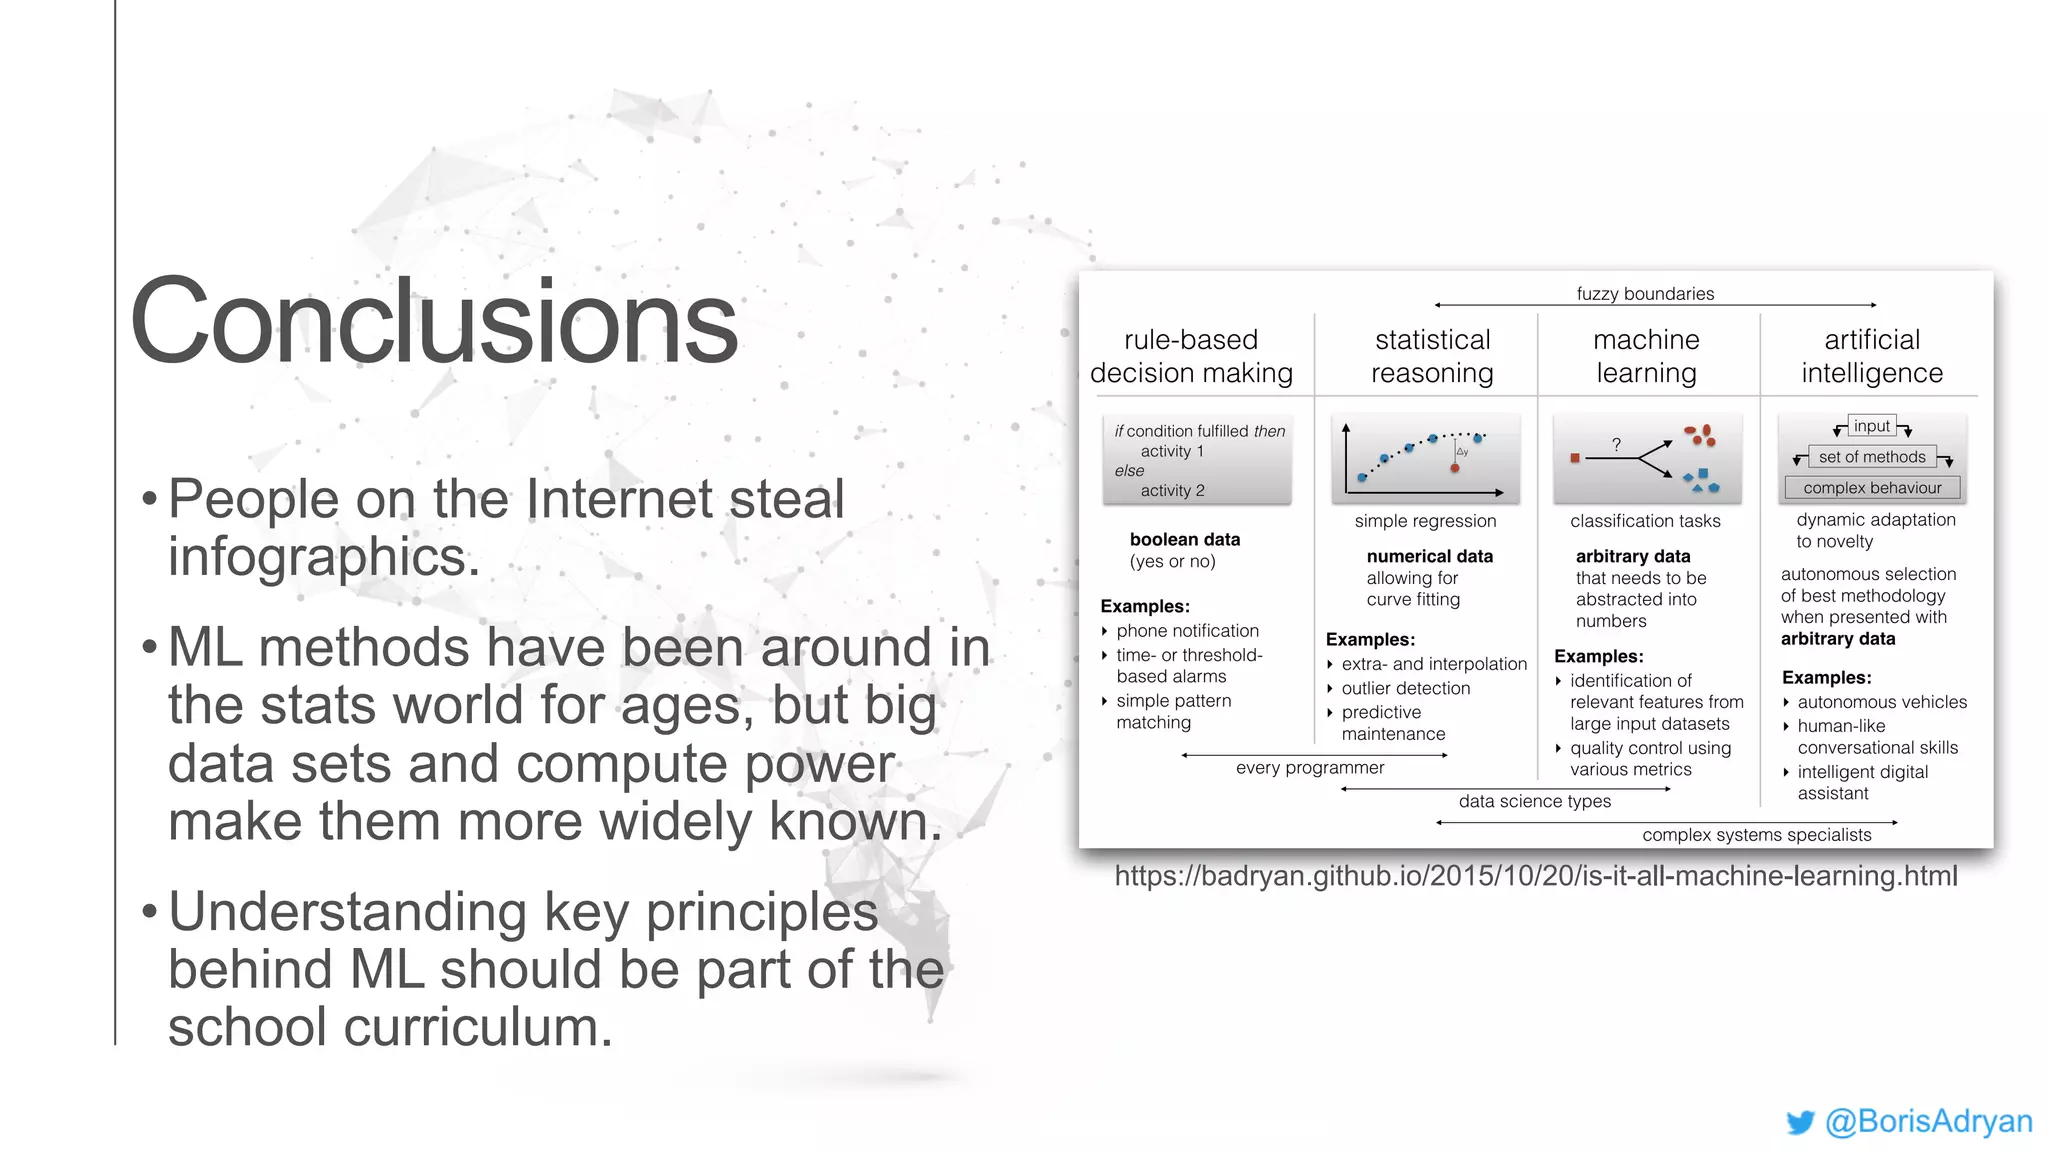

The document presents an introduction to computational decision making and machine learning, focusing on basic vocabulary and fundamental concepts. It distinguishes between machine learning and traditional rule-based decision making, explaining various learning methods such as linear regression, classification tasks, decision trees, and neural networks. Additionally, it emphasizes the importance of performance metrics in evaluating machine learning models and the relevance of machine learning principles in educational curricula.


