Download to read offline

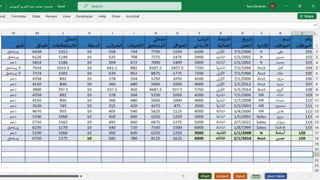
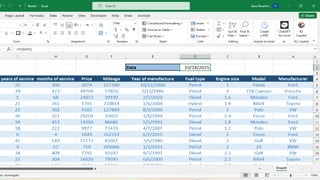
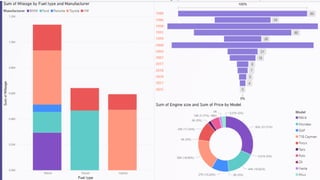
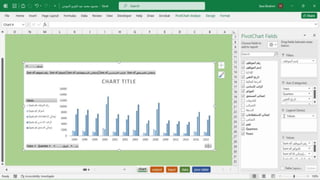
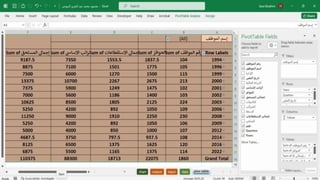

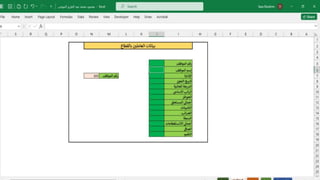
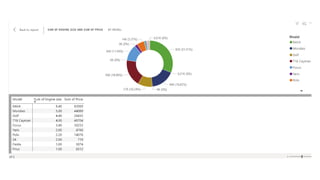
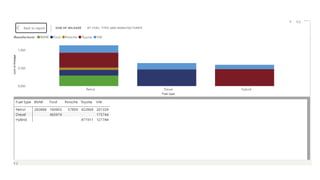
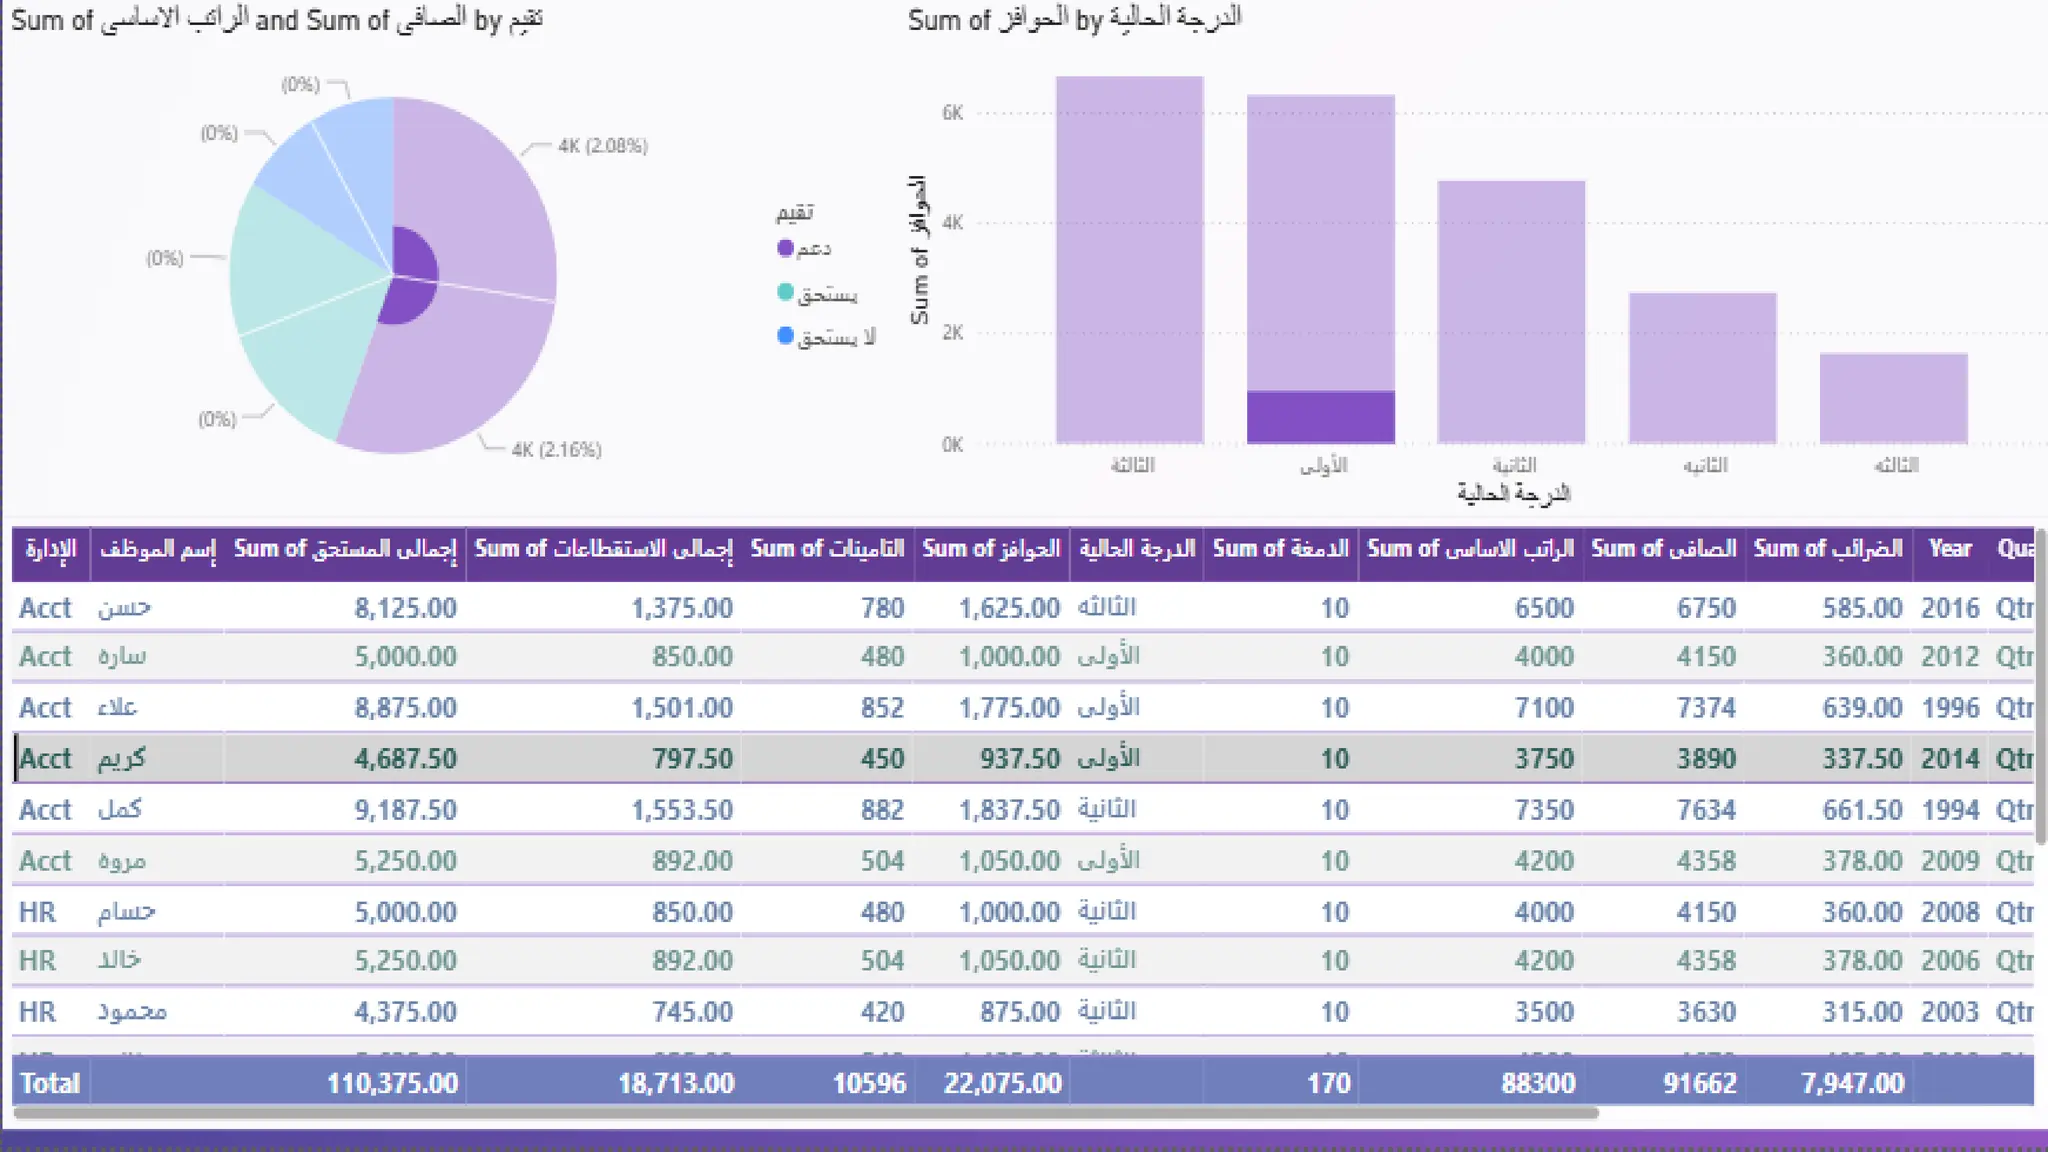
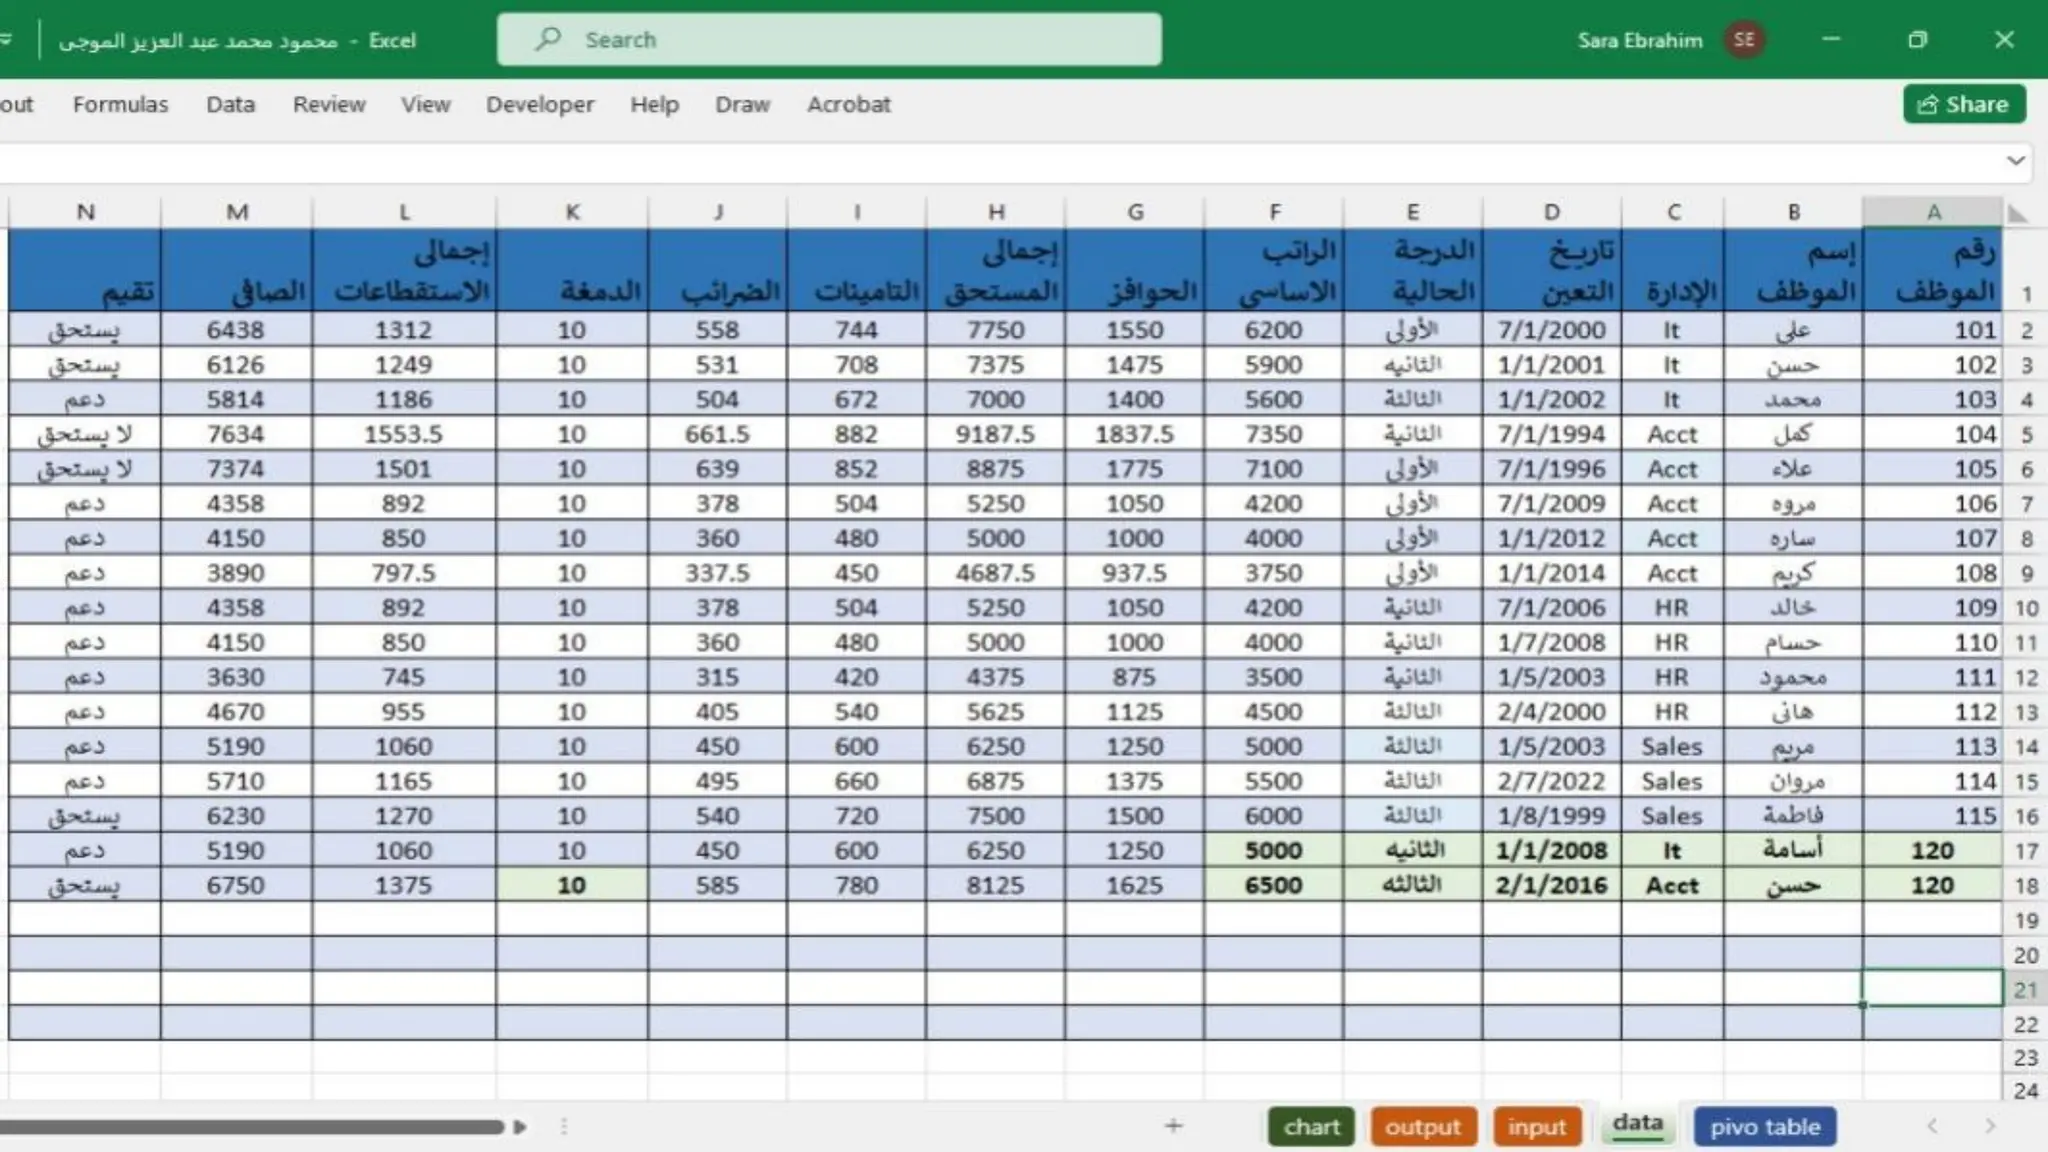
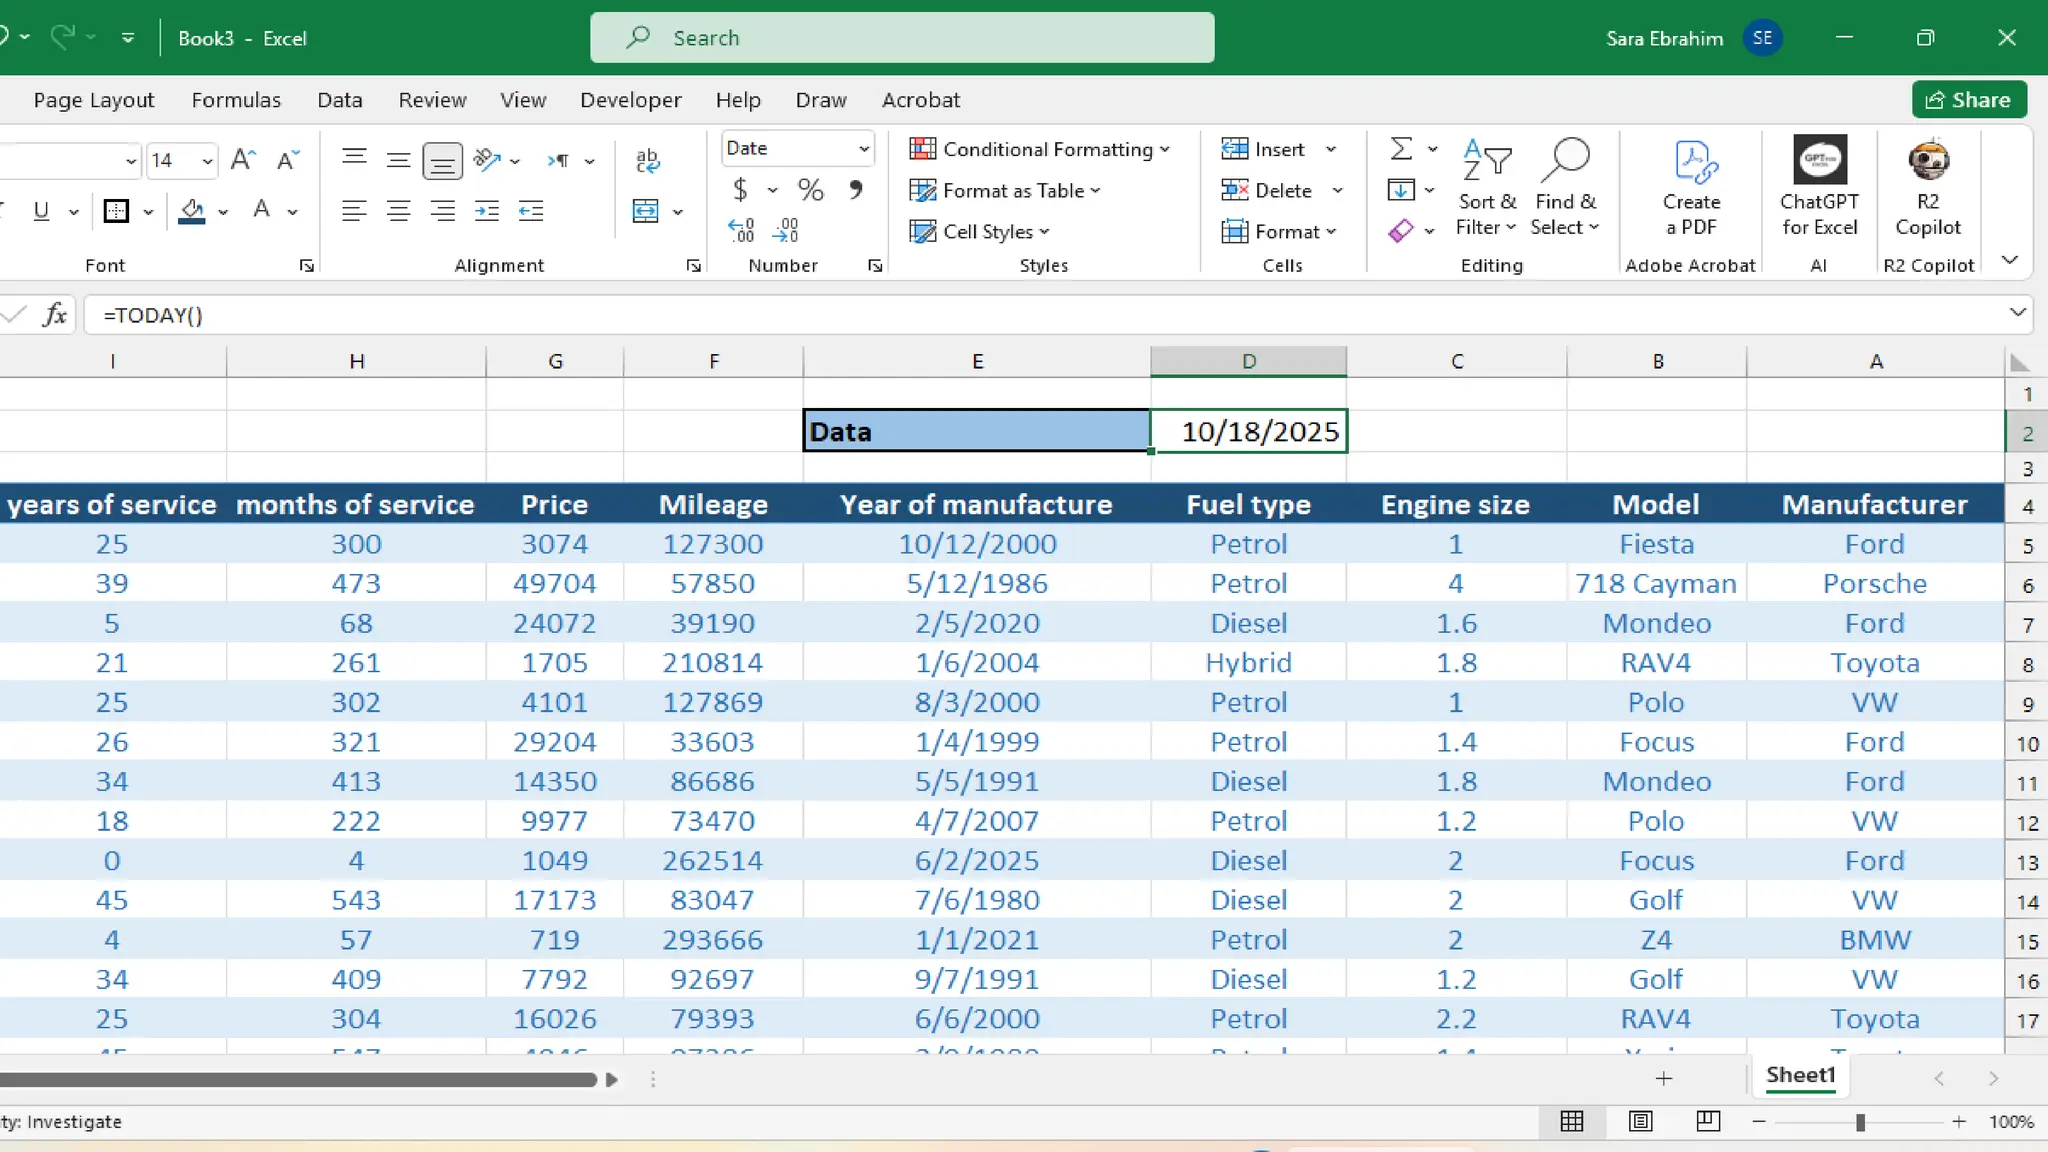
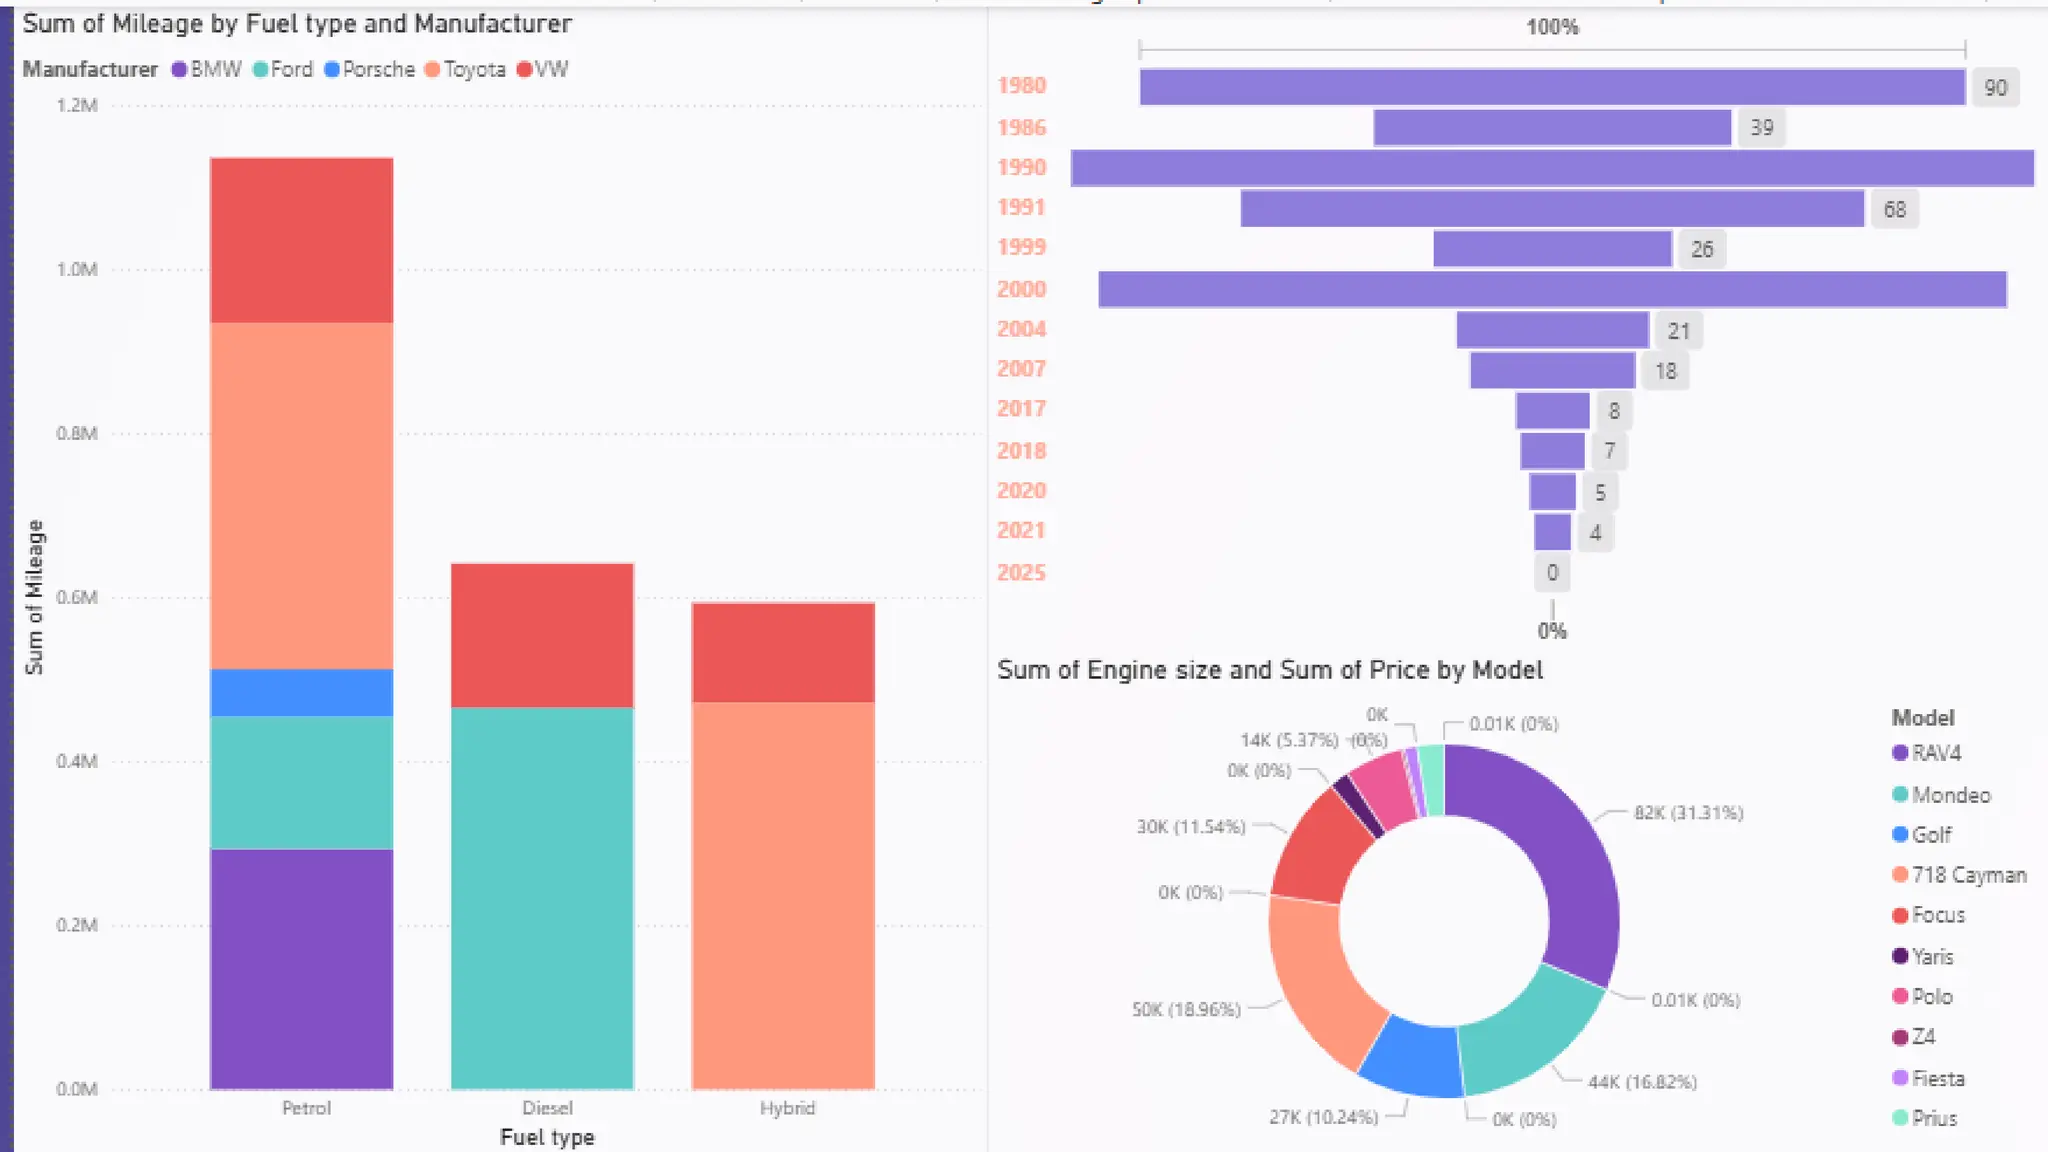

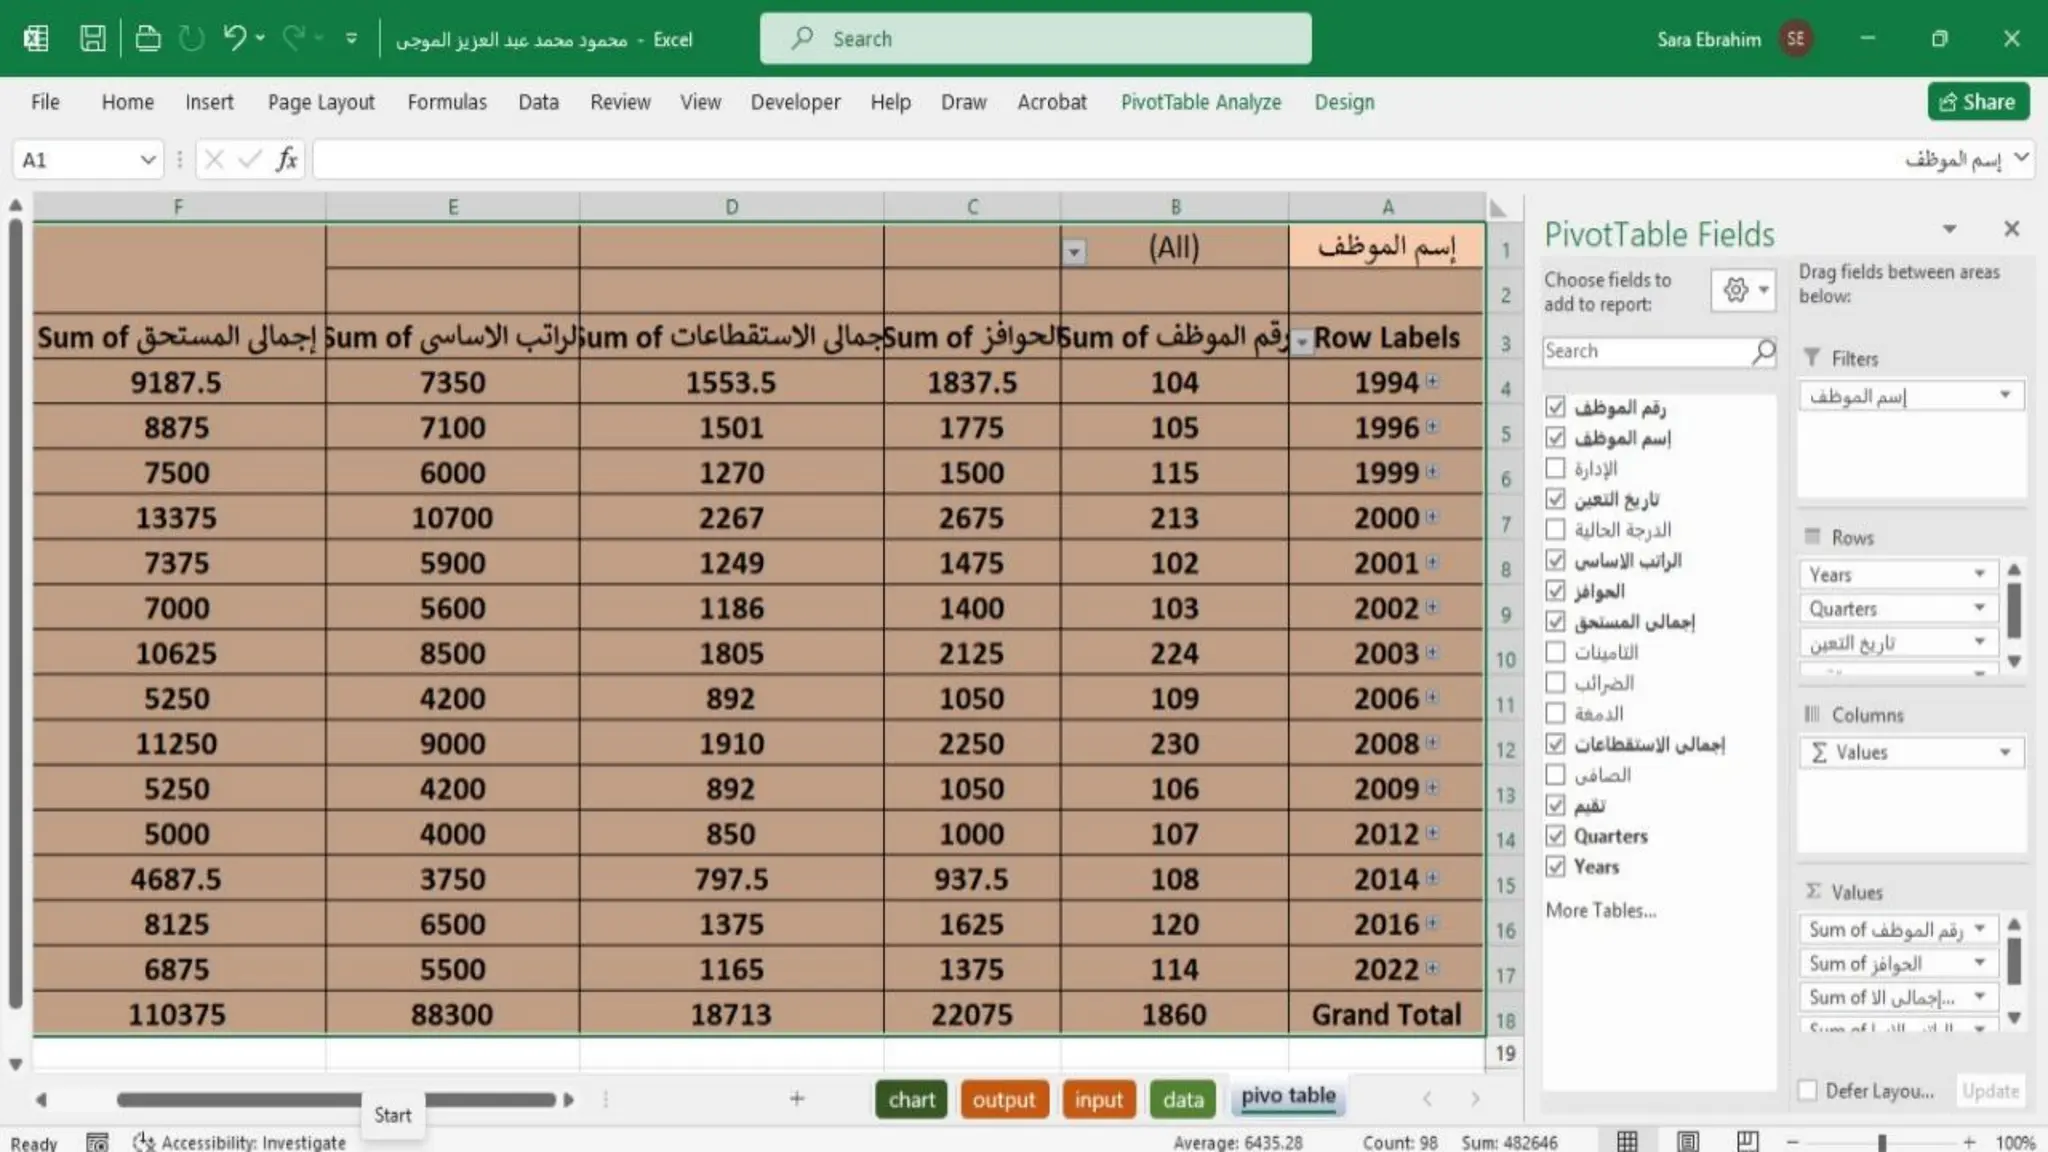
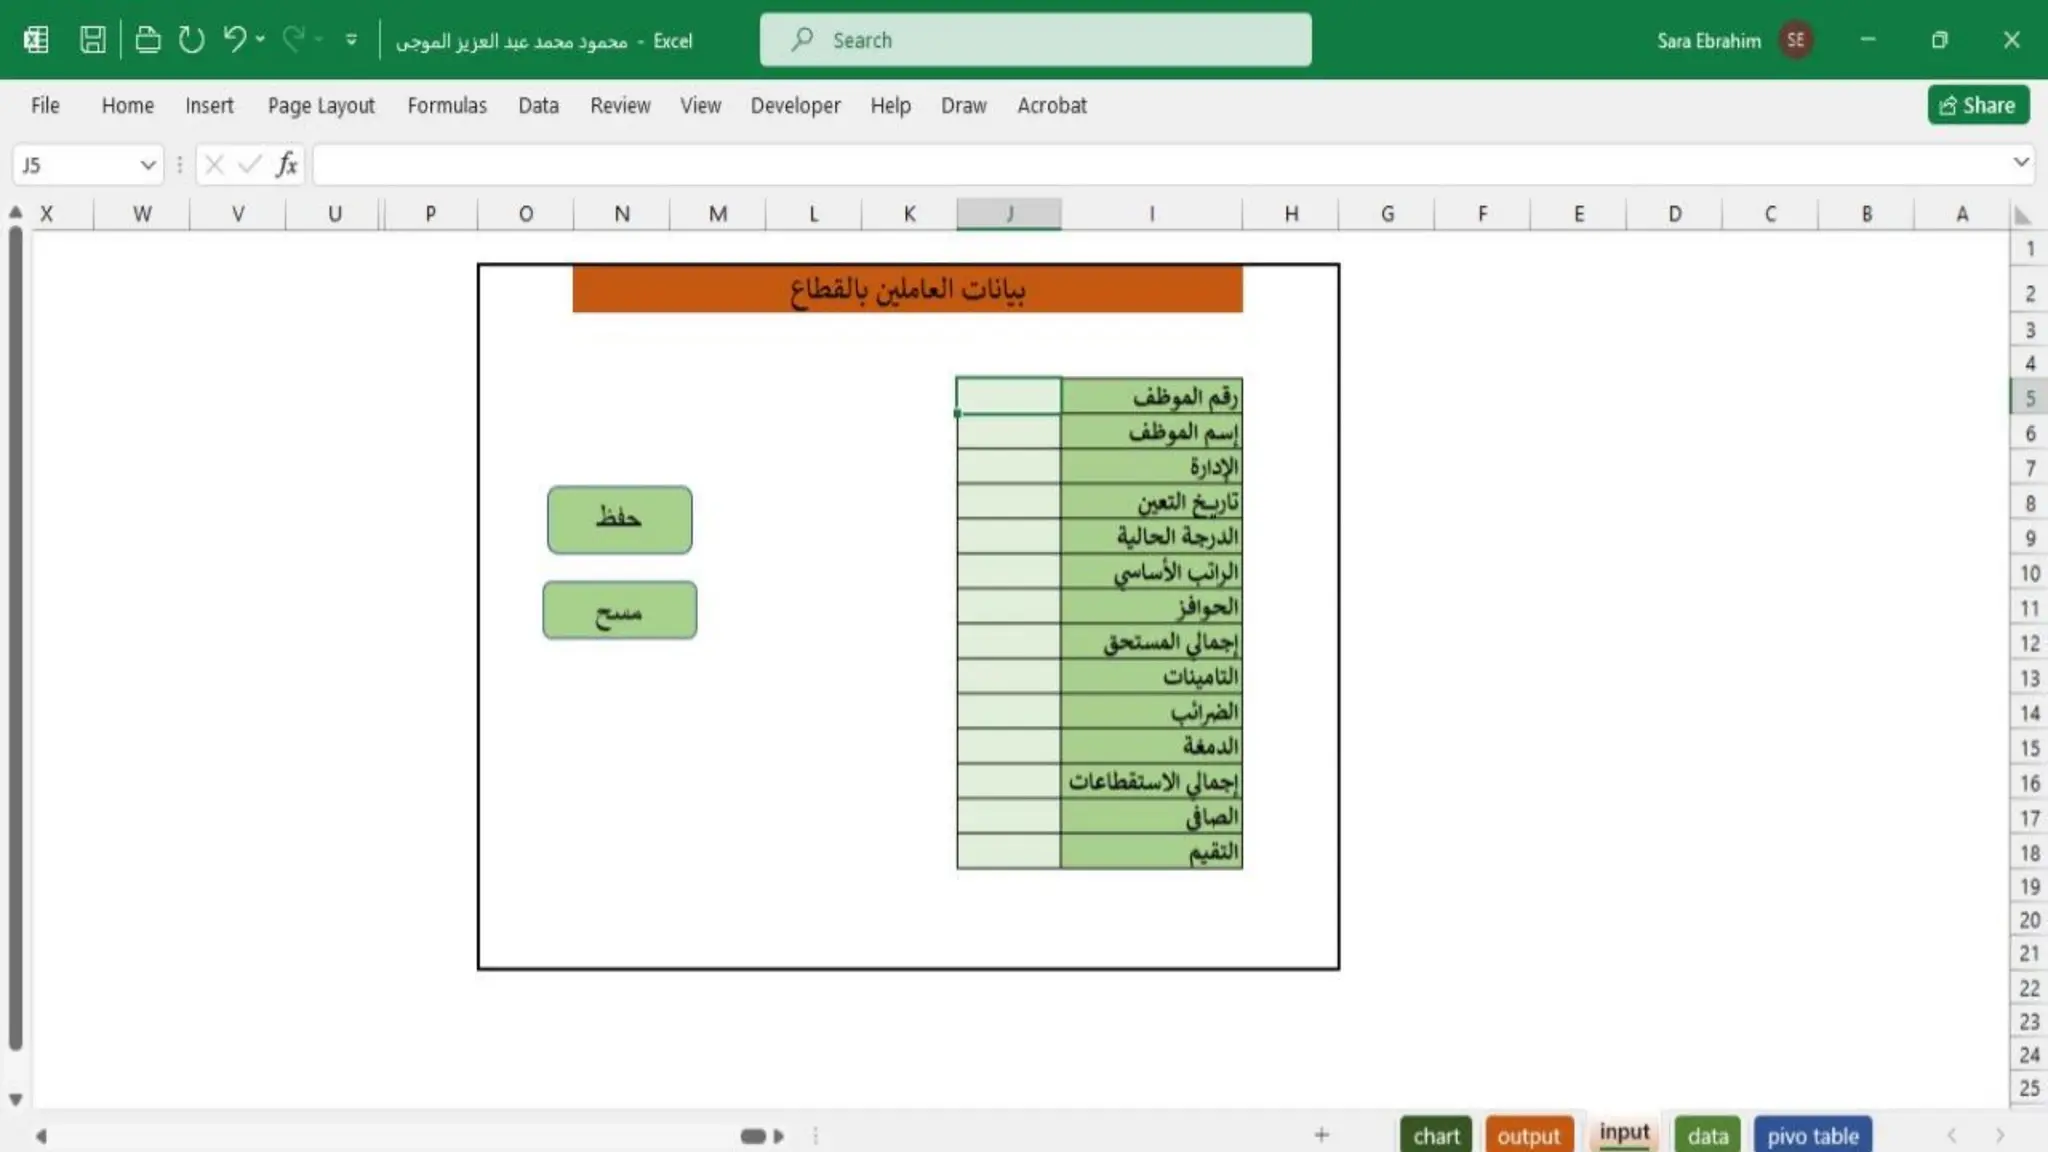
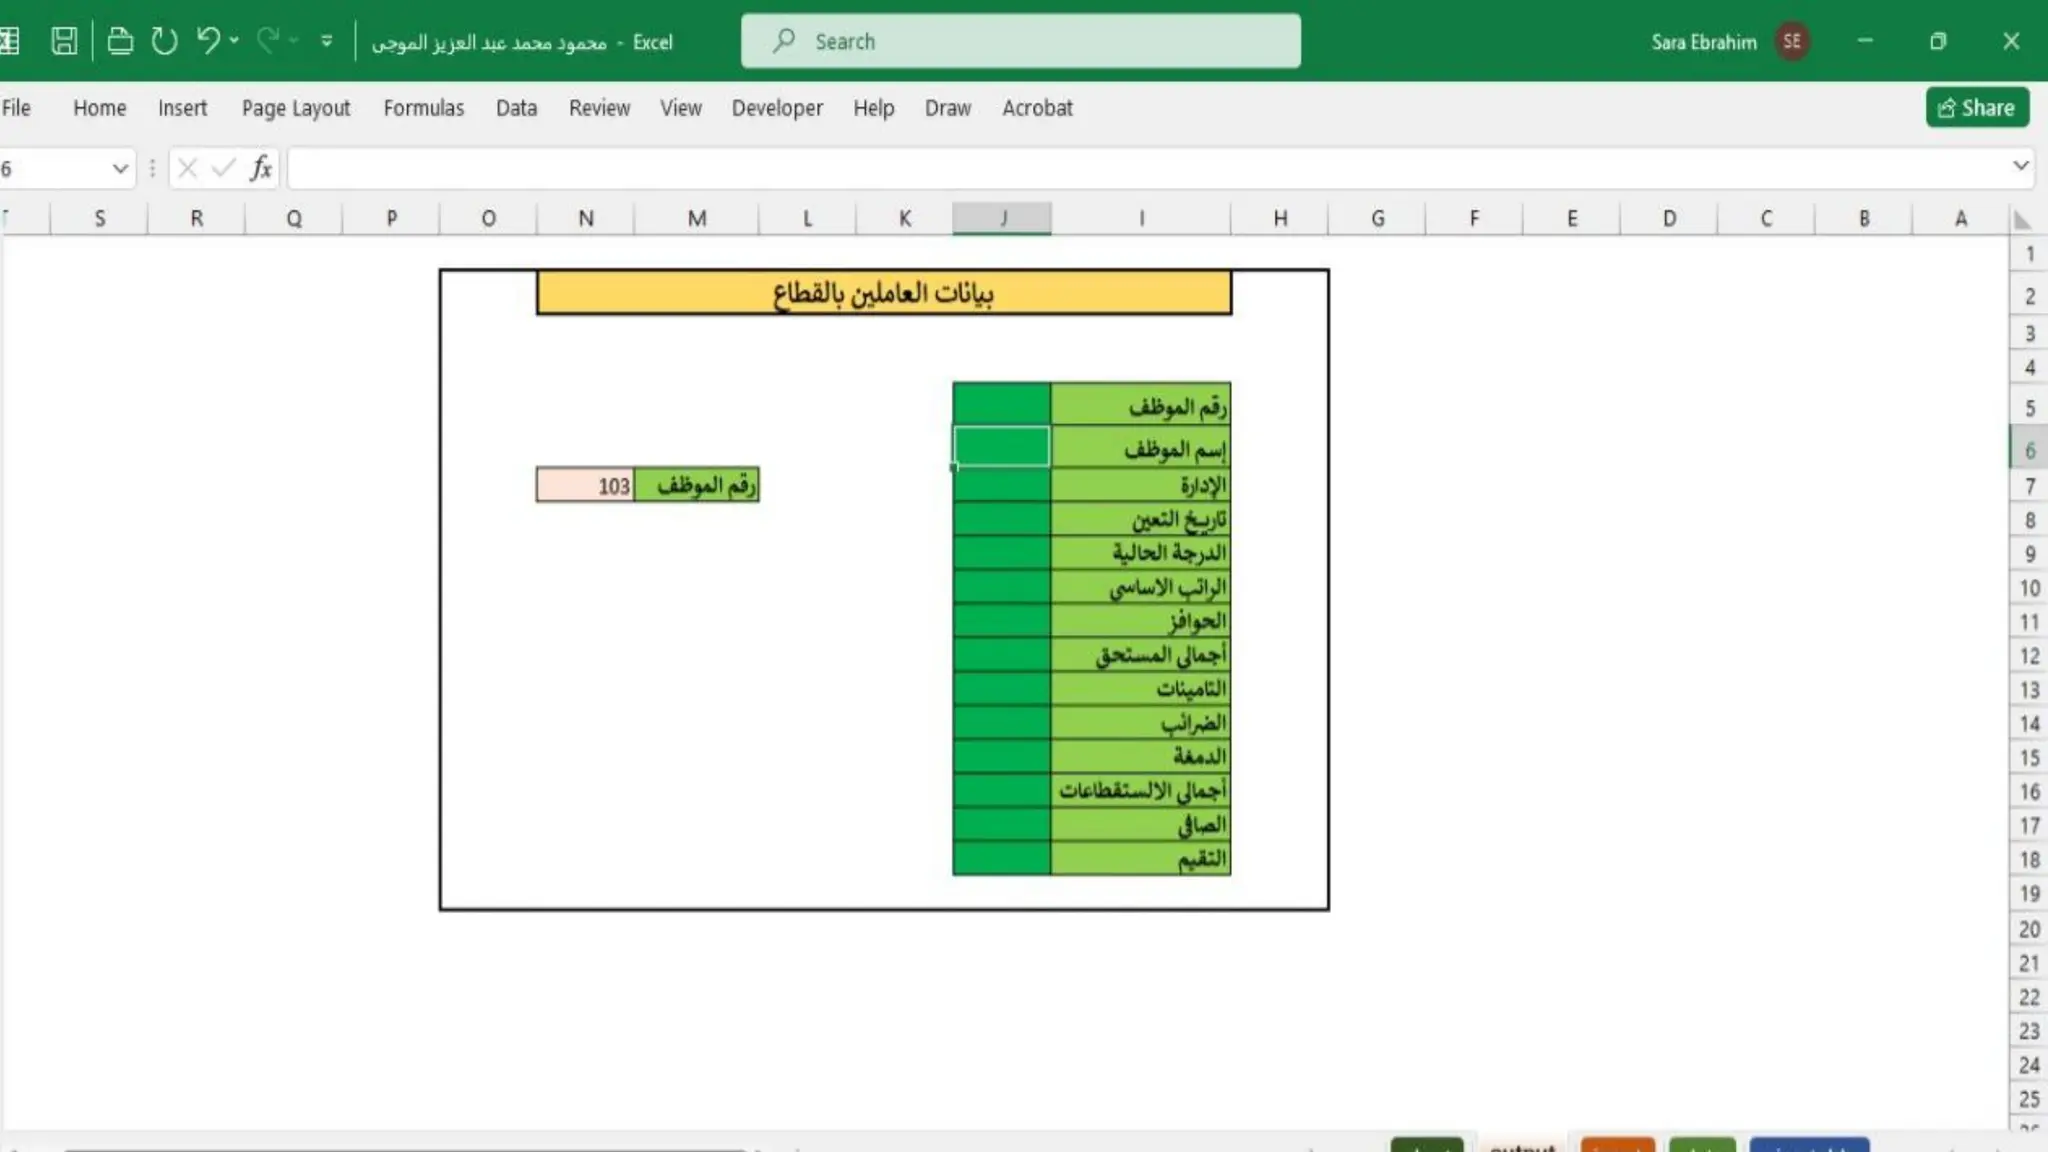
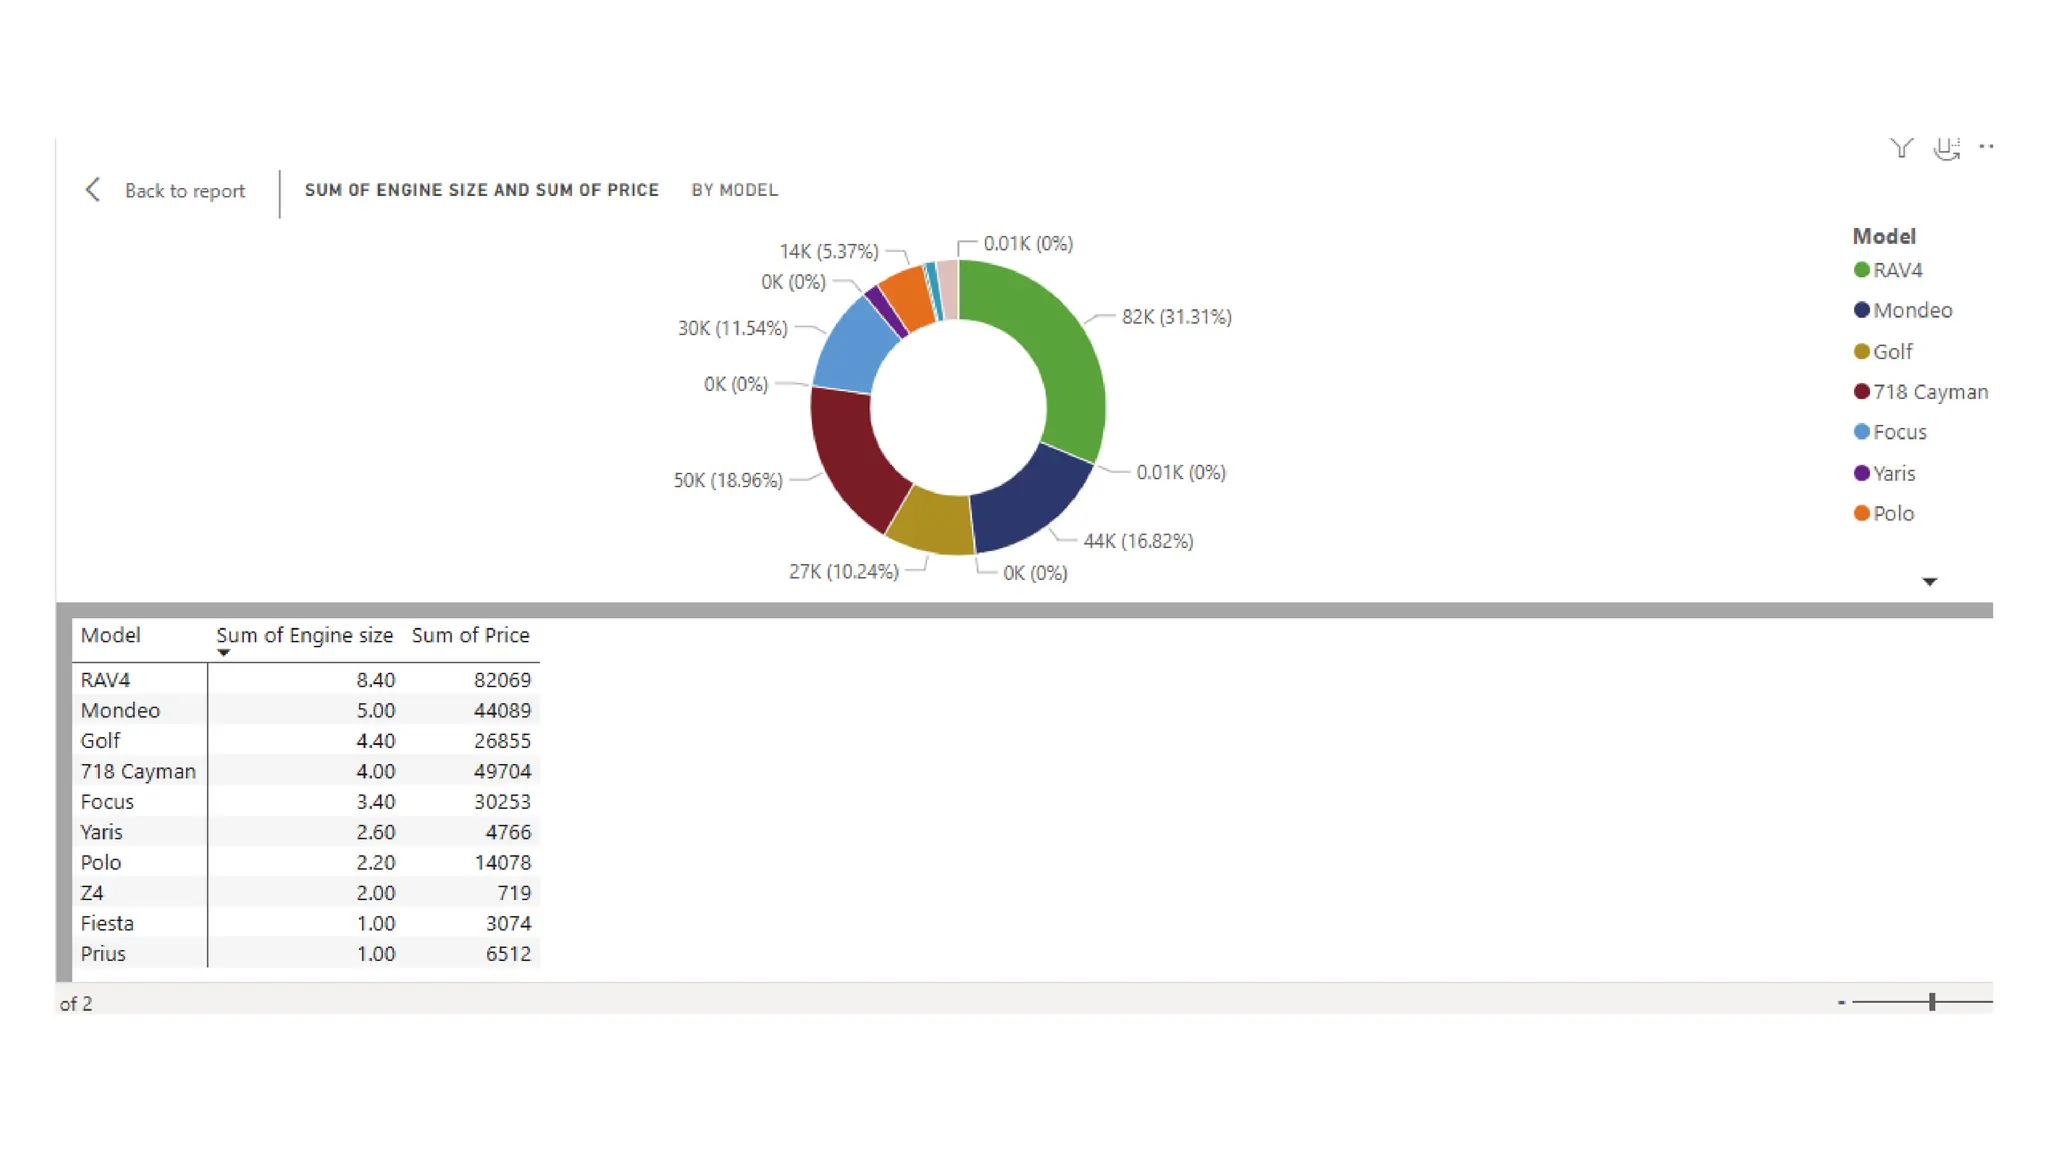
This presentation is a comprehensive guide to building professional dashboards using Excel and Power BI. It walks you through the complete process of transforming raw data into clear, interactive, and visually appealing reports. Starting with data cleaning and preparation, it demonstrates how to apply advanced Excel formulas, pivot tables, and charts, then moves into Power BI to create dynamic dashboards that bring insights to life. The content is designed for analysts, consultants, and business professionals who want to make smarter decisions through data-driven strategies. Whether you are a beginner exploring data visualization or an experienced professional looking to refine your skills, this resource provides practical examples, step-by-step methods, and best practices that can be applied in real business scenarios.


