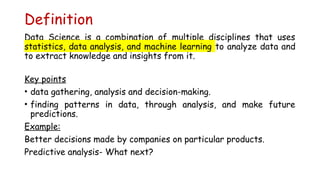
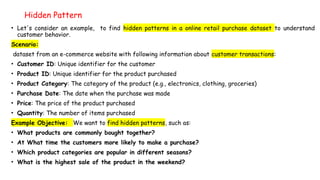
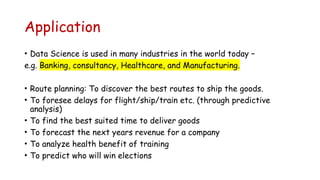
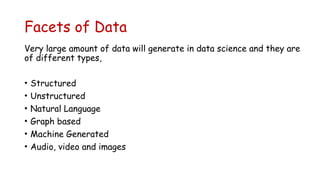
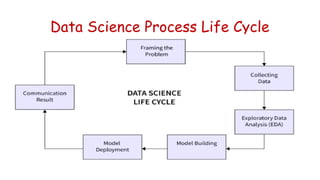
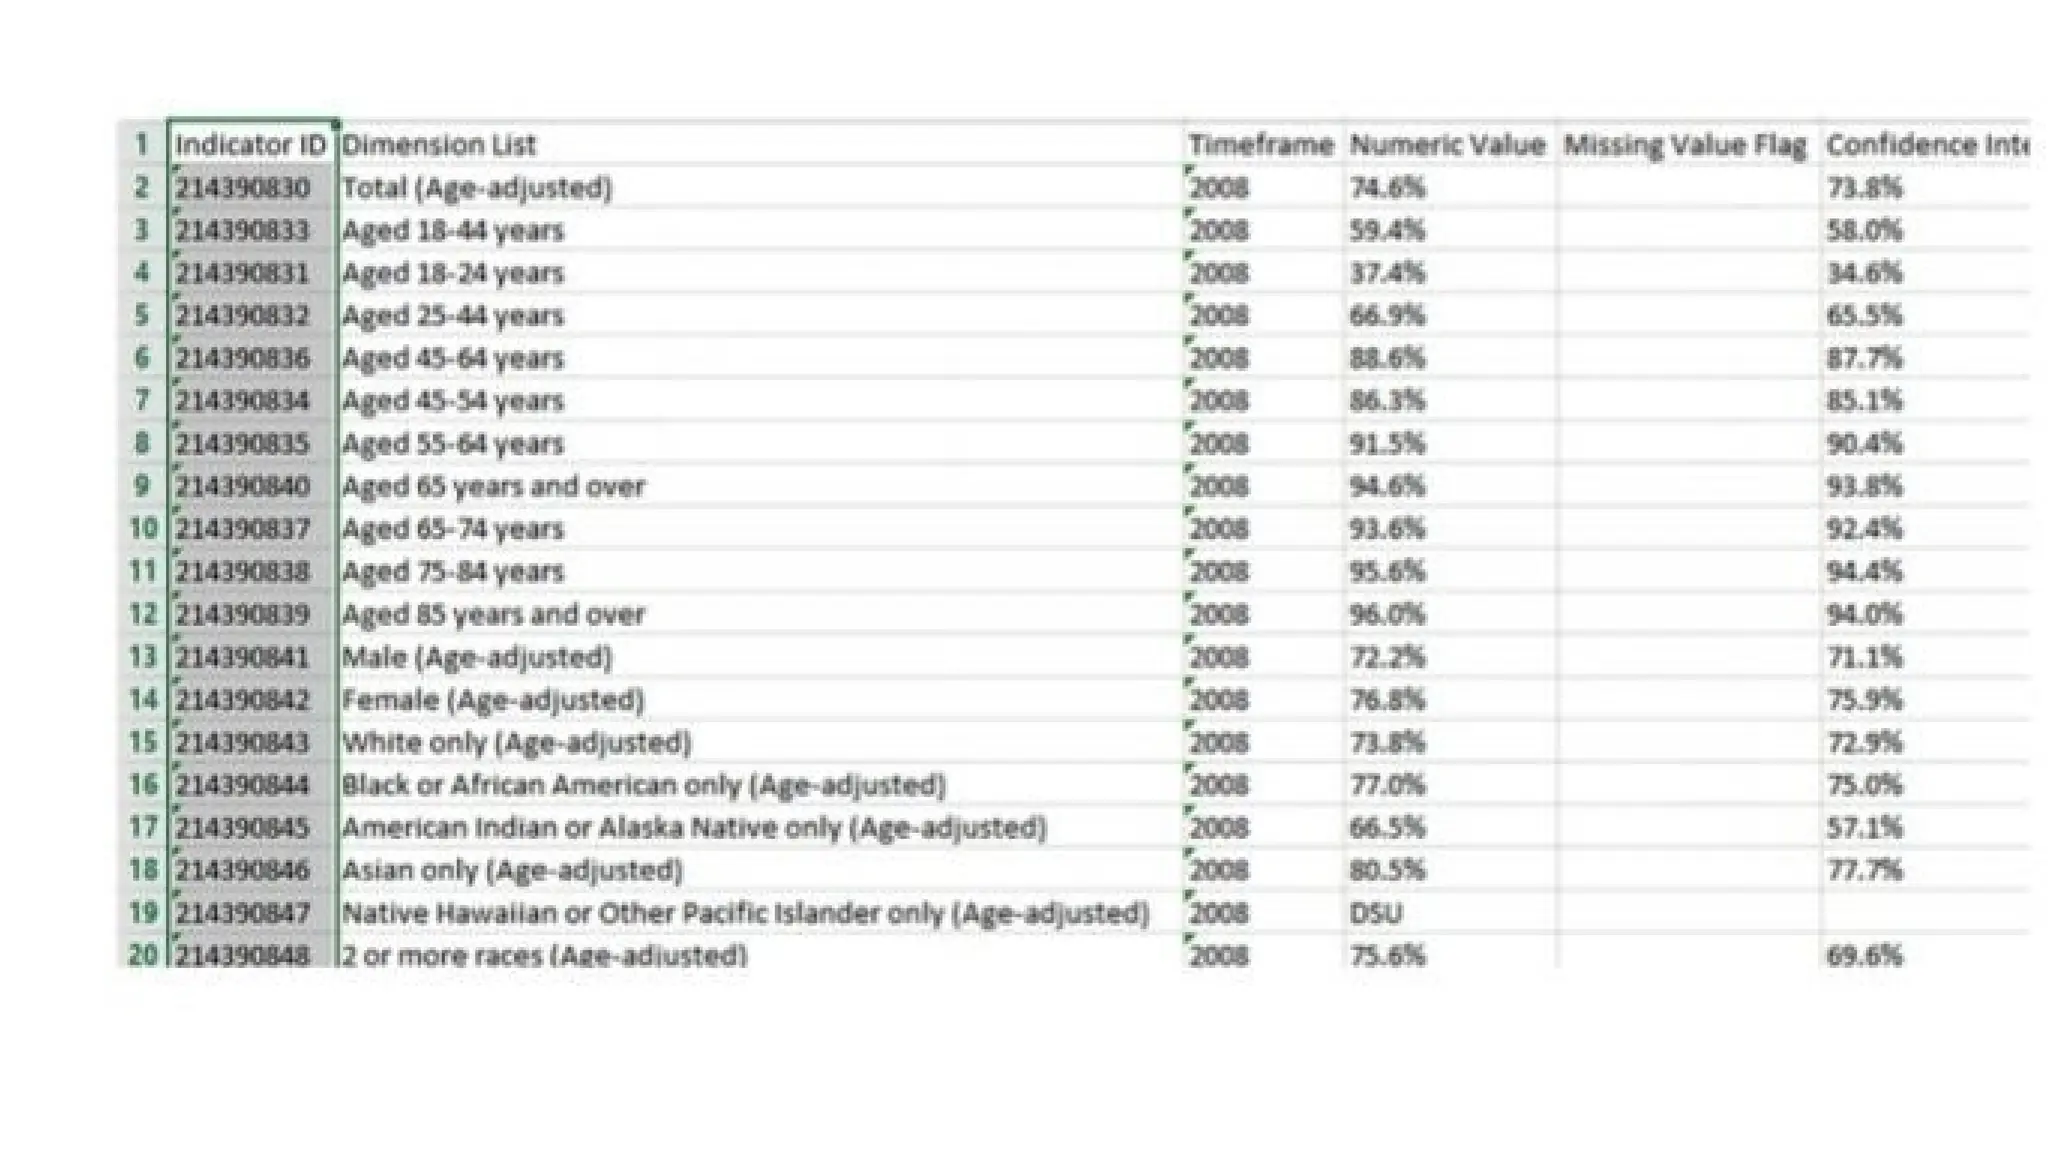
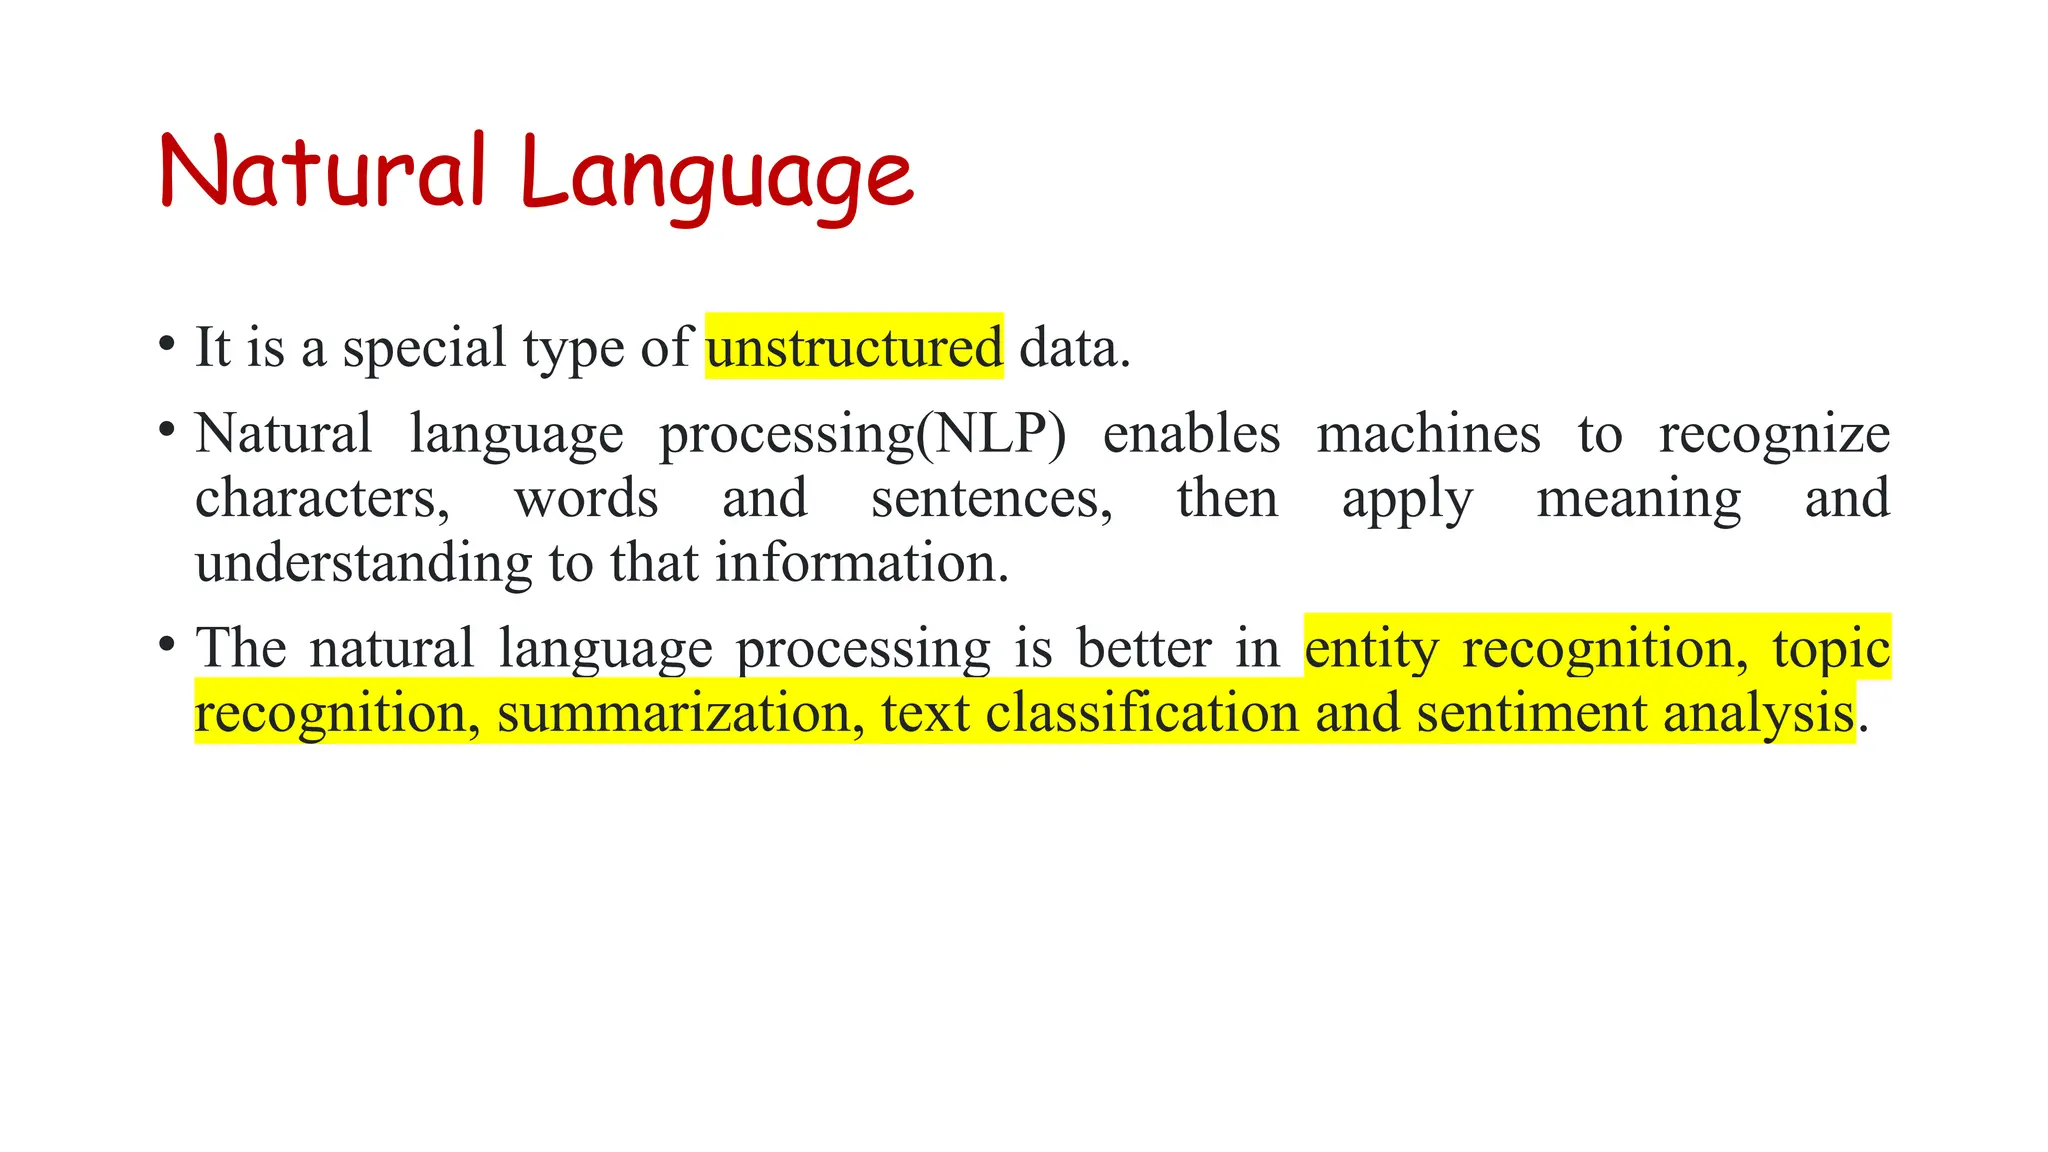
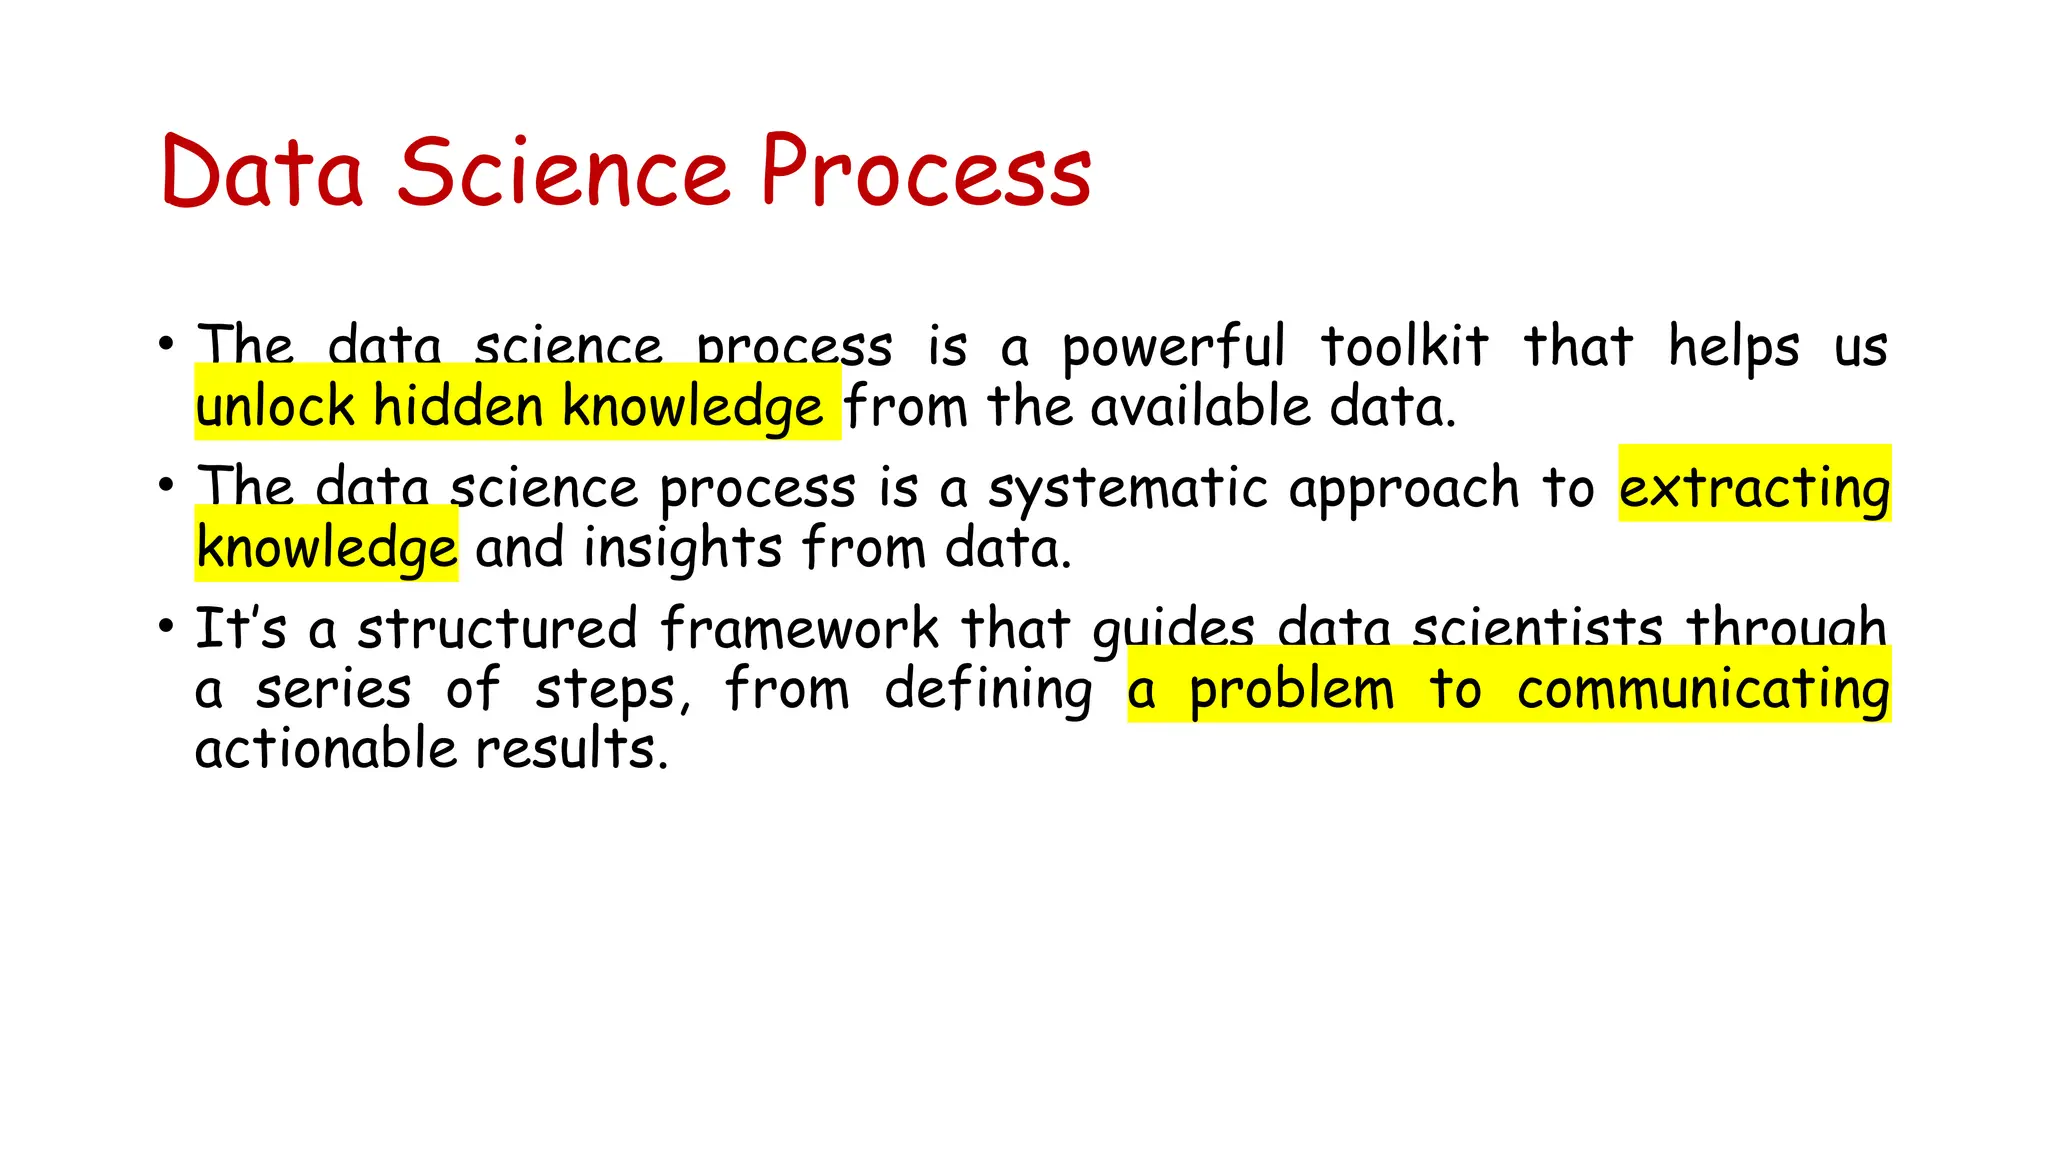
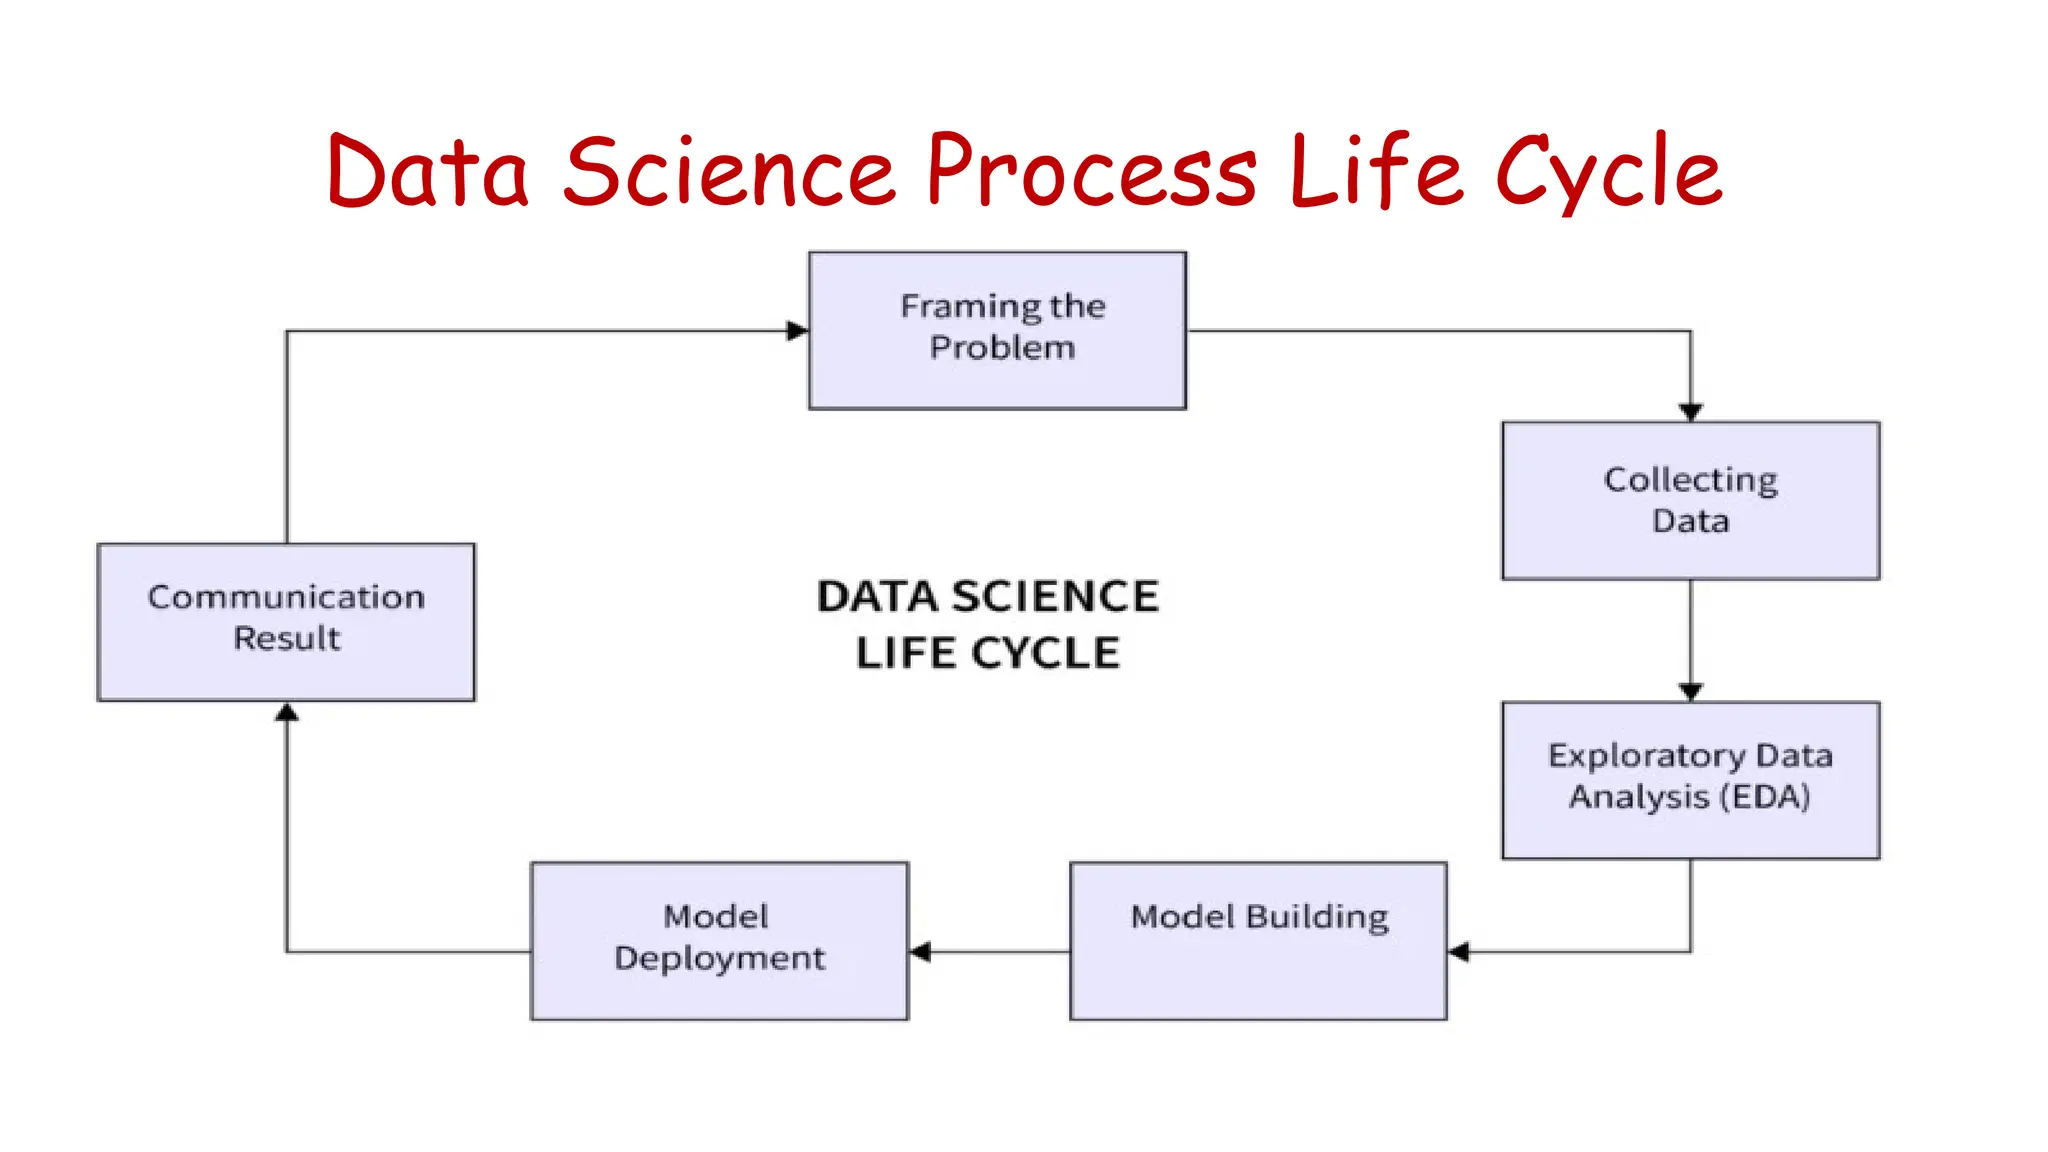
KEMBAR78
Data Science Introduction to Data Science | PPTX
Introduction to Data Science
Prepared by
Dr.G.DEENA
AP/CSE
SRMIST
Definition
Data Science is a combination of multiple disciplines that uses
statistics, data analysis, and machine learning to analyze data and
to extract knowledge and insights from it.
Key points
• data gathering, analysis and decision-making.
• finding patterns in data, through analysis, and make future
predictions.
Example:
Better decisions made by companies on particular products.
Predictive analysis- What next?
Hidden Pattern
• Let's consider an example, to find hidden patterns in a online retail purchase dataset to understand
customer behavior.
Scenario:
dataset from an e-commerce website with following information about customer transactions:
• Customer ID: Unique identifier for the customer
• Product ID: Unique identifier for the product purchased
• Product Category: The category of the product (e.g., electronics, clothing, groceries)
• Purchase Date: The date when the purchase was made
• Price: The price of the product purchased
• Quantity: The number of items purchased
Example Objective: We want to find hidden patterns, such as:
• What products are commonly bought together?
• At What time the customers more likely to make a purchase?
• Which product categories are popular in different seasons?
• What is the highest sale of the product in the weekend?
Application
• Data Science is used in many industries in the world today –
e.g. Banking, consultancy, Healthcare, and Manufacturing.
• Route planning: To discover the best routes to ship the goods.
• To foresee delays for flight/ship/train etc. (through predictive
analysis)
• To find the best suited time to deliver goods
• To forecast the next years revenue for a company
• To analyze health benefit of training
• To predict who will win elections
Facets of Data
Very large amount of data will generate in data science and they are
of different types,
• Structured
• Unstructured
• Natural Language
• Graph based
• Machine Generated
• Audio, video and images
Structured Data
• Structured data is arranged in rows and column format.
• structured data refers to data that is identifiable because it is
organized in a structure. The most common form of structured
data or records is a database where specific information is stored
based on a methodology of columns and rows.
• Database management system is used for storing structured data.
(retrieve and process data easily.)
• Structured data is also searchable by data type within content.
• An Excel table is an example of structured data.
Unstructured Data
• Unstructured data is data that does not follow a specified format. Row
and columns are not used for unstructured data. Therefore, it is
difficult to retrieve information. It has no identifiable structure.
• It does not follow any template/rules. Hence it is unpredictable in
nature.
• Most of the companies use unstructured data format.
• Eg- word documents, email messages, customer feedbacks, audio,
video, images, email.
Natural Language
• It is a special type of unstructured data.
• Natural language processing(NLP) enables machines to recognize
characters, words and sentences, then apply meaning and
understanding to that information.
• The natural language processing is better in entity recognition, topic
recognition, summarization, text classification and sentiment analysis.
Data Science Process
• The data science process is a powerful toolkit that helps us
unlock hidden knowledge from the available data.
• The data science process is a systematic approach to extracting
knowledge and insights from data.
• It’s a structured framework that guides data scientists through
a series of steps, from defining a problem to communicating
actionable results.
Data Science Process Life Cycle
Framing the Problem
• The process begins with a clear understanding of the problem or
question.
• This process define the project’s objectives and goals.
• A well-defined problem statement acts as a compass, guiding the
entire data science process and ensure the desired outcomes.
Data Collection
• Once the problem clearly defined, its important to collect
the data in data science.
• This involves identifying relevant data sources, whether
internal databases, external APIs, or publicly available
datasets.
• Data scientists must carefully consider the types of data
needed.
Data Cleaning
• Raw data is often messy, with errors, missing values, and
inconsistencies
• This involves removing duplicates, filling in missing values, and
transforming data into a format suitable for further exploration.
• The data cleaning phase is all about removing unwanted and fill
the values as well ensure the data is accurate, complete, and
ready for analysis
Exploratory Data Analysis (EDA)
• EDA is the detective work of data science.
• It’s about to uncover hidden patterns, trends, and anomalies.
• Data scientists use a variety of techniques, including summary
statistics, visualizations, and interactive tools, to gain a deeper
understanding of the data’s characteristics and their
relationships.
• This stage is crucial for identifying potential way for further
investigation.
Model Building
• In this phase, data scientists build models that can predict
future outcomes or classify data into different categories.
• These models are often based on machine learning
algorithms or statistical techniques.
• The choice of model depends on the problem at hand and the
nature of the data.
• Once the model is chosen, it’s trained on the prepared data
to learn patterns and relationships.
Model Deployment
• Once a model is trained and validated, it’s time to put it to work.
• Model deployment involves integrating the model into a
production environment, where it can be used to make
predictions or inform decision-making.
Communicating Results
• The final stage of the data science process involves
communicating the findings and insights to stakeholders.
• This includes creating clear and concise reports, presentations,
and visualizations that effectively convey the results and their
implications.
• The goal is to ensure that stakeholders understand the analysis,
trust the conclusions, and can use the insights to make decisions.
Introduction to NumPy
• NumPy is a Python library used for working with array.
• NumPy stands for Numerical Python.
• It is the fundamental package for mathematical and logical
operations on array.
• Array is homogeneous collection of data.
• The values can be number, characters, Booleans.
• It can be install in Jupyter notebook as pip install numpy

Data Science Introduction to Data Science

  • 1.
    Introduction to DataScience Prepared by Dr.G.DEENA AP/CSE SRMIST
  • 2.
    Definition Data Science isa combination of multiple disciplines that uses statistics, data analysis, and machine learning to analyze data and to extract knowledge and insights from it. Key points • data gathering, analysis and decision-making. • finding patterns in data, through analysis, and make future predictions. Example: Better decisions made by companies on particular products. Predictive analysis- What next?
  • 3.
    Hidden Pattern • Let'sconsider an example, to find hidden patterns in a online retail purchase dataset to understand customer behavior. Scenario: dataset from an e-commerce website with following information about customer transactions: • Customer ID: Unique identifier for the customer • Product ID: Unique identifier for the product purchased • Product Category: The category of the product (e.g., electronics, clothing, groceries) • Purchase Date: The date when the purchase was made • Price: The price of the product purchased • Quantity: The number of items purchased Example Objective: We want to find hidden patterns, such as: • What products are commonly bought together? • At What time the customers more likely to make a purchase? • Which product categories are popular in different seasons? • What is the highest sale of the product in the weekend?
  • 4.
    Application • Data Scienceis used in many industries in the world today – e.g. Banking, consultancy, Healthcare, and Manufacturing. • Route planning: To discover the best routes to ship the goods. • To foresee delays for flight/ship/train etc. (through predictive analysis) • To find the best suited time to deliver goods • To forecast the next years revenue for a company • To analyze health benefit of training • To predict who will win elections
  • 5.
    Facets of Data Verylarge amount of data will generate in data science and they are of different types, • Structured • Unstructured • Natural Language • Graph based • Machine Generated • Audio, video and images
  • 6.
    Structured Data • Structureddata is arranged in rows and column format. • structured data refers to data that is identifiable because it is organized in a structure. The most common form of structured data or records is a database where specific information is stored based on a methodology of columns and rows. • Database management system is used for storing structured data. (retrieve and process data easily.) • Structured data is also searchable by data type within content. • An Excel table is an example of structured data.
  • 8.
    Unstructured Data • Unstructureddata is data that does not follow a specified format. Row and columns are not used for unstructured data. Therefore, it is difficult to retrieve information. It has no identifiable structure. • It does not follow any template/rules. Hence it is unpredictable in nature. • Most of the companies use unstructured data format. • Eg- word documents, email messages, customer feedbacks, audio, video, images, email.
  • 9.
    Natural Language • Itis a special type of unstructured data. • Natural language processing(NLP) enables machines to recognize characters, words and sentences, then apply meaning and understanding to that information. • The natural language processing is better in entity recognition, topic recognition, summarization, text classification and sentiment analysis.
  • 10.
    Data Science Process •The data science process is a powerful toolkit that helps us unlock hidden knowledge from the available data. • The data science process is a systematic approach to extracting knowledge and insights from data. • It’s a structured framework that guides data scientists through a series of steps, from defining a problem to communicating actionable results.
  • 11.
  • 12.
    Framing the Problem •The process begins with a clear understanding of the problem or question. • This process define the project’s objectives and goals. • A well-defined problem statement acts as a compass, guiding the entire data science process and ensure the desired outcomes.
  • 13.
    Data Collection • Oncethe problem clearly defined, its important to collect the data in data science. • This involves identifying relevant data sources, whether internal databases, external APIs, or publicly available datasets. • Data scientists must carefully consider the types of data needed.
  • 14.
    Data Cleaning • Rawdata is often messy, with errors, missing values, and inconsistencies • This involves removing duplicates, filling in missing values, and transforming data into a format suitable for further exploration. • The data cleaning phase is all about removing unwanted and fill the values as well ensure the data is accurate, complete, and ready for analysis
  • 15.
    Exploratory Data Analysis(EDA) • EDA is the detective work of data science. • It’s about to uncover hidden patterns, trends, and anomalies. • Data scientists use a variety of techniques, including summary statistics, visualizations, and interactive tools, to gain a deeper understanding of the data’s characteristics and their relationships. • This stage is crucial for identifying potential way for further investigation.
  • 16.
    Model Building • Inthis phase, data scientists build models that can predict future outcomes or classify data into different categories. • These models are often based on machine learning algorithms or statistical techniques. • The choice of model depends on the problem at hand and the nature of the data. • Once the model is chosen, it’s trained on the prepared data to learn patterns and relationships.
  • 17.
    Model Deployment • Oncea model is trained and validated, it’s time to put it to work. • Model deployment involves integrating the model into a production environment, where it can be used to make predictions or inform decision-making.
  • 18.
    Communicating Results • Thefinal stage of the data science process involves communicating the findings and insights to stakeholders. • This includes creating clear and concise reports, presentations, and visualizations that effectively convey the results and their implications. • The goal is to ensure that stakeholders understand the analysis, trust the conclusions, and can use the insights to make decisions.
  • 19.
    Introduction to NumPy •NumPy is a Python library used for working with array. • NumPy stands for Numerical Python. • It is the fundamental package for mathematical and logical operations on array. • Array is homogeneous collection of data. • The values can be number, characters, Booleans. • It can be install in Jupyter notebook as pip install numpy