What is DataMining?
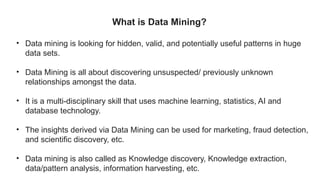
• Data mining is looking for hidden, valid, and potentially useful patterns in huge
data sets.
• Data Mining is all about discovering unsuspected/ previously unknown
relationships amongst the data.
• It is a multi-disciplinary skill that uses machine learning, statistics, AI and
database technology.
• The insights derived via Data Mining can be used for marketing, fraud detection,
and scientific discovery, etc.
• Data mining is also called as Knowledge discovery, Knowledge extraction,
data/pattern analysis, information harvesting, etc.
5.
Potential Applications
• Dataanalysis and decision support
• Market analysis and management
• Target marketing, customer relationship management (CRM), market
basket analysis, market segmentation
• Risk analysis and management
• Forecasting, customer retention, quality control, competitive analysis
• Fraud detection and detection of unusual patterns (outliers)
6.
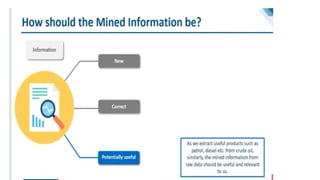
Market Analysis andManagement
Listed below are the various fields of market where data mining is used −
•Customer Profiling − Data mining helps determine what kind of people buy what kind of
products.
•Identifying Customer Requirements − Data mining helps in identifying the best products for
different customers. It uses prediction to find the factors that may attract new customers.
•Cross Market Analysis − Data mining performs Association/correlations between product
sales.
•Target Marketing − Data mining helps to find clusters of model customers who share the
same characteristics such as interests, spending habits, income, etc.
•Determining Customer purchasing pattern − Data mining helps in determining customer
purchasing pattern.
•Providing Summary Information − Data mining provides us various multidimensional
summary reports.
7.
Corporate Analysis andRisk Management
Data mining is used in the following fields of the Corporate Sector −
•Finance Planning and Asset Evaluation − It involves cash flow analysis and prediction, contingent claim analysis
to evaluate assets.
•Resource Planning − It involves summarizing and comparing the resources and spending.
•Competition − It involves monitoring competitors and market directions.
Fraud Detection
Data mining is also used in the fields of credit card services and telecommunication to detect frauds. In fraud
telephone calls, it helps to find the destination of the call, duration of the call, time of the day or week, etc. It also
analyzes the patterns that deviate from expected norms
Other Applications
Text mining (news group, email, documents) and Web mining
Stream data mining
Bioinformatics and bio-data analysis
8.
Fraud Detection &Mining Unusual Patterns
• Approaches: Clustering & model construction for frauds, outlier analysis
• Applications: Health care, retail, credit card service, telecomm.
• Medical insurance
• Professional patients, and ring of doctors
• Unnecessary or correlated screening tests
• Telecommunications:
• Phone call model: destination of the call, duration, time of day or week. Analyze patterns that
deviate from an expected norm
• Retail industry
• Analysts estimate that 38% of retail shrink is due to dishonest employee
• Internet Web Surf-Aid
• IBM Surf-Aid applies data mining algorithms to Web access logs for market-related
pages to discover customer preference and behavior pages, analyzing effectiveness of
Web marketing, improving Web site organization, etc.
9.
DATA WAREHOUSE:A datawarehouse is a subject-oriented, integrated, time-varying,
non-volatile collection of data in support of the management's decision-making process.
In an update-driven approach information from multiple, heterogeneous sources is
integrated in advance and stored separately for direct querying and analysis.
• Data warehousing is the process of integrating enterprise-wide corporate data into a
single repository, from which end-users can easily run queries, make reports and
perform analysis.
• A data warehouse is a decision-support environment that leverages data stored in
different sources, organizing it and delivering it to decision makers across the
enterprise, regardless of their platform or technical skill level.
• A data warehouse is a competitive tool that gives every end user the ability to access
quality enterprise-wide data.
. A data warehouse is of course a database, but it contains summarized information. In
general, our database is not a data warehouse unless we also
collect and summarize information from disparate sources and use it as the place
where this disparity can be reconciled, and
place the data into a warehouse because we intend to allow several different
applications to make use of the same information.
10.
SUBJECT-ORIENTED
A data warehouseis organized around major subjects such as customer, products, sales, etc. Data are organized according
to subject instead of application. For example, SUBJECT-ORIENTED
A data warehouse is organized around major subjects such as customer, products, sales, etc. Data are organized according
to subject instead of application. For example, an insurance company using a data warehouse would organize their data by
customer, premium, and claim instead of by different products (auto, life, etc.). The data organized by subject obtains only
the information necessary for the decision support processing.
NON-VOLATILE
A data warehouse is always a physically separate store of data, which is transformed from the application data found in the
appropriate environment. Due to this separation, data warehouses do not require transaction processi ng, recovery,
concurrency control, etc. The data are not updated or changed in any way once they enter the data warehouse, but are only
loaded, refreshed and accessed for queries.
TIME-VARYING
Data are stored in a data warehouse to provide a historical perspective. Every key structure in the data warehouse contains,
implicitly or explicitly, an element of time. The data warehouse contains a place for sorting data that are 5 to 10 years old, or
older, to be used for comparisons, trends and forecasting.
INTEGRATED
A data warehouse is usually constructed by integrating multiple, heterogeneous sources such as relational databases, flat
files, and OLTP files
11.
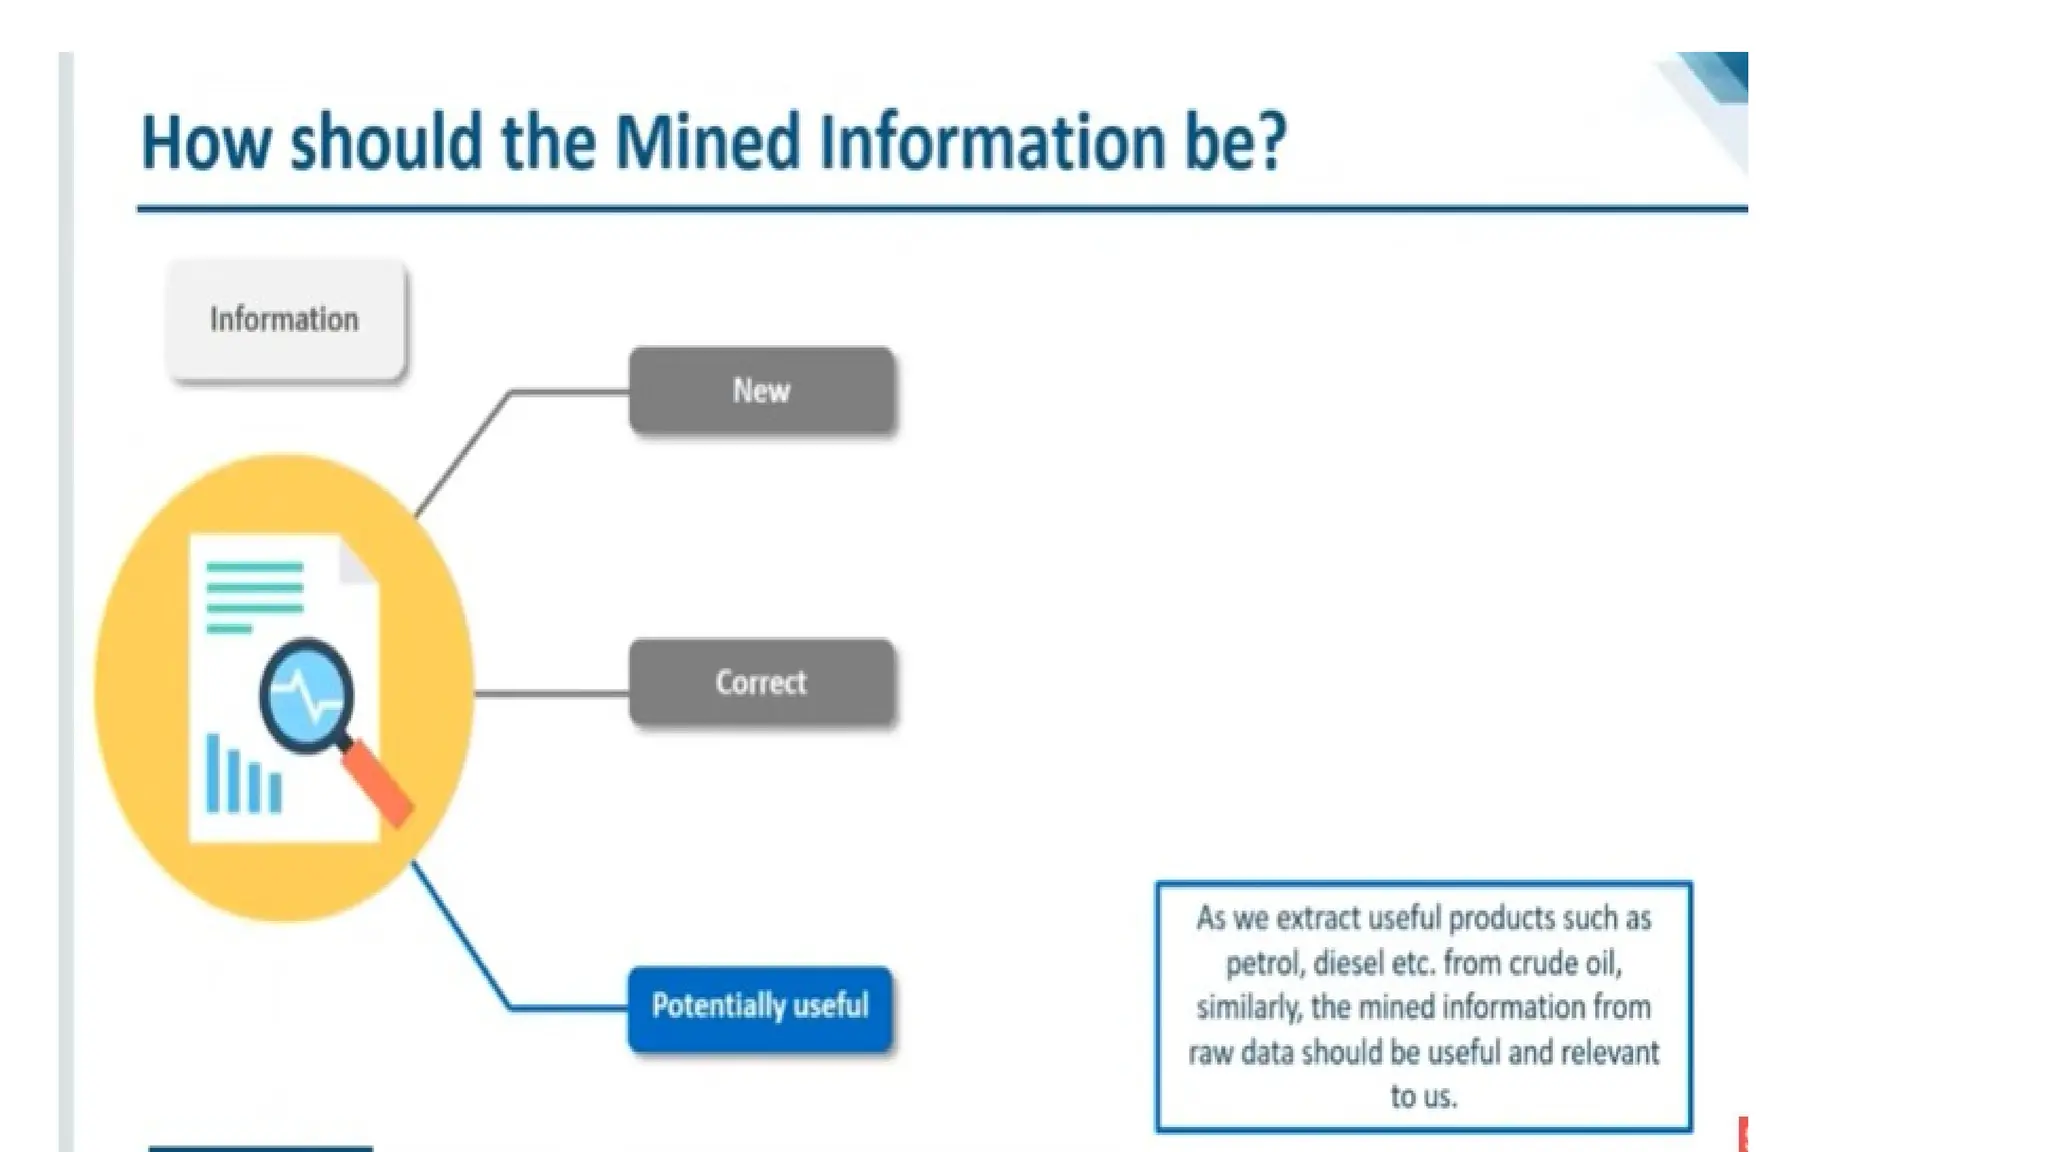
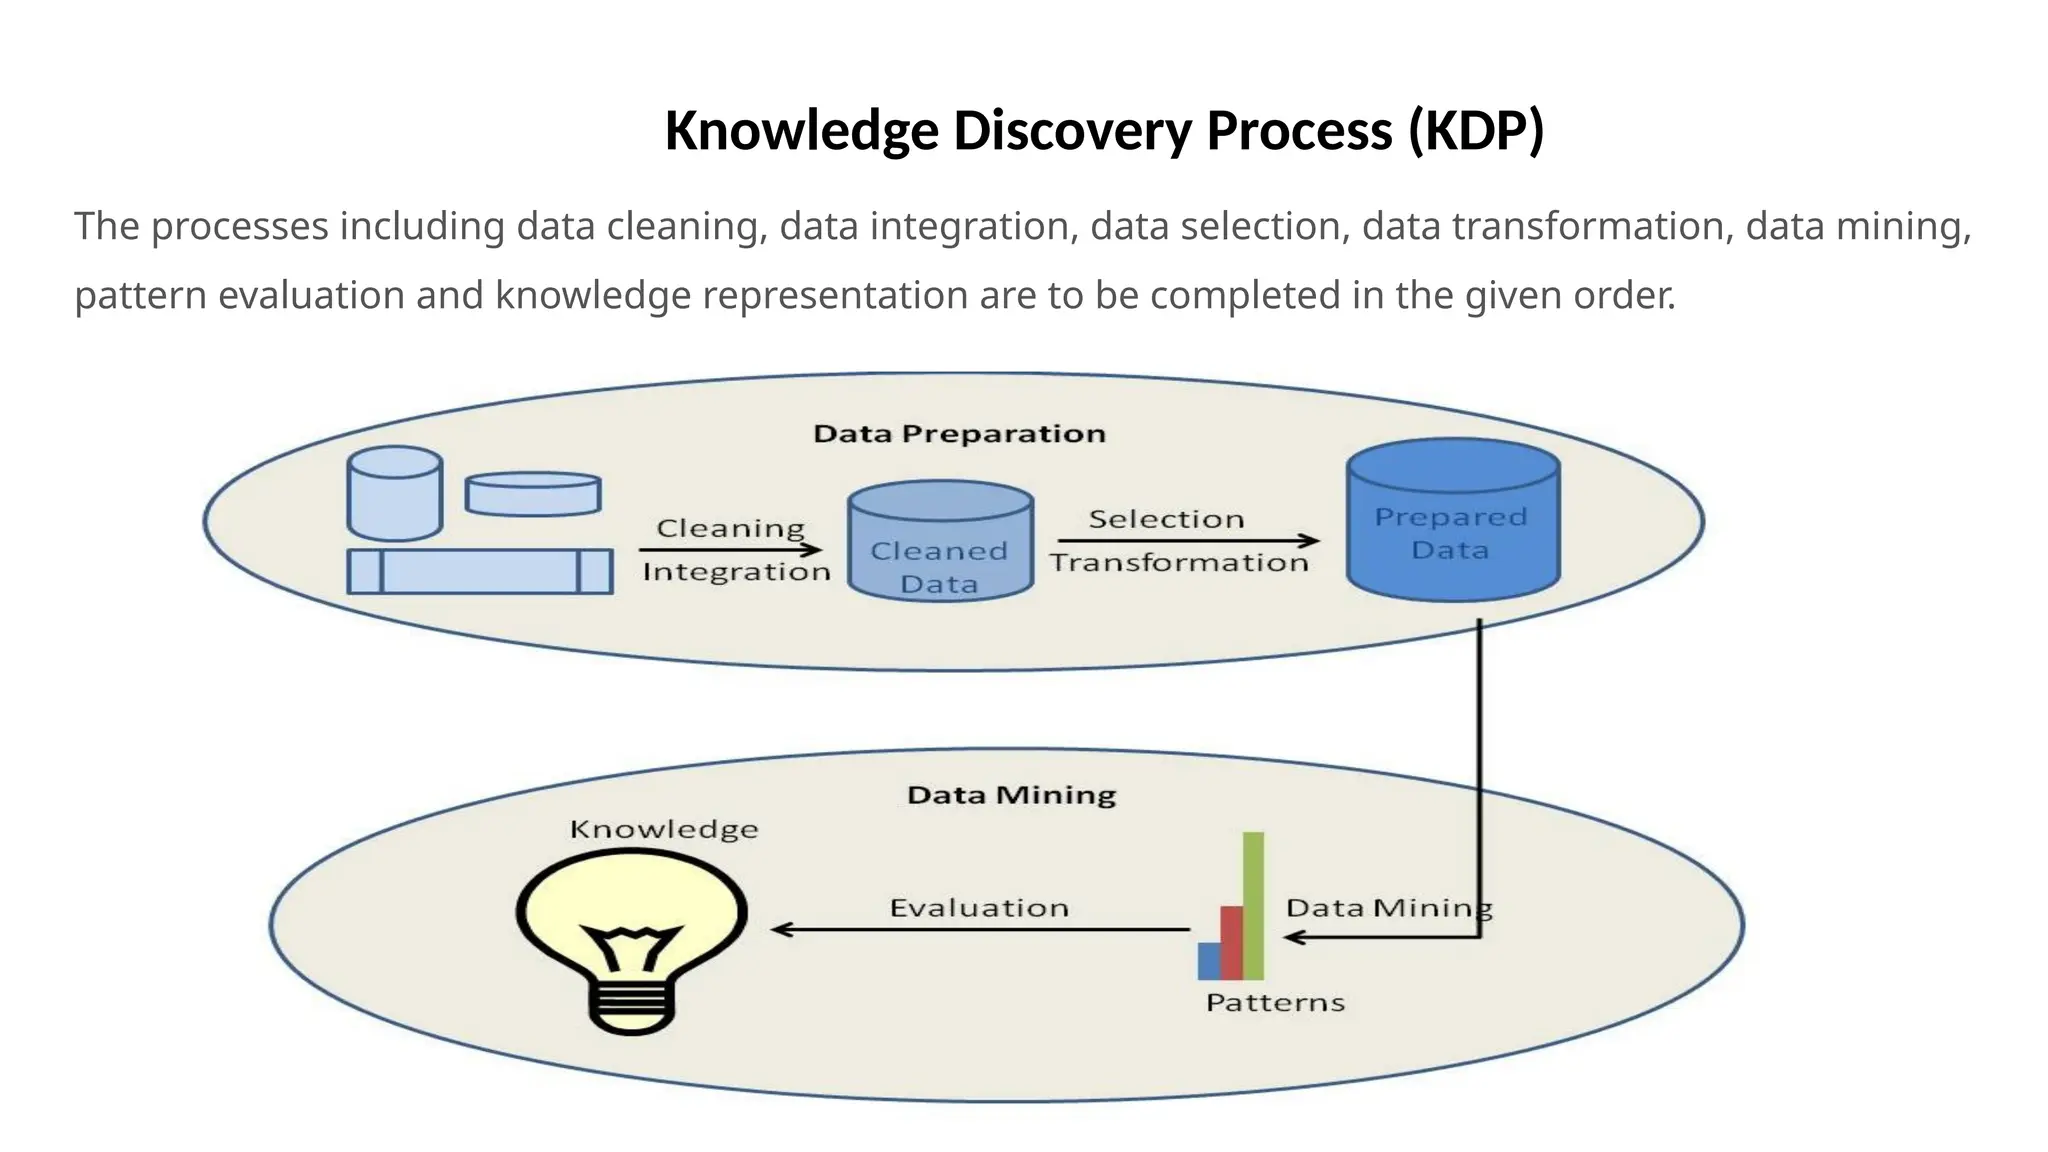
Knowledge Discovery Process(KDP)
The processes including data cleaning, data integration, data selection, data transformation, data mining,
pattern evaluation and knowledge representation are to be completed in the given order.
12.
a) Data Cleaning
•Data cleaning is the process where the data gets cleaned.
• Data in the real world is normally incomplete, noisy and inconsistent. (like missing values,
incorrect, inconsistent)
• Data cleaning involves a number of techniques including filling in the missing values manually,
combined computer and human inspection, etc.
• The output of data cleaning process is adequately cleaned data.
b) Data Integration
• Data integration is the process where data from different data sources are integrated into
one( heterogeneous data from multiple sources combined in a common source (Data
Warehouse)).
• Data integration is a really complex and tricky task.
• Metadata can be used effectively to reduce errors in the data integration process.
• Data integration tries to reduce redundancy to the maximum possible level without affecting the
reliability of data.
13.
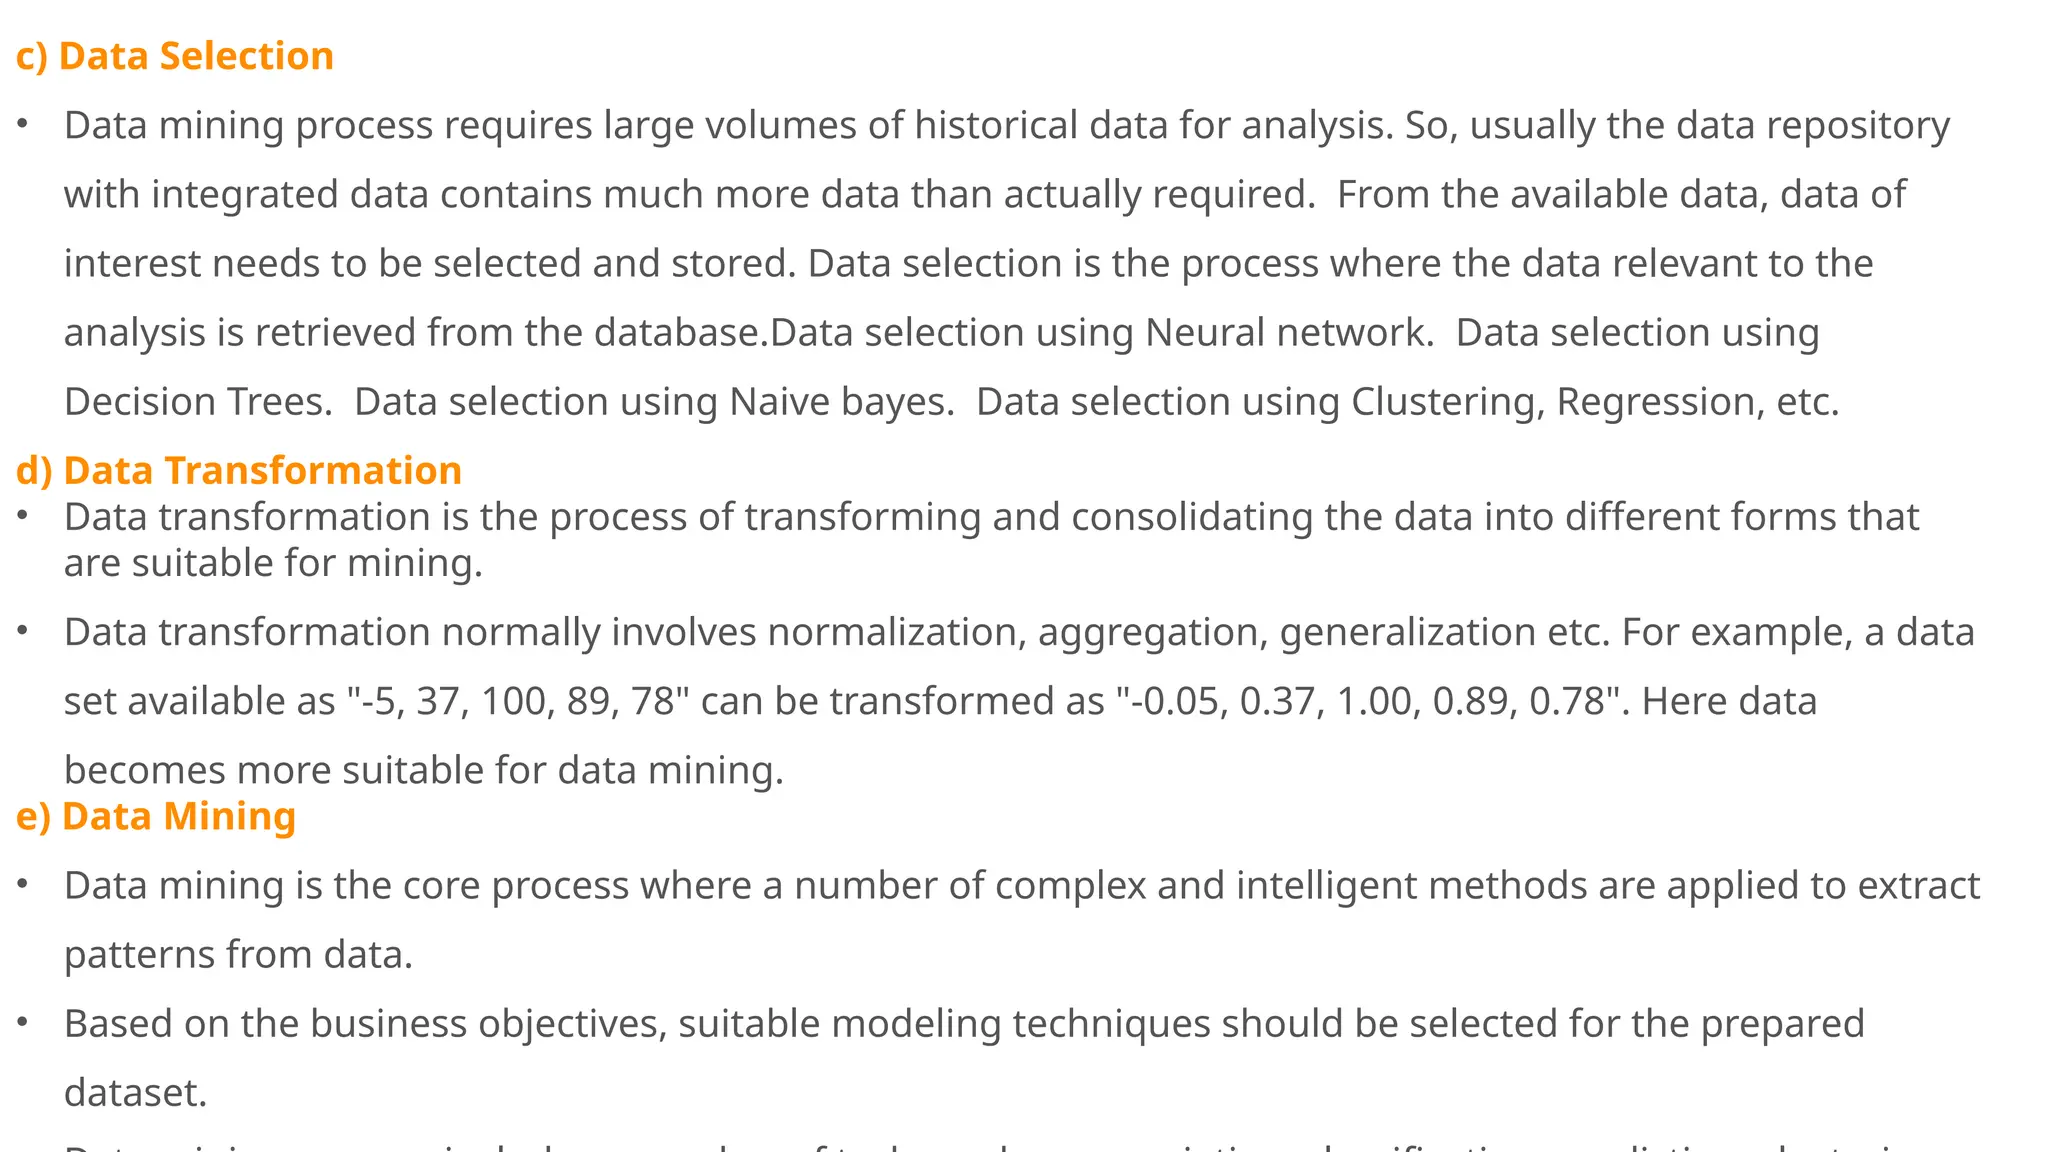
c) Data Selection
•Data mining process requires large volumes of historical data for analysis. So, usually the data repository
with integrated data contains much more data than actually required. From the available data, data of
interest needs to be selected and stored. Data selection is the process where the data relevant to the
analysis is retrieved from the database.Data selection using Neural network. Data selection using
Decision Trees. Data selection using Naive bayes. Data selection using Clustering, Regression, etc.
d) Data Transformation
• Data transformation is the process of transforming and consolidating the data into different forms that
are suitable for mining.
• Data transformation normally involves normalization, aggregation, generalization etc. For example, a data
set available as "-5, 37, 100, 89, 78" can be transformed as "-0.05, 0.37, 1.00, 0.89, 0.78". Here data
becomes more suitable for data mining.
e) Data Mining
• Data mining is the core process where a number of complex and intelligent methods are applied to extract
patterns from data.
• Based on the business objectives, suitable modeling techniques should be selected for the prepared
dataset.
14.
f) Pattern Evaluation
•Results generated by the data mining model should be evaluated against the business
objectives.
• Identifies the truly interesting patterns representing knowledge based on different types
of interestingness measures.
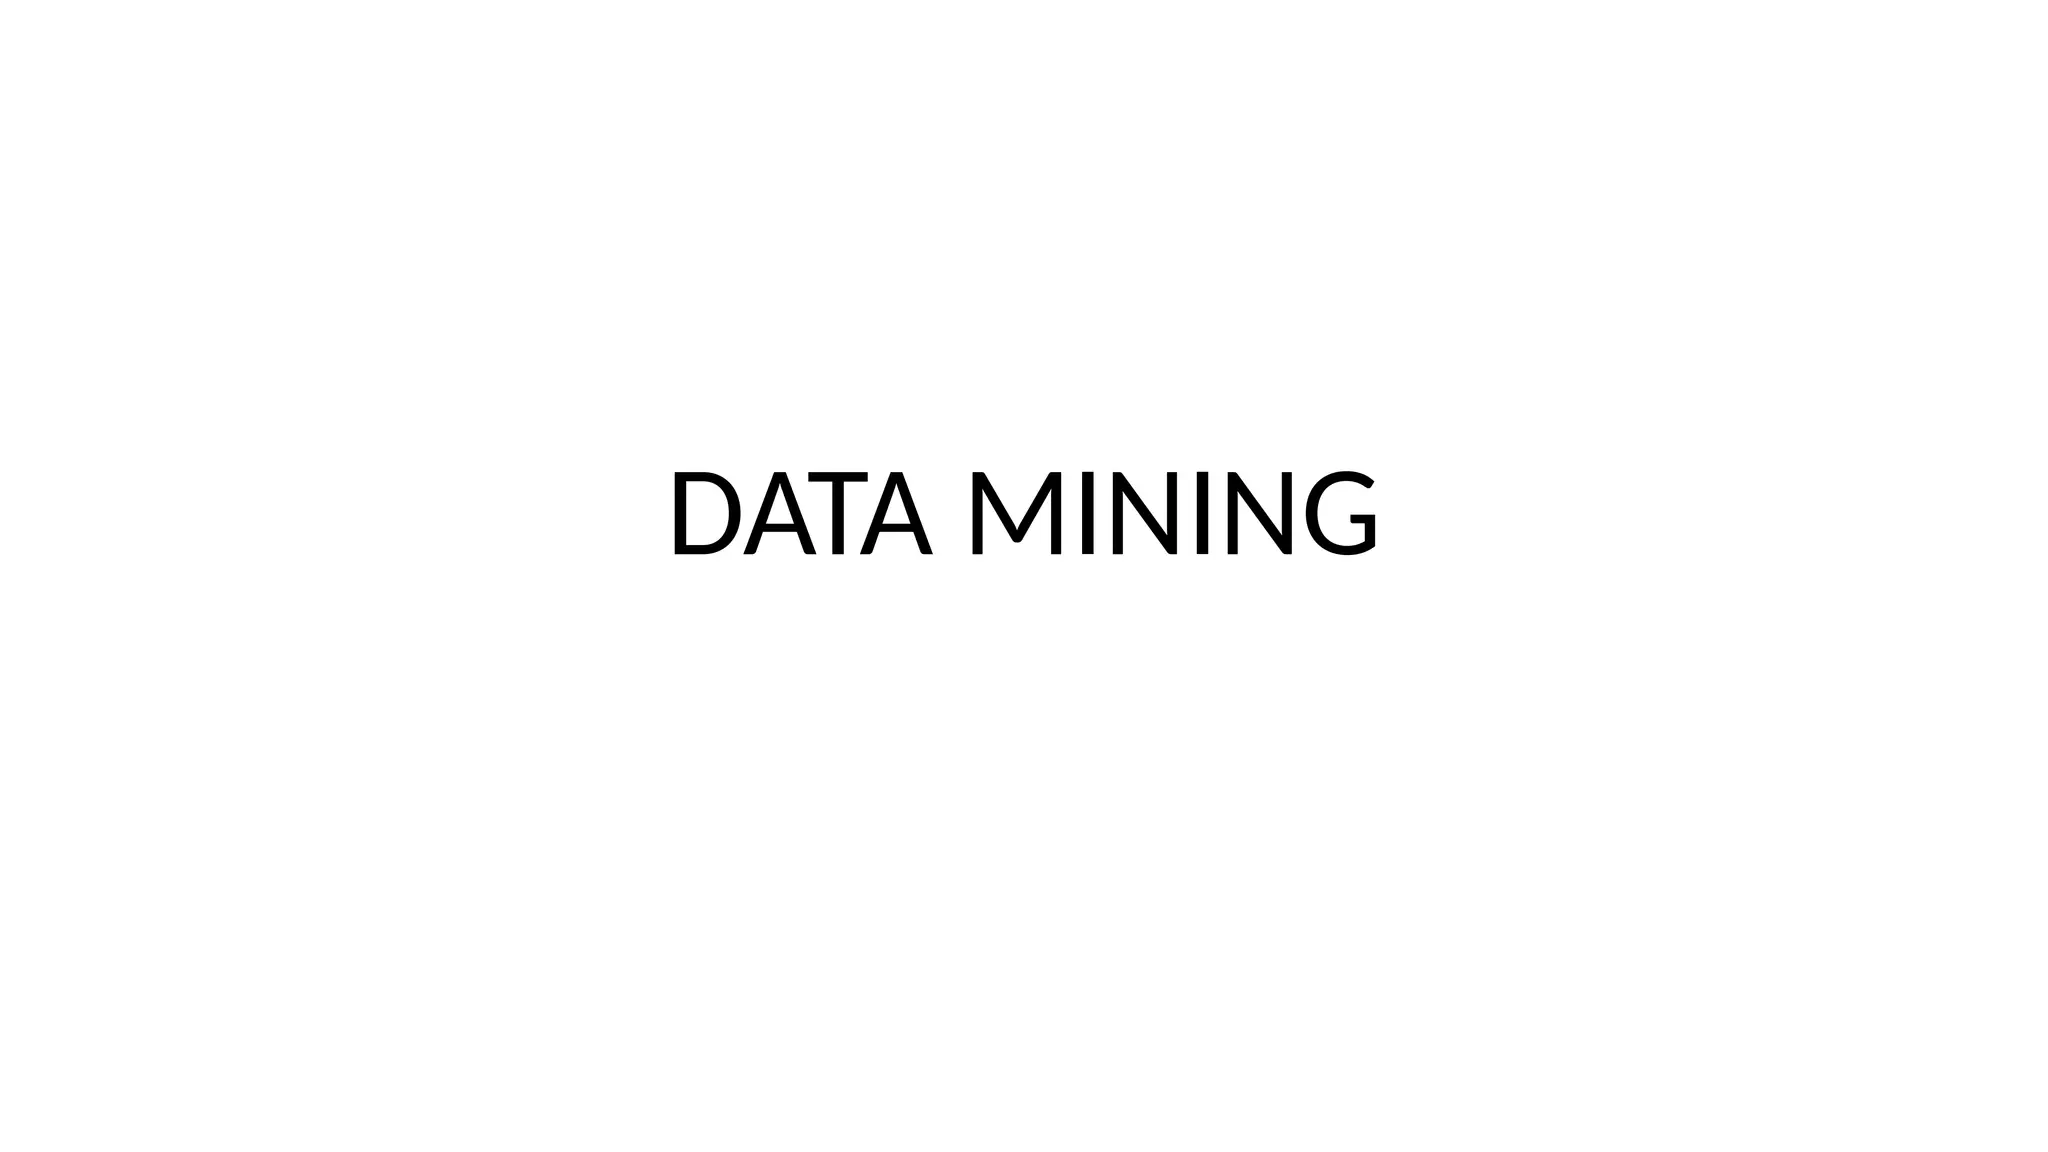
• A pattern is considered to be interesting if it is potentially useful, easily understandable
by humans, validates some hypothesis that someone wants to confirm or valid on new
data with some degree of certainty. Uses summarization and Visualization to make data
understandable by user.
g) Knowledge Representation
• The information mined from the data needs to be presented to the user in an appealing
way.
• Different knowledge representation and visualization techniques are applied to provide
15.
SYSTEM ARCHITECTURE
Data miningis a very important process where potentially useful and
previously unknown information is extracted from large volumes of
data.
There are a number of components involved in the data mining
process.
These components constitute the architecture of a data mining
system.
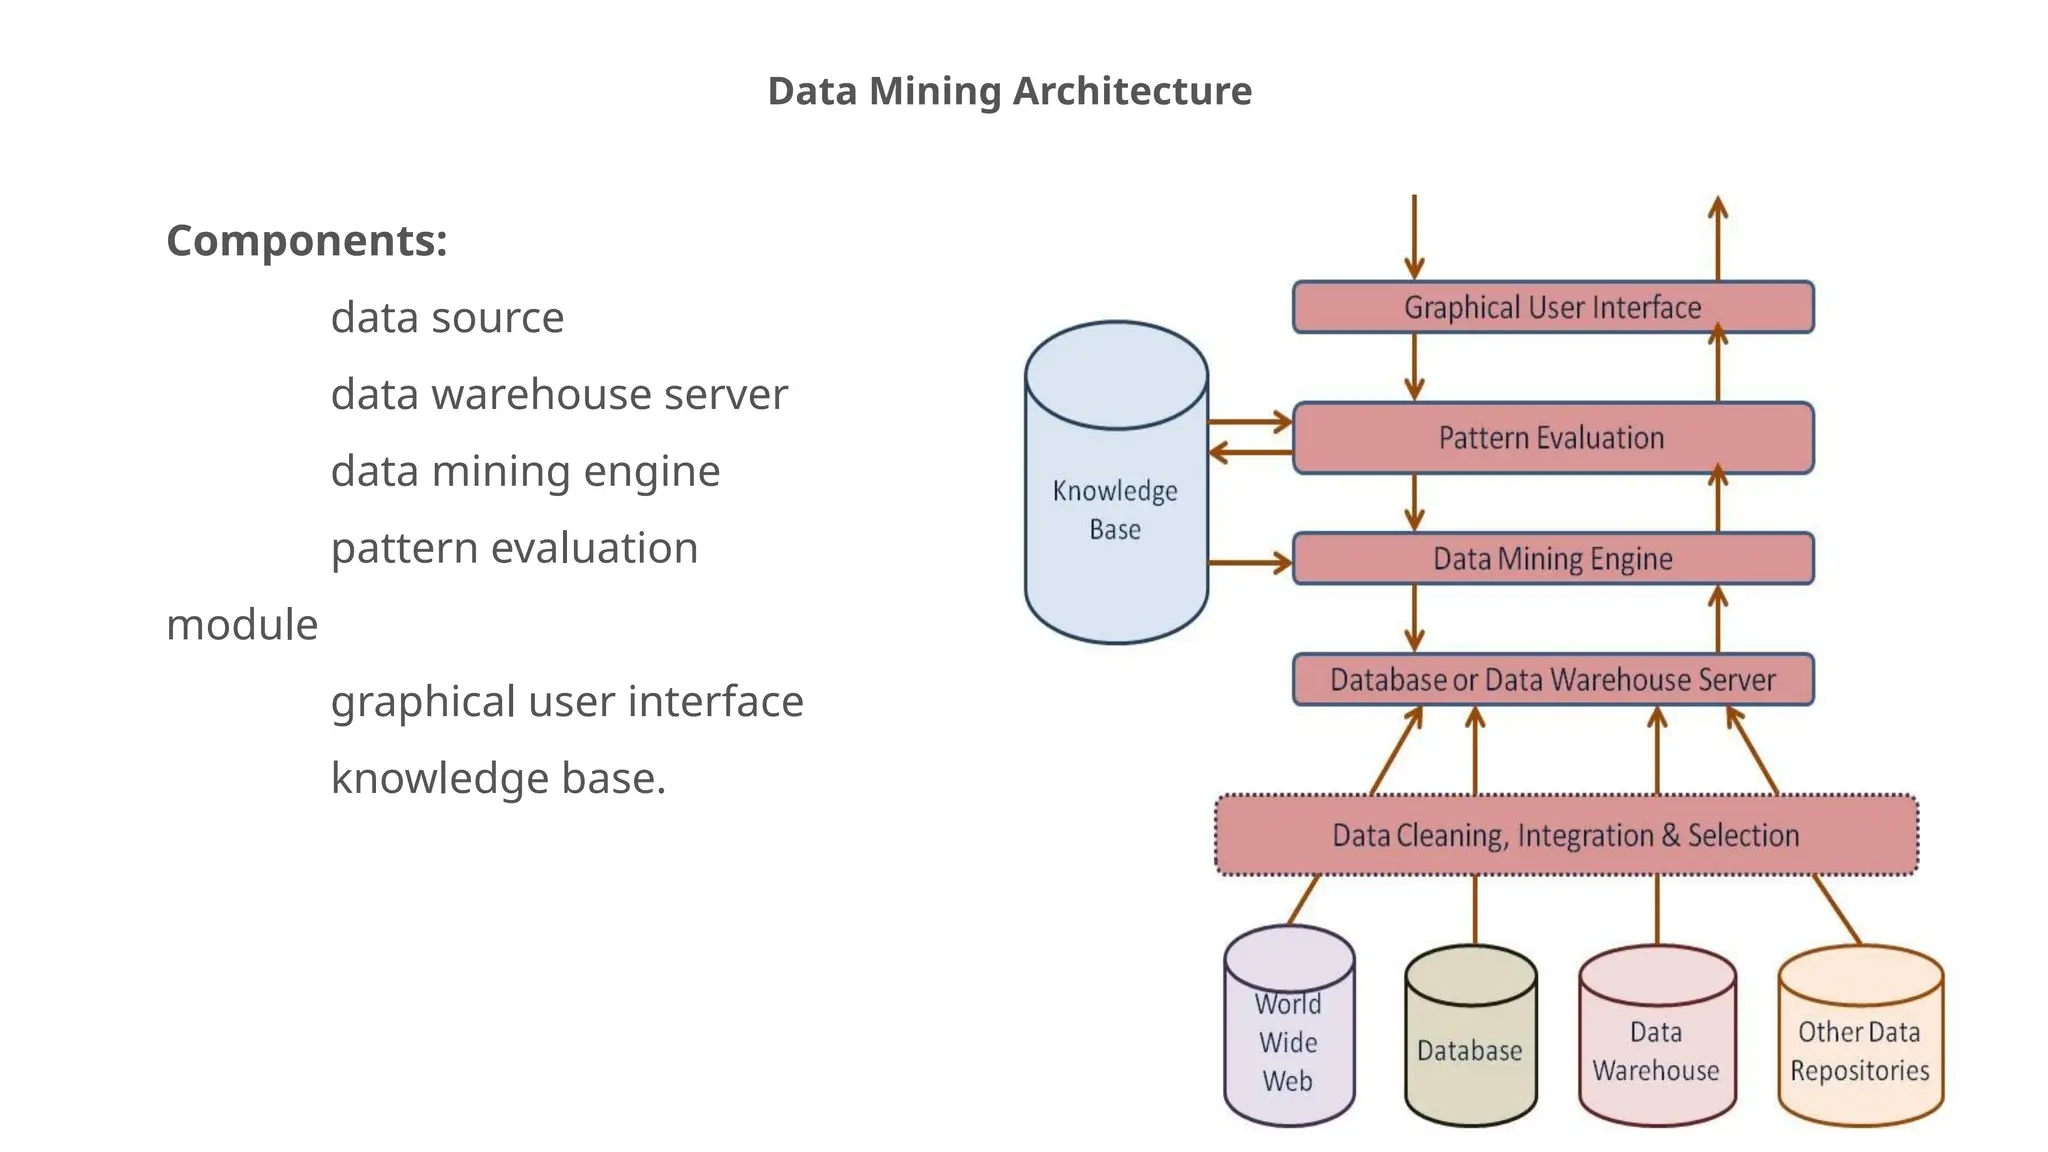
The major components of any data mining system are data source,
data warehouse server, data mining engine, pattern evaluation
module, graphical user interface and knowledge base.
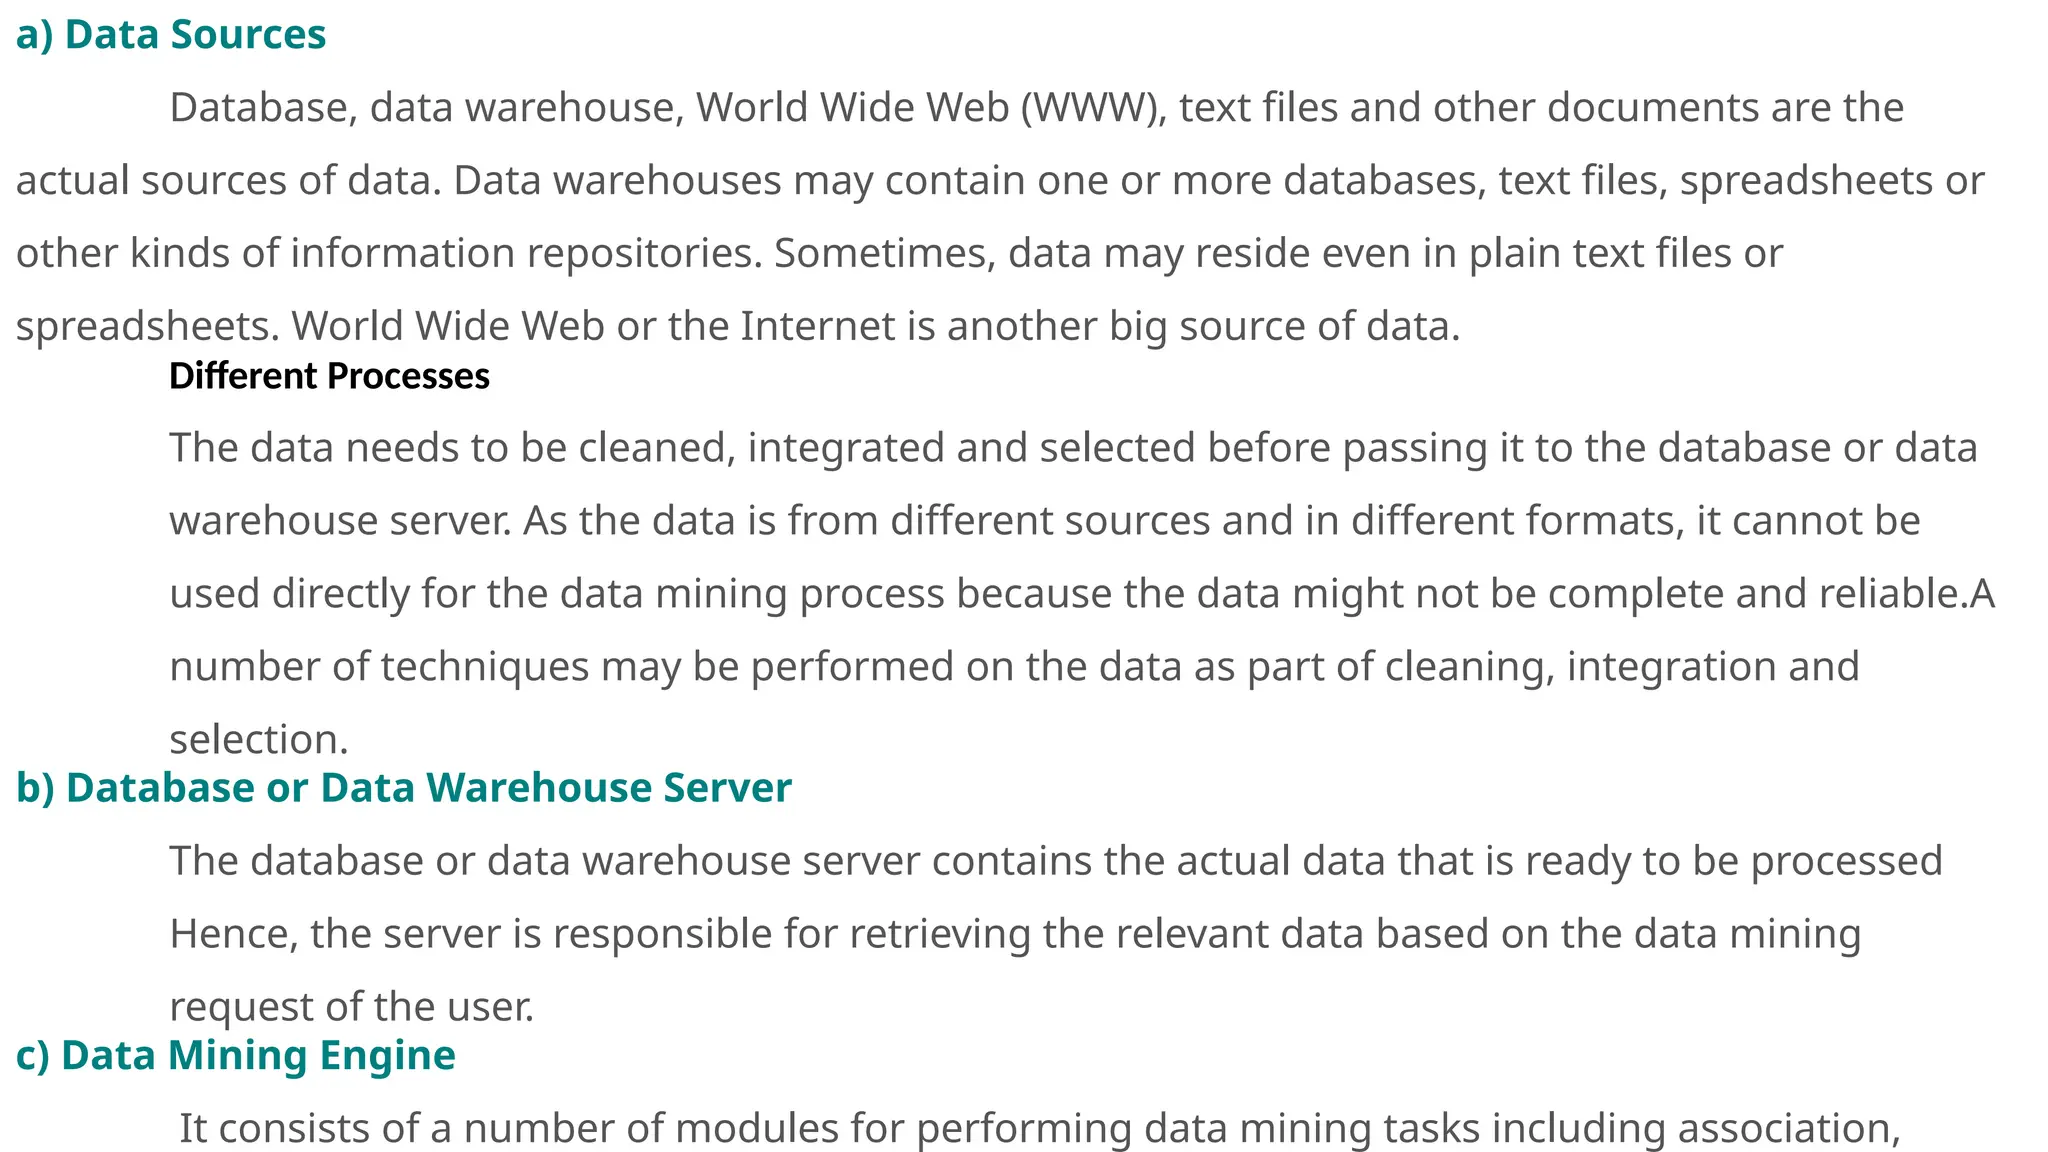
a) Data Sources
Database,data warehouse, World Wide Web (WWW), text files and other documents are the
actual sources of data. Data warehouses may contain one or more databases, text files, spreadsheets or
other kinds of information repositories. Sometimes, data may reside even in plain text files or
spreadsheets. World Wide Web or the Internet is another big source of data.
Different Processes
The data needs to be cleaned, integrated and selected before passing it to the database or data
warehouse server. As the data is from different sources and in different formats, it cannot be
used directly for the data mining process because the data might not be complete and reliable.A
number of techniques may be performed on the data as part of cleaning, integration and
selection.
b) Database or Data Warehouse Server
The database or data warehouse server contains the actual data that is ready to be processed
Hence, the server is responsible for retrieving the relevant data based on the data mining
request of the user.
c) Data Mining Engine
It consists of a number of modules for performing data mining tasks including association,
18.
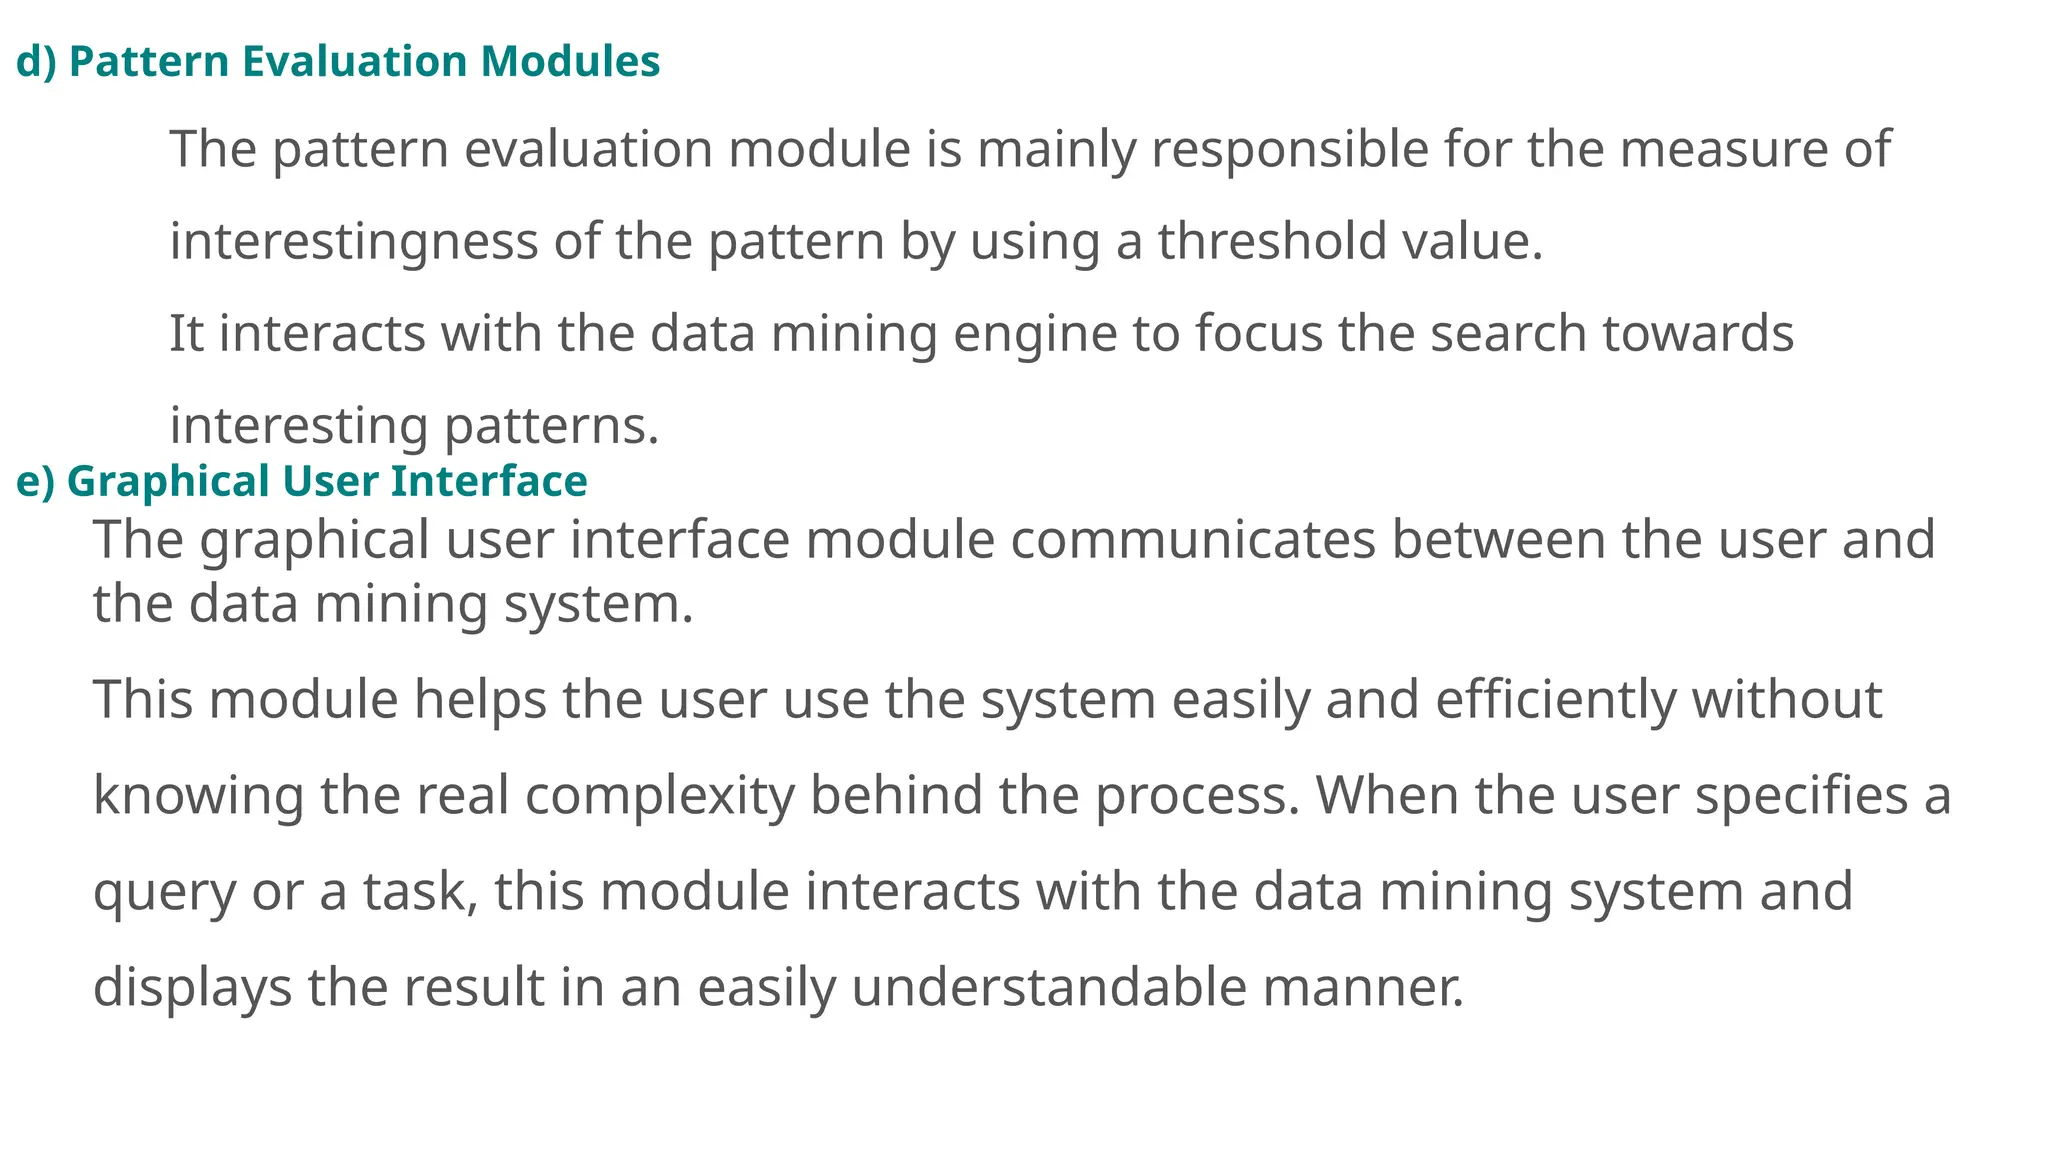
d) Pattern EvaluationModules
The pattern evaluation module is mainly responsible for the measure of
interestingness of the pattern by using a threshold value.
It interacts with the data mining engine to focus the search towards
interesting patterns.
e) Graphical User Interface
The graphical user interface module communicates between the user and
the data mining system.
This module helps the user use the system easily and efficiently without
knowing the real complexity behind the process. When the user specifies a
query or a task, this module interacts with the data mining system and
displays the result in an easily understandable manner.
19.
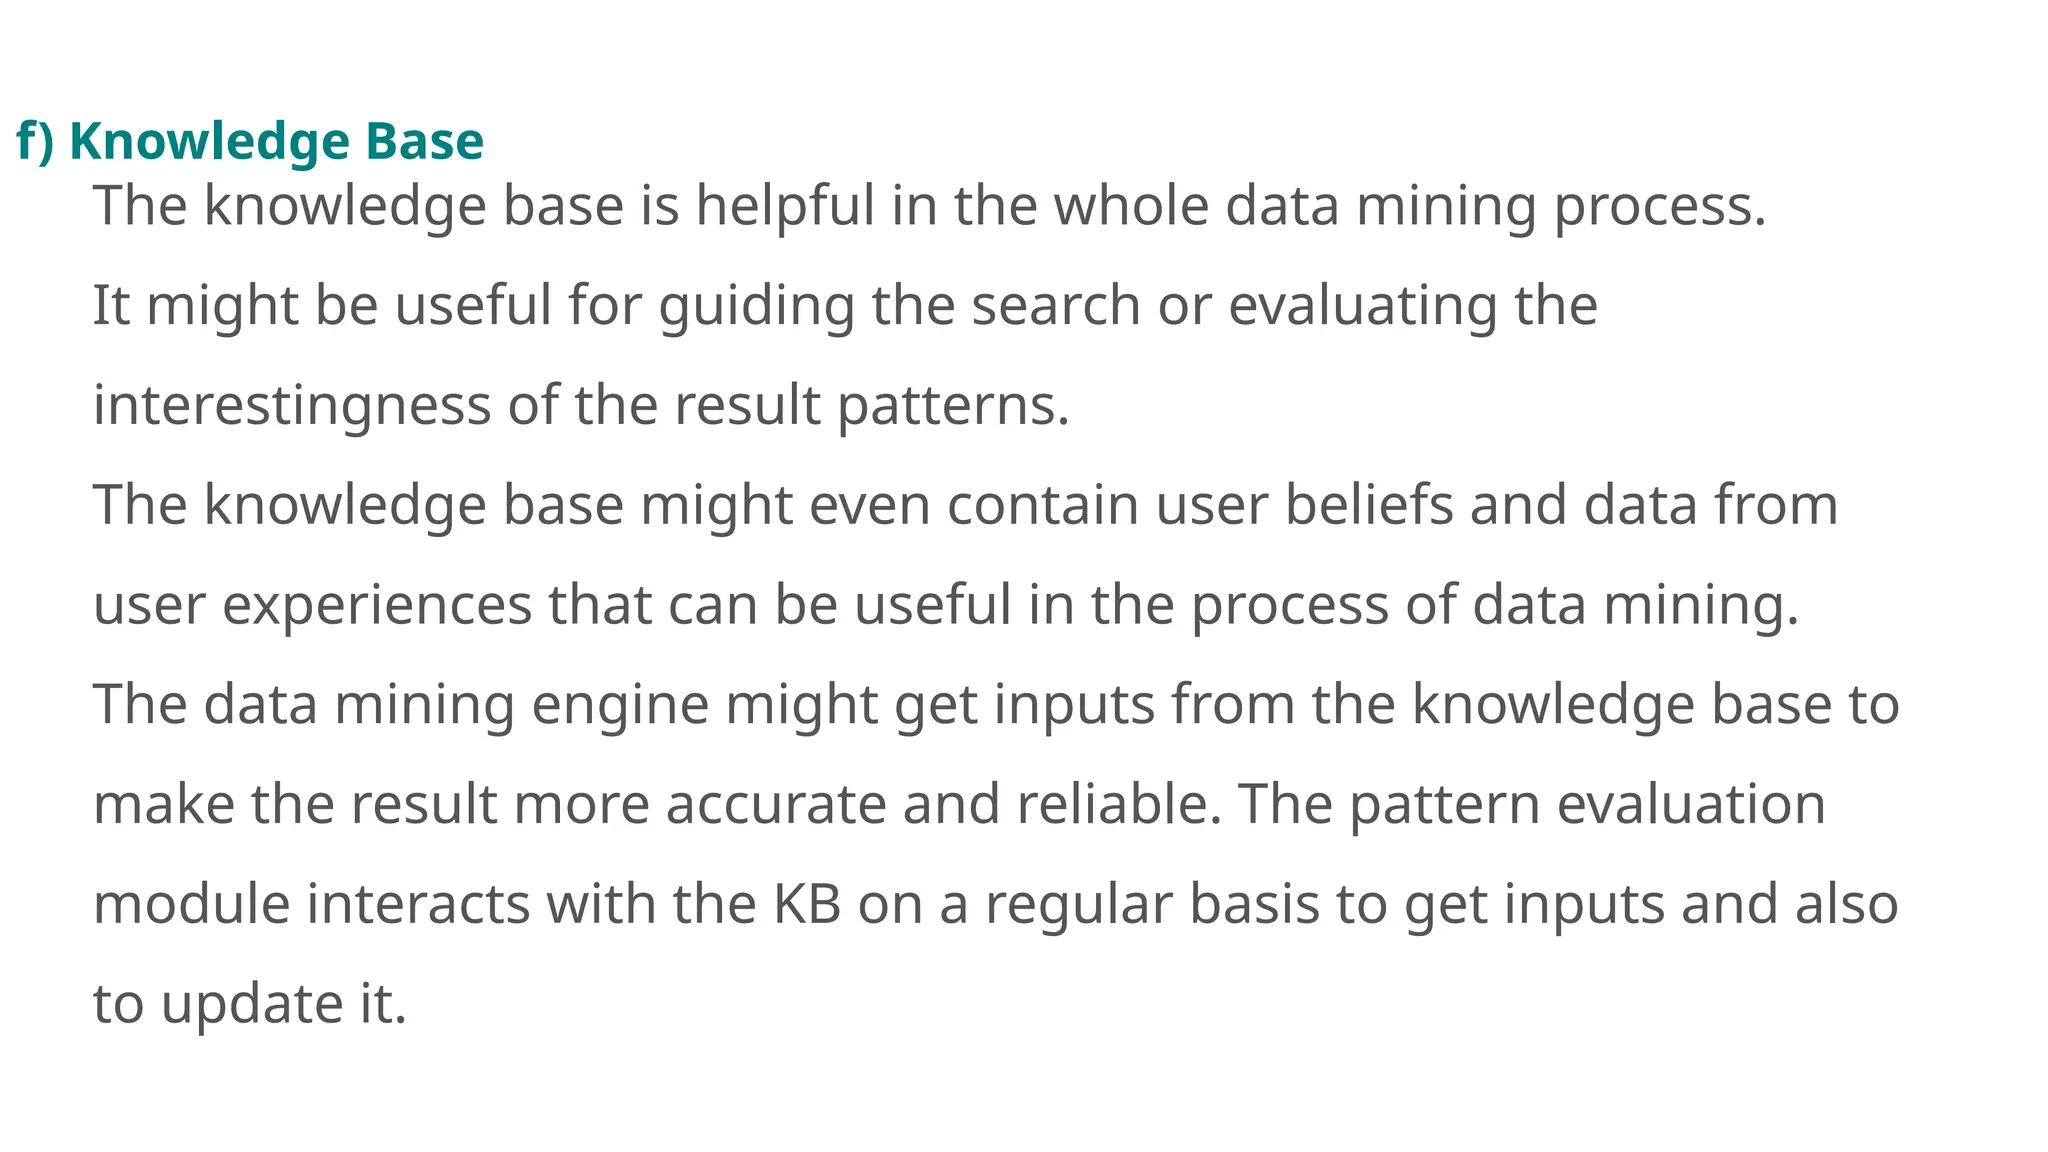
f) Knowledge Base
Theknowledge base is helpful in the whole data mining process.
It might be useful for guiding the search or evaluating the
interestingness of the result patterns.
The knowledge base might even contain user beliefs and data from
user experiences that can be useful in the process of data mining.
The data mining engine might get inputs from the knowledge base to
make the result more accurate and reliable. The pattern evaluation
module interacts with the KB on a regular basis to get inputs and also
to update it.
20.
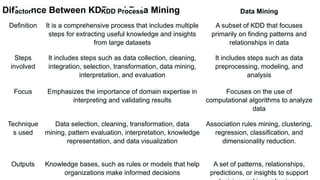
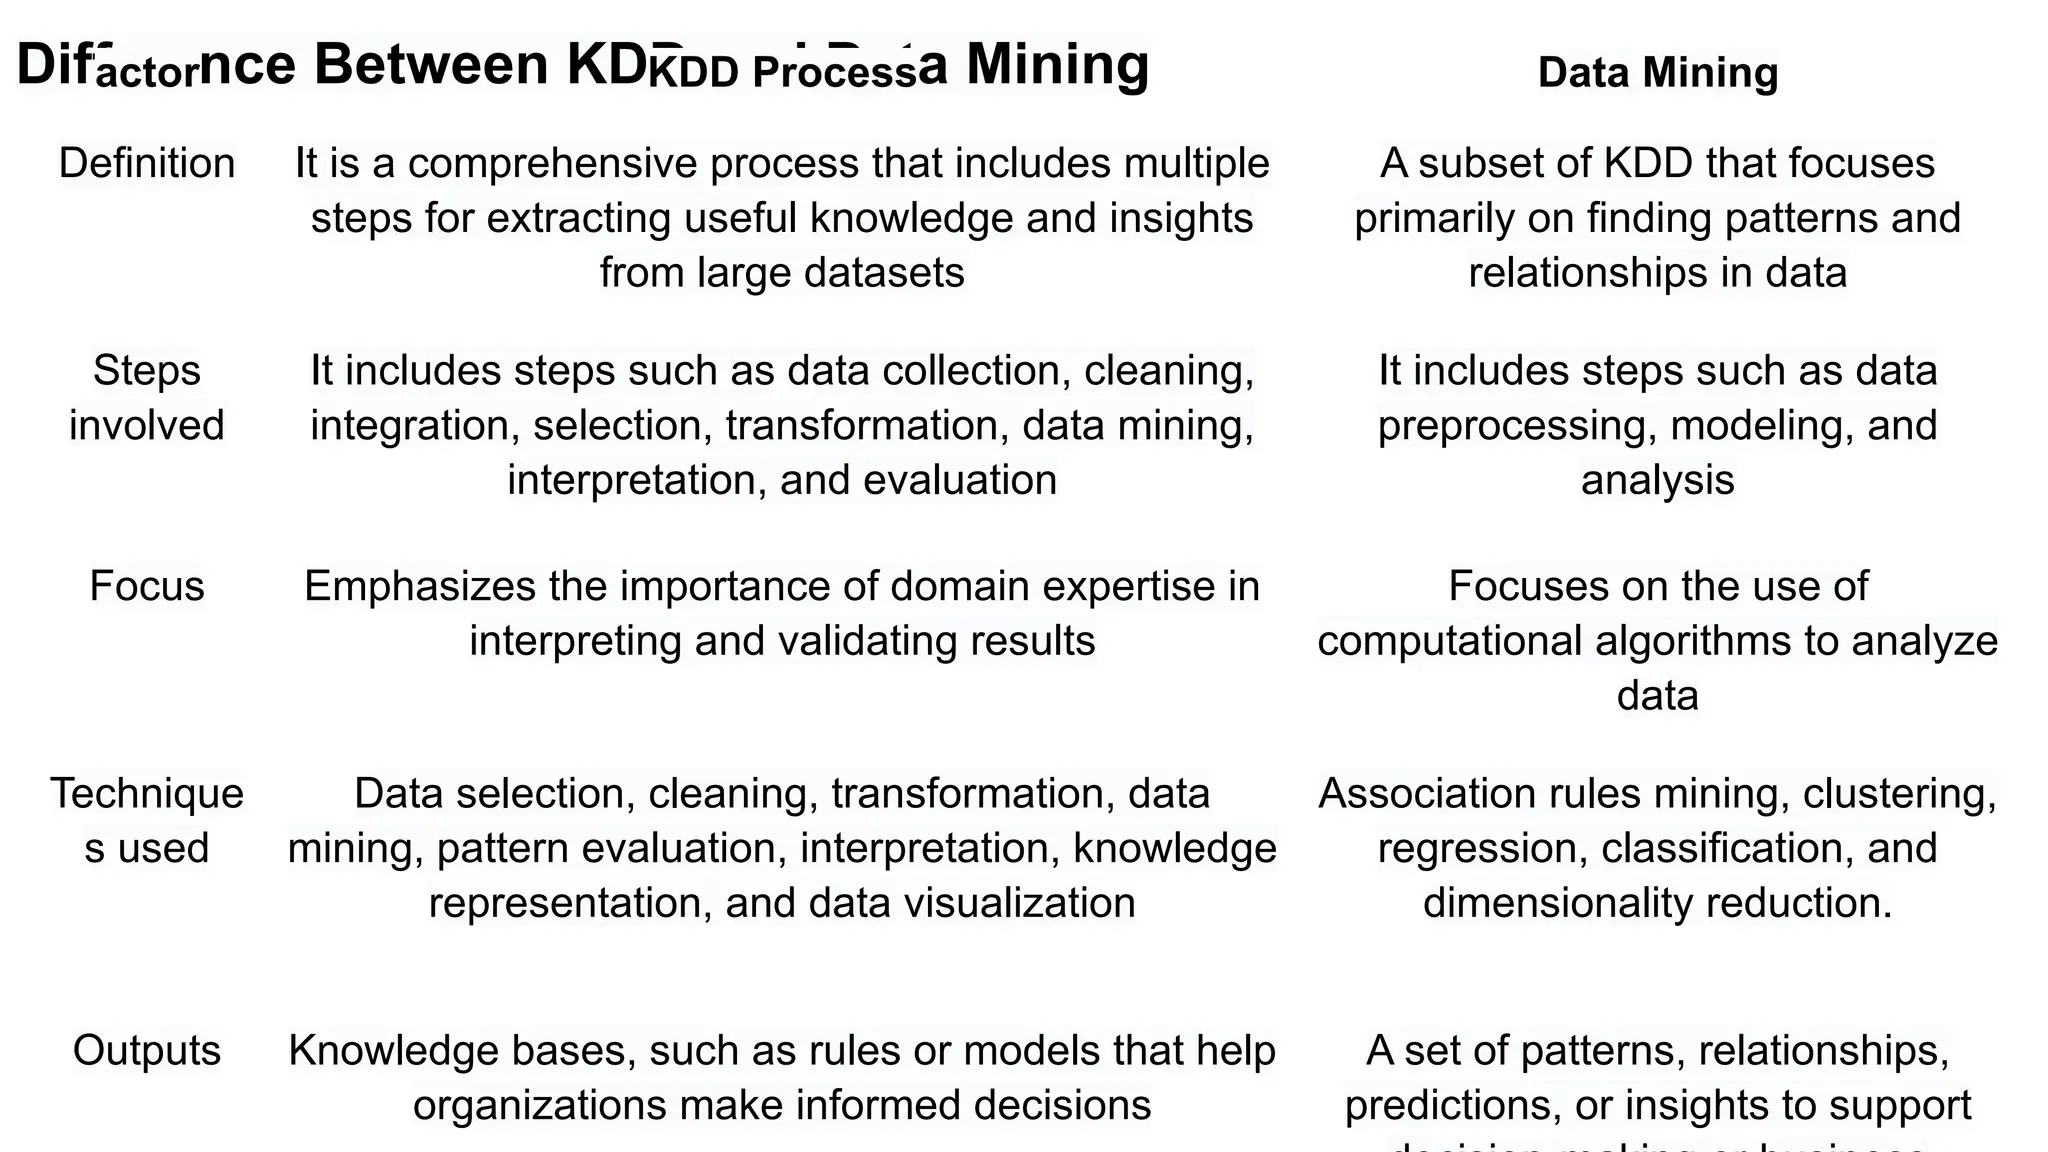
Difference Between KDDand Data Mining
actor KDD Process Data Mining
Definition It is a comprehensive process that includes multiple
steps for extracting useful knowledge and insights
from large datasets
A subset of KDD that focuses
primarily on finding patterns and
relationships in data
Steps
involved
It includes steps such as data collection, cleaning,
integration, selection, transformation, data mining,
interpretation, and evaluation
It includes steps such as data
preprocessing, modeling, and
analysis
Focus Emphasizes the importance of domain expertise in
interpreting and validating results
Focuses on the use of
computational algorithms to analyze
data
Technique
s used
Data selection, cleaning, transformation, data
mining, pattern evaluation, interpretation, knowledge
representation, and data visualization
Association rules mining, clustering,
regression, classification, and
dimensionality reduction.
Outputs Knowledge bases, such as rules or models that help
organizations make informed decisions
A set of patterns, relationships,
predictions, or insights to support
21.
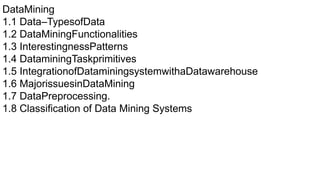
DataMining
1.1 Data–TypesofData
1.2 DataMiningFunctionalities
1.3InterestingnessPatterns
1.4 DataminingTaskprimitives
1.5 IntegrationofDataminingsystemwithaDatawarehouse
1.6 MajorissuesinDataMining
1.7 DataPreprocessing.
1.8 Classification of Data Mining Systems
22.
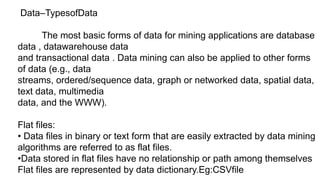
Data–TypesofData
The most basicforms of data for mining applications are database
data , datawarehouse data
and transactional data . Data mining can also be applied to other forms
of data (e.g., data
streams, ordered/sequence data, graph or networked data, spatial data,
text data, multimedia
data, and the WWW).
Flat files:
• Data files in binary or text form that are easily extracted by data mining
algorithms are referred to as flat files.
•Data stored in flat files have no relationship or path among themselves
Flat files are represented by data dictionary.Eg:CSVfile
23.
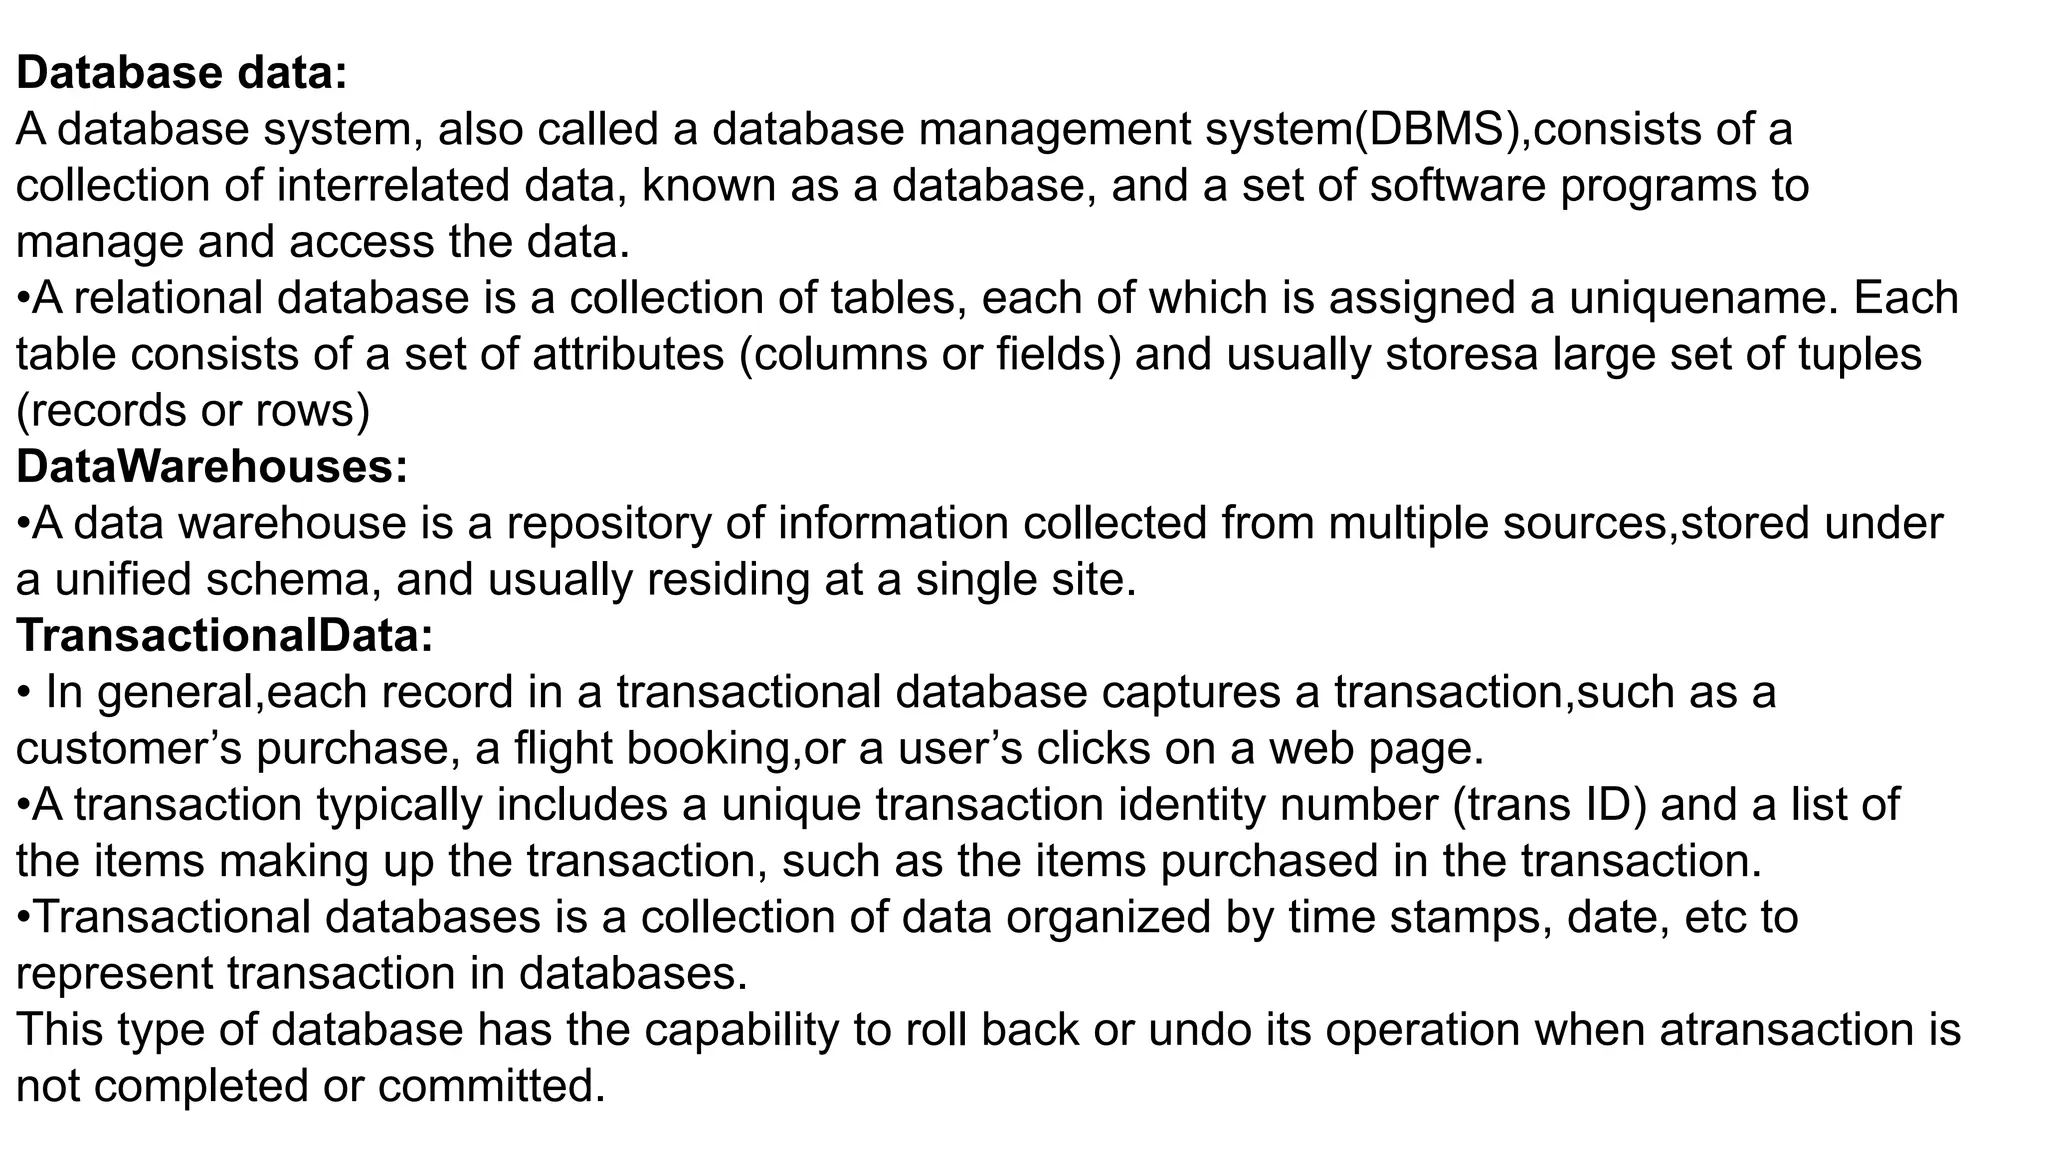
Database data:
A databasesystem, also called a database management system(DBMS),consists of a
collection of interrelated data, known as a database, and a set of software programs to
manage and access the data.
•A relational database is a collection of tables, each of which is assigned a uniquename. Each
table consists of a set of attributes (columns or fields) and usually storesa large set of tuples
(records or rows)
DataWarehouses:
•A data warehouse is a repository of information collected from multiple sources,stored under
a unified schema, and usually residing at a single site.
TransactionalData:
• In general,each record in a transactional database captures a transaction,such as a
customer’s purchase, a flight booking,or a user’s clicks on a web page.
•A transaction typically includes a unique transaction identity number (trans ID) and a list of
the items making up the transaction, such as the items purchased in the transaction.
•Transactional databases is a collection of data organized by time stamps, date, etc to
represent transaction in databases.
This type of database has the capability to roll back or undo its operation when atransaction is
not completed or committed.
24.
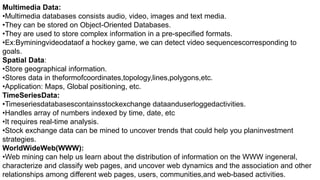
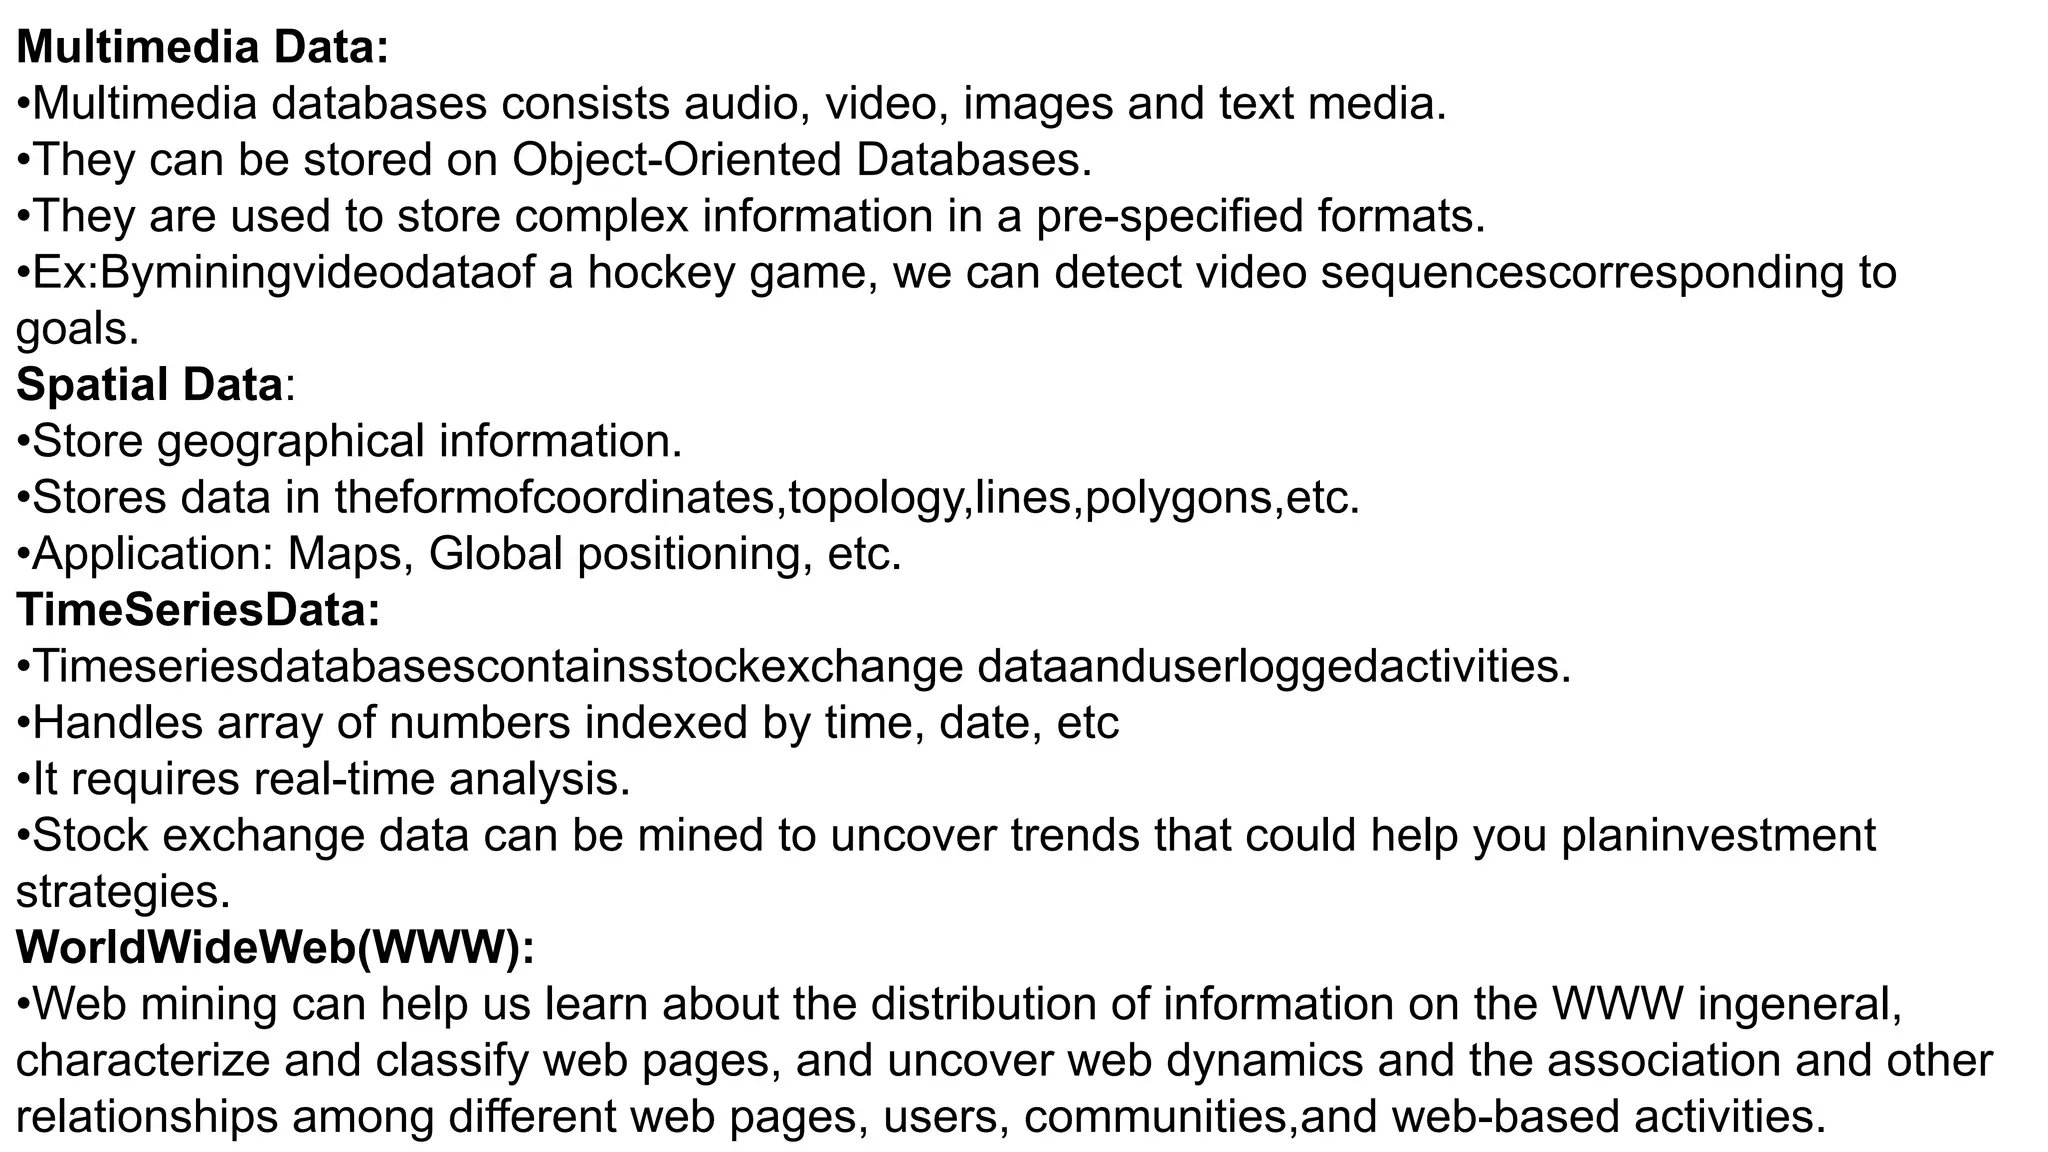
Multimedia Data:
•Multimedia databasesconsists audio, video, images and text media.
•They can be stored on Object-Oriented Databases.
•They are used to store complex information in a pre-specified formats.
•Ex:Byminingvideodataof a hockey game, we can detect video sequencescorresponding to
goals.
Spatial Data:
•Store geographical information.
•Stores data in theformofcoordinates,topology,lines,polygons,etc.
•Application: Maps, Global positioning, etc.
TimeSeriesData:
•Timeseriesdatabasescontainsstockexchange dataanduserloggedactivities.
•Handles array of numbers indexed by time, date, etc
•It requires real-time analysis.
•Stock exchange data can be mined to uncover trends that could help you planinvestment
strategies.
WorldWideWeb(WWW):
•Web mining can help us learn about the distribution of information on the WWW ingeneral,
characterize and classify web pages, and uncover web dynamics and the association and other
relationships among different web pages, users, communities,and web-based activities.
25.
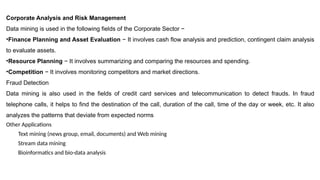
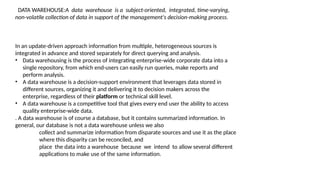
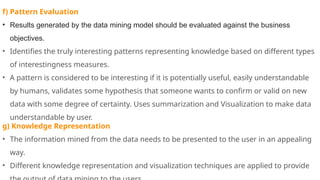
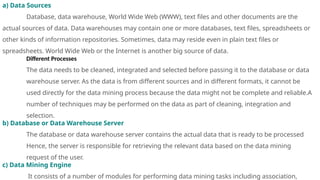
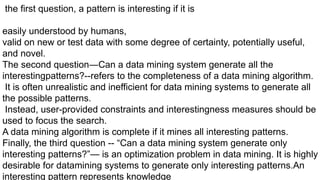
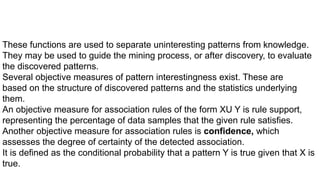
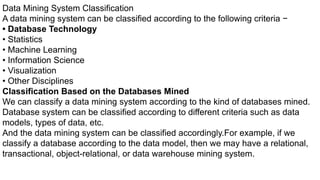
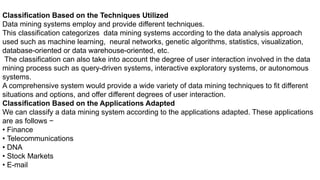
1.2 DATA MININGFUNCTIONALITIES
Data mining functionalities are used to specify the kind of patterns to be found in
data mining tasks.
Data mining tasks can be classified into two categories: descriptive and
predictive.
Descriptive mining tasks characterize the general properties of the data in the
database. [classification,Regression]
Predictive mining tasks perform inference on the current data in order to make
predictions. [clustering, association]
Concept/Class Description: Characterization and Discrimination
Data can be associated with classes or concepts.
For example, in the Electronics store, classes of items for sale include computers
and printers, and concepts of customers include big Spenders and budget
Spenders.
26.
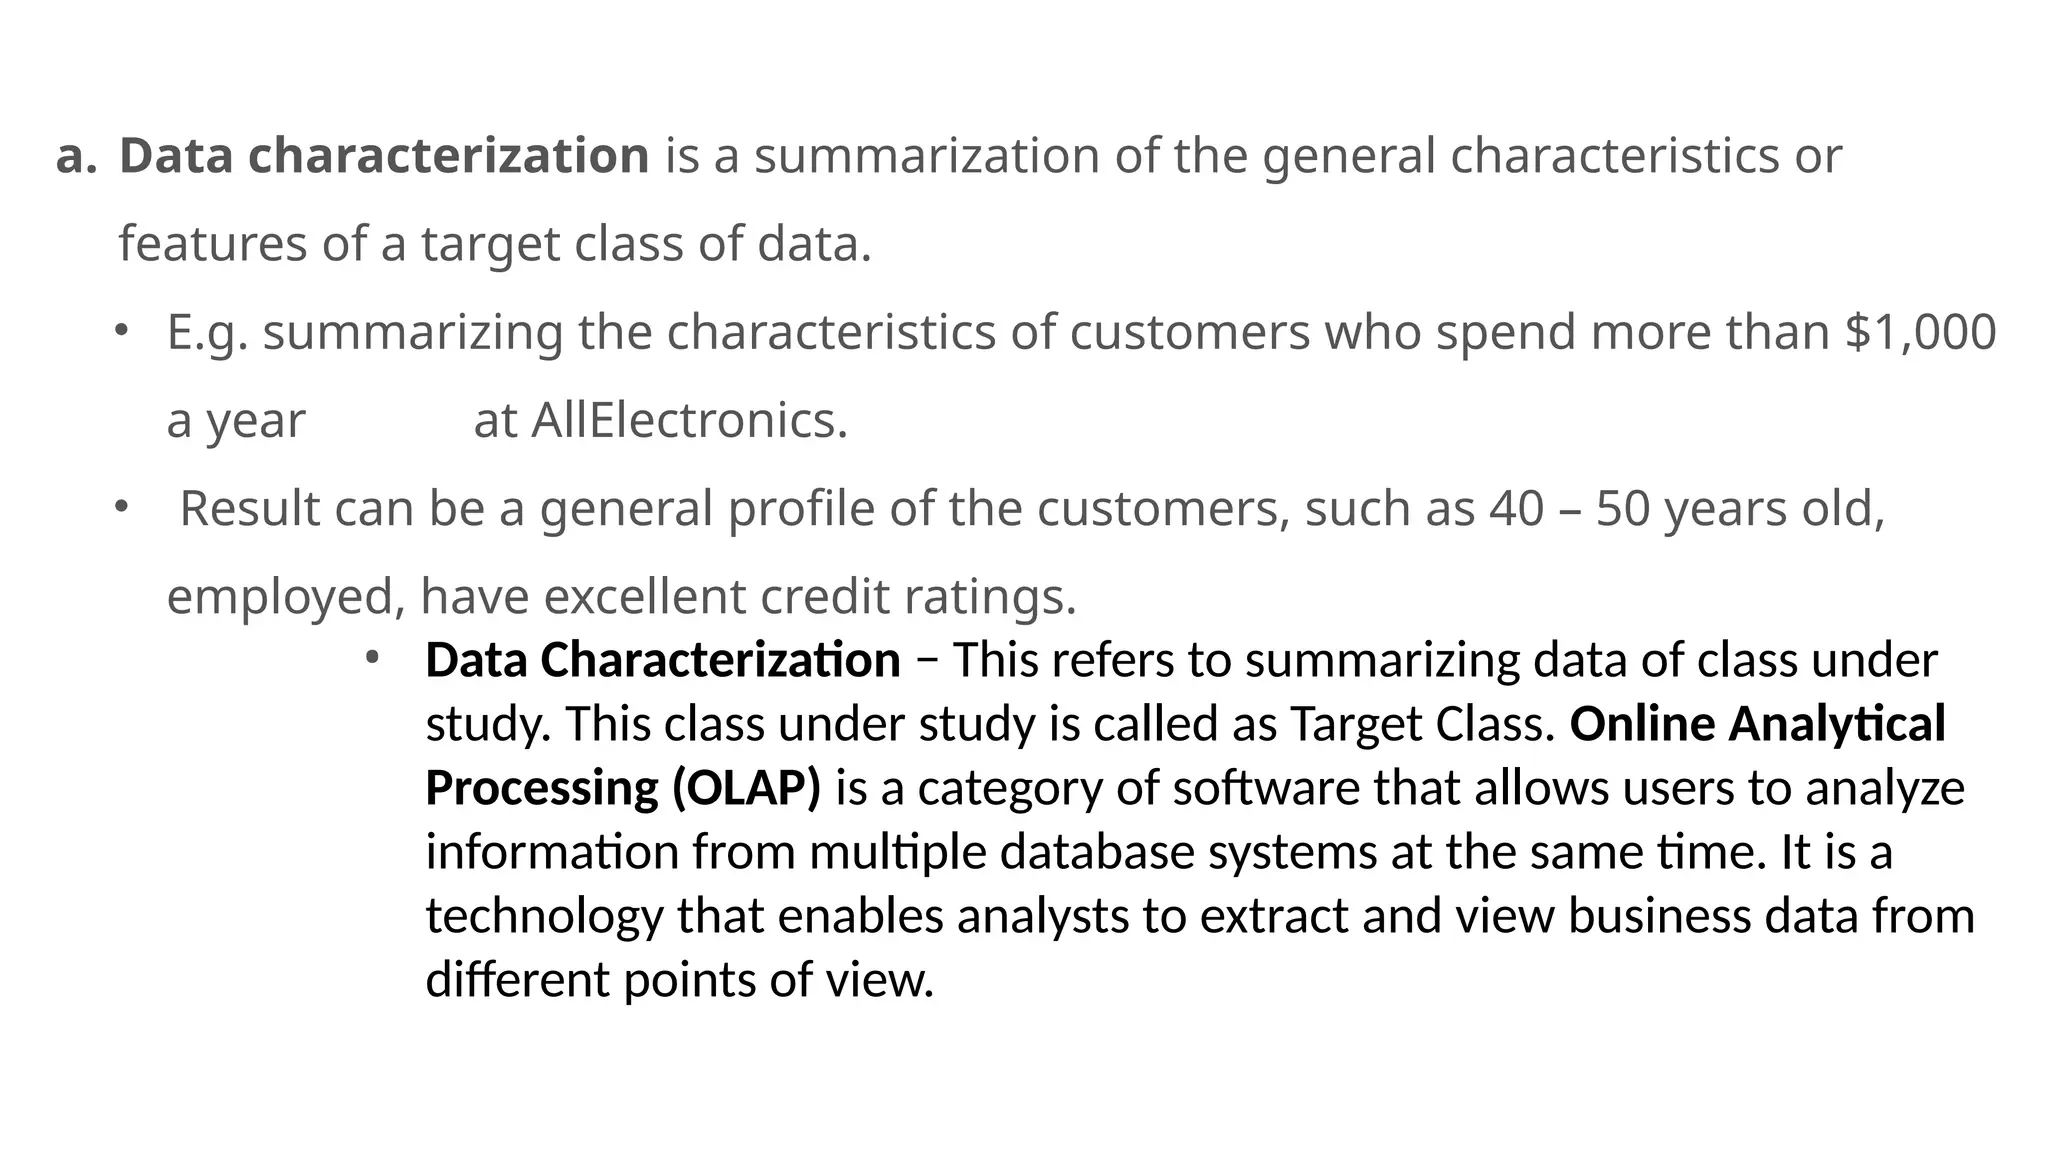
a. Data characterizationis a summarization of the general characteristics or
features of a target class of data.
• E.g. summarizing the characteristics of customers who spend more than $1,000
a year at AllElectronics.
• Result can be a general profile of the customers, such as 40 – 50 years old,
employed, have excellent credit ratings.
• Data Characterization − This refers to summarizing data of class under
study. This class under study is called as Target Class. Online Analytical
Processing (OLAP) is a category of software that allows users to analyze
information from multiple database systems at the same time. It is a
technology that enables analysts to extract and view business data from
different points of view.
27.
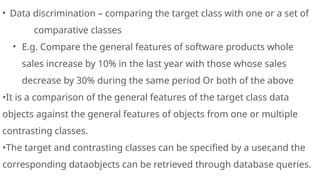
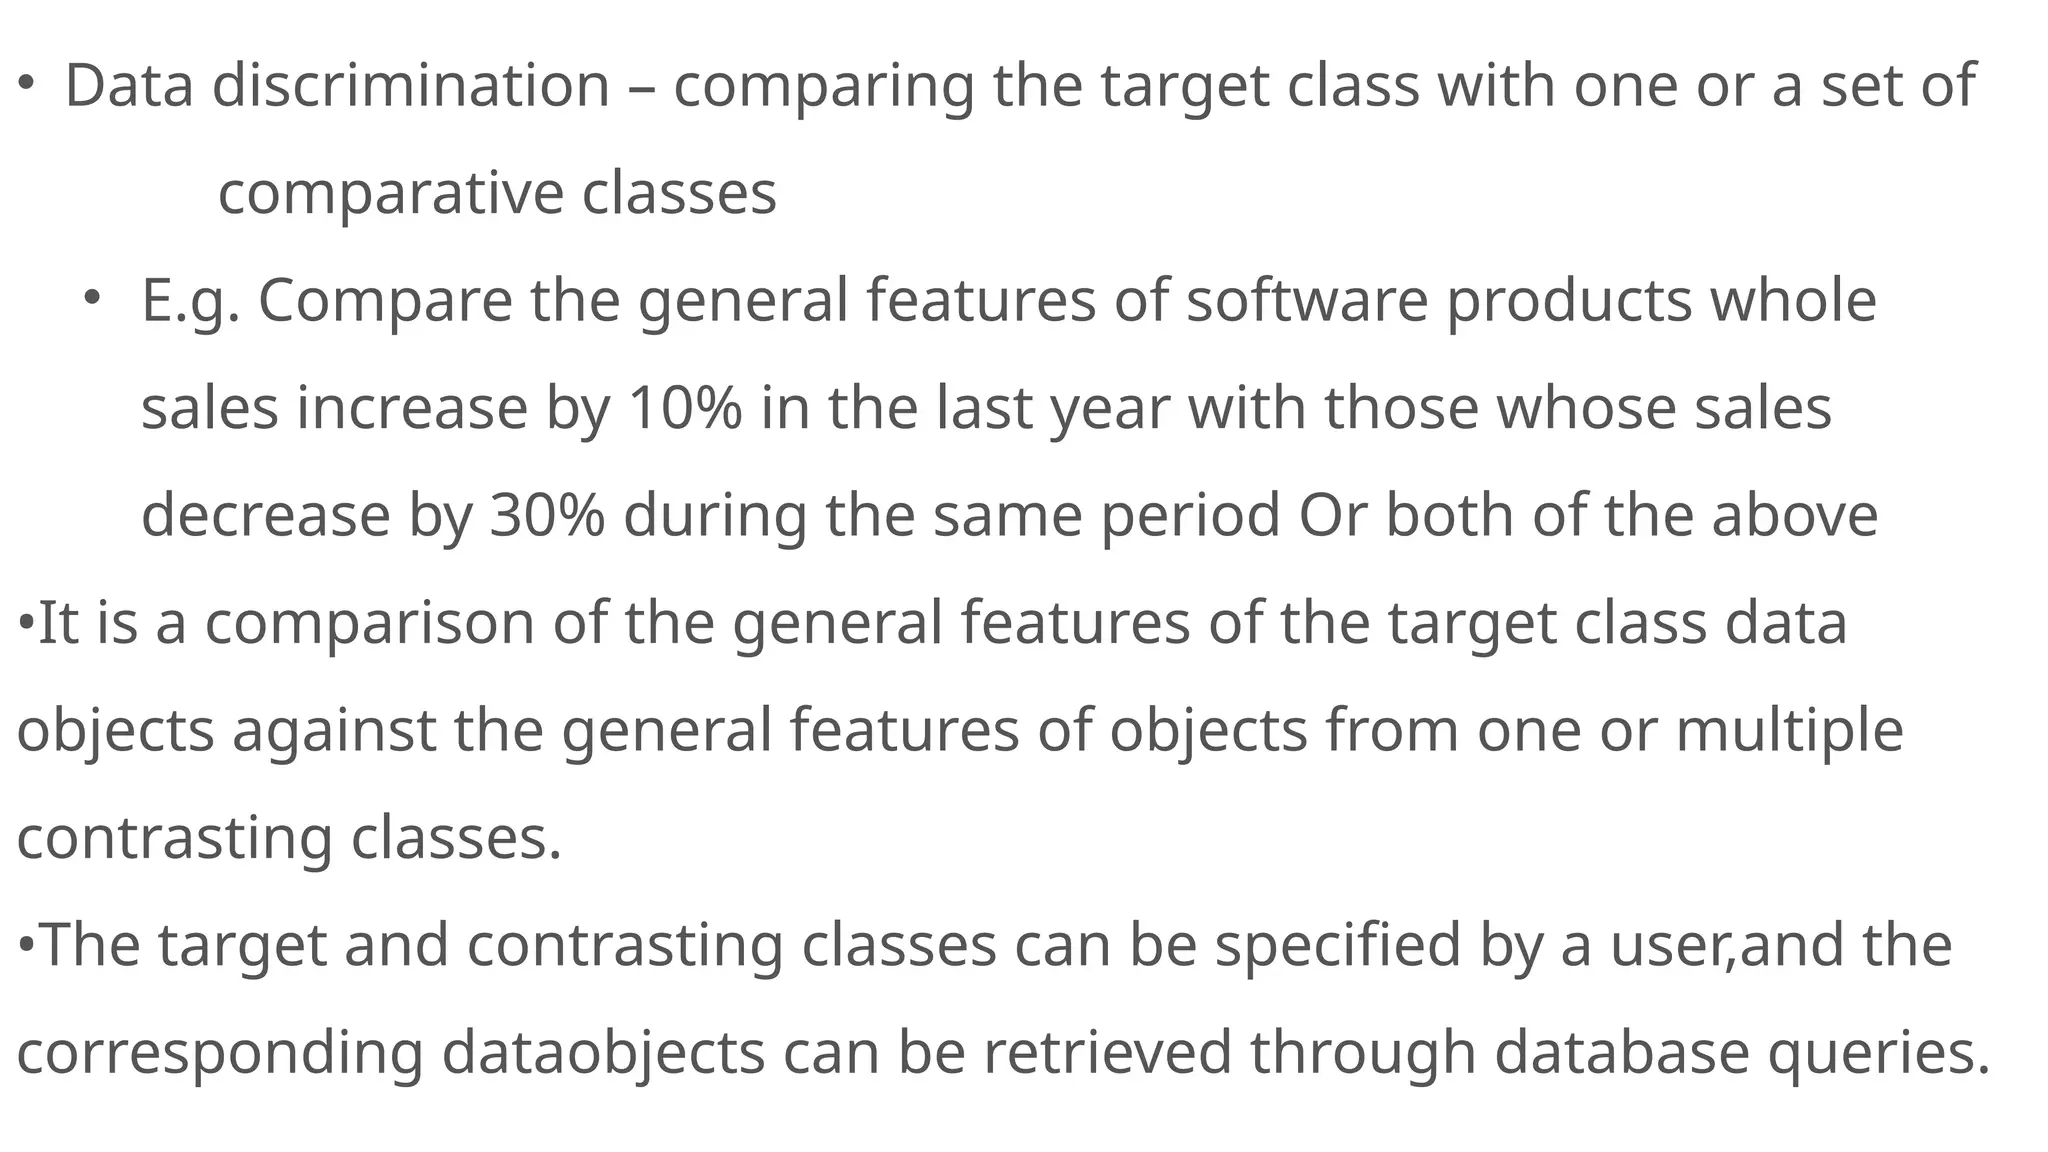
• Data discrimination– comparing the target class with one or a set of
comparative classes
• E.g. Compare the general features of software products whole
sales increase by 10% in the last year with those whose sales
decrease by 30% during the same period Or both of the above
•It is a comparison of the general features of the target class data
objects against the general features of objects from one or multiple
contrasting classes.
•The target and contrasting classes can be specified by a user,and the
corresponding dataobjects can be retrieved through database queries.
28.
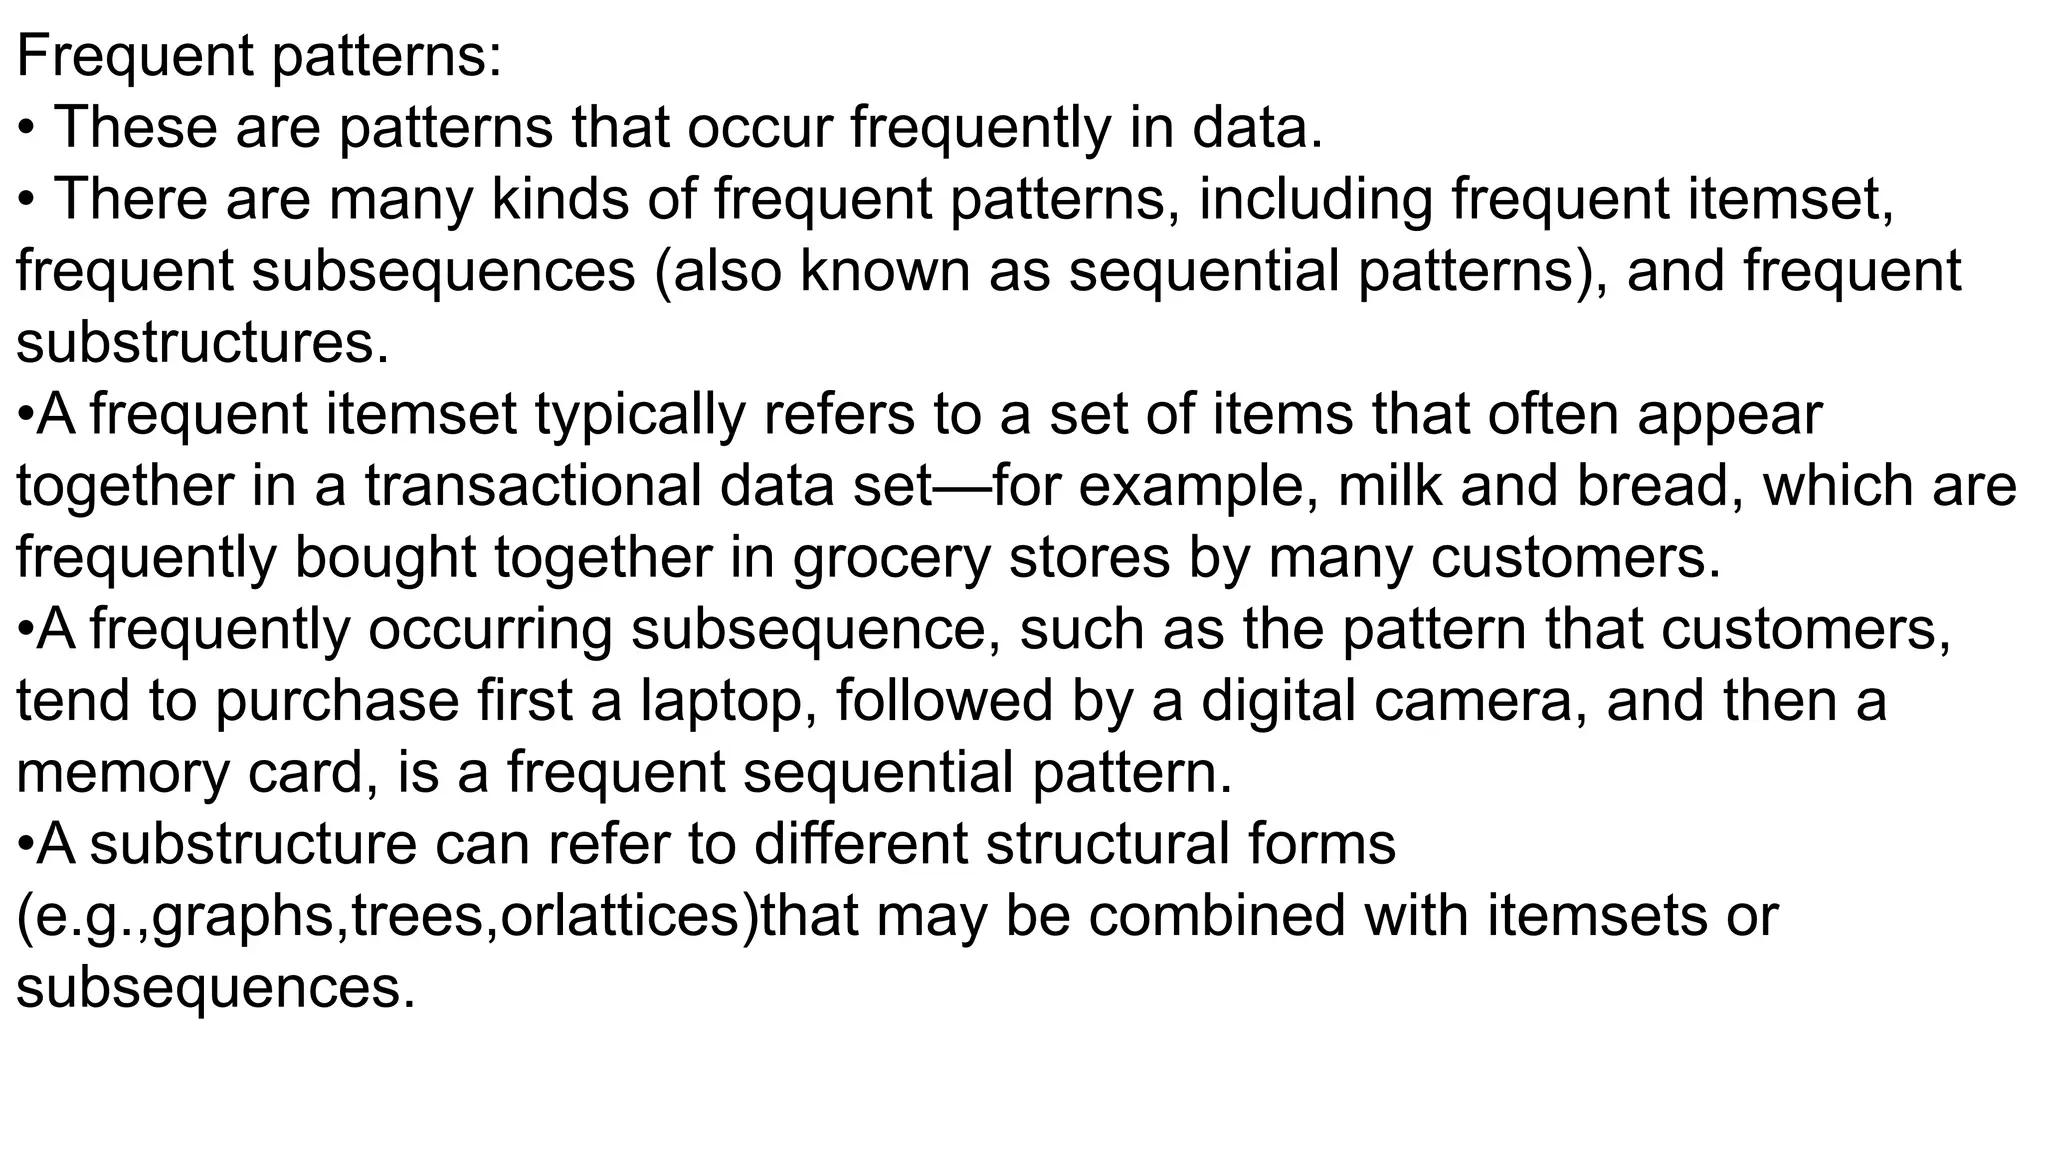
Frequent patterns:
• Theseare patterns that occur frequently in data.
• There are many kinds of frequent patterns, including frequent itemset,
frequent subsequences (also known as sequential patterns), and frequent
substructures.
•A frequent itemset typically refers to a set of items that often appear
together in a transactional data set—for example, milk and bread, which are
frequently bought together in grocery stores by many customers.
•A frequently occurring subsequence, such as the pattern that customers,
tend to purchase first a laptop, followed by a digital camera, and then a
memory card, is a frequent sequential pattern.
•A substructure can refer to different structural forms
(e.g.,graphs,trees,orlattices)that may be combined with itemsets or
subsequences.
29.
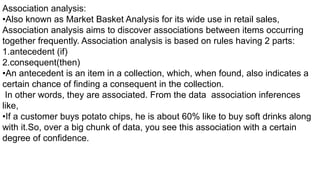
Association analysis:
•Also knownas Market Basket Analysis for its wide use in retail sales,
Association analysis aims to discover associations between items occurring
together frequently. Association analysis is based on rules having 2 parts:
1.antecedent (if)
2.consequent(then)
•An antecedent is an item in a collection, which, when found, also indicates a
certain chance of finding a consequent in the collection.
In other words, they are associated. From the data association inferences
like,
•If a customer buys potato chips, he is about 60% like to buy soft drinks along
with it.So, over a big chunk of data, you see this association with a certain
degree of confidence.
30.
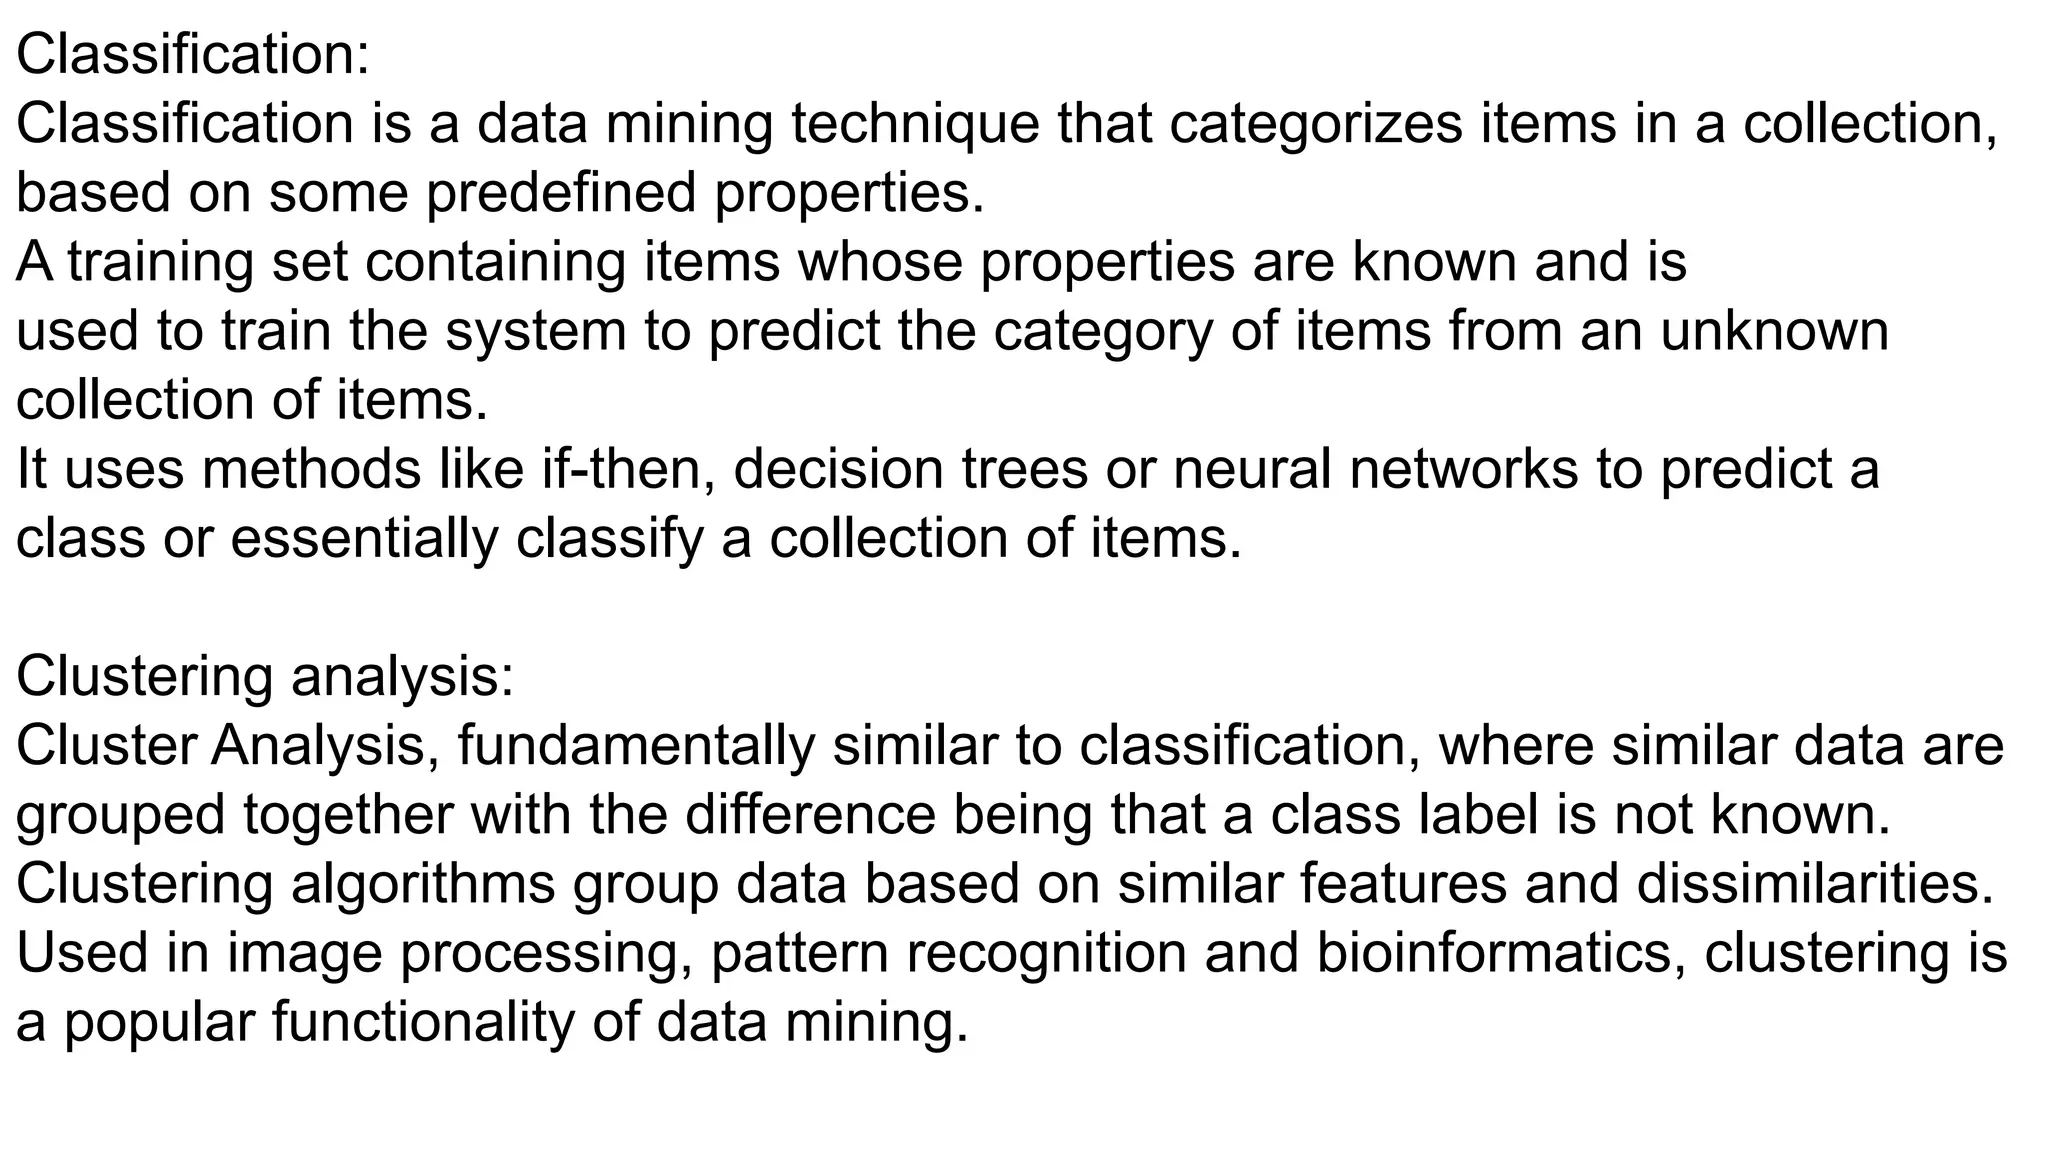
Classification:
Classification is adata mining technique that categorizes items in a collection,
based on some predefined properties.
A training set containing items whose properties are known and is
used to train the system to predict the category of items from an unknown
collection of items.
It uses methods like if-then, decision trees or neural networks to predict a
class or essentially classify a collection of items.
Clustering analysis:
Cluster Analysis, fundamentally similar to classification, where similar data are
grouped together with the difference being that a class label is not known.
Clustering algorithms group data based on similar features and dissimilarities.
Used in image processing, pattern recognition and bioinformatics, clustering is
a popular functionality of data mining.
31.
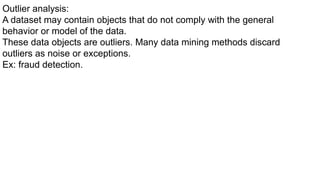
Outlier analysis:
A datasetmay contain objects that do not comply with the general
behavior or model of the data.
These data objects are outliers. Many data mining methods discard
outliers as noise or exceptions.
Ex: fraud detection.
32.
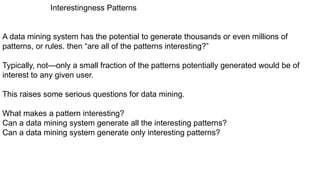
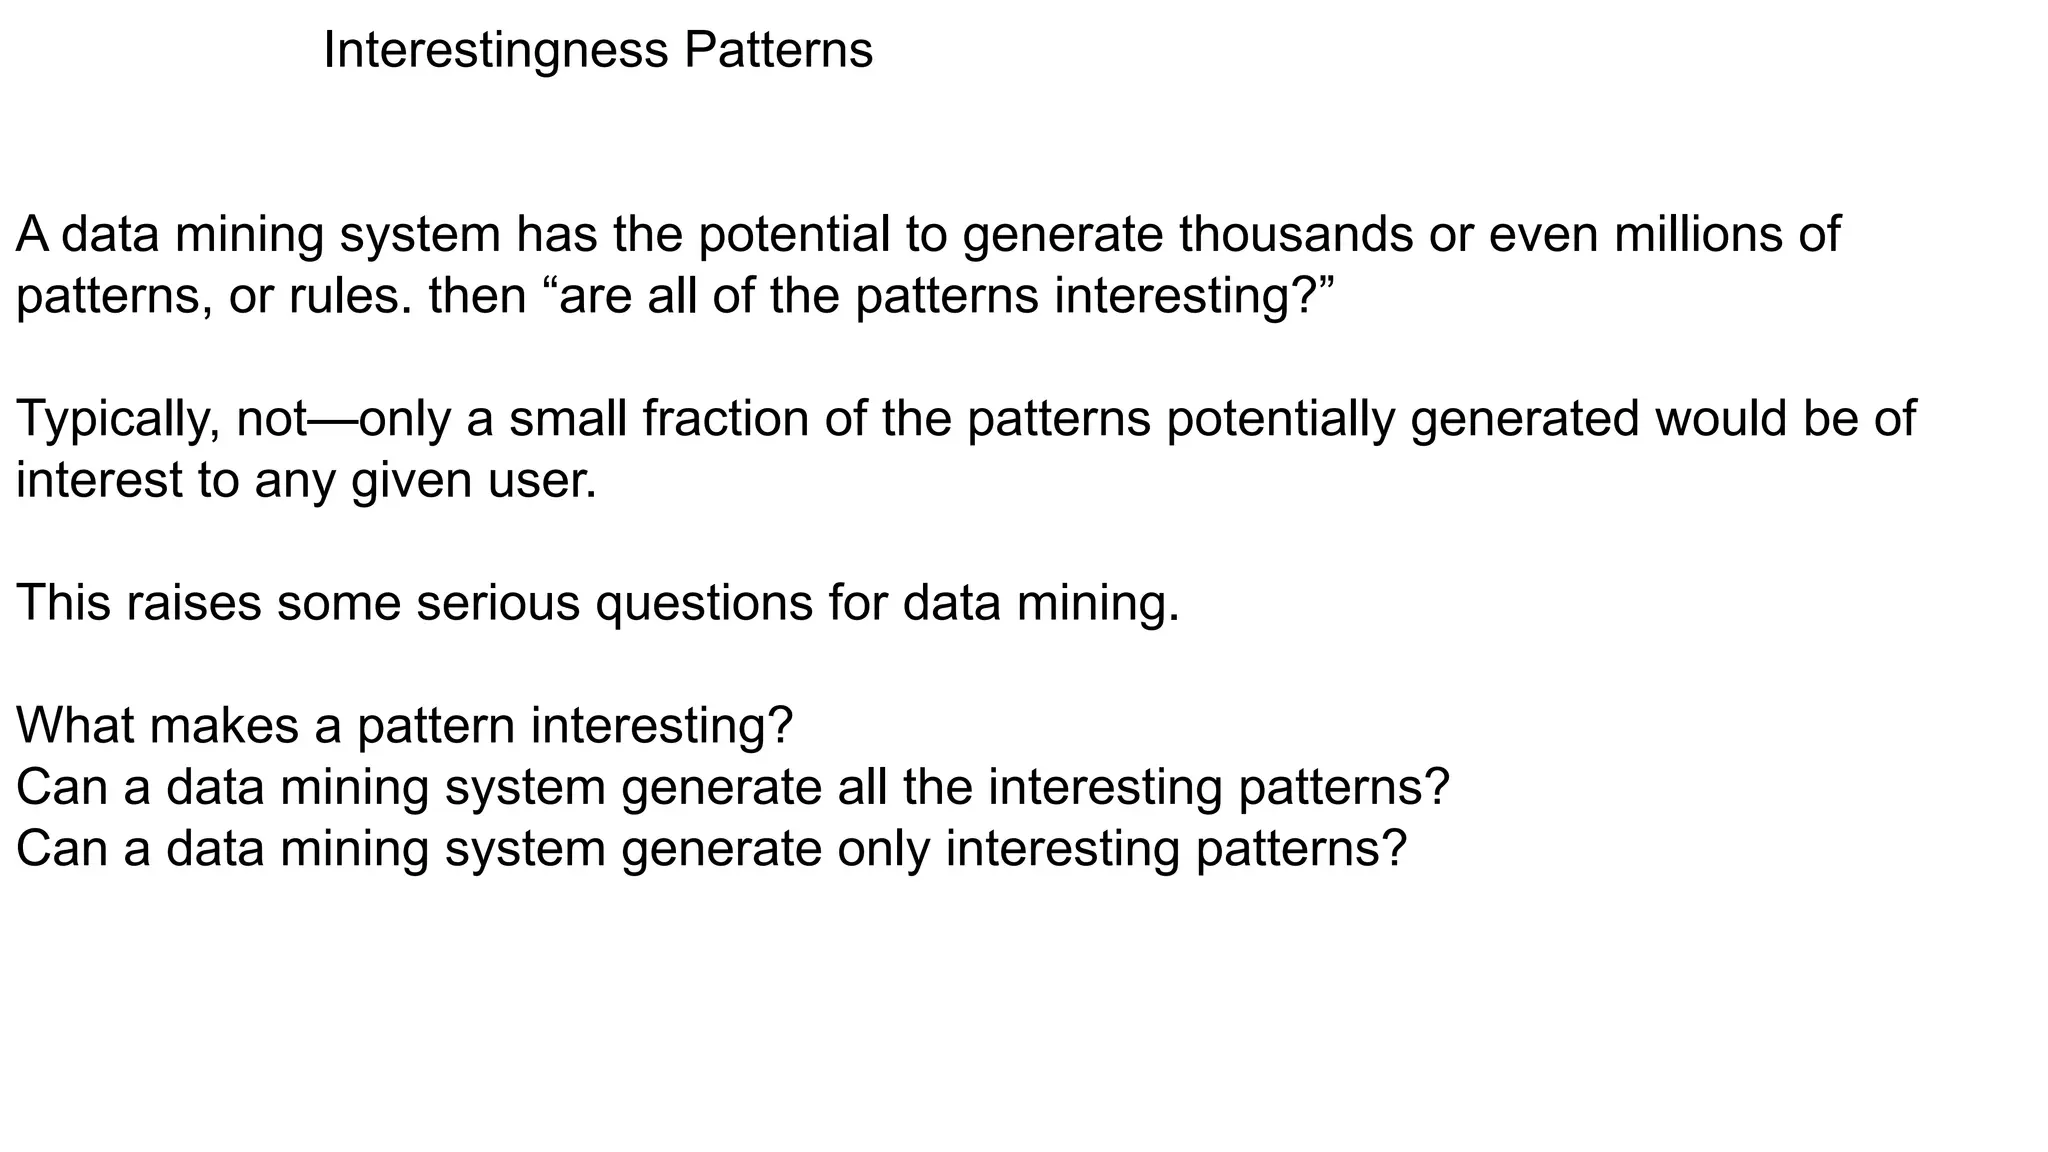
Interestingness Patterns
A datamining system has the potential to generate thousands or even millions of
patterns, or rules. then “are all of the patterns interesting?”
Typically, not—only a small fraction of the patterns potentially generated would be of
interest to any given user.
This raises some serious questions for data mining.
What makes a pattern interesting?
Can a data mining system generate all the interesting patterns?
Can a data mining system generate only interesting patterns?
33.
the first question,a pattern is interesting if it is
easily understood by humans,
valid on new or test data with some degree of certainty, potentially useful,
and novel.
The second question―Can a data mining system generate all the
interestingpatterns?--refers to the completeness of a data mining algorithm.
It is often unrealistic and inefficient for data mining systems to generate all
the possible patterns.
Instead, user-provided constraints and interestingness measures should be
used to focus the search.
A data mining algorithm is complete if it mines all interesting patterns.
Finally, the third question -- “Can a data mining system generate only
interesting patterns?”— is an optimization problem in data mining. It is highly
desirable for datamining systems to generate only interesting patterns.An
interesting pattern represents knowledge
34.
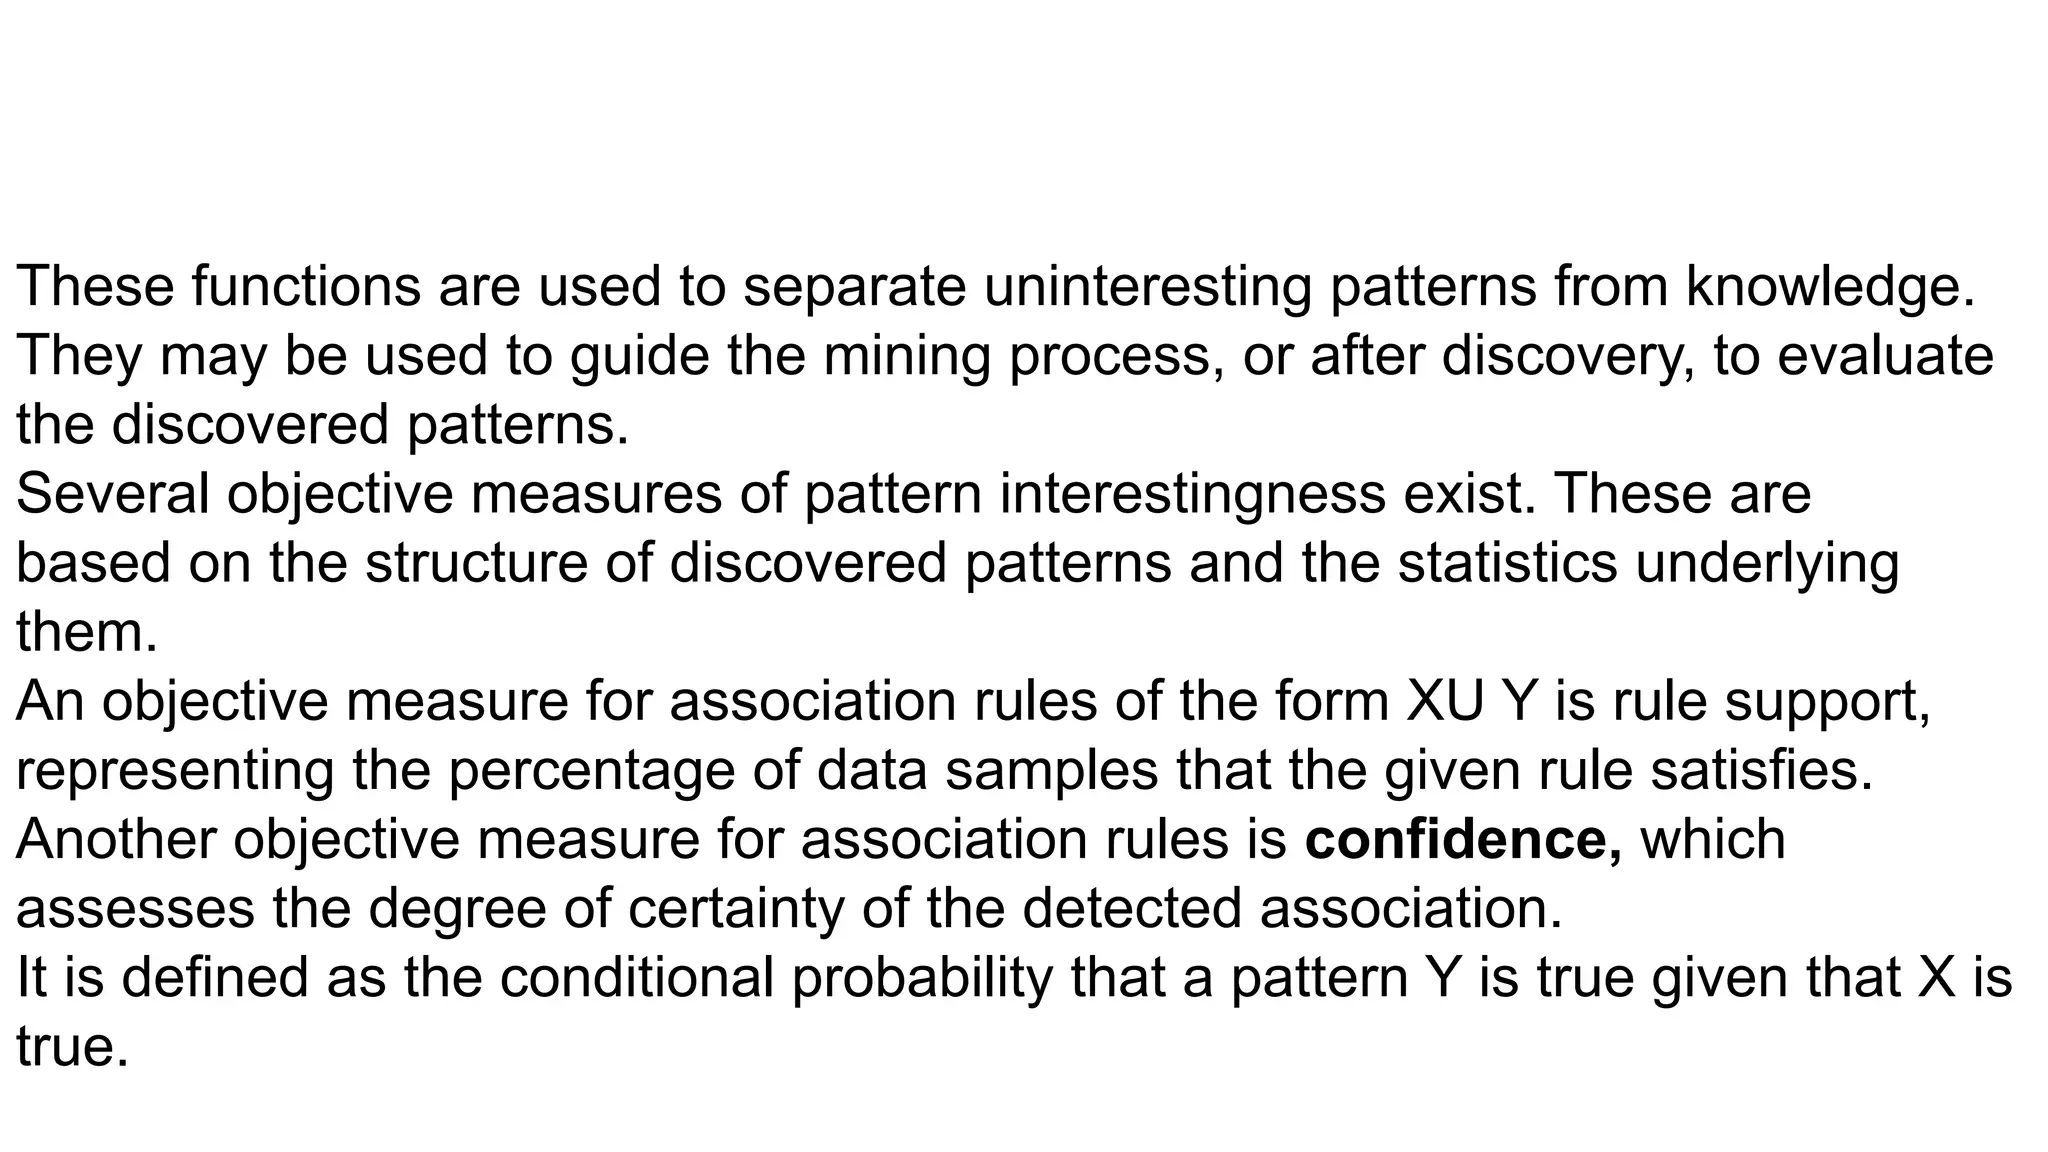
These functions areused to separate uninteresting patterns from knowledge.
They may be used to guide the mining process, or after discovery, to evaluate
the discovered patterns.
Several objective measures of pattern interestingness exist. These are
based on the structure of discovered patterns and the statistics underlying
them.
An objective measure for association rules of the form XU Y is rule support,
representing the percentage of data samples that the given rule satisfies.
Another objective measure for association rules is confidence, which
assesses the degree of certainty of the detected association.
It is defined as the conditional probability that a pattern Y is true given that X is
true.
35.
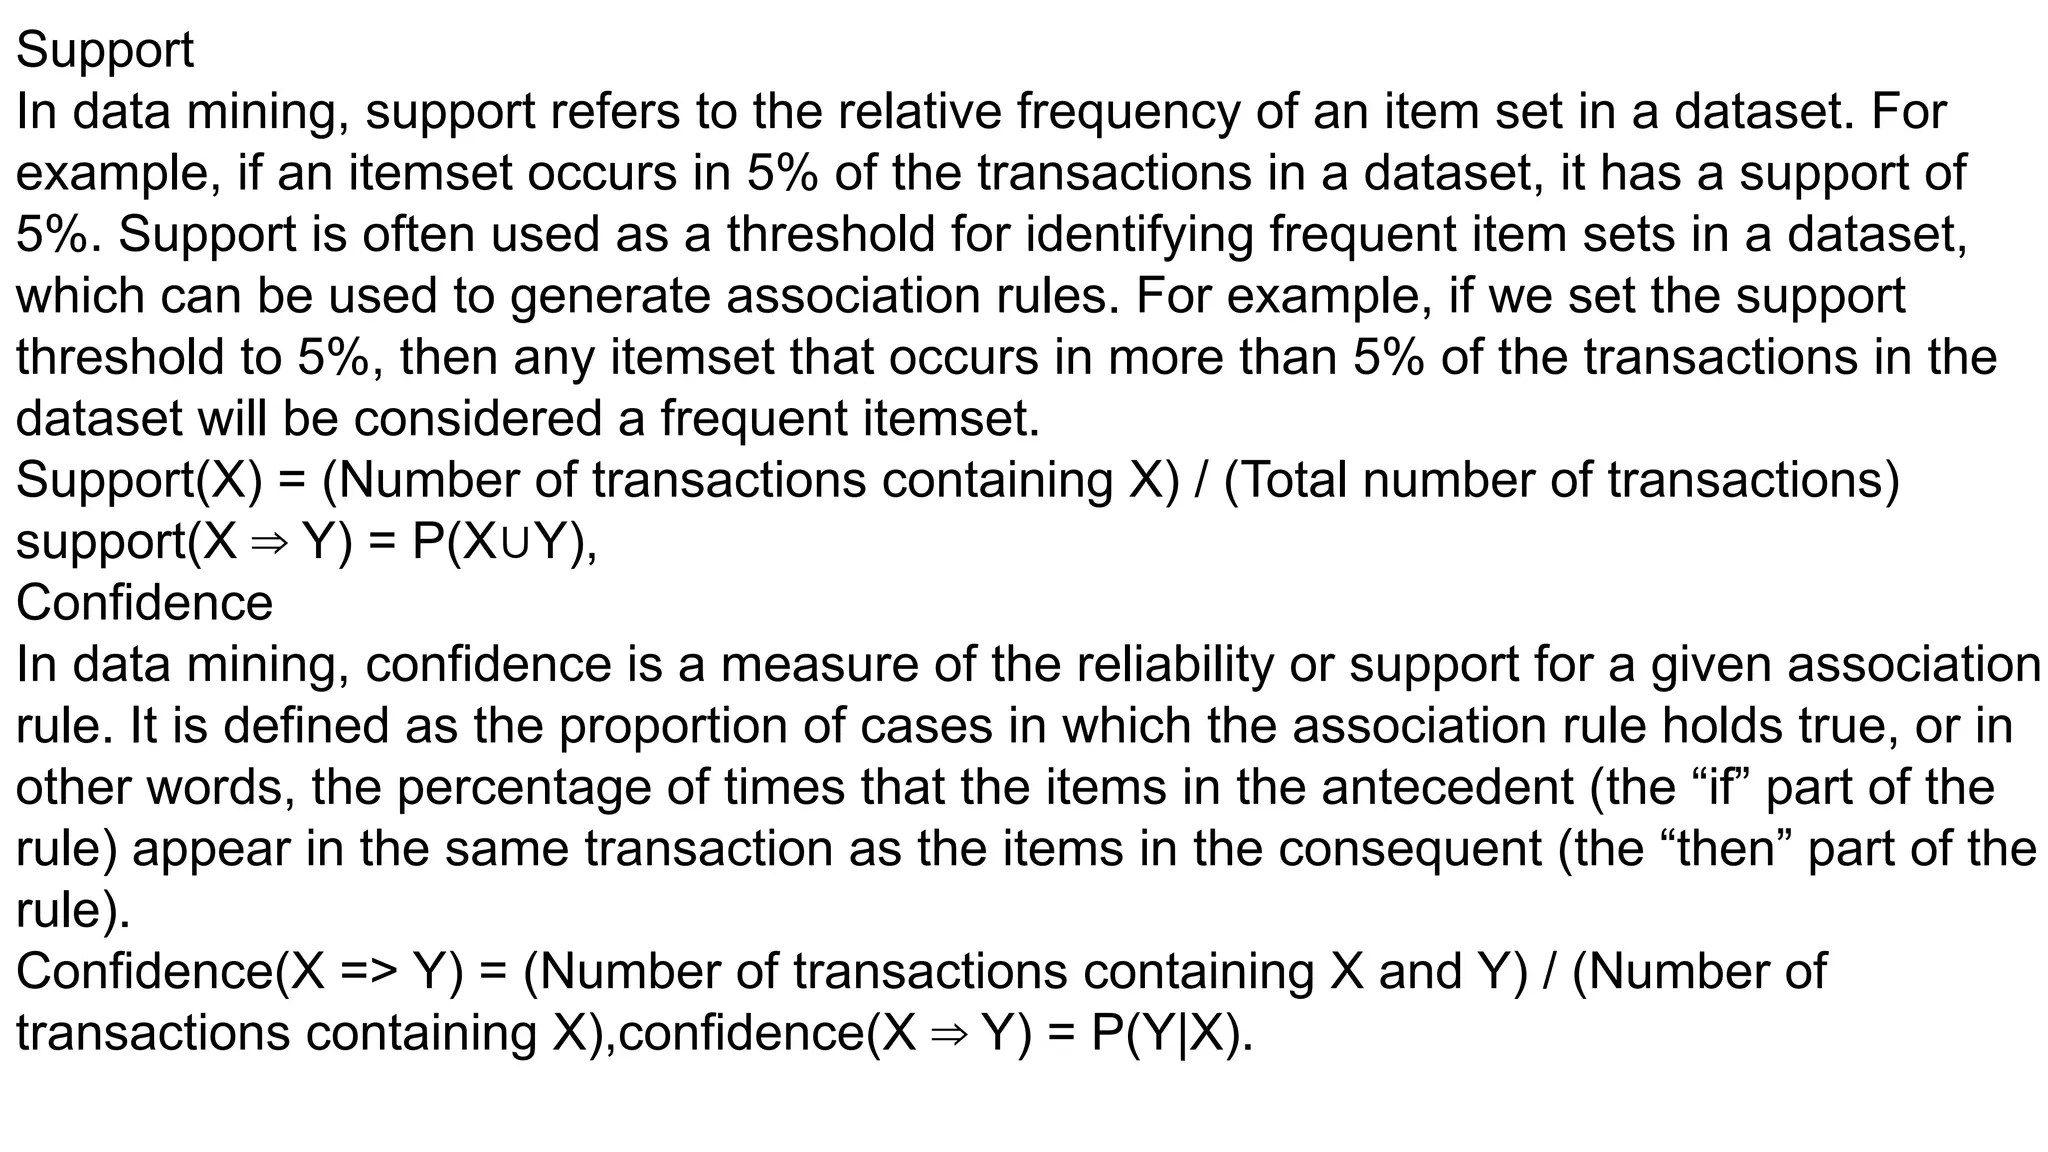
Support
In data mining,support refers to the relative frequency of an item set in a dataset. For
example, if an itemset occurs in 5% of the transactions in a dataset, it has a support of
5%. Support is often used as a threshold for identifying frequent item sets in a dataset,
which can be used to generate association rules. For example, if we set the support
threshold to 5%, then any itemset that occurs in more than 5% of the transactions in the
dataset will be considered a frequent itemset.
Support(X) = (Number of transactions containing X) / (Total number of transactions)
support(X Y) = P(X Y),
⇒ ∪
Confidence
In data mining, confidence is a measure of the reliability or support for a given association
rule. It is defined as the proportion of cases in which the association rule holds true, or in
other words, the percentage of times that the items in the antecedent (the “if” part of the
rule) appear in the same transaction as the items in the consequent (the “then” part of the
rule).
Confidence(X => Y) = (Number of transactions containing X and Y) / (Number of
transactions containing X),confidence(X Y) = P(Y|X).
⇒
37.
1.4 DataMining TaskPrimitives:
Refer to the basic building blocks or components used to construct a data mining
process.
Represent common and fundamental tasks performed during data mining.
Allow users to interactively communicate with the data mining system during
discovery.
A data mining task can be specified in the form of a data mining query, which is input
to the data mining system.
These primitives allow the user to interactively communicate with the data mining
system during the mining process to discover interesting patterns.
List of Data Mining Task Primitives
Set of task relevant data to be mined.
Kind of knowledge to be mined.
Background knowledge to be used in discovery process.
Interestingness measures and thresholds for pattern evaluation.
Representation for visualizing the discovered patterns.
38.
Set of taskrelevant data to be mined:This specifies the portions of the database or the set
of data in which the user is interested, which includes
TDatabase Attributes
Data Warehouse dimensions of interest
For example, suppose that you are a manager of All Electronics in charge of sales in the
United States and Canada. You would like to study the buying trends of customers in
Canada. Rather than mining on the entire database. These are referred to as relevant
attributes.
Kind of knowledge to be mined: This specifies the data mining functions to be performed,
such as
Characterization& Discrimination
Association
Classification
Clustering
Prediction
Outlier analysis
For instance, if studying the buying habits of customers in Canada, you may choose to mine
associations between customer profiles and the items that these customers like to buy.
39.
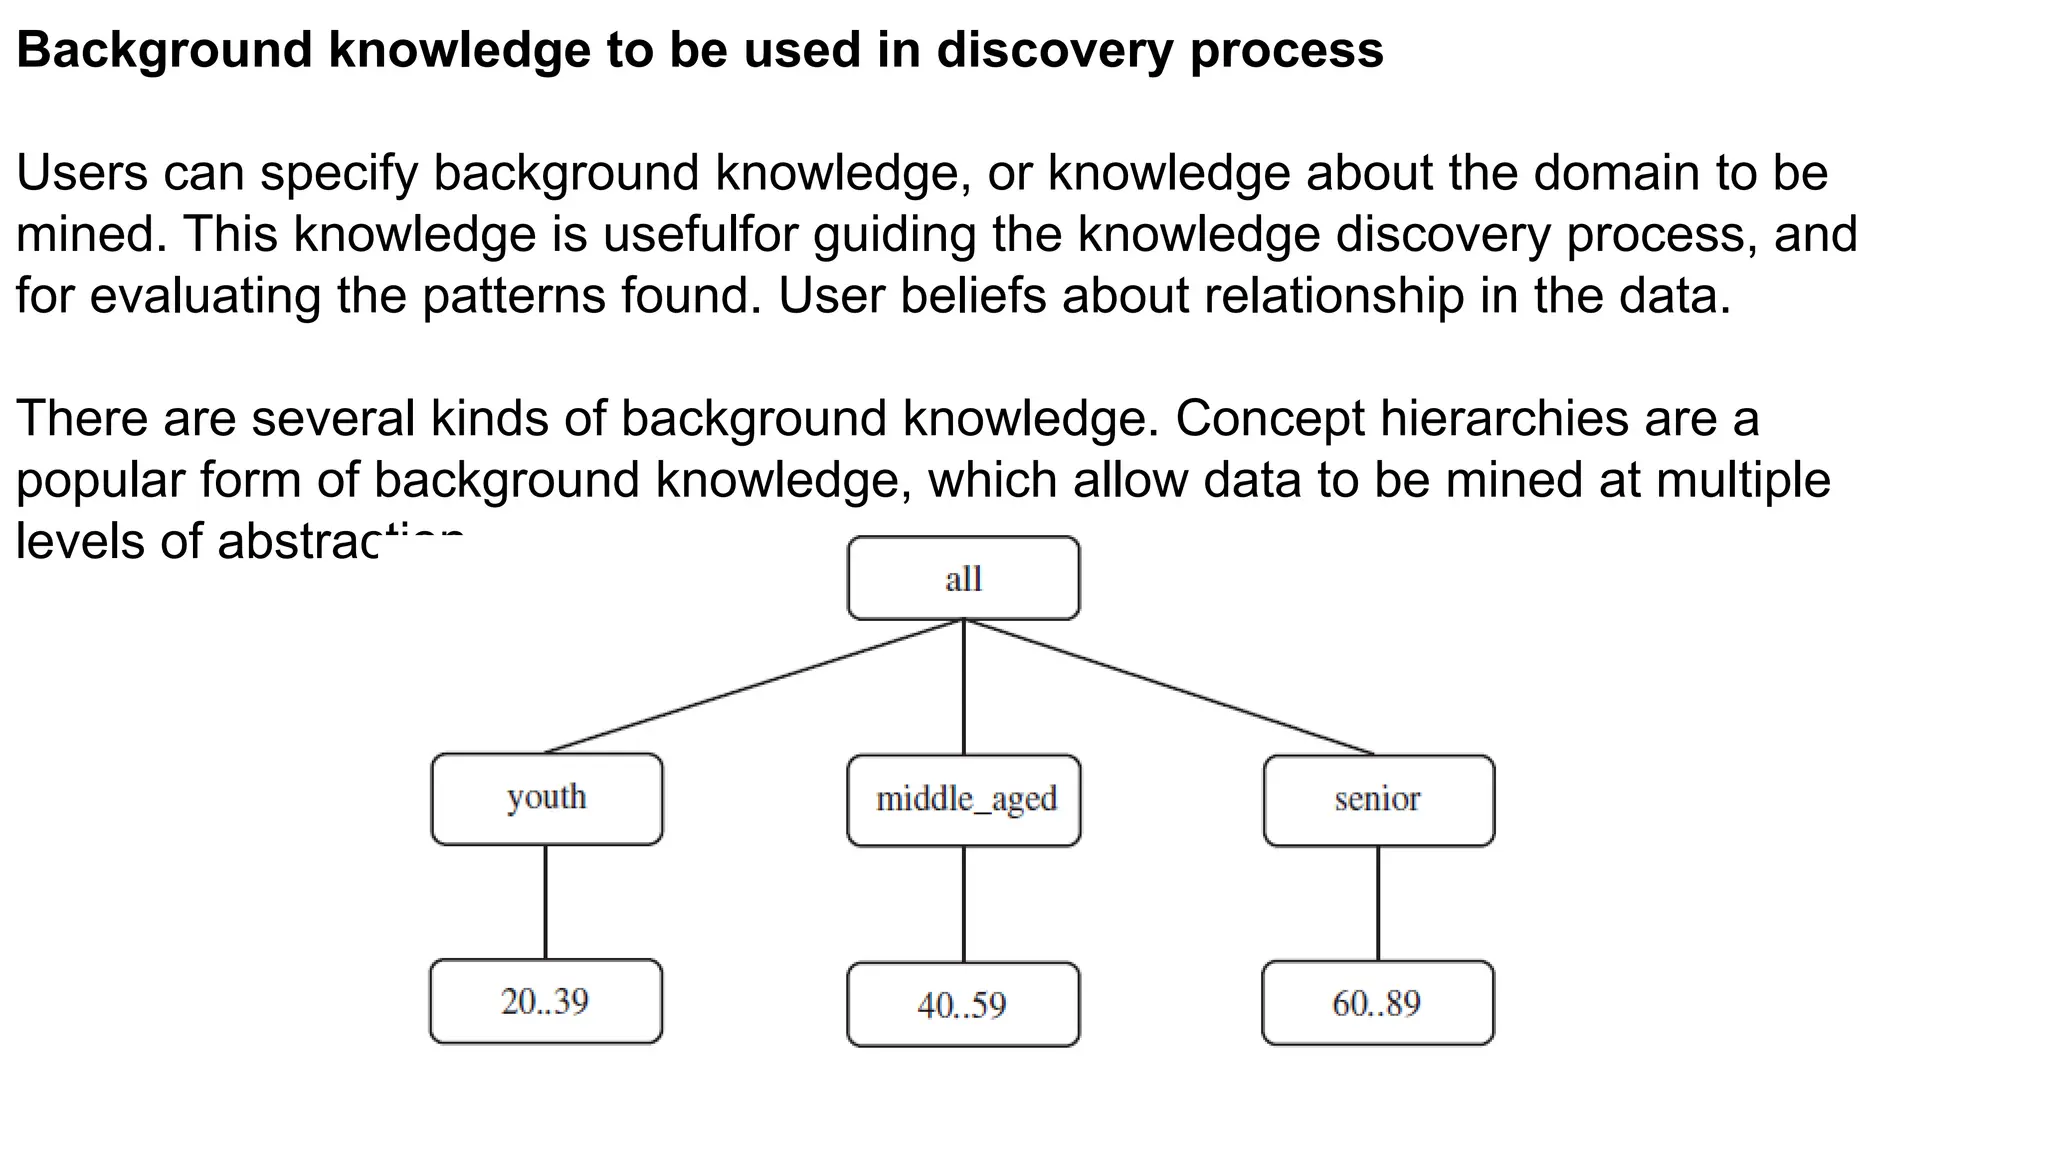
Background knowledge tobe used in discovery process
Users can specify background knowledge, or knowledge about the domain to be
mined. This knowledge is usefulfor guiding the knowledge discovery process, and
for evaluating the patterns found. User beliefs about relationship in the data.
There are several kinds of background knowledge. Concept hierarchies are a
popular form of background knowledge, which allow data to be mined at multiple
levels of abstraction.-
40.
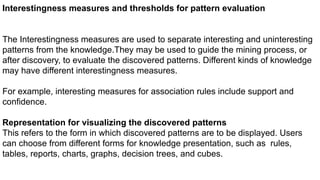
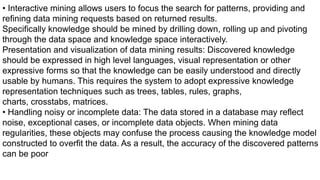
Interestingness measures andthresholds for pattern evaluation
The Interestingness measures are used to separate interesting and uninteresting
patterns from the knowledge.They may be used to guide the mining process, or
after discovery, to evaluate the discovered patterns. Different kinds of knowledge
may have different interestingness measures.
For example, interesting measures for association rules include support and
confidence.
Representation for visualizing the discovered patterns
This refers to the form in which discovered patterns are to be displayed. Users
can choose from different forms for knowledge presentation, such as rules,
tables, reports, charts, graphs, decision trees, and cubes.
41.
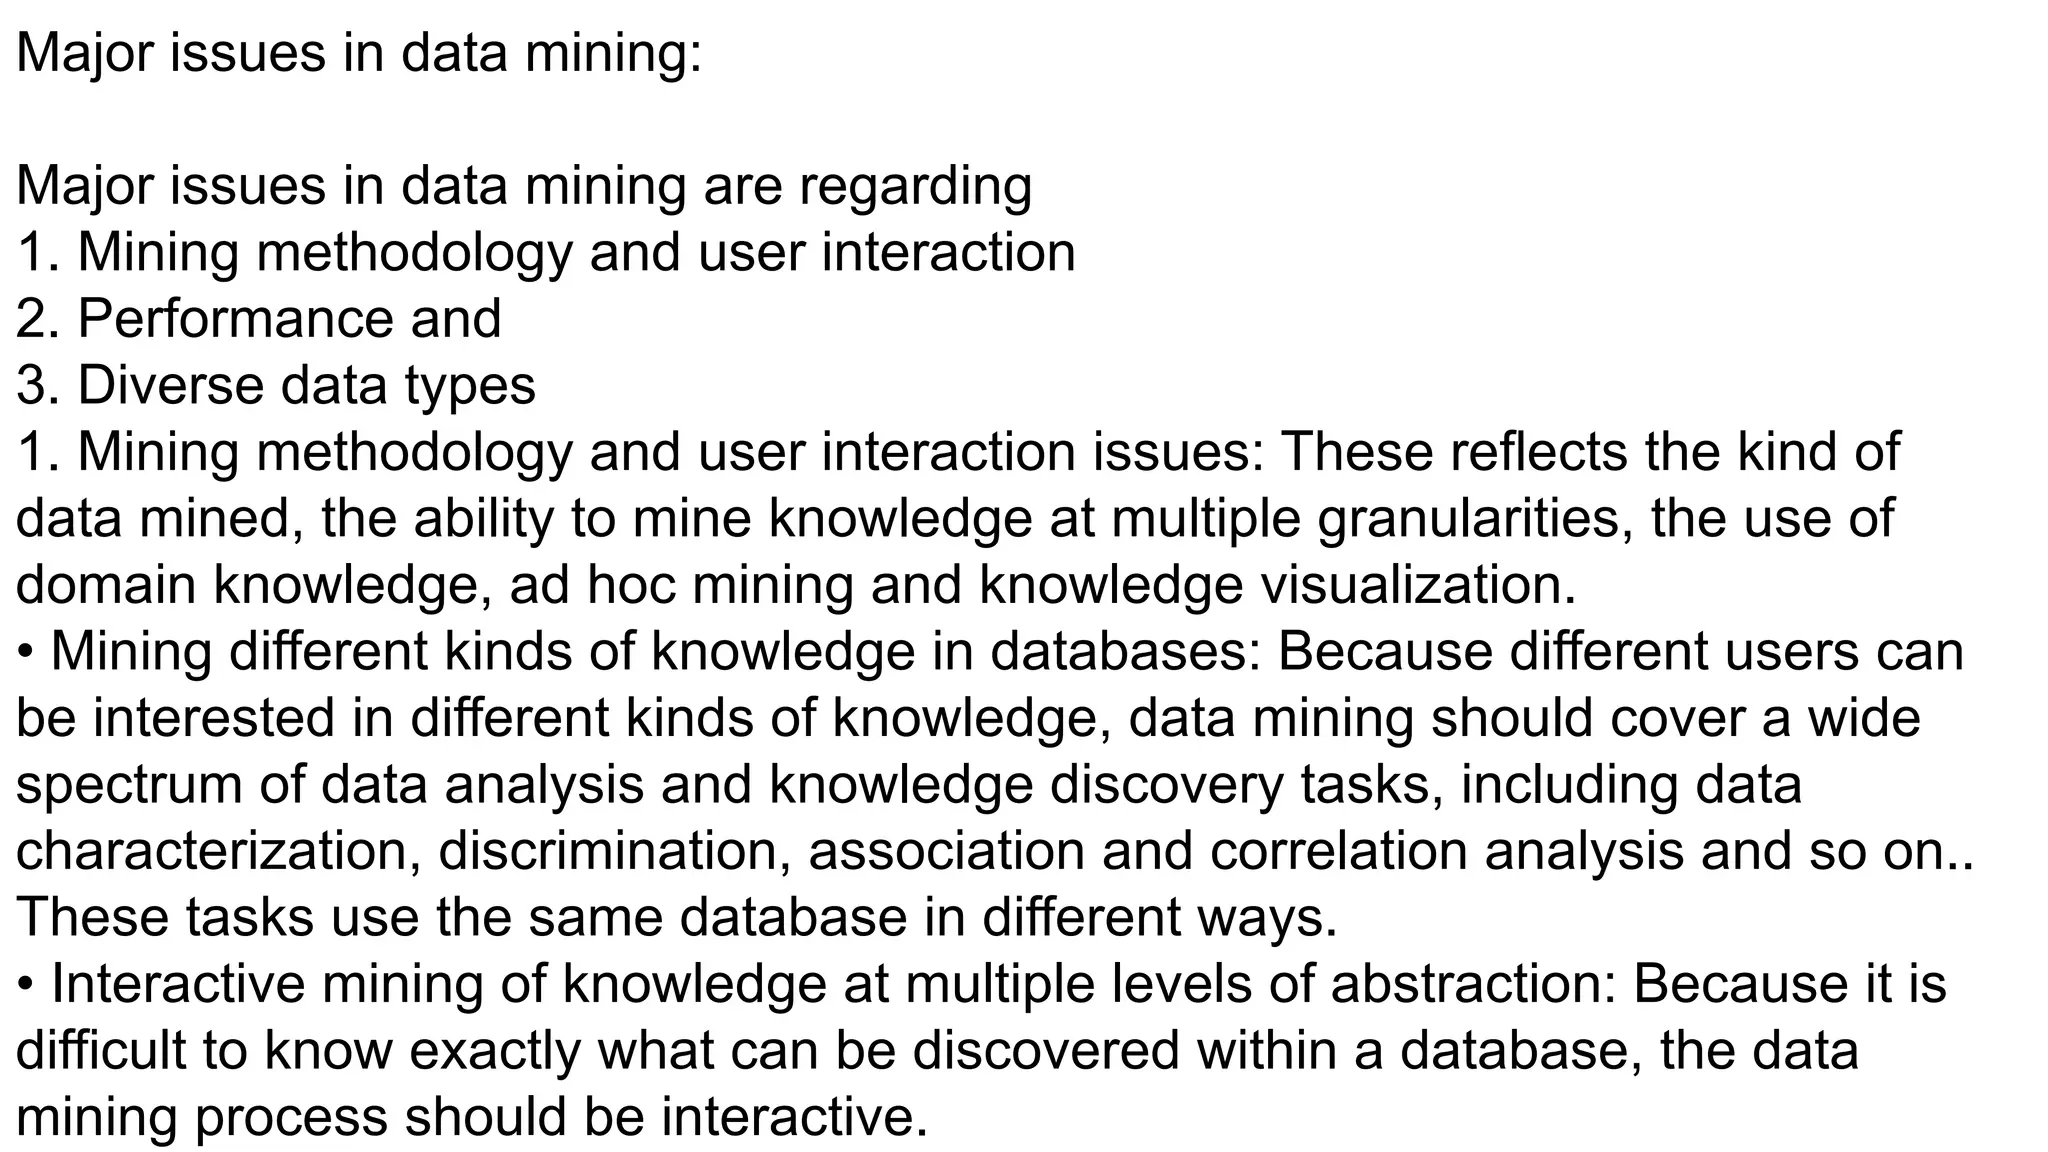
Major issues indata mining:
Major issues in data mining are regarding
1. Mining methodology and user interaction
2. Performance and
3. Diverse data types
1. Mining methodology and user interaction issues: These reflects the kind of
data mined, the ability to mine knowledge at multiple granularities, the use of
domain knowledge, ad hoc mining and knowledge visualization.
• Mining different kinds of knowledge in databases: Because different users can
be interested in different kinds of knowledge, data mining should cover a wide
spectrum of data analysis and knowledge discovery tasks, including data
characterization, discrimination, association and correlation analysis and so on..
These tasks use the same database in different ways.
• Interactive mining of knowledge at multiple levels of abstraction: Because it is
difficult to know exactly what can be discovered within a database, the data
mining process should be interactive.
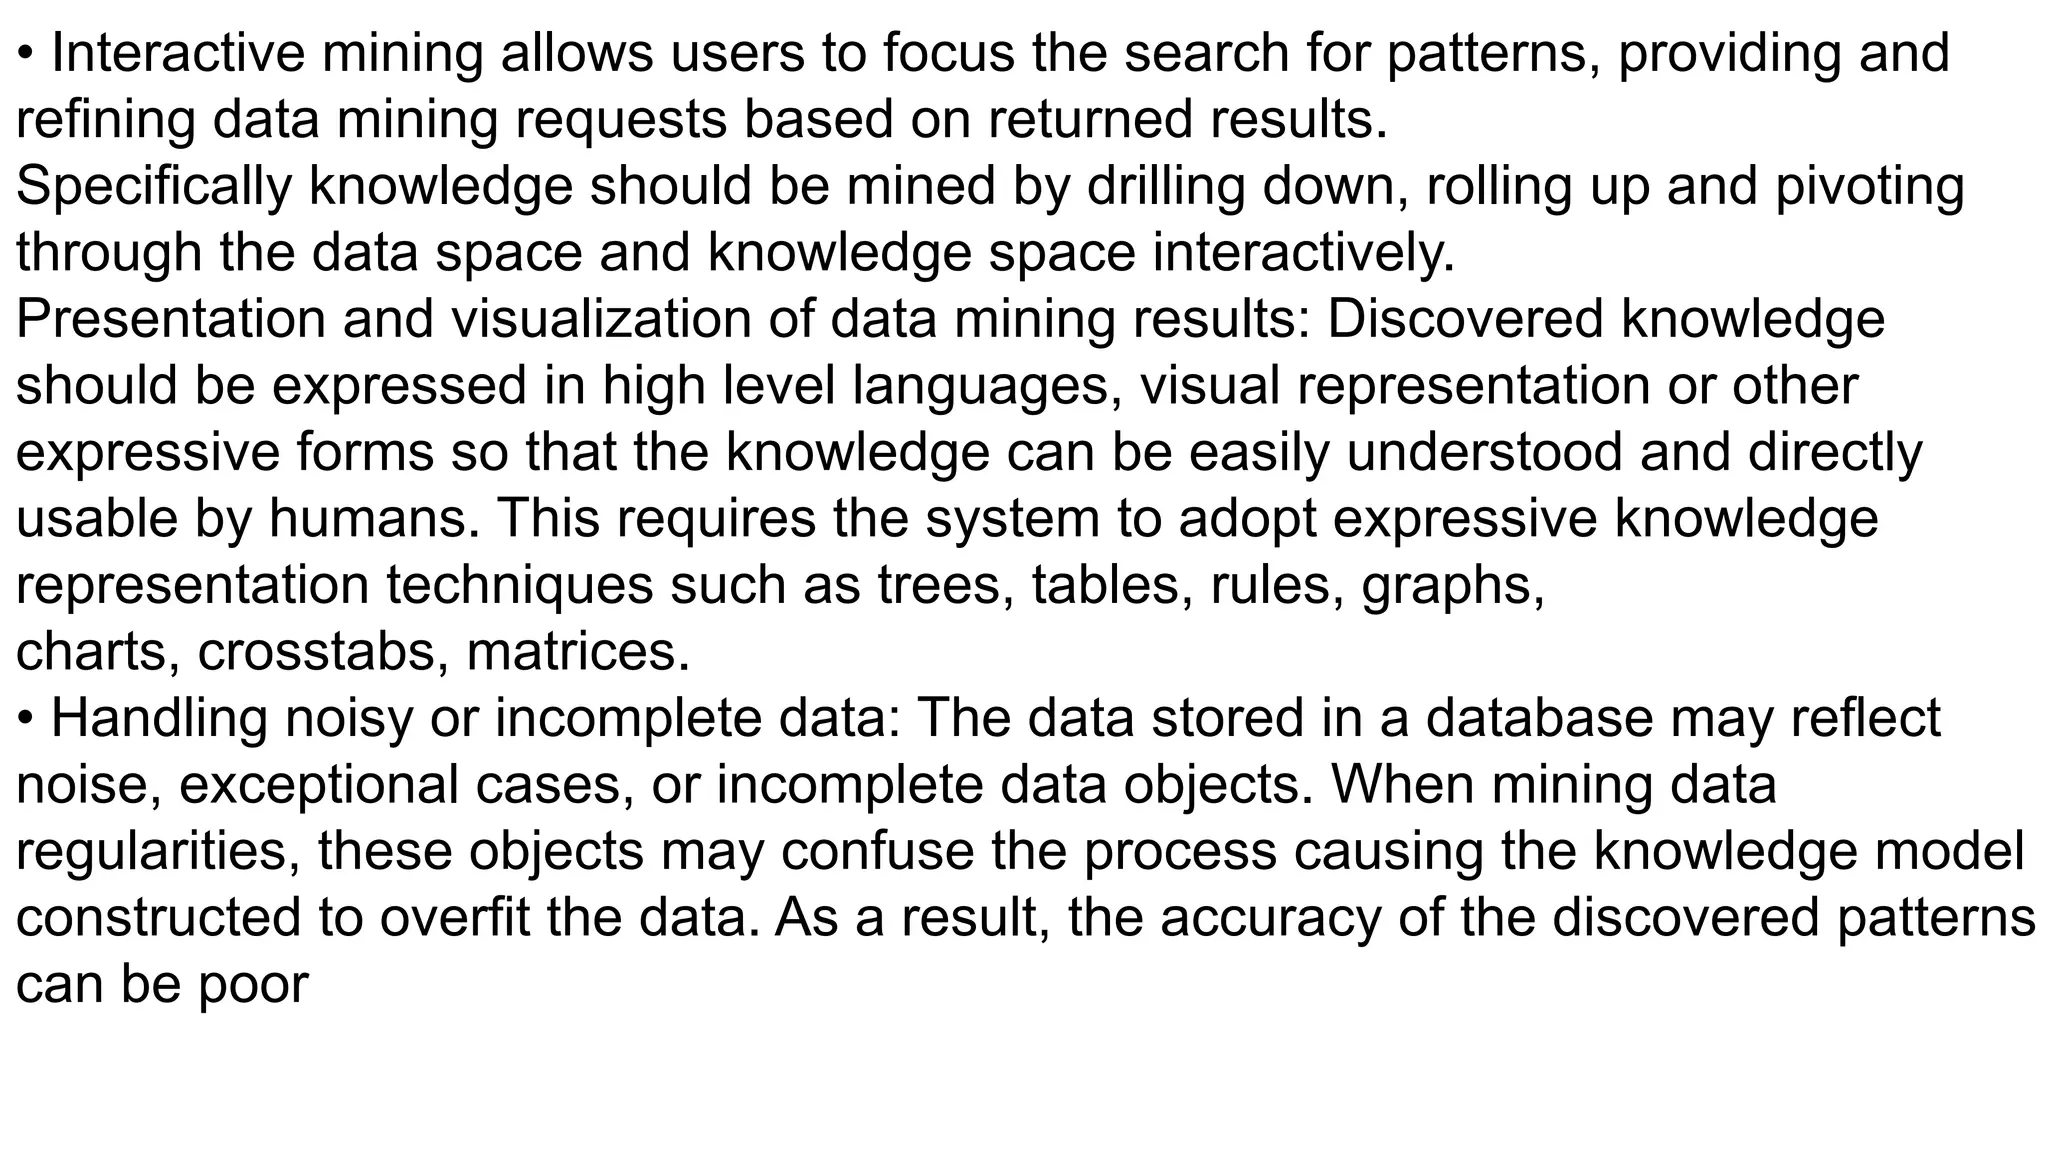
42.
• Interactive miningallows users to focus the search for patterns, providing and
refining data mining requests based on returned results.
Specifically knowledge should be mined by drilling down, rolling up and pivoting
through the data space and knowledge space interactively.
Presentation and visualization of data mining results: Discovered knowledge
should be expressed in high level languages, visual representation or other
expressive forms so that the knowledge can be easily understood and directly
usable by humans. This requires the system to adopt expressive knowledge
representation techniques such as trees, tables, rules, graphs,
charts, crosstabs, matrices.
• Handling noisy or incomplete data: The data stored in a database may reflect
noise, exceptional cases, or incomplete data objects. When mining data
regularities, these objects may confuse the process causing the knowledge model
constructed to overfit the data. As a result, the accuracy of the discovered patterns
can be poor
43.
Pattern Evaluation-the interestingnessproblem: A data mining system
can uncover thousands of patterns.
Many of the patterns discovered may be uninteresting to the given user,
either because they represent common knowledge or lack novelty.
Several challenges remain regarding the development of techniques to
assess the interestingness of discovered patterns.
• Incorporation of background Knowledge: Background knowledge or
information regarding the domain under study, may be used to guide the
discovery process and allow the discovered patterns to be expressed in
concise terms and at different levels of abstraction.
44.
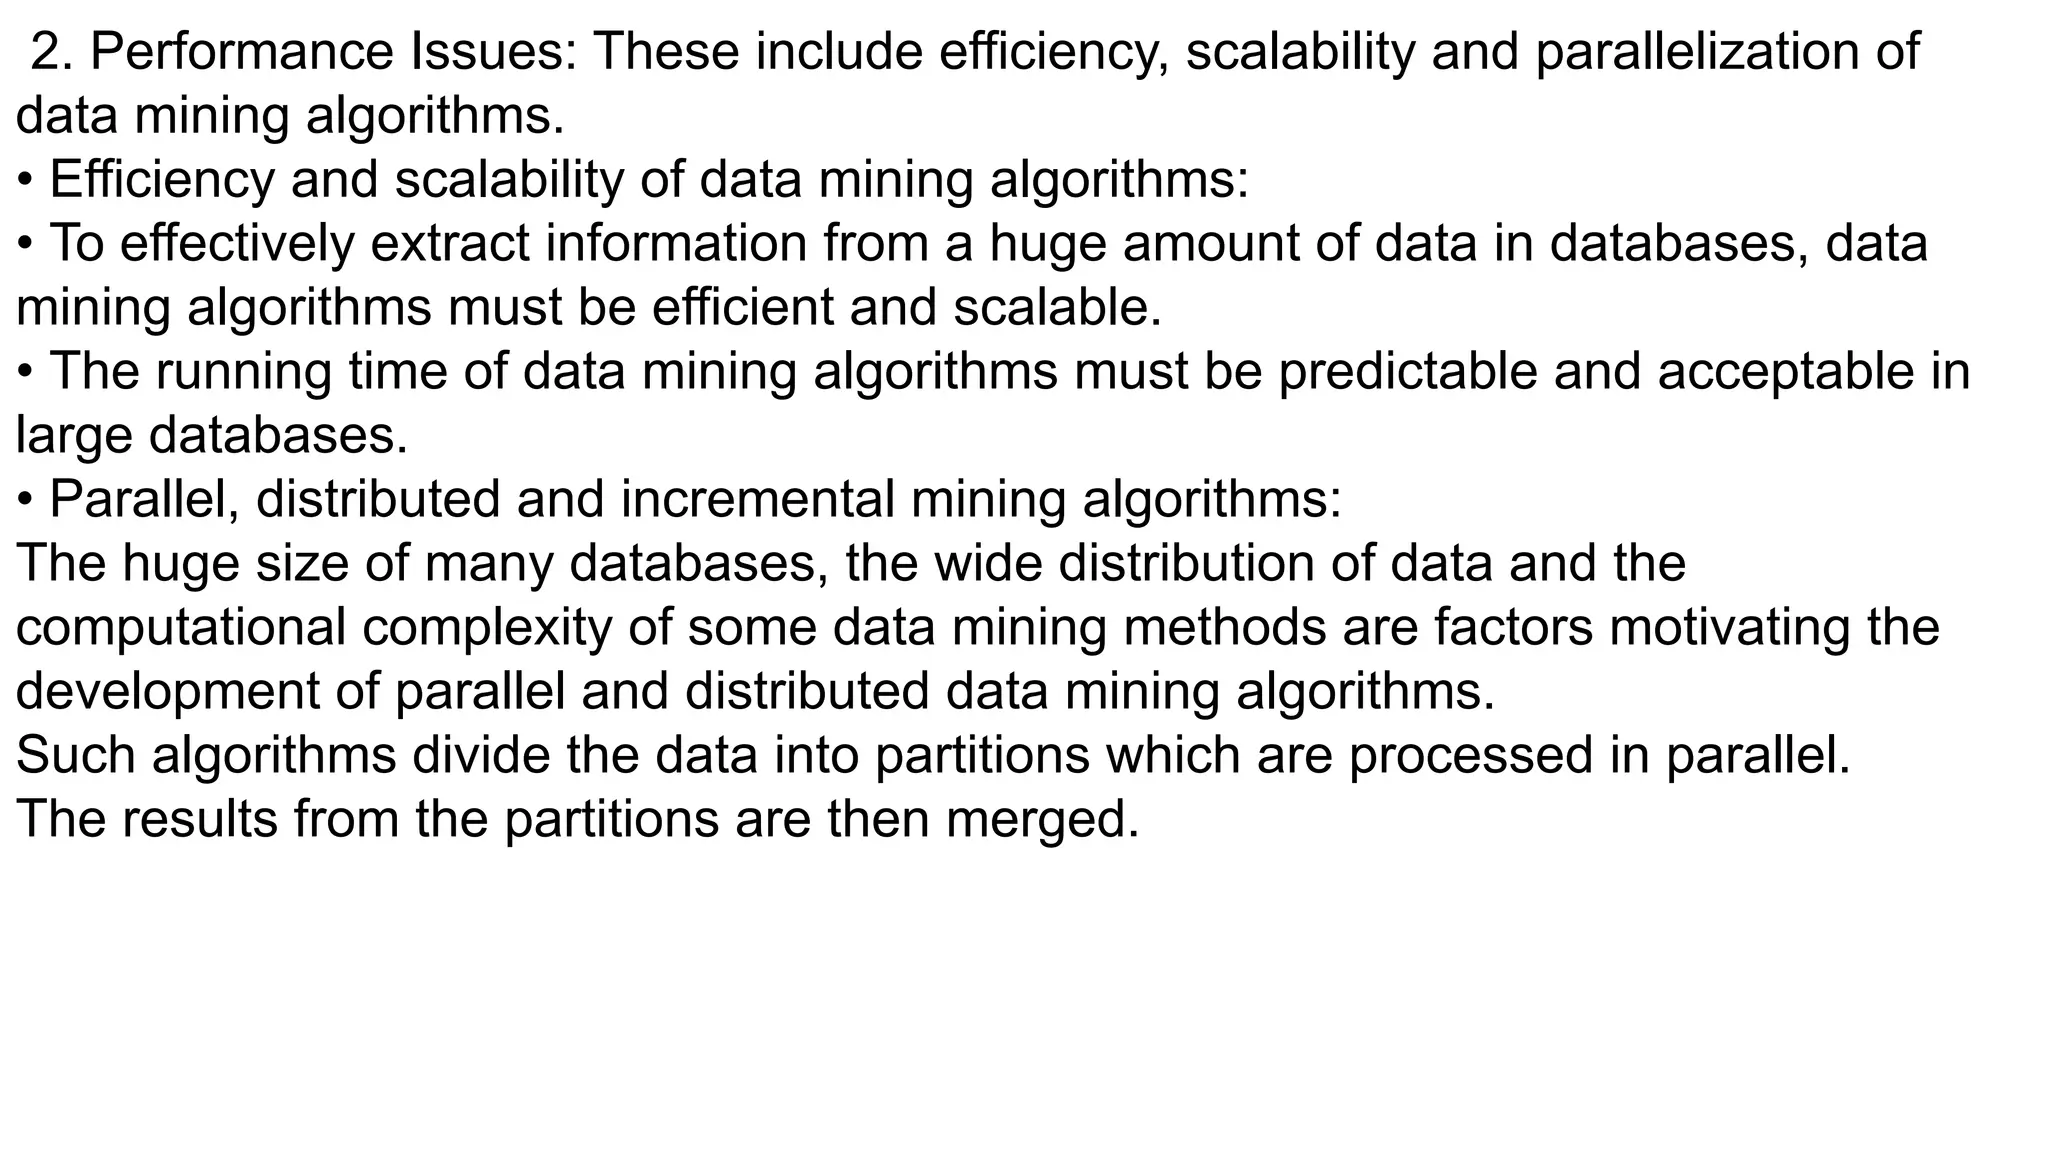
2. Performance Issues:These include efficiency, scalability and parallelization of
data mining algorithms.
• Efficiency and scalability of data mining algorithms:
• To effectively extract information from a huge amount of data in databases, data
mining algorithms must be efficient and scalable.
• The running time of data mining algorithms must be predictable and acceptable in
large databases.
• Parallel, distributed and incremental mining algorithms:
The huge size of many databases, the wide distribution of data and the
computational complexity of some data mining methods are factors motivating the
development of parallel and distributed data mining algorithms.
Such algorithms divide the data into partitions which are processed in parallel.
The results from the partitions are then merged.
45.
3. Issues relatingto the diversity of database types:
Handling of relational and complex types of data:
The databases may contain complex data objects, hypertext, multimedia data,
spatial data, temporal data.
It is unrealistic to expect one system to mine all kinds of data, given the
diversity of data types and different goals of data mining.
Specific data mining systems should be constructed for mining specific kinds of
data.
• Mining information from heterogenous databases and global information
systems:
LAN and WAN computer networks connect many sources of data, forming
huge, distributed and heterogeneous databases.
The discovery of knowledge from different sources of structured,
semistructured and unstructured data with diverse data semantics poses great
challenges to data mining
46.
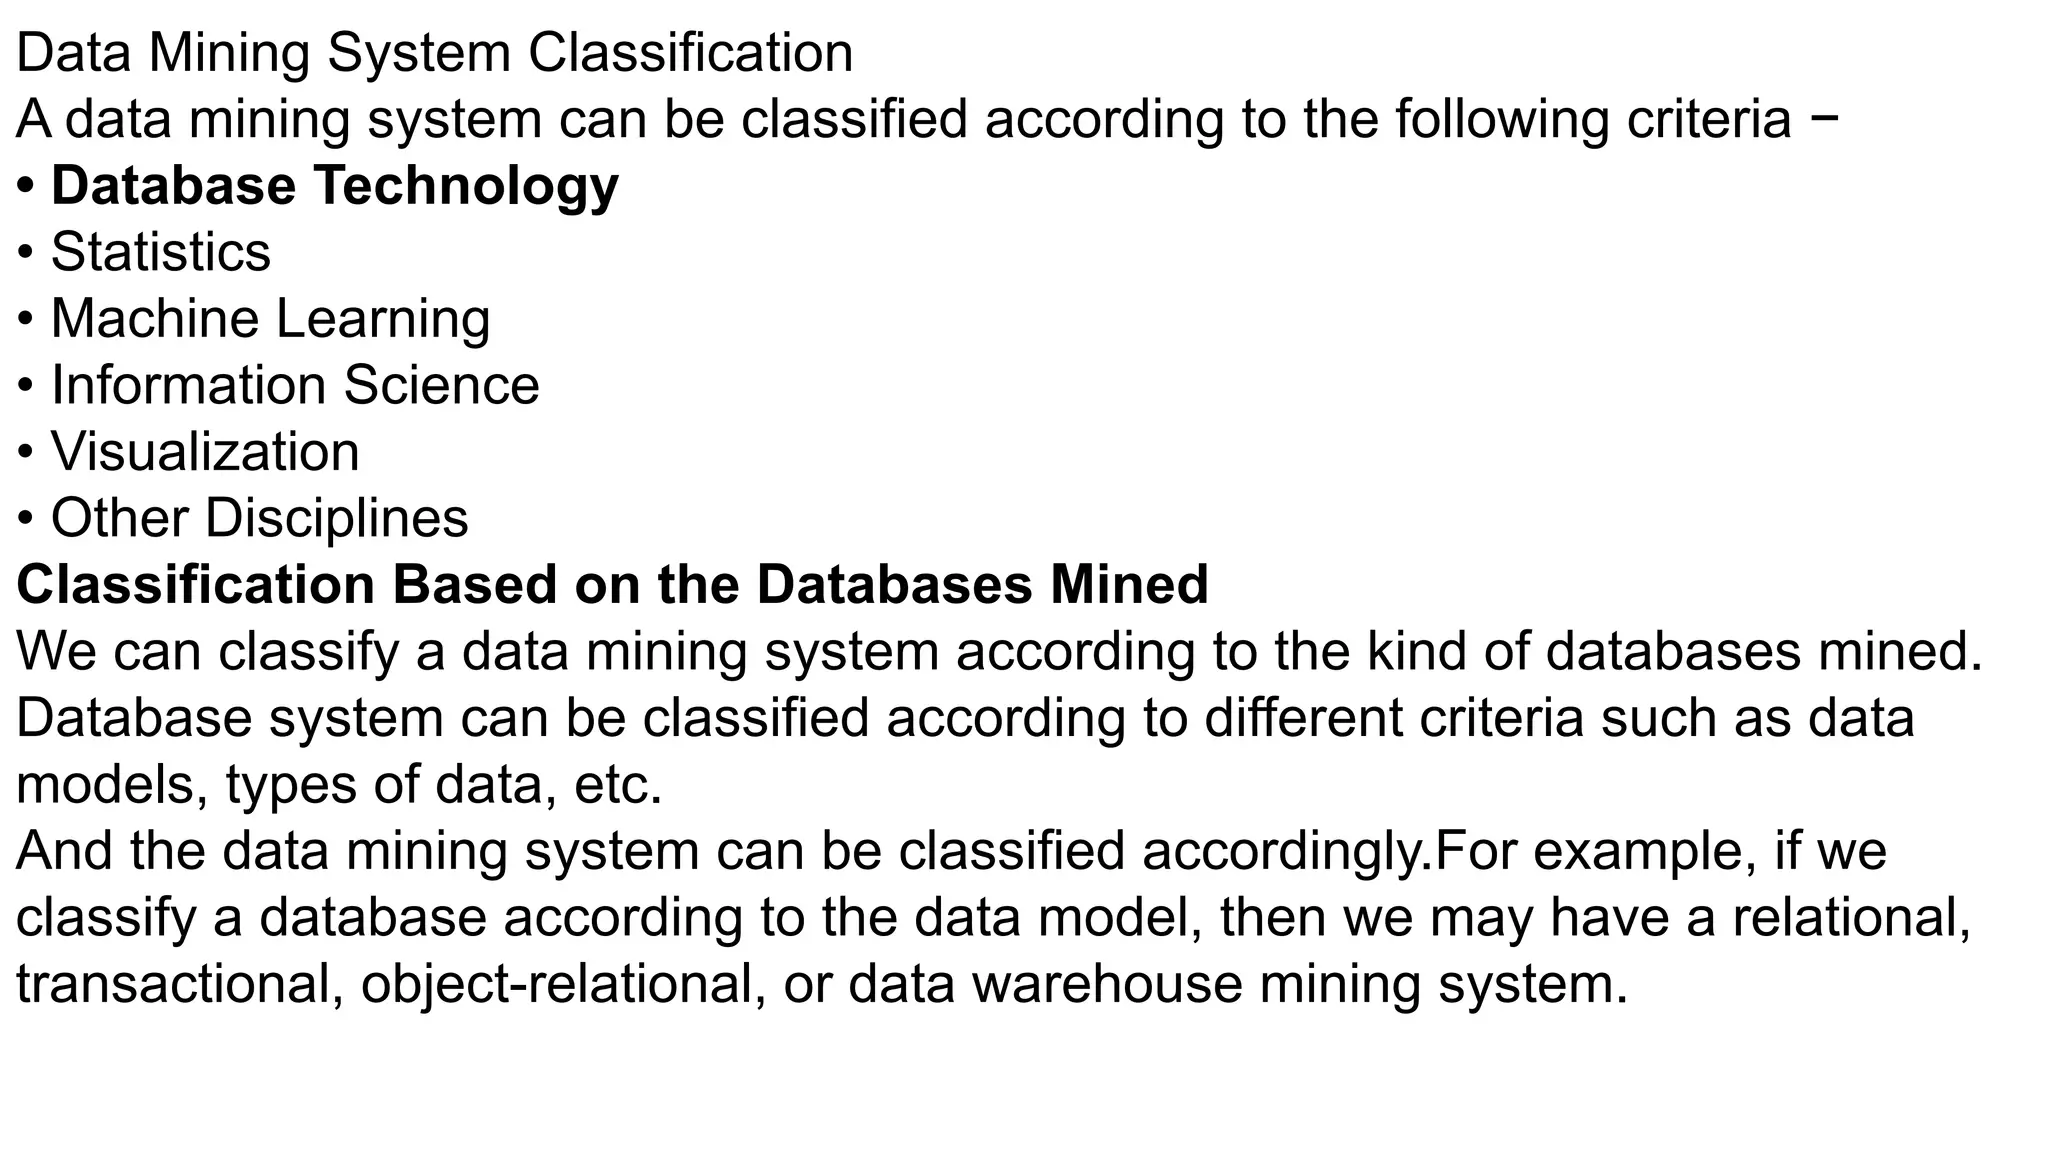
Data Mining SystemClassification
A data mining system can be classified according to the following criteria −
• Database Technology
• Statistics
• Machine Learning
• Information Science
• Visualization
• Other Disciplines
Classification Based on the Databases Mined
We can classify a data mining system according to the kind of databases mined.
Database system can be classified according to different criteria such as data
models, types of data, etc.
And the data mining system can be classified accordingly.For example, if we
classify a database according to the data model, then we may have a relational,
transactional, object-relational, or data warehouse mining system.
47.
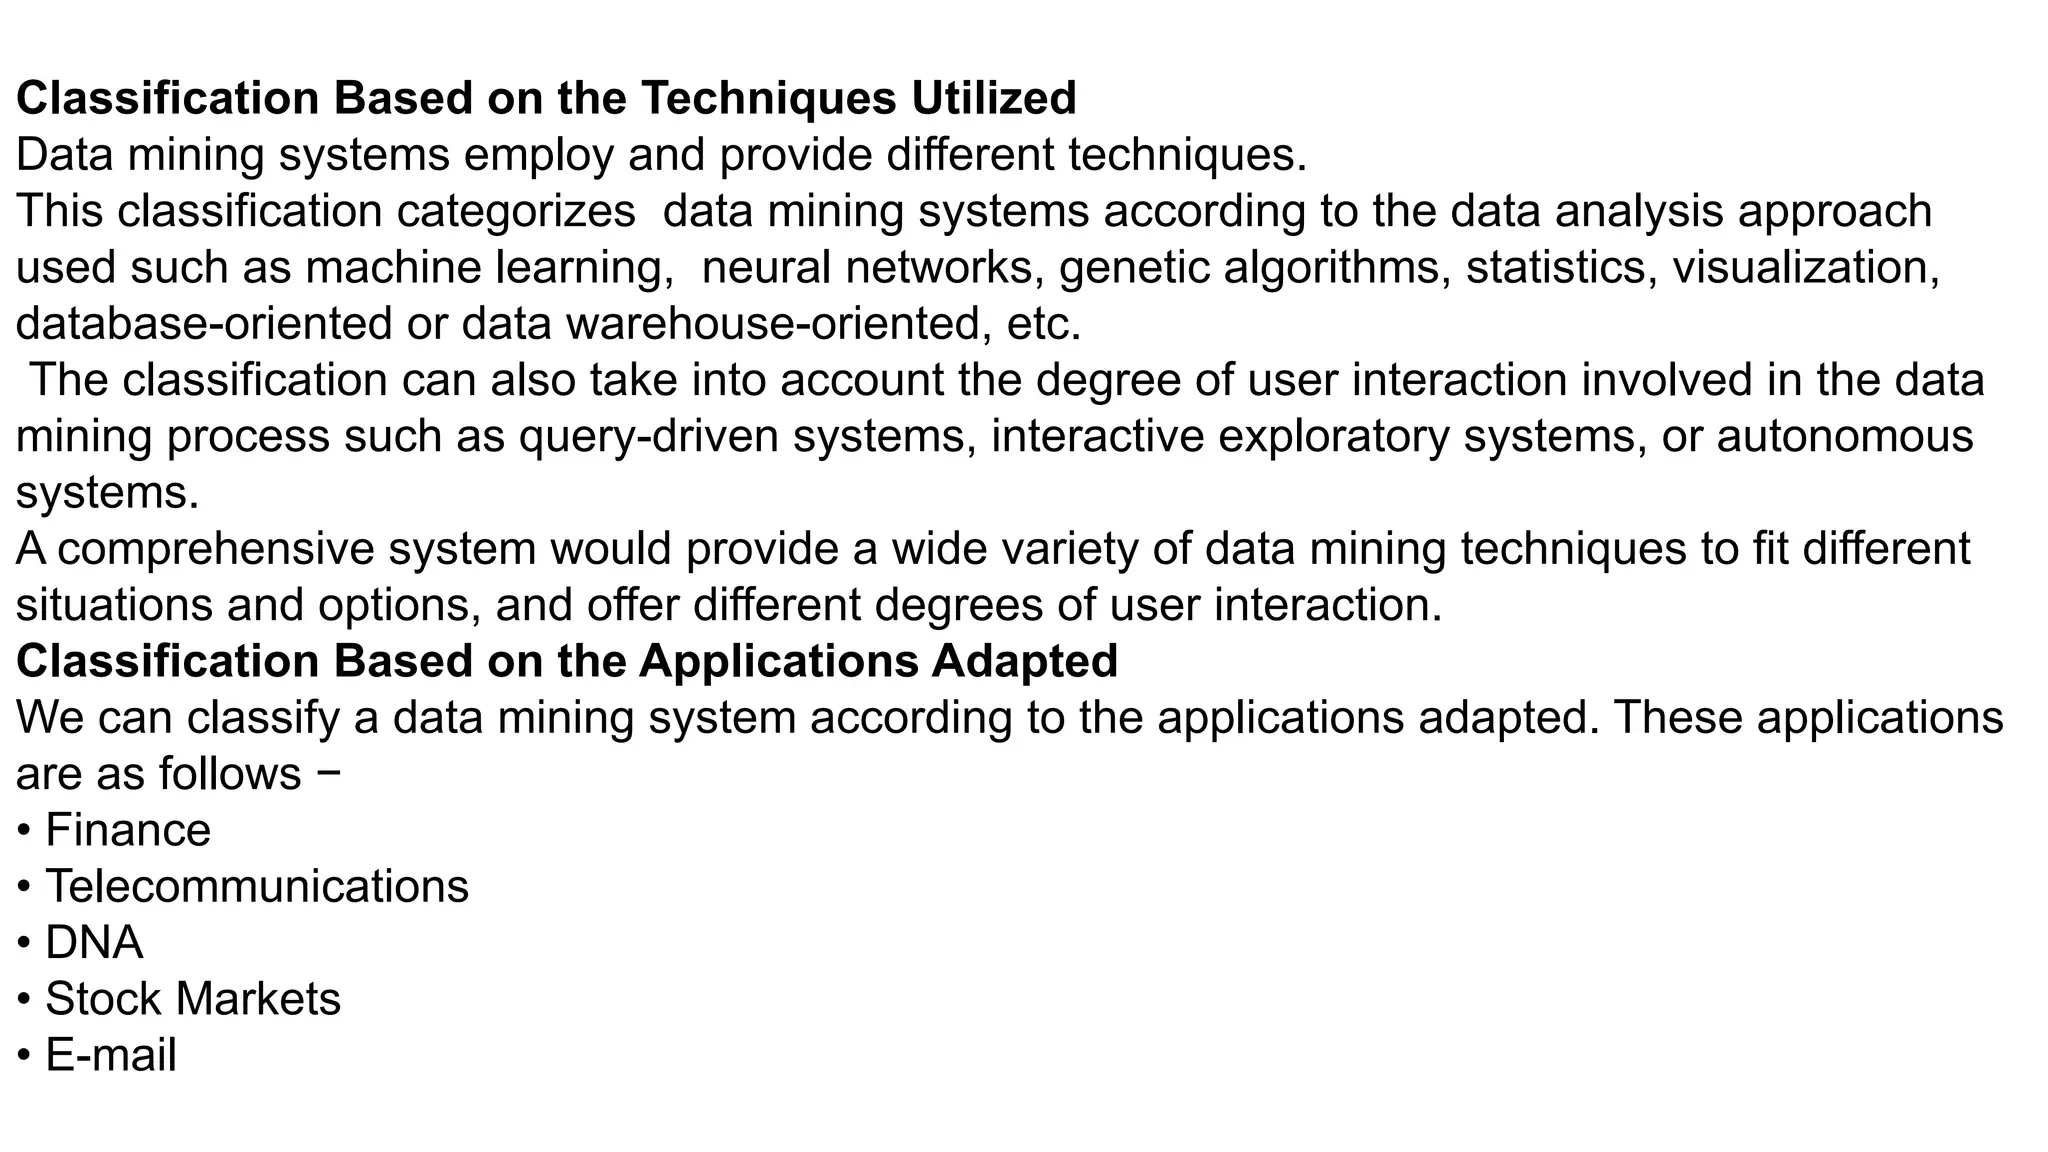
Classification Based onthe Techniques Utilized
Data mining systems employ and provide different techniques.
This classification categorizes data mining systems according to the data analysis approach
used such as machine learning, neural networks, genetic algorithms, statistics, visualization,
database-oriented or data warehouse-oriented, etc.
The classification can also take into account the degree of user interaction involved in the data
mining process such as query-driven systems, interactive exploratory systems, or autonomous
systems.
A comprehensive system would provide a wide variety of data mining techniques to fit different
situations and options, and offer different degrees of user interaction.
Classification Based on the Applications Adapted
We can classify a data mining system according to the applications adapted. These applications
are as follows −
• Finance
• Telecommunications
• DNA
• Stock Markets
• E-mail
48.
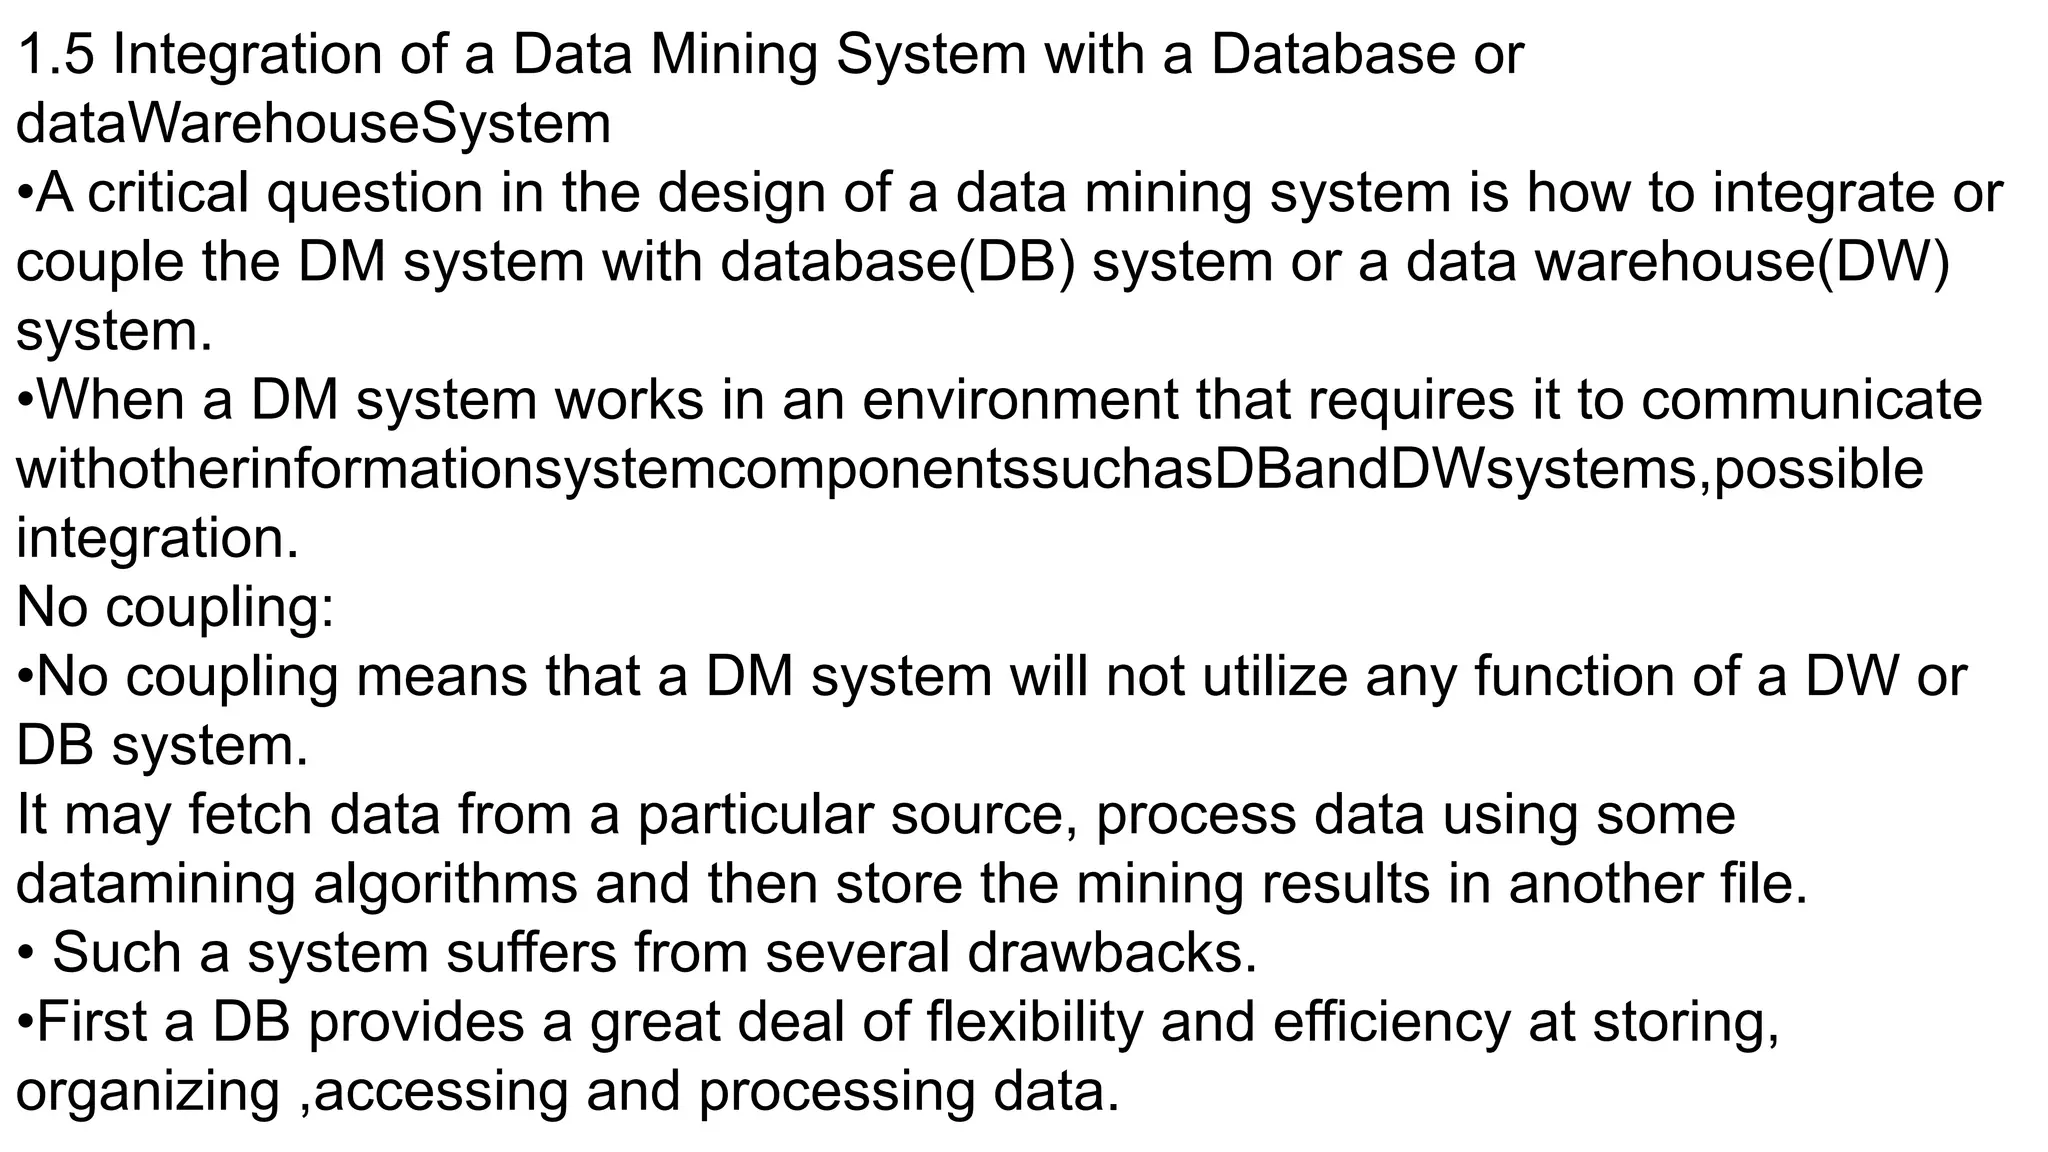
1.5 Integration ofa Data Mining System with a Database or
dataWarehouseSystem
•A critical question in the design of a data mining system is how to integrate or
couple the DM system with database(DB) system or a data warehouse(DW)
system.
•When a DM system works in an environment that requires it to communicate
withotherinformationsystemcomponentssuchasDBandDWsystems,possible
integration.
No coupling:
•No coupling means that a DM system will not utilize any function of a DW or
DB system.
It may fetch data from a particular source, process data using some
datamining algorithms and then store the mining results in another file.
• Such a system suffers from several drawbacks.
•First a DB provides a great deal of flexibility and efficiency at storing,
organizing ,accessing and processing data.
49.
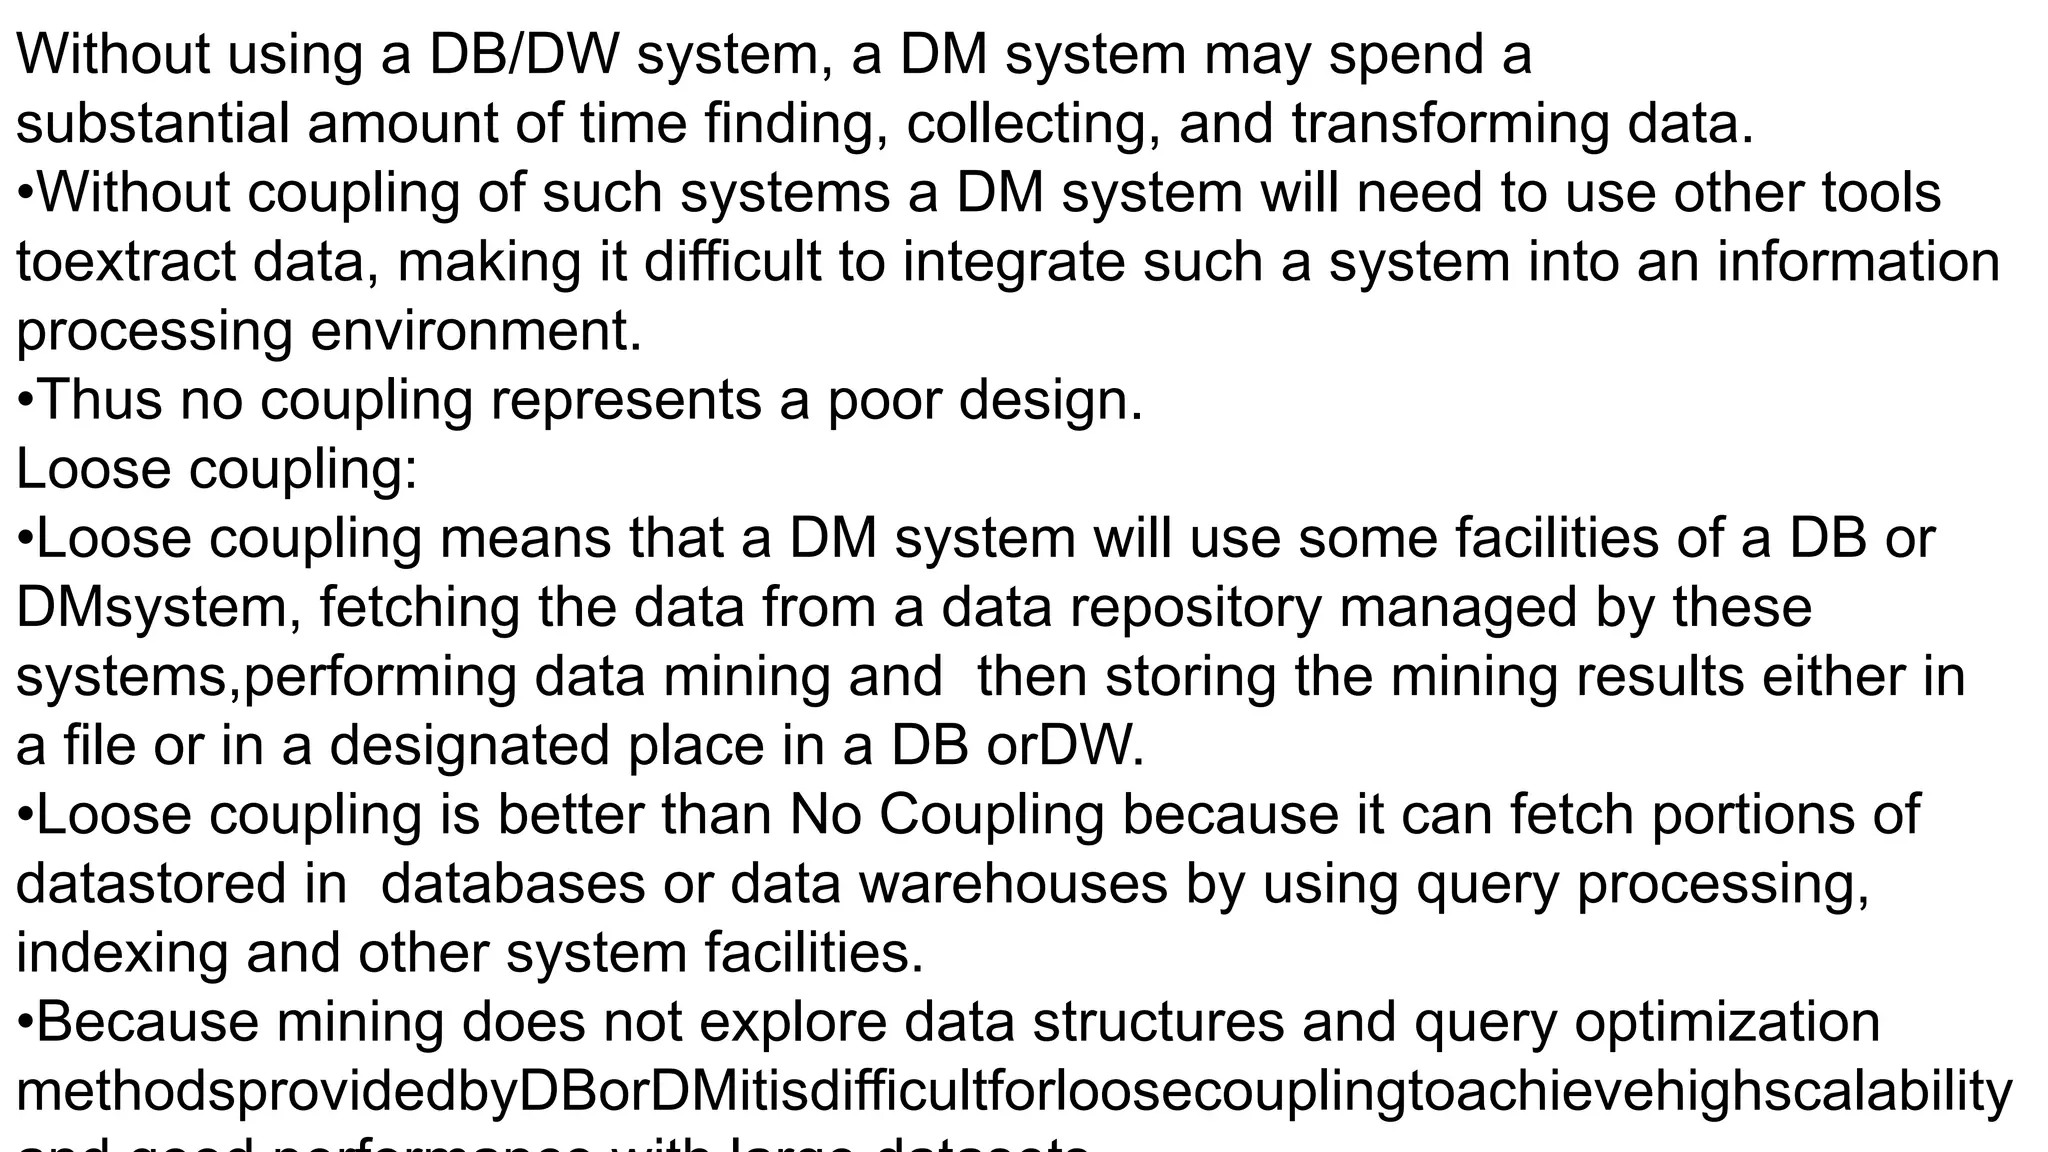
Without using aDB/DW system, a DM system may spend a
substantial amount of time finding, collecting, and transforming data.
•Without coupling of such systems a DM system will need to use other tools
toextract data, making it difficult to integrate such a system into an information
processing environment.
•Thus no coupling represents a poor design.
Loose coupling:
•Loose coupling means that a DM system will use some facilities of a DB or
DMsystem, fetching the data from a data repository managed by these
systems,performing data mining and then storing the mining results either in
a file or in a designated place in a DB orDW.
•Loose coupling is better than No Coupling because it can fetch portions of
datastored in databases or data warehouses by using query processing,
indexing and other system facilities.
•Because mining does not explore data structures and query optimization
methodsprovidedbyDBorDMitisdifficultforloosecouplingtoachievehighscalability
50.
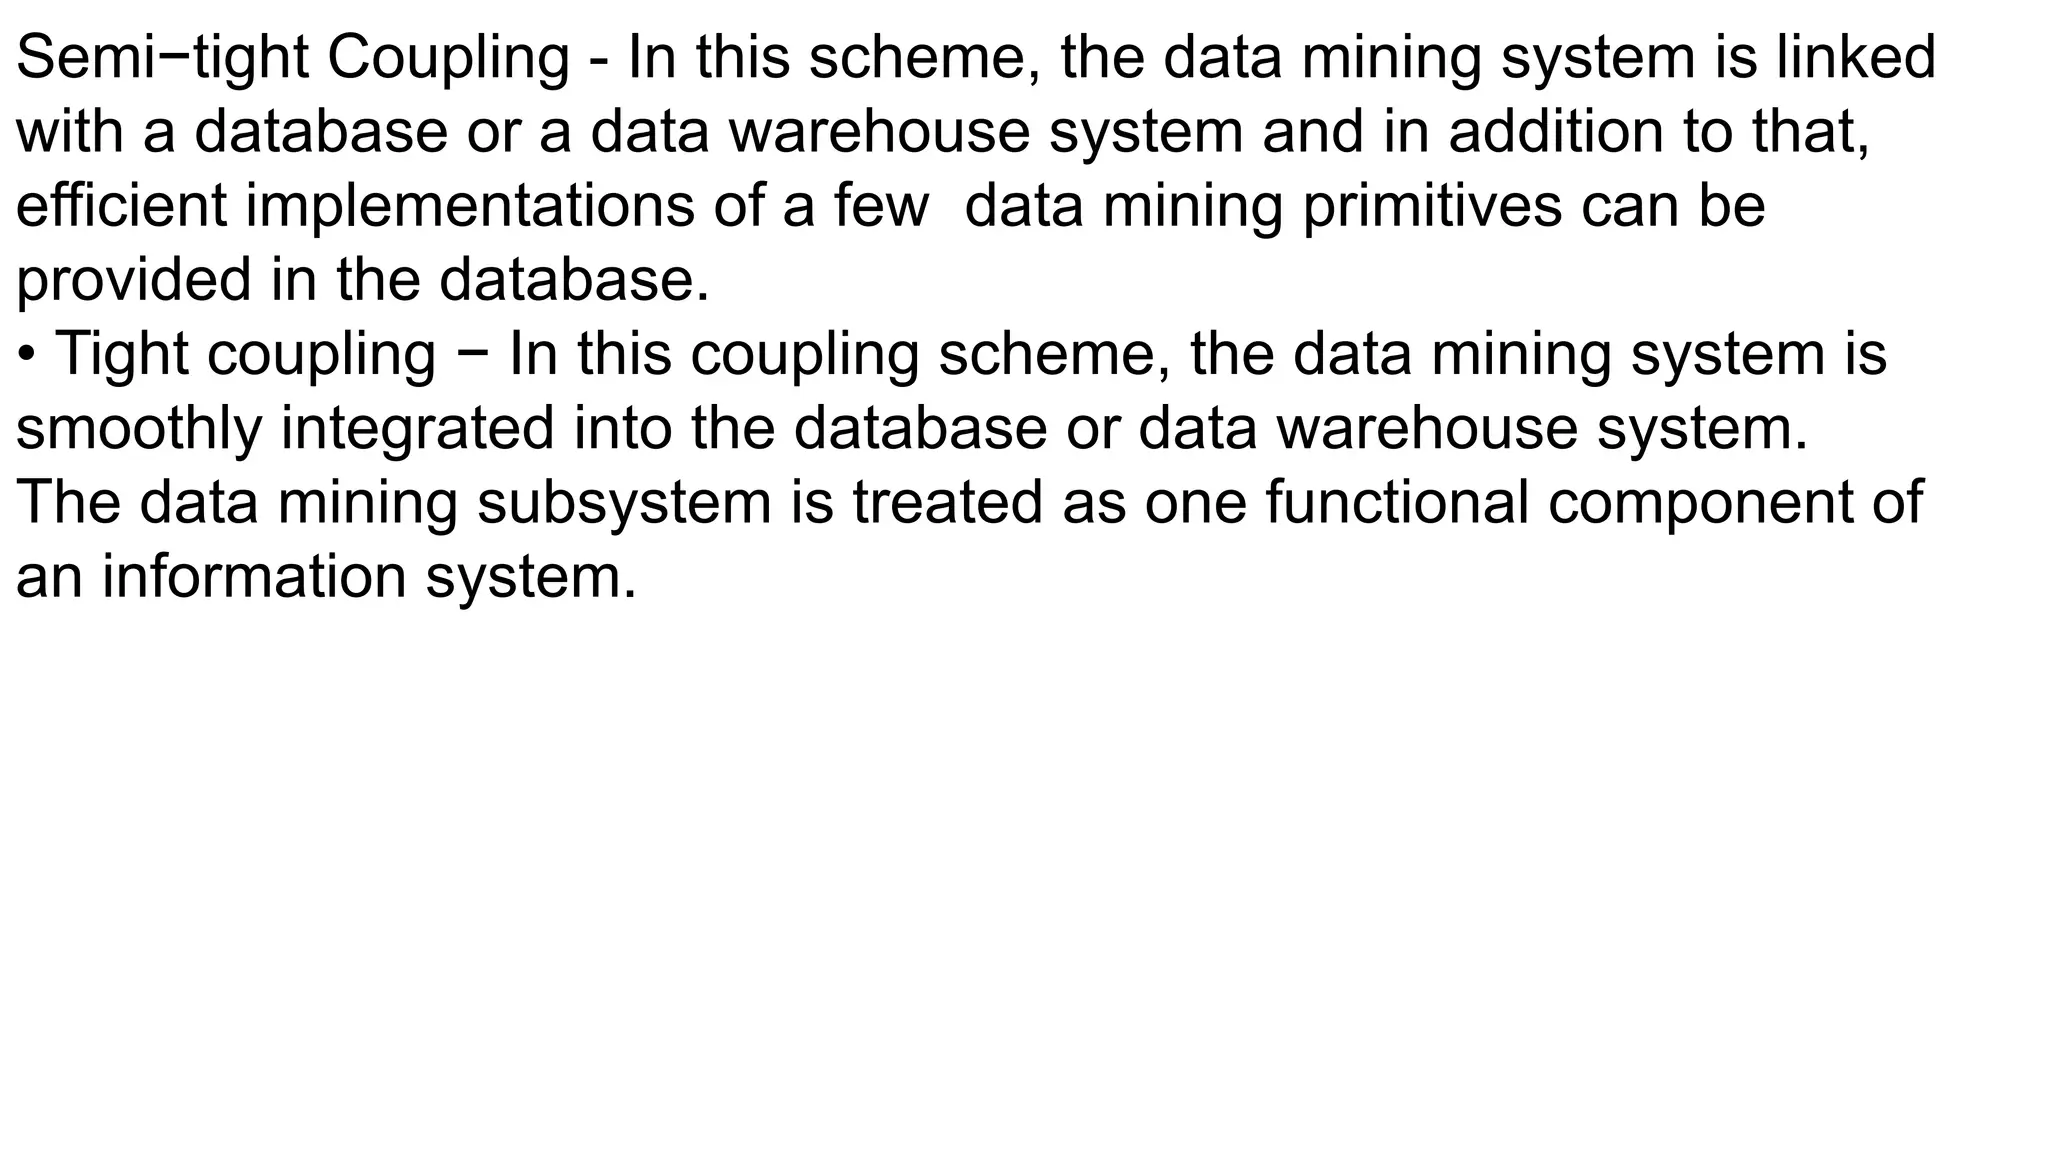
Semi−tight Coupling -In this scheme, the data mining system is linked
with a database or a data warehouse system and in addition to that,
efficient implementations of a few data mining primitives can be
provided in the database.
• Tight coupling − In this coupling scheme, the data mining system is
smoothly integrated into the database or data warehouse system.
The data mining subsystem is treated as one functional component of
an information system.
51.
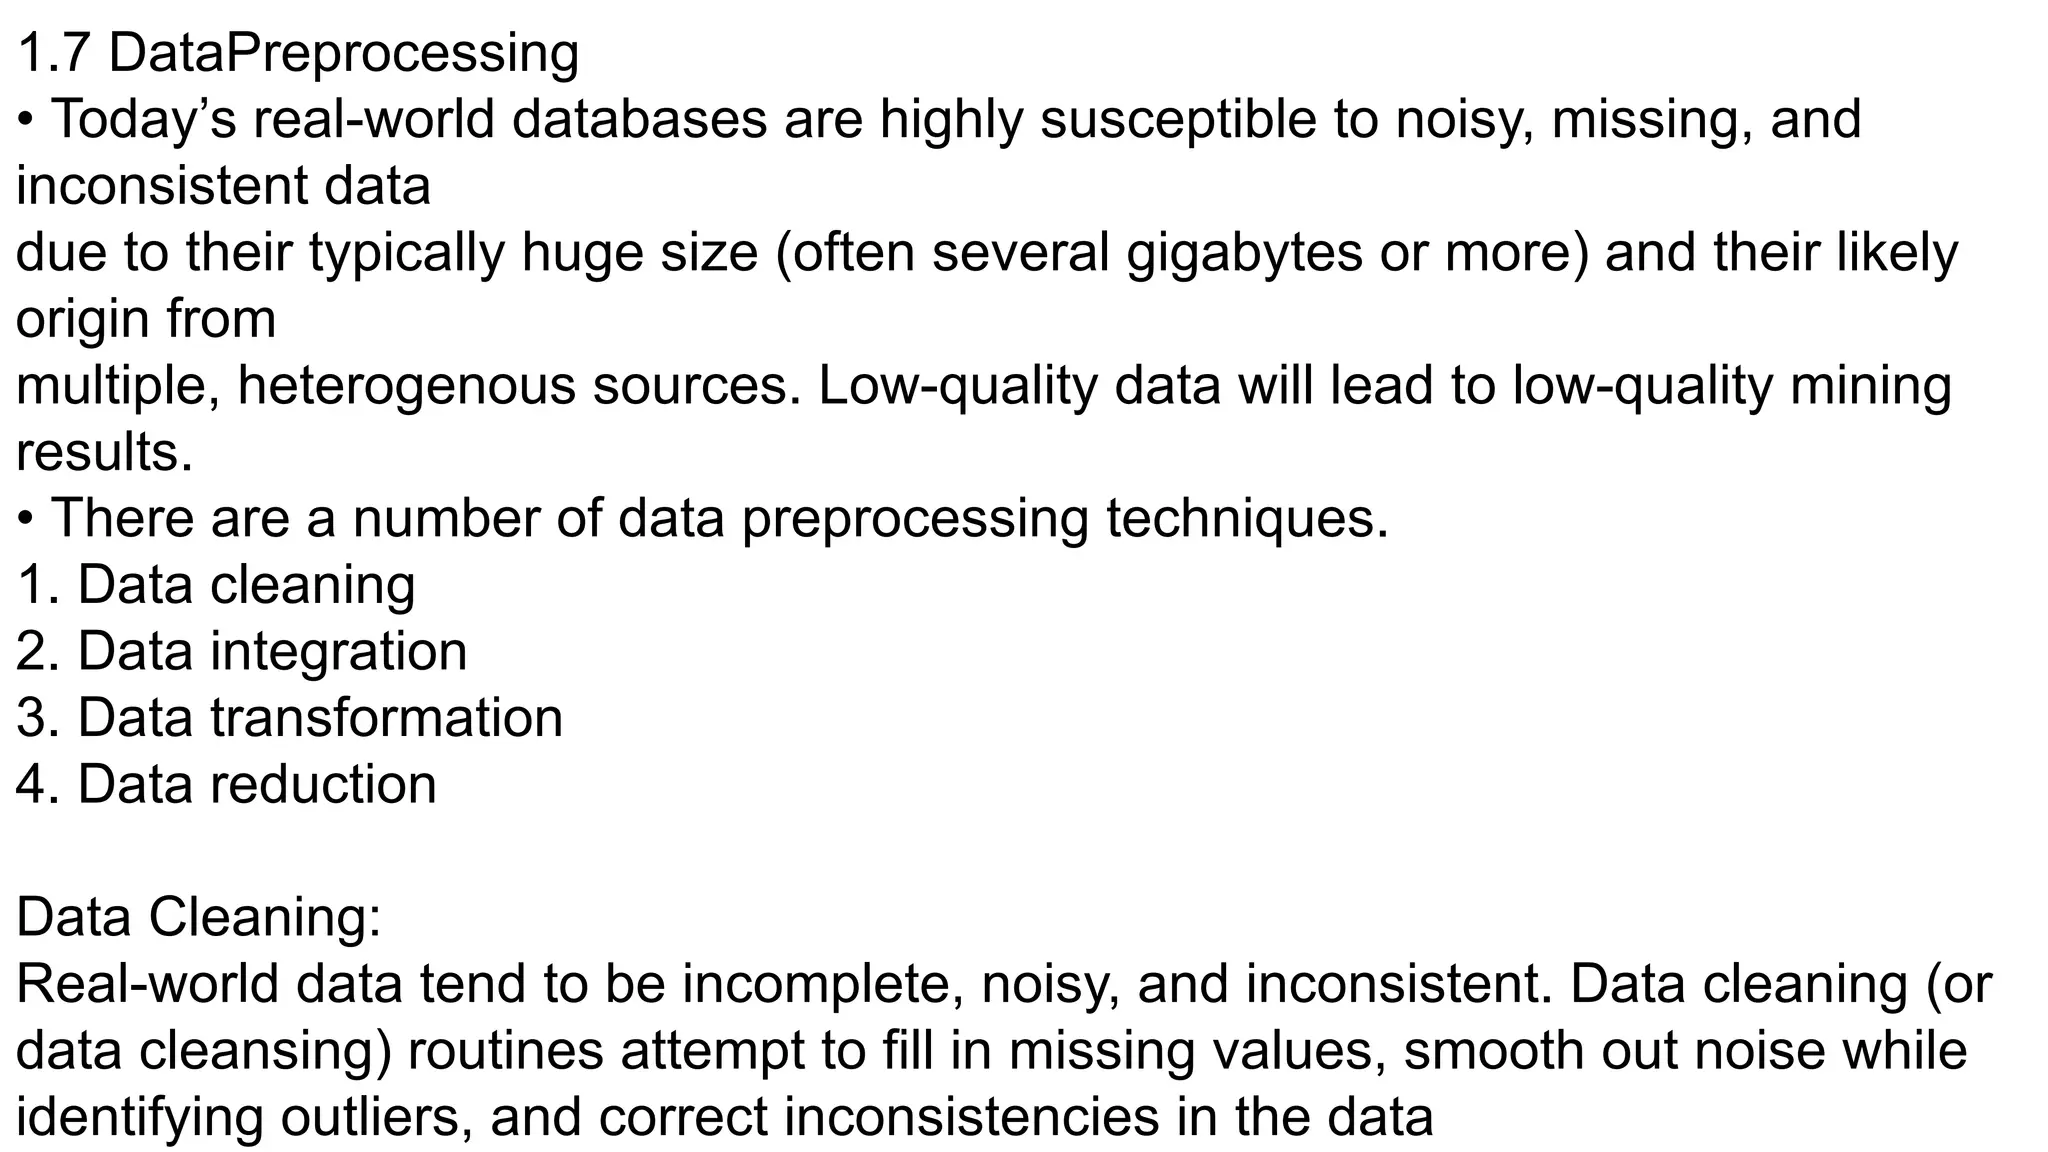
1.7 DataPreprocessing
• Today’sreal-world databases are highly susceptible to noisy, missing, and
inconsistent data
due to their typically huge size (often several gigabytes or more) and their likely
origin from
multiple, heterogenous sources. Low-quality data will lead to low-quality mining
results.
• There are a number of data preprocessing techniques.
1. Data cleaning
2. Data integration
3. Data transformation
4. Data reduction
Data Cleaning:
Real-world data tend to be incomplete, noisy, and inconsistent. Data cleaning (or
data cleansing) routines attempt to fill in missing values, smooth out noise while
identifying outliers, and correct inconsistencies in the data
52.
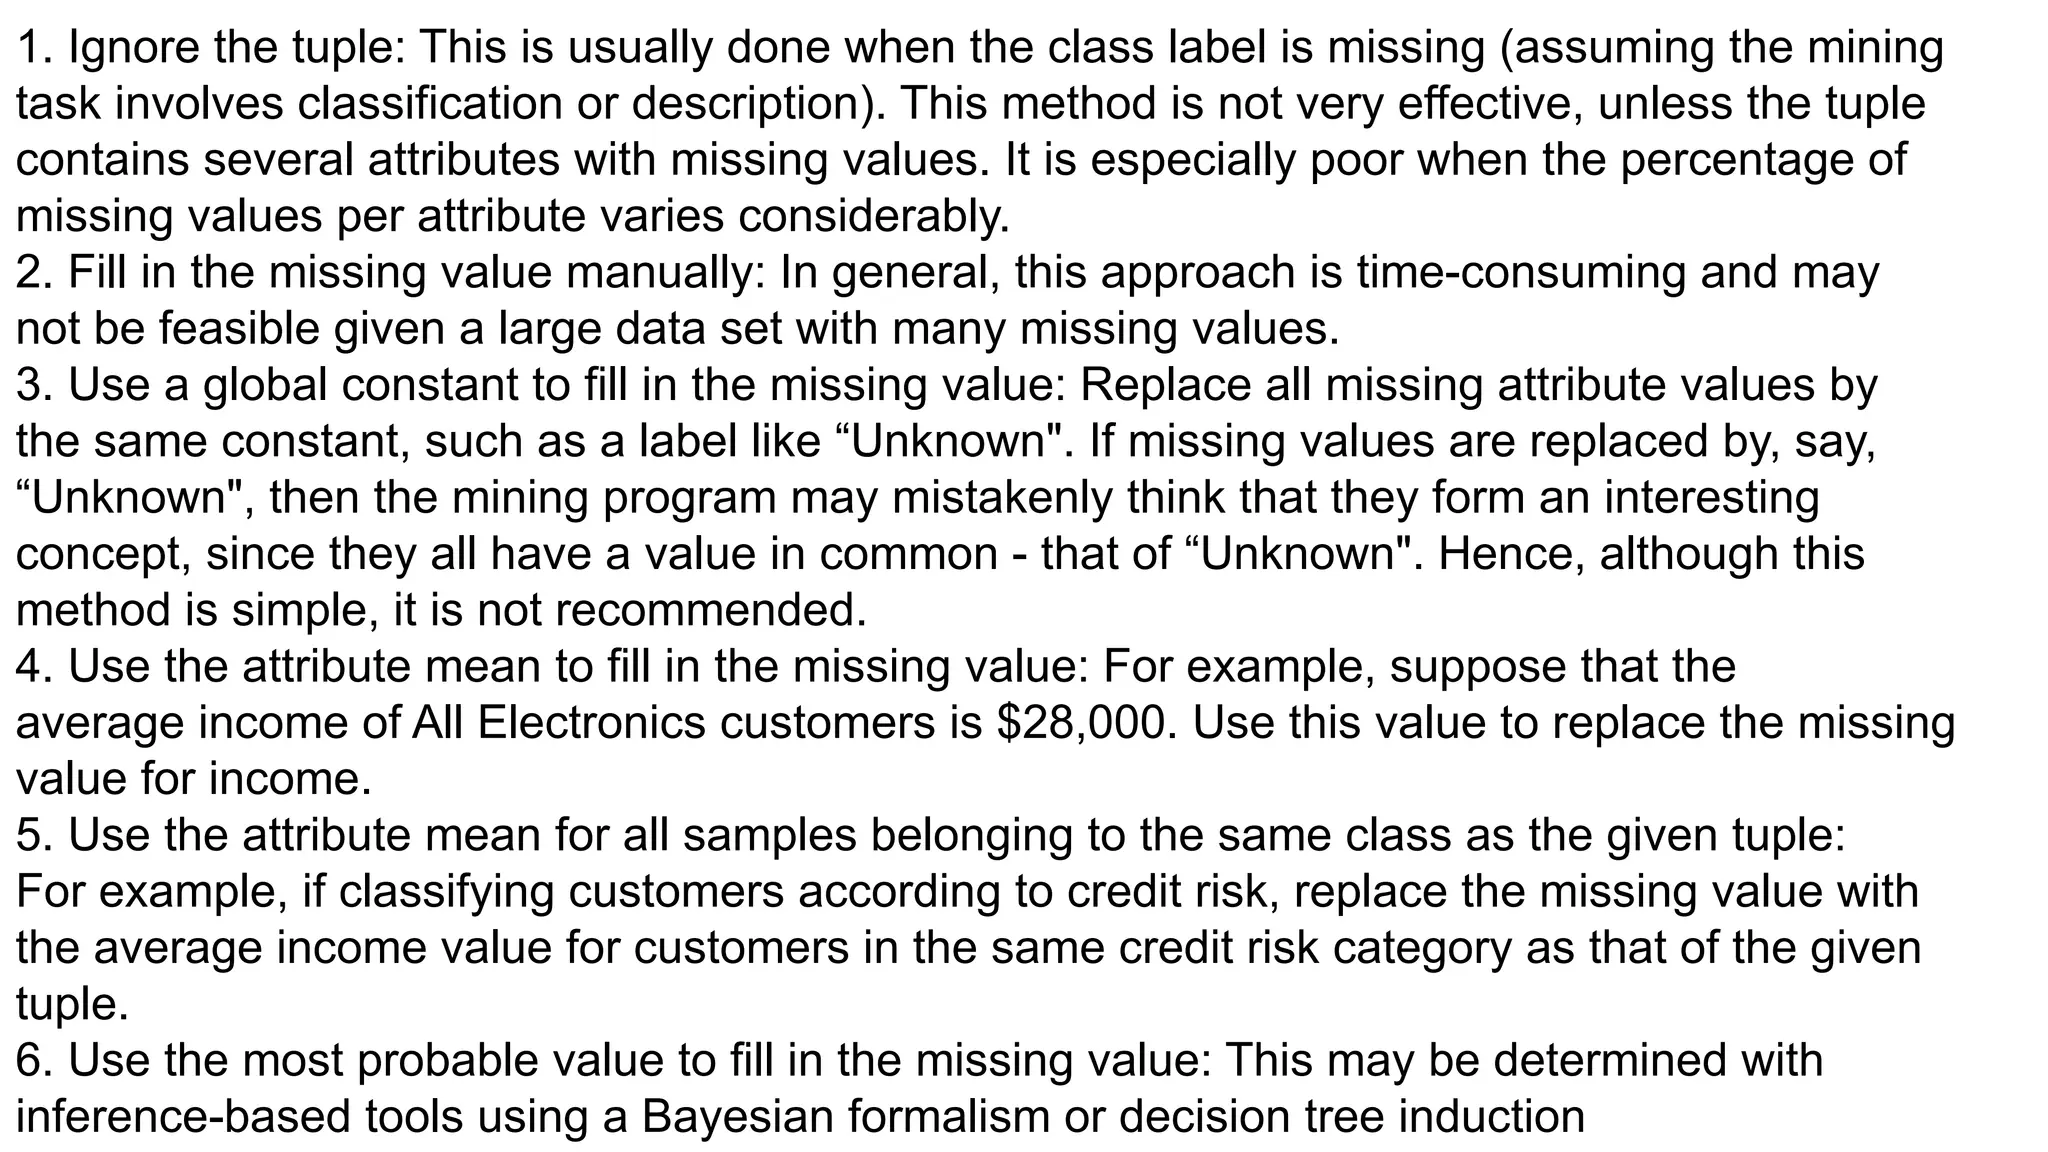
1. Ignore thetuple: This is usually done when the class label is missing (assuming the mining
task involves classification or description). This method is not very effective, unless the tuple
contains several attributes with missing values. It is especially poor when the percentage of
missing values per attribute varies considerably.
2. Fill in the missing value manually: In general, this approach is time-consuming and may
not be feasible given a large data set with many missing values.
3. Use a global constant to fill in the missing value: Replace all missing attribute values by
the same constant, such as a label like “Unknown". If missing values are replaced by, say,
“Unknown", then the mining program may mistakenly think that they form an interesting
concept, since they all have a value in common - that of “Unknown". Hence, although this
method is simple, it is not recommended.
4. Use the attribute mean to fill in the missing value: For example, suppose that the
average income of All Electronics customers is $28,000. Use this value to replace the missing
value for income.
5. Use the attribute mean for all samples belonging to the same class as the given tuple:
For example, if classifying customers according to credit risk, replace the missing value with
the average income value for customers in the same credit risk category as that of the given
tuple.
6. Use the most probable value to fill in the missing value: This may be determined with
inference-based tools using a Bayesian formalism or decision tree induction
53.
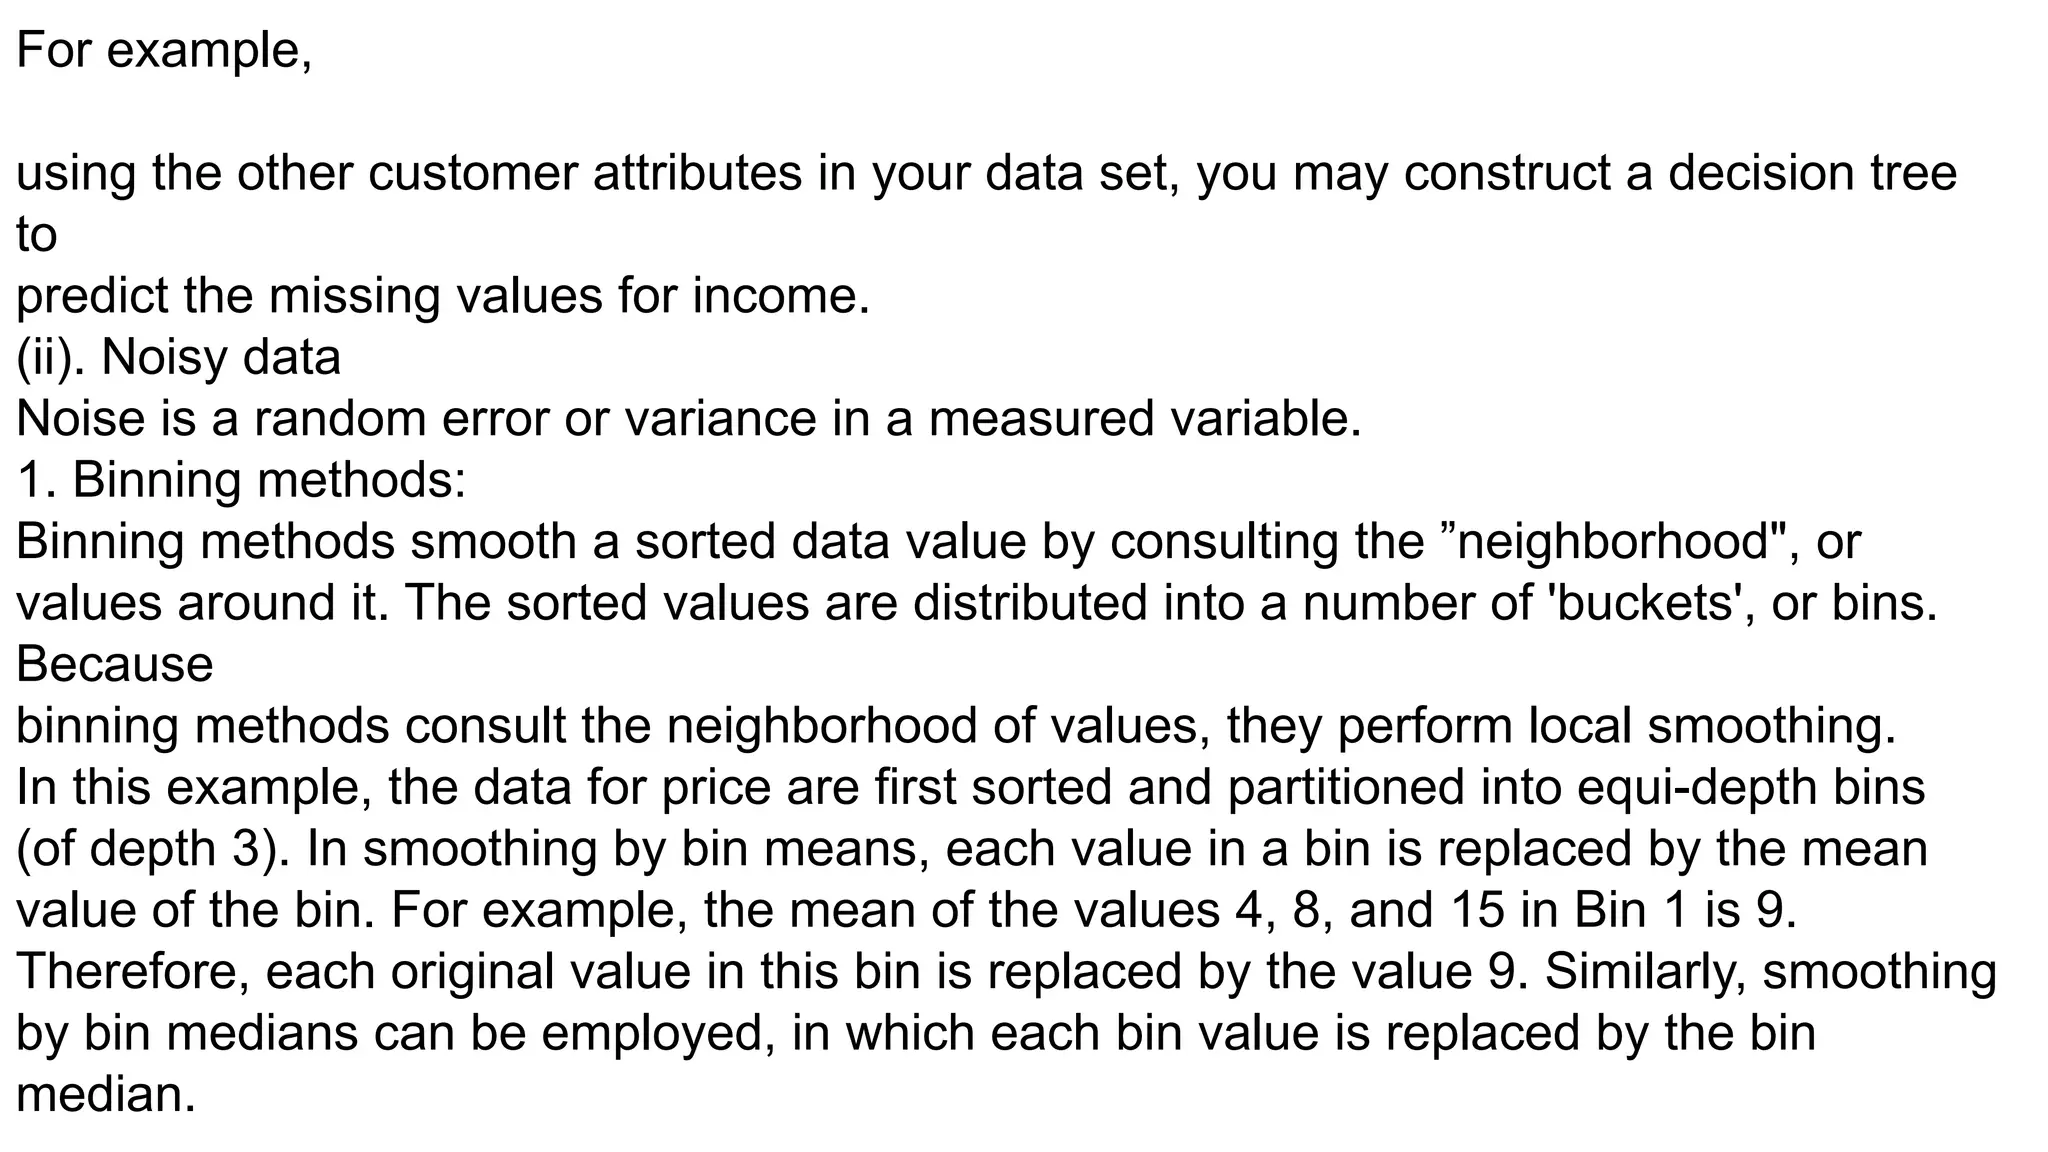
For example,
using theother customer attributes in your data set, you may construct a decision tree
to
predict the missing values for income.
(ii). Noisy data
Noise is a random error or variance in a measured variable.
1. Binning methods:
Binning methods smooth a sorted data value by consulting the ”neighborhood", or
values around it. The sorted values are distributed into a number of 'buckets', or bins.
Because
binning methods consult the neighborhood of values, they perform local smoothing.
In this example, the data for price are first sorted and partitioned into equi-depth bins
(of depth 3). In smoothing by bin means, each value in a bin is replaced by the mean
value of the bin. For example, the mean of the values 4, 8, and 15 in Bin 1 is 9.
Therefore, each original value in this bin is replaced by the value 9. Similarly, smoothing
by bin medians can be employed, in which each bin value is replaced by the bin
median.
54.
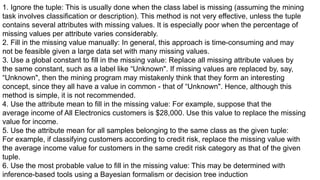
b) Regression: Datacan be smoothed by fitting the data to a function, such as
with regression.
Linear regression involves finding the “best” line to fit two attributes (or variables),
so that one attribute can be used to predict the other.
Multiple linear regression is an extension of linear regression, where more than
two attributes are involved and the data are fit to a multidimensional surface.
3. Clustering: Outliers may be detected by clustering, where similar values are
organized into groups, or “clusters.” Intuitively, values that fall outside of the set
of clusters may be
considered outliers
55.
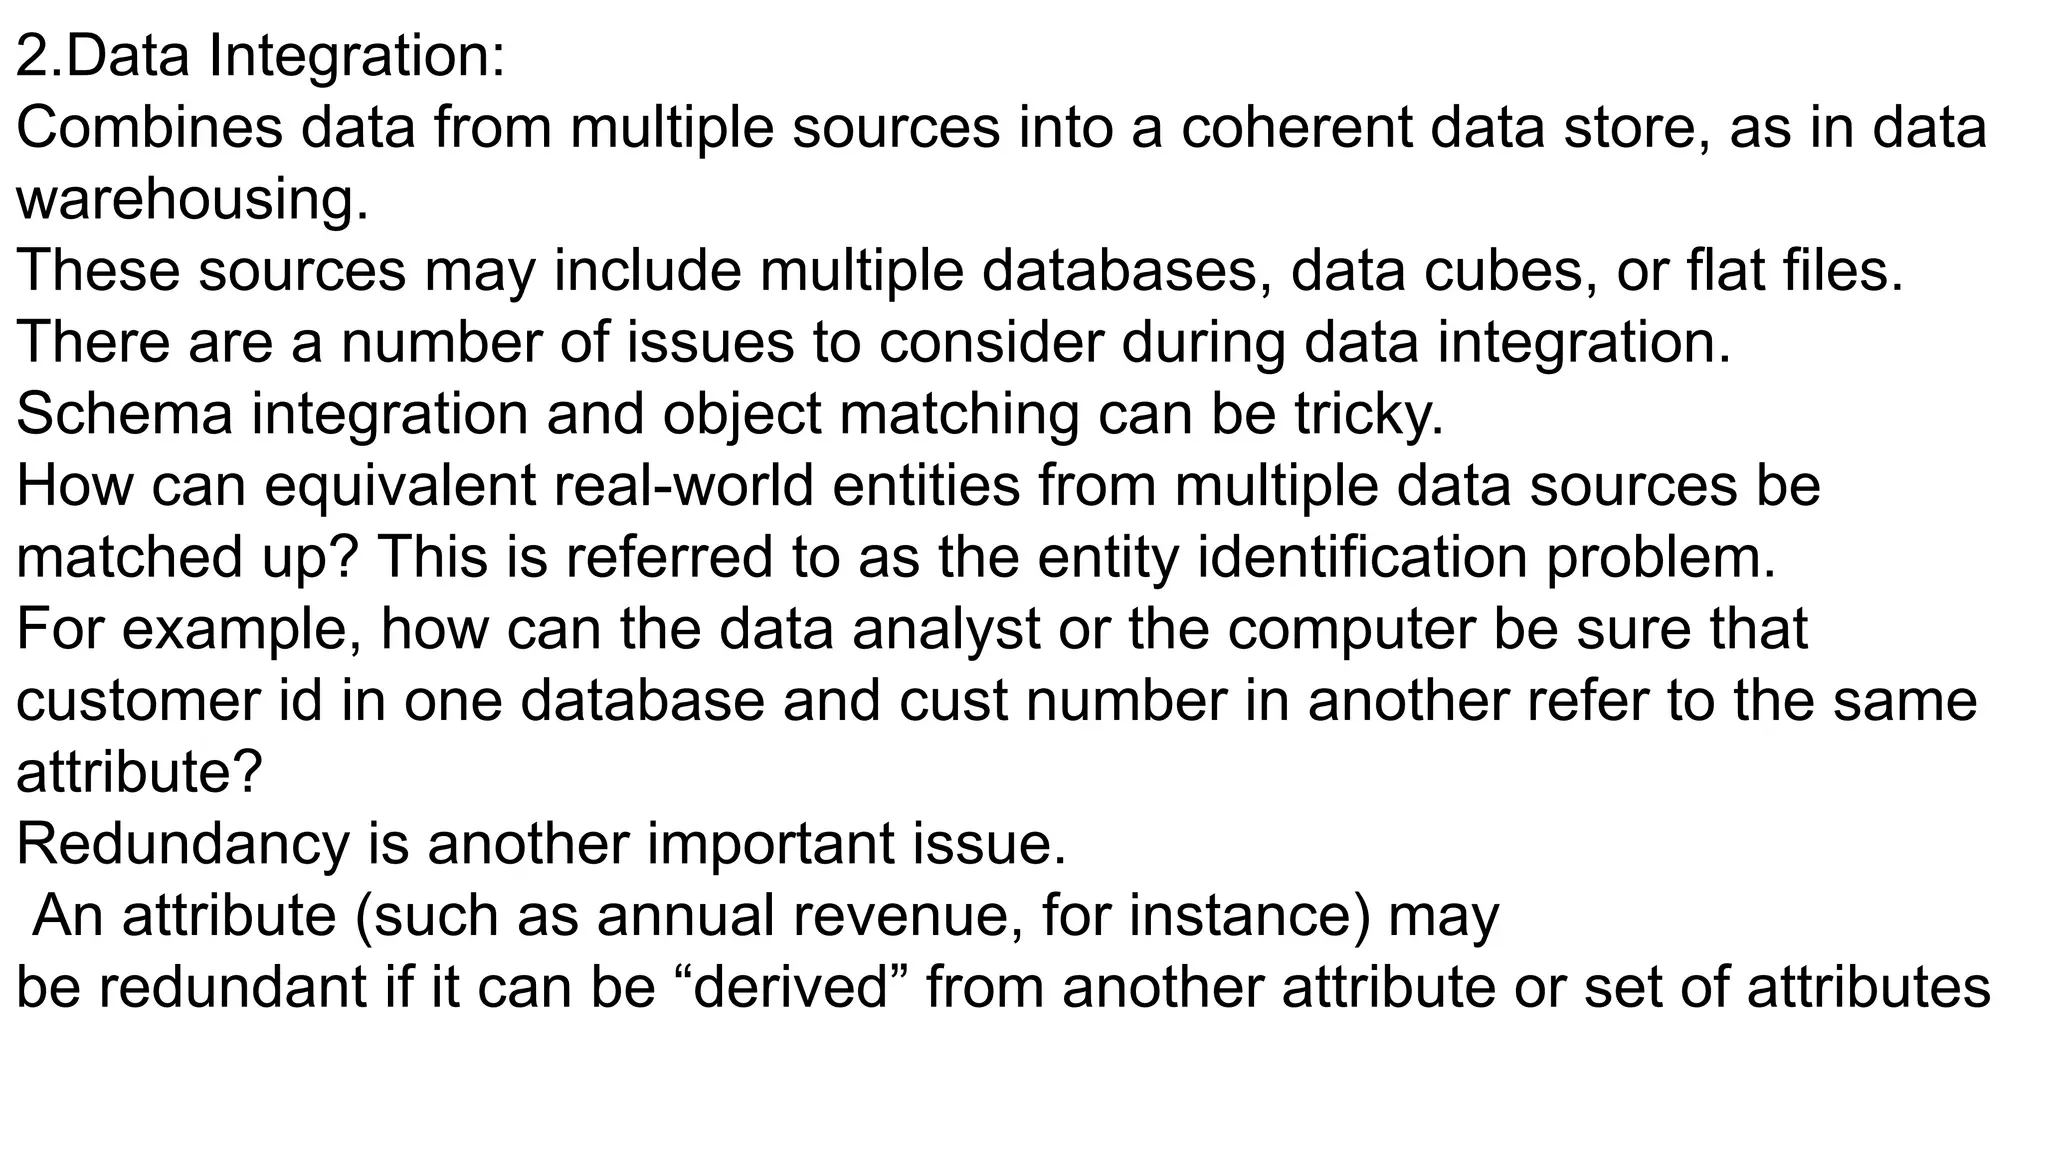
2.Data Integration:
Combines datafrom multiple sources into a coherent data store, as in data
warehousing.
These sources may include multiple databases, data cubes, or flat files.
There are a number of issues to consider during data integration.
Schema integration and object matching can be tricky.
How can equivalent real-world entities from multiple data sources be
matched up? This is referred to as the entity identification problem.
For example, how can the data analyst or the computer be sure that
customer id in one database and cust number in another refer to the same
attribute?
Redundancy is another important issue.
An attribute (such as annual revenue, for instance) may
be redundant if it can be “derived” from another attribute or set of attributes
56.
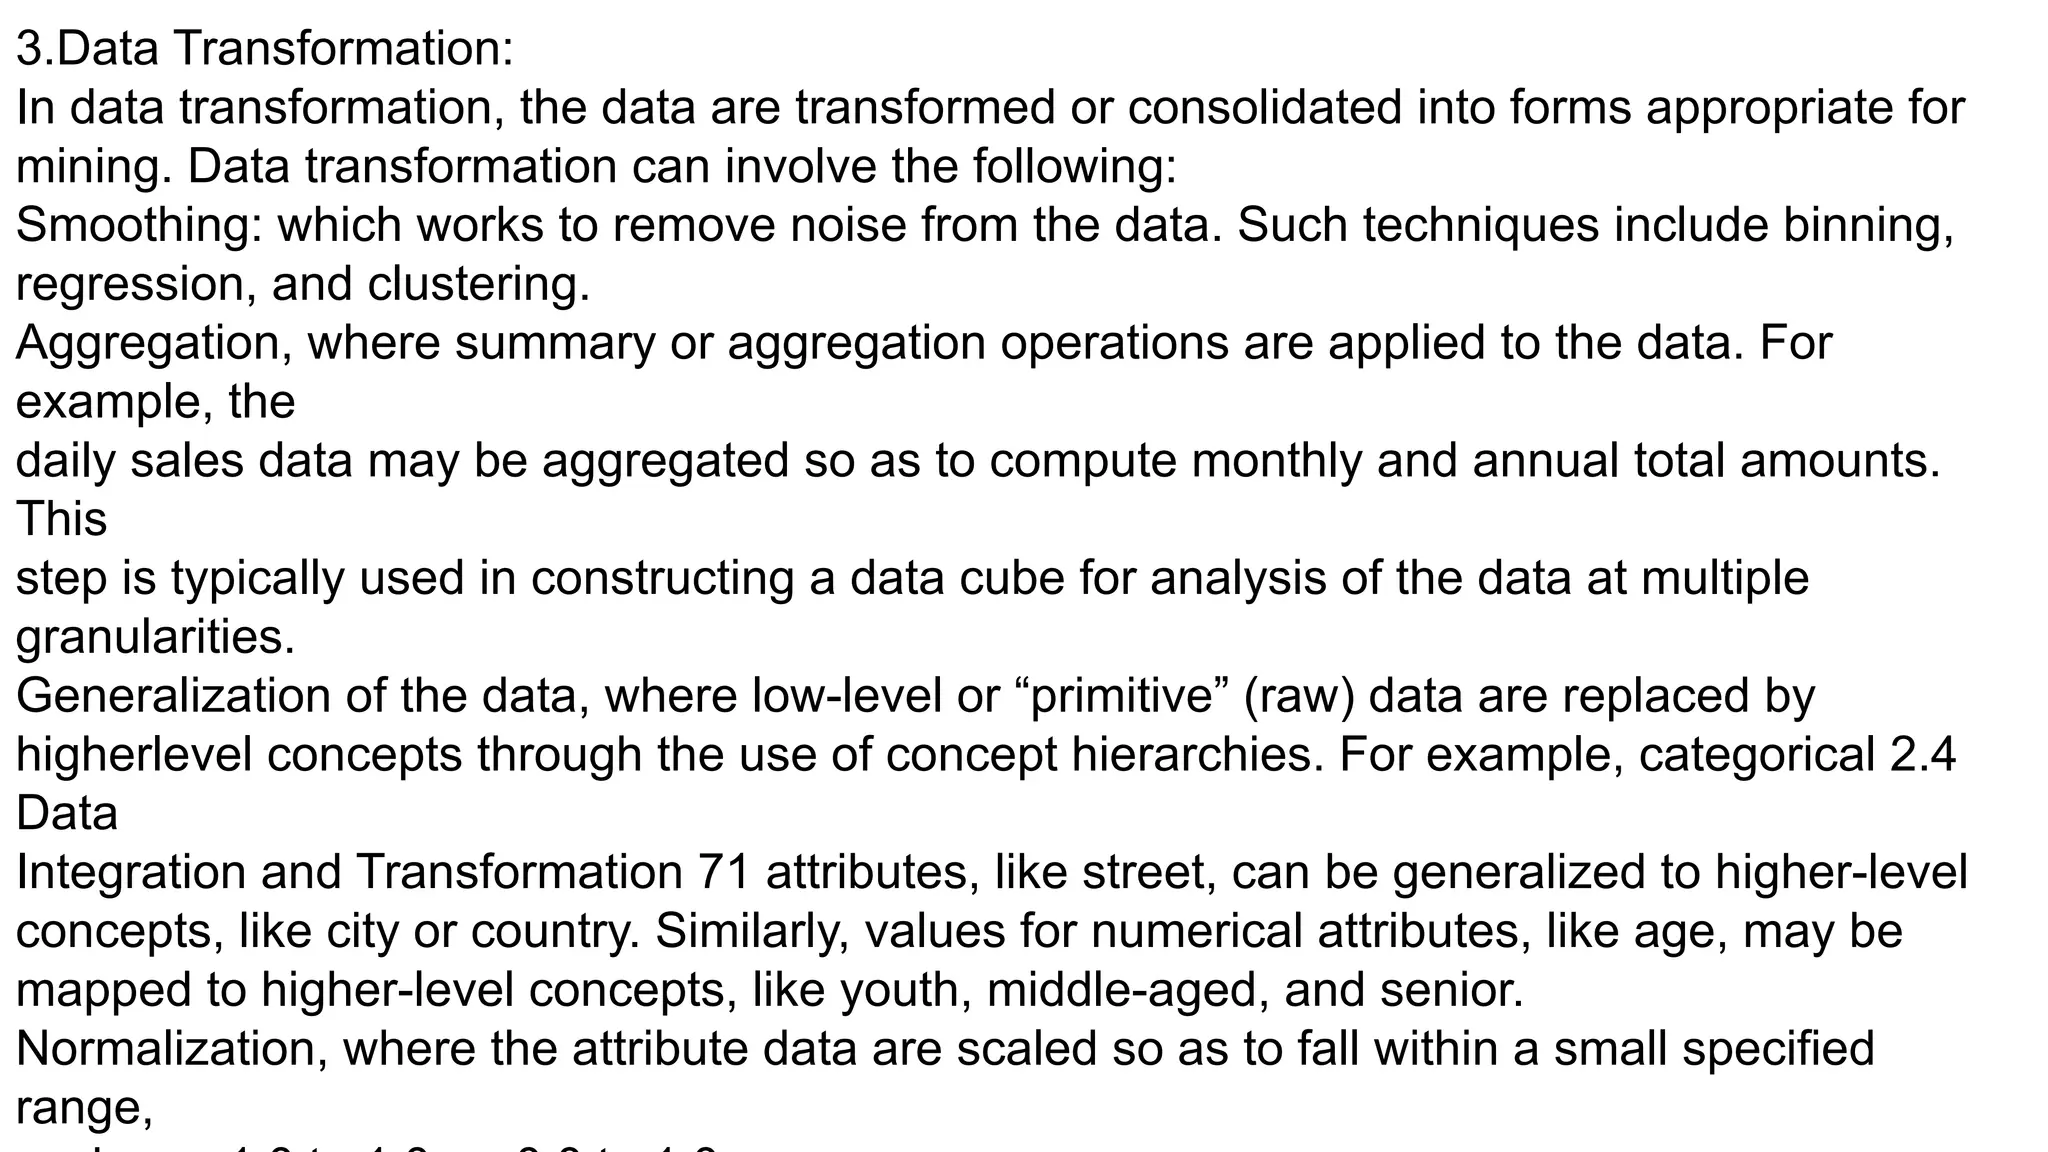
3.Data Transformation:
In datatransformation, the data are transformed or consolidated into forms appropriate for
mining. Data transformation can involve the following:
Smoothing: which works to remove noise from the data. Such techniques include binning,
regression, and clustering.
Aggregation, where summary or aggregation operations are applied to the data. For
example, the
daily sales data may be aggregated so as to compute monthly and annual total amounts.
This
step is typically used in constructing a data cube for analysis of the data at multiple
granularities.
Generalization of the data, where low-level or “primitive” (raw) data are replaced by
higherlevel concepts through the use of concept hierarchies. For example, categorical 2.4
Data
Integration and Transformation 71 attributes, like street, can be generalized to higher-level
concepts, like city or country. Similarly, values for numerical attributes, like age, may be
mapped to higher-level concepts, like youth, middle-aged, and senior.
Normalization, where the attribute data are scaled so as to fall within a small specified
range,
57.
Data reduction
1. Reducingthe number of attributes
o Data cube aggregation: applying roll-up, slice or dice operations.
o Removing irrelevant attributes: attribute selection (filtering and wrapper
methods), searching the attribute space (see Lecture 5: Attribute-oriented
analysis).
o Principle component analysis (numeric attributes only): searching for a lower
dimensional space that can best represent the data..
2. Reducing the number of attribute values
o Binning (histograms): reducing the number of attributes by grouping them into
intervals (bins).
o Clustering: grouping values in clusters.
o Aggregation or generalization
3. Reducing the number of tuples
o Sampling
58.
Discretization and generatingconcept hierarchies
1. Unsupervised discretization - class variable is not used.
o Equal-interval (equiwidth) binning: split the whole range of numbers in
intervals with equal size.
o Equal-frequency (equidepth) binning: use intervals containing equal
number of values.
2. Supervised discretization - uses the values of the class variable.
o Using class boundaries. Three steps:
Sort values.
Place breakpoints between values belonging to different classes.
If too many intervals, merge intervals with equal or similar class
distributions.
o Entropy (information)-based discretization. Example:
Information in a class distribution:


![1.2 DATA MINING FUNCTIONALITIES
Data mining functionalities are used to specify the kind of patterns to be found in
data mining tasks.
Data mining tasks can be classified into two categories: descriptive and
predictive.
Descriptive mining tasks characterize the general properties of the data in the
database. [classification,Regression]
Predictive mining tasks perform inference on the current data in order to make
predictions. [clustering, association]
Concept/Class Description: Characterization and Discrimination
Data can be associated with classes or concepts.
For example, in the Electronics store, classes of items for sale include computers
and printers, and concepts of customers include big Spenders and budget
Spenders.](https://image.slidesharecdn.com/datamining-250911110240-ad2e7f47/85/DATAMINING_PPT_For_My_College_Presentation-pptx-25-320.jpg)


![1.2 DATA MINING FUNCTIONALITIES
Data mining functionalities are used to specify the kind of patterns to be found in
data mining tasks.
Data mining tasks can be classified into two categories: descriptive and
predictive.
Descriptive mining tasks characterize the general properties of the data in the
database. [classification,Regression]
Predictive mining tasks perform inference on the current data in order to make
predictions. [clustering, association]
Concept/Class Description: Characterization and Discrimination
Data can be associated with classes or concepts.
For example, in the Electronics store, classes of items for sale include computers
and printers, and concepts of customers include big Spenders and budget
Spenders.](https://image.slidesharecdn.com/datamining-250911110240-ad2e7f47/75/DATAMINING_PPT_For_My_College_Presentation-pptx-25-2048.jpg)


![RTP_AR_Basic_Learners' Workbook_KS2 [FOR REPRODUCTION] (1).pdf](https://cdn.slidesharecdn.com/ss_thumbnails/rtparbasiclearnersworkbookks2forreproduction1-251016024943-e51a16ac-thumbnail.jpg?width=600ounds&width=560&fit=bounds)

![Matrix and determinant URT [Autosaved].pptx](https://cdn.slidesharecdn.com/ss_thumbnails/matrixanddeterminanturtautosaved-251018190340-9e6a6deb-thumbnail.jpg?width=600ounds&width=560&fit=bounds)


![Agentic Systems and Compliance - A brief intro [1.2]](https://cdn.slidesharecdn.com/ss_thumbnails/agenticsystemsandcompliace-1-251018025303-958a42ec-thumbnail.jpg?width=600ounds&width=560&fit=bounds)


