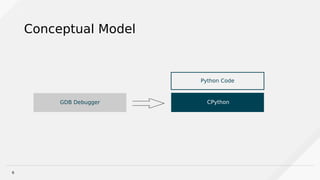
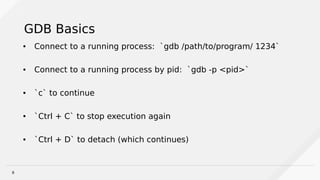
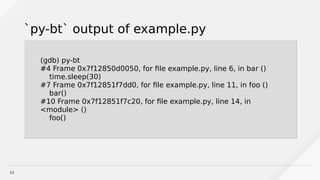
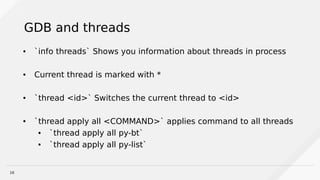
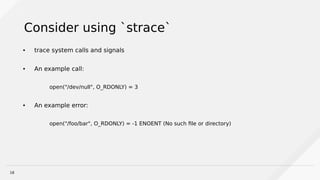
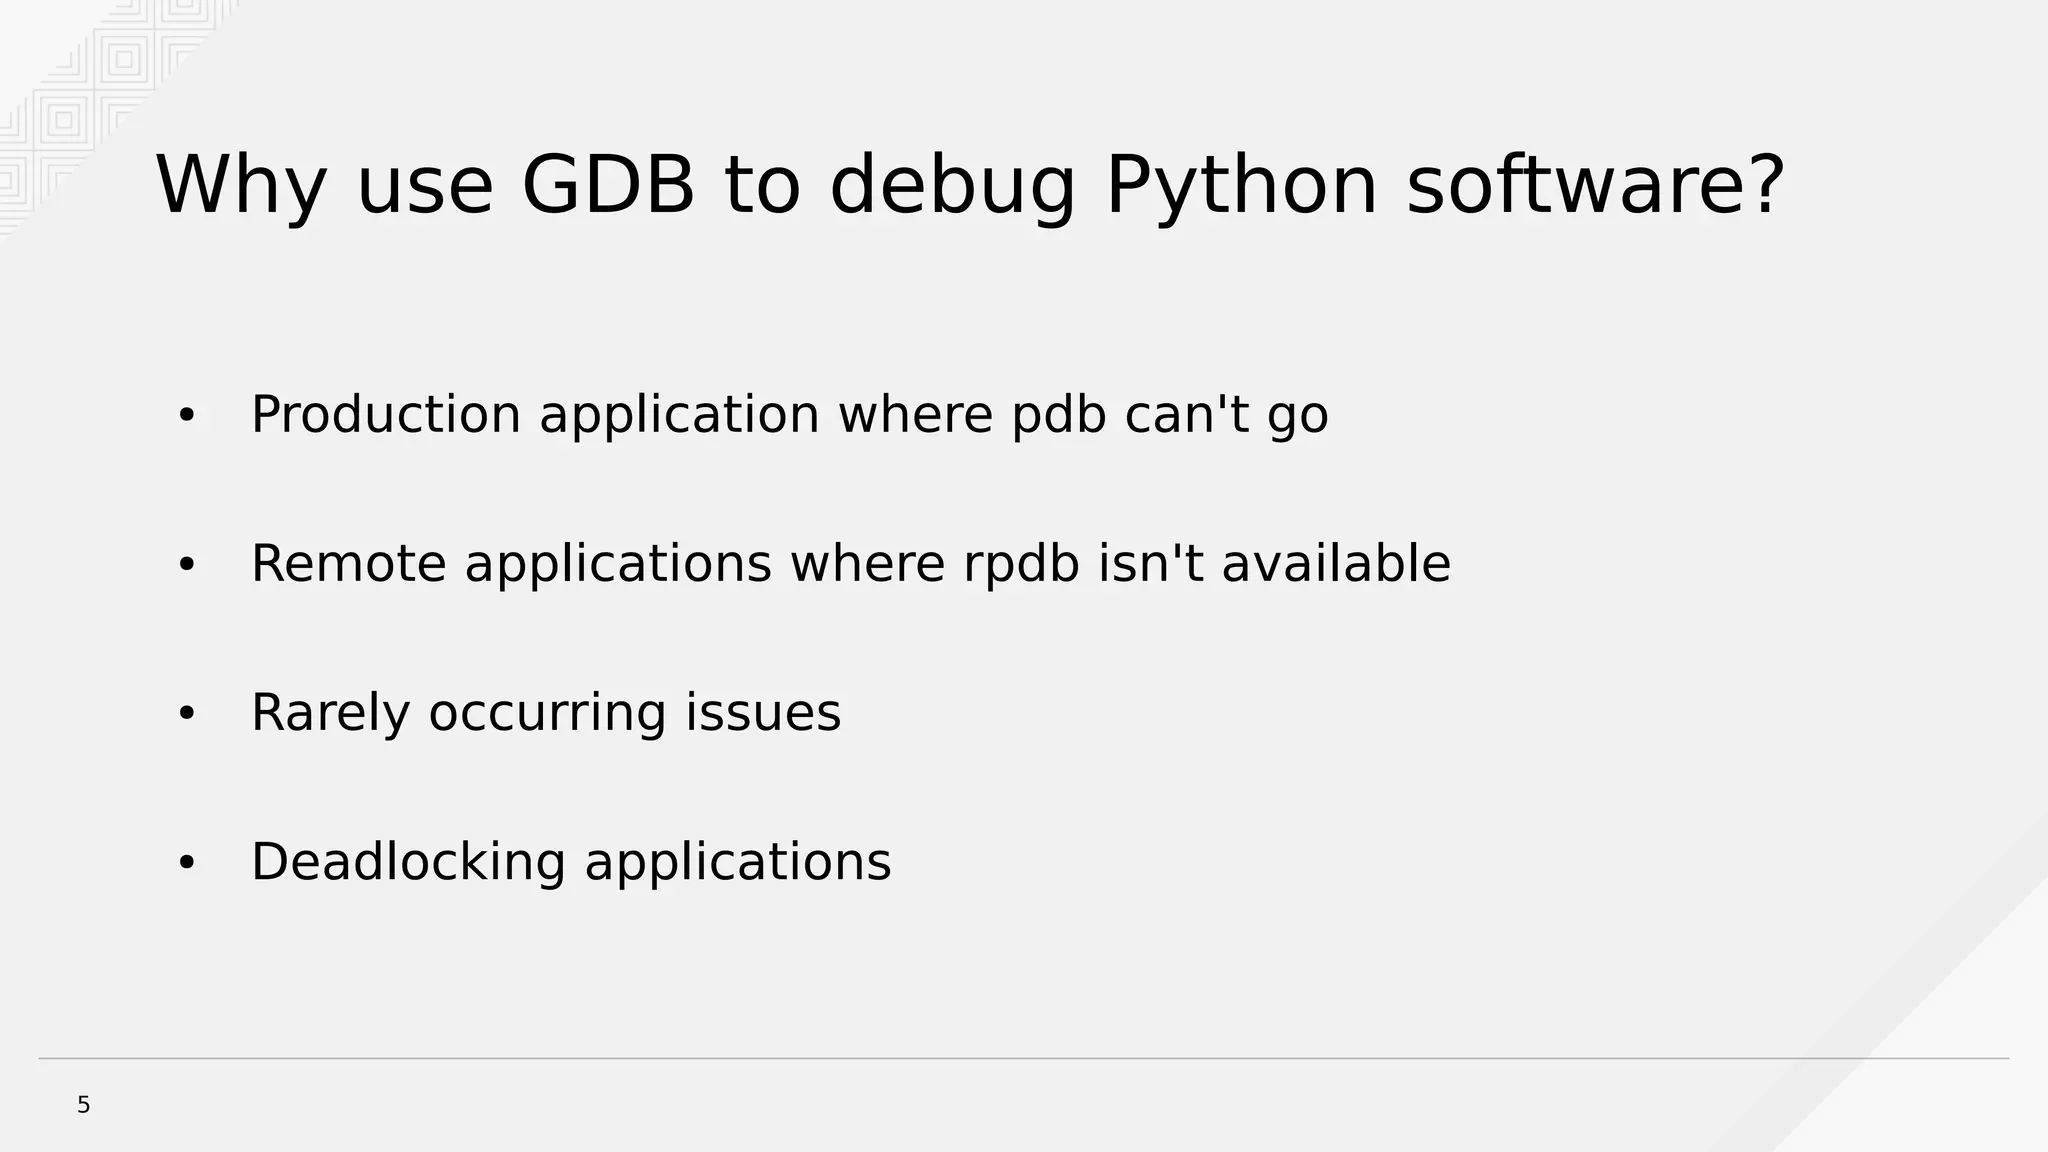
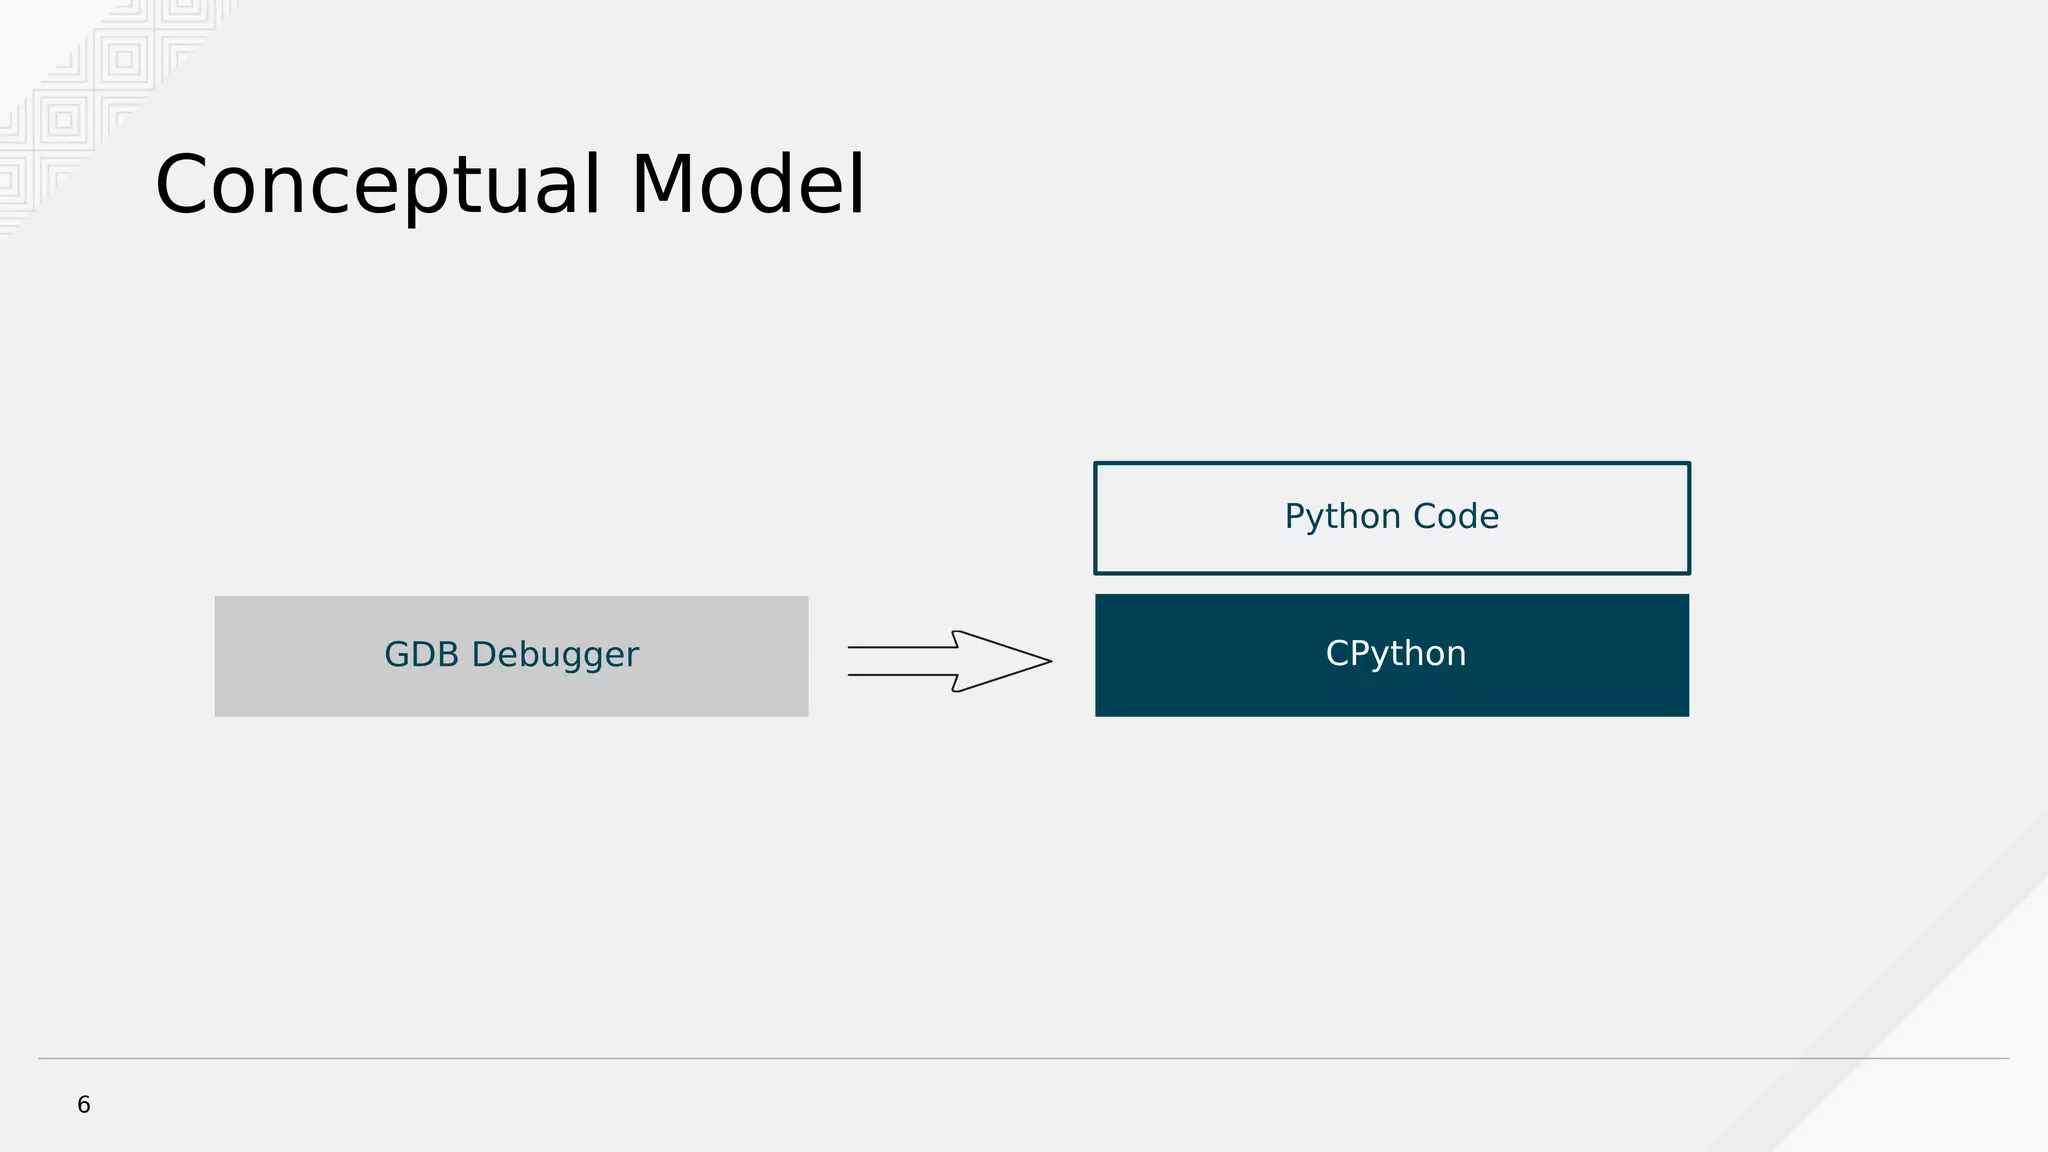
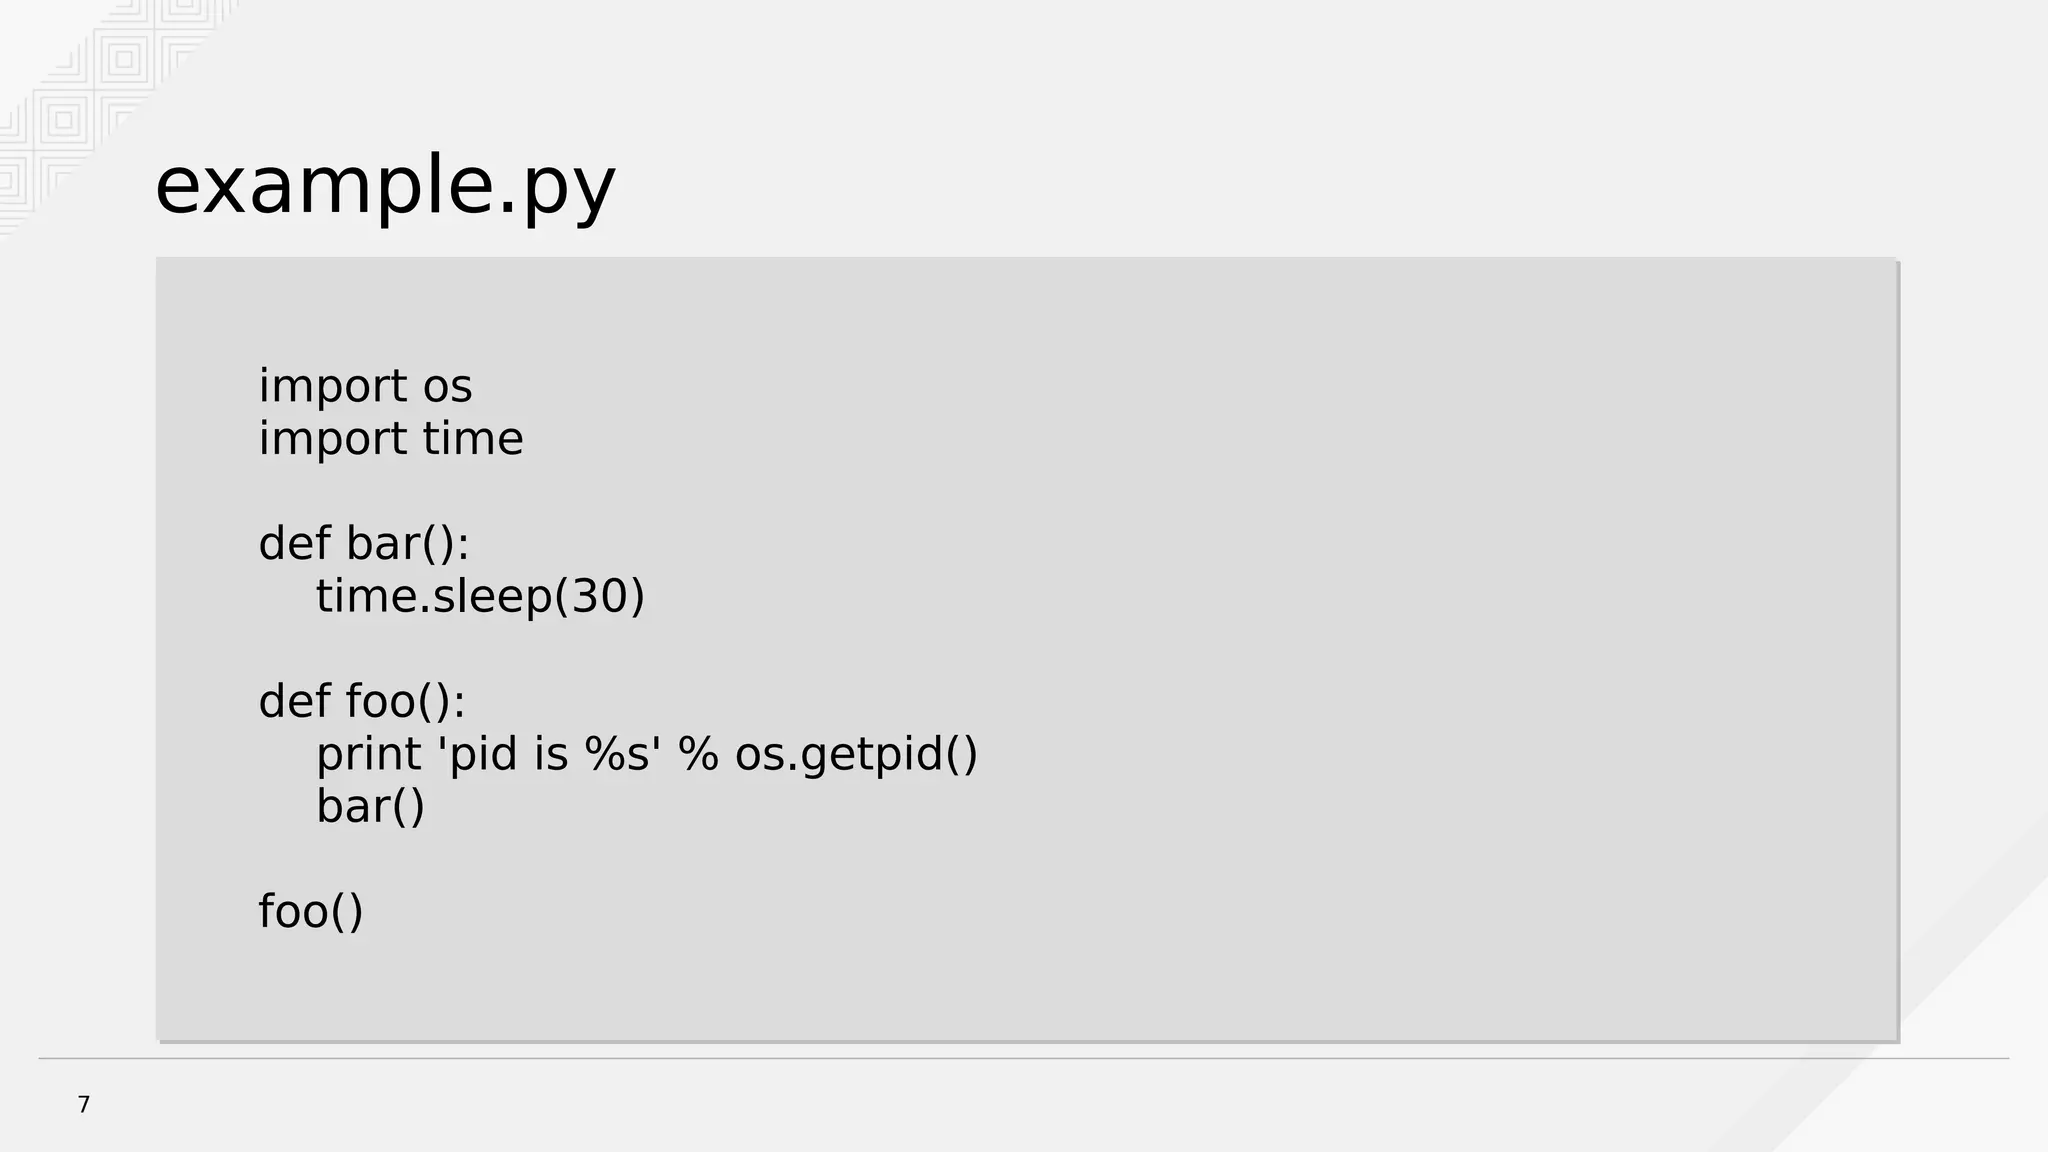
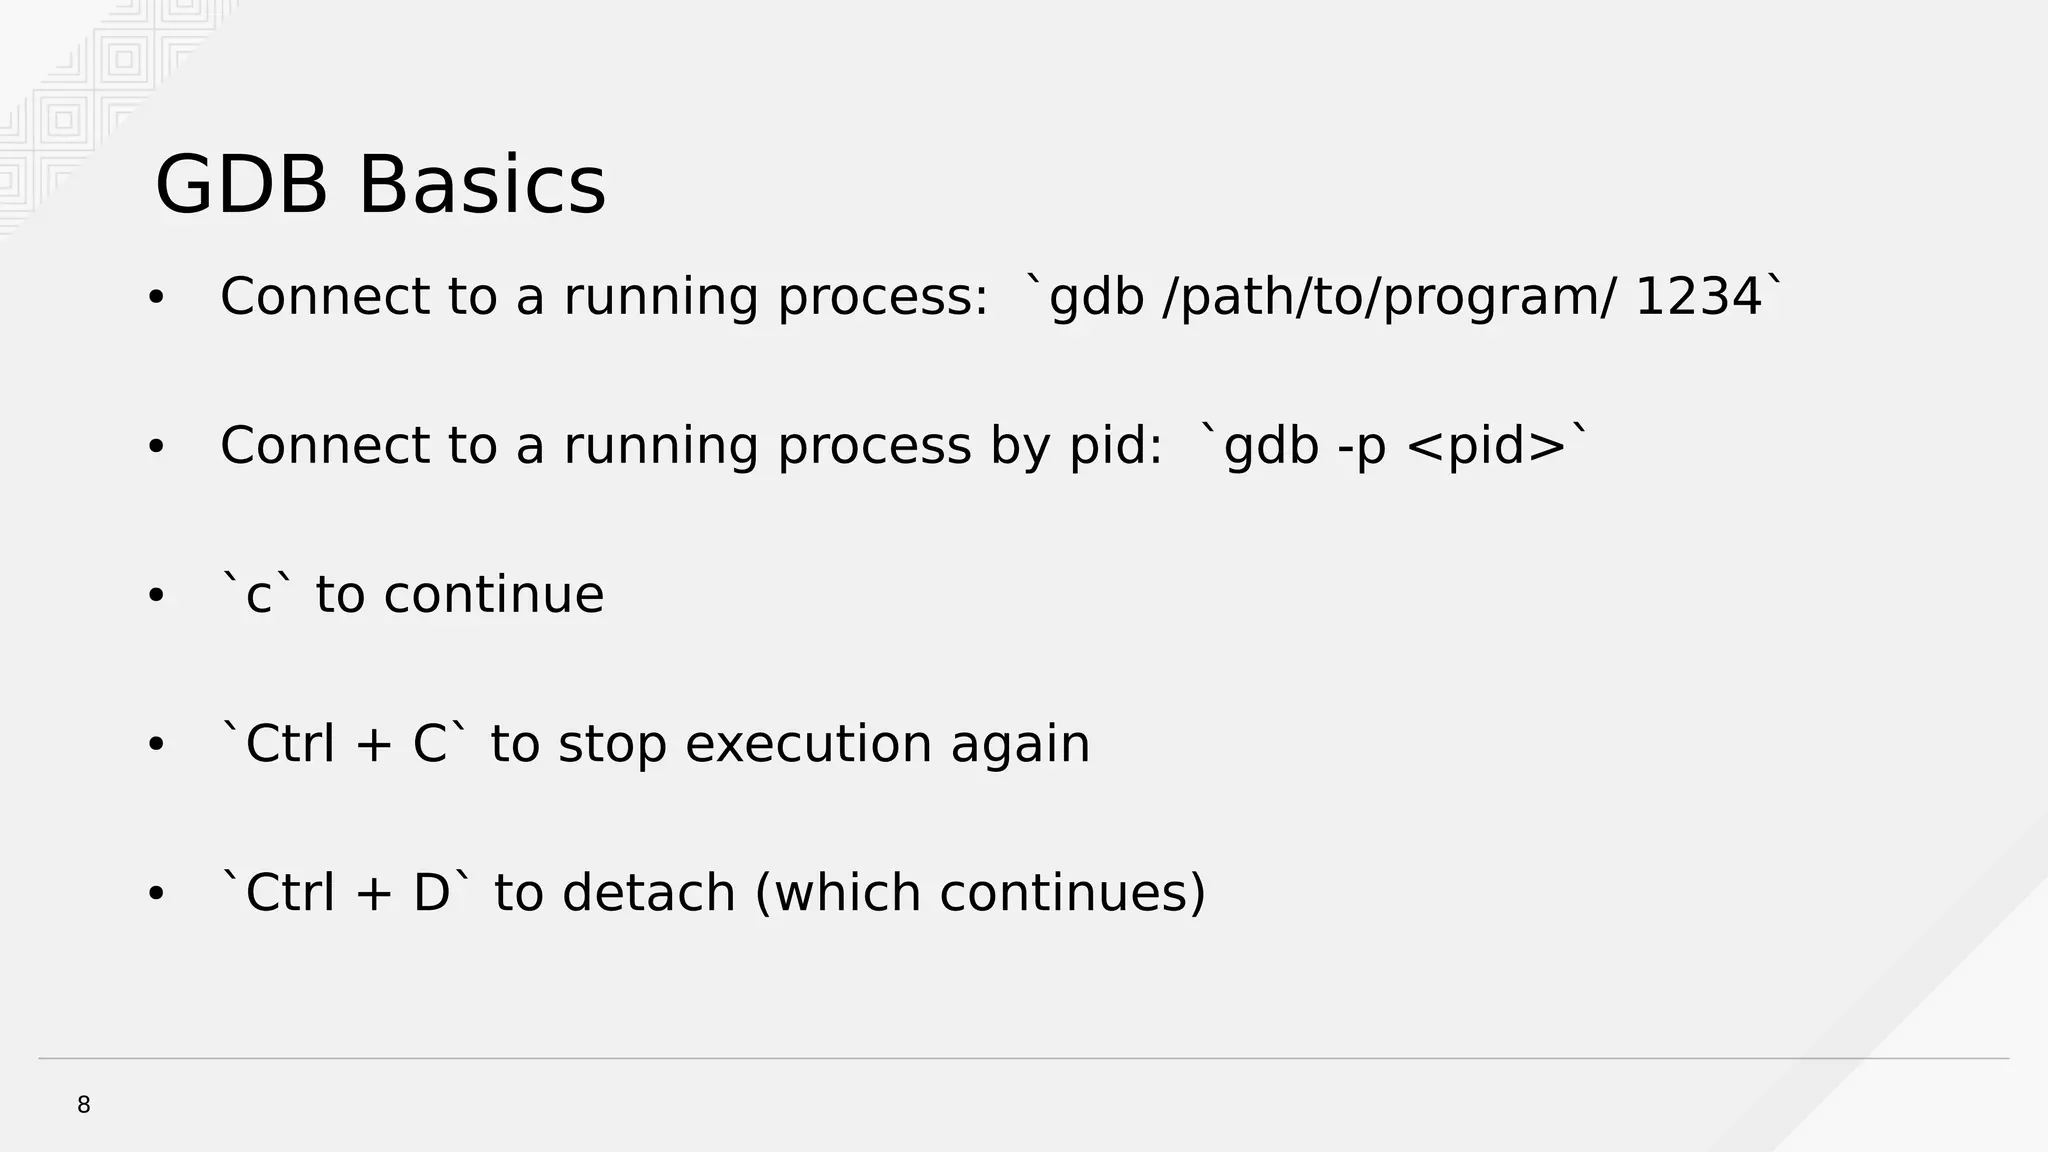
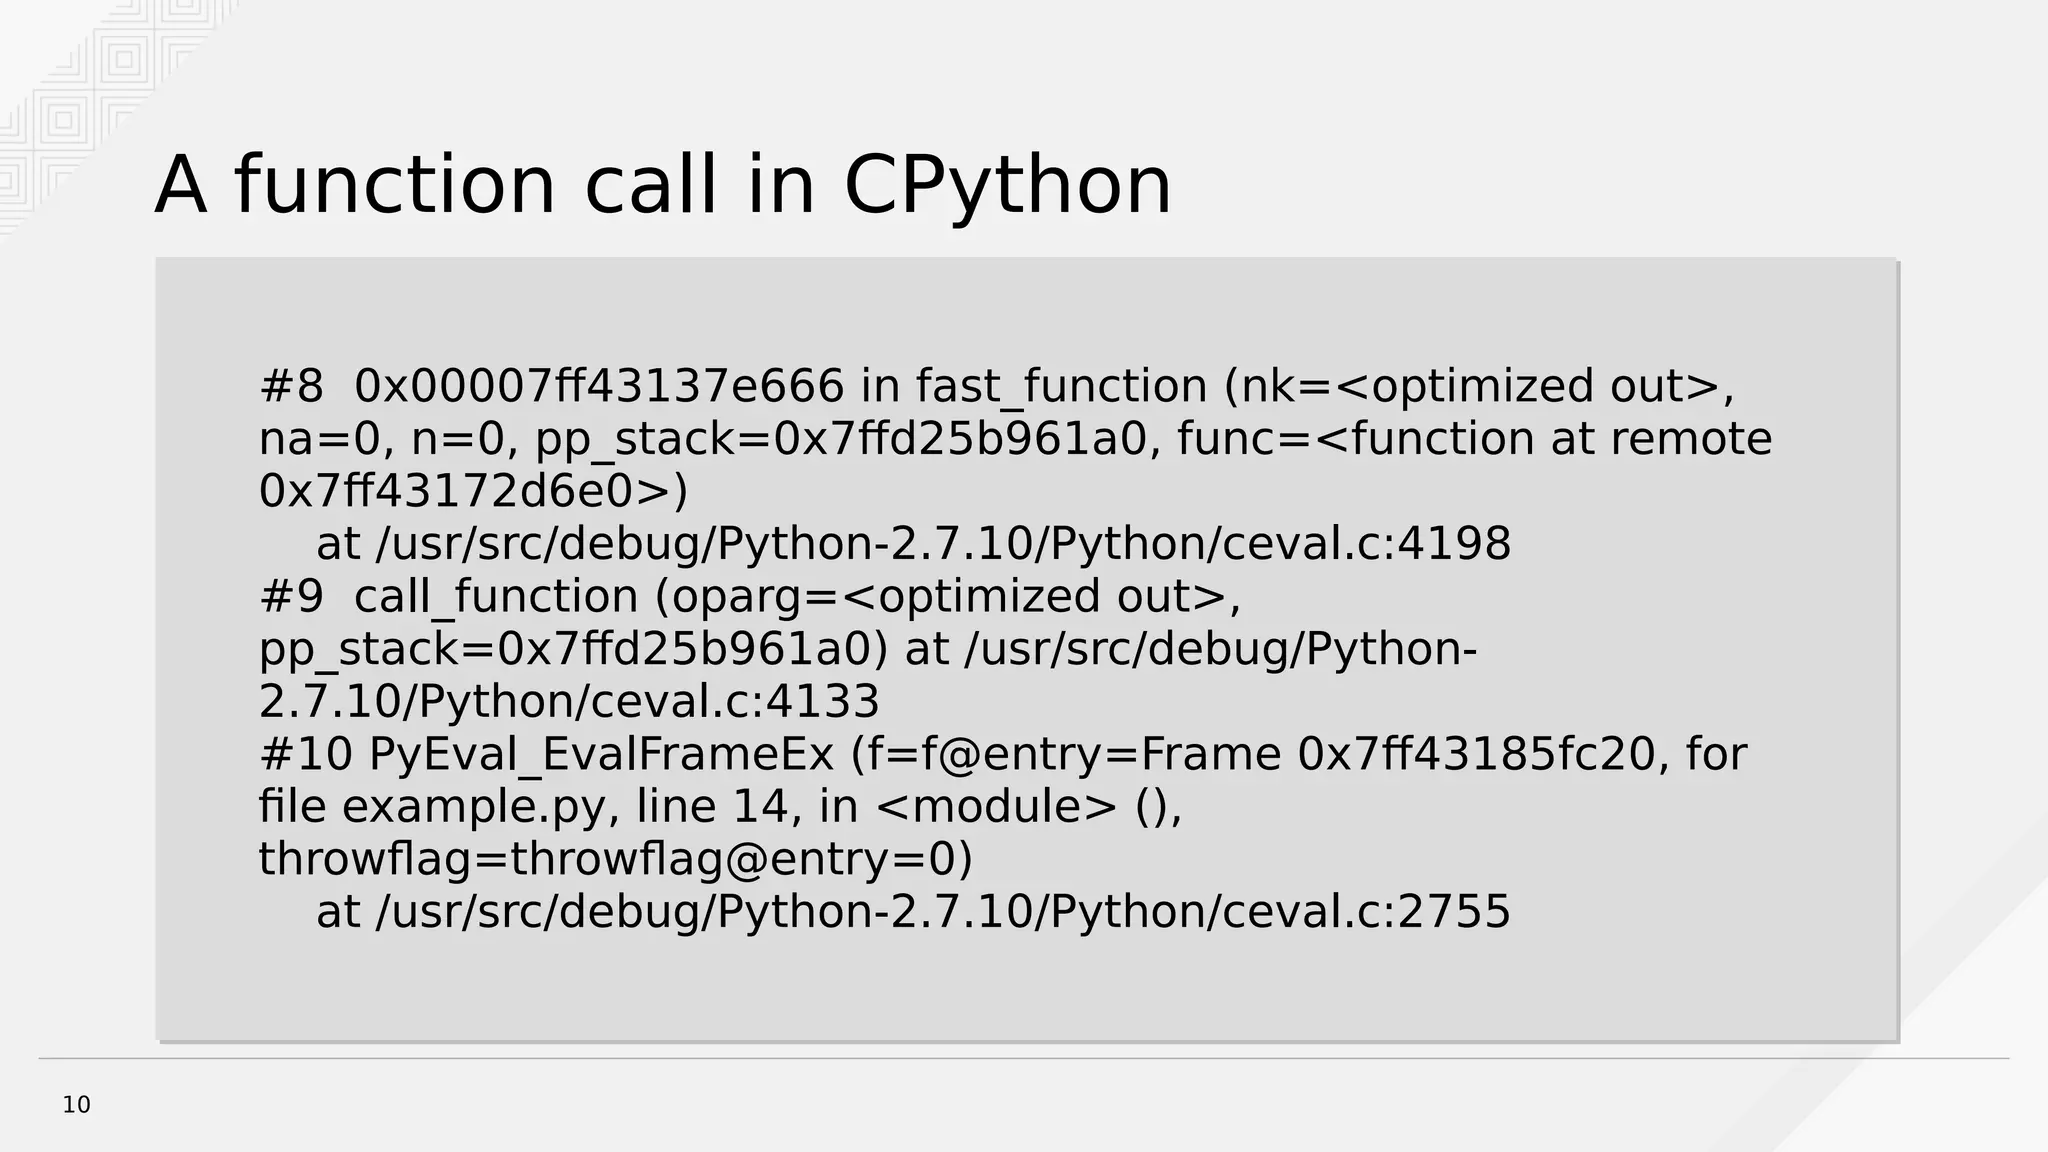
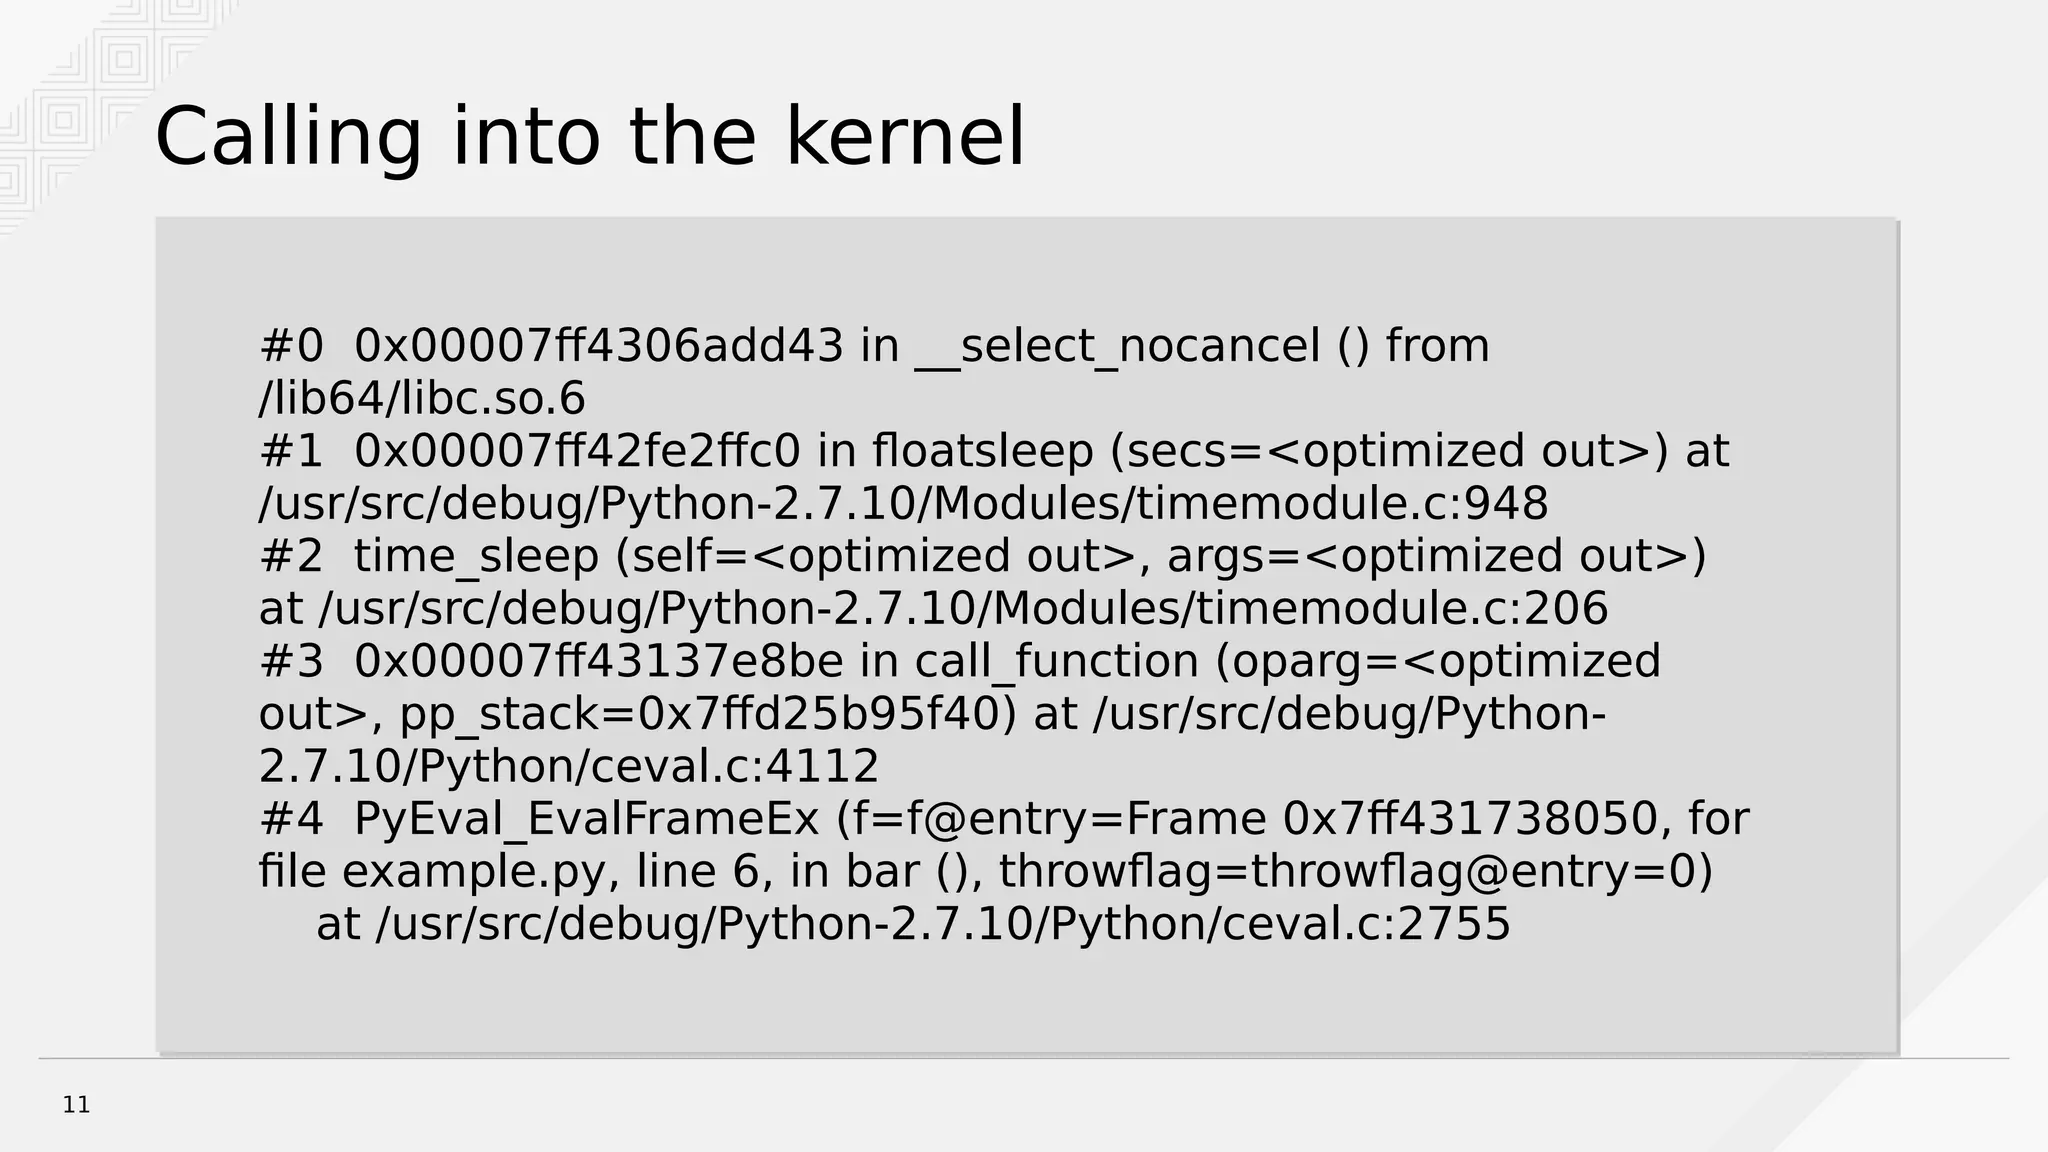
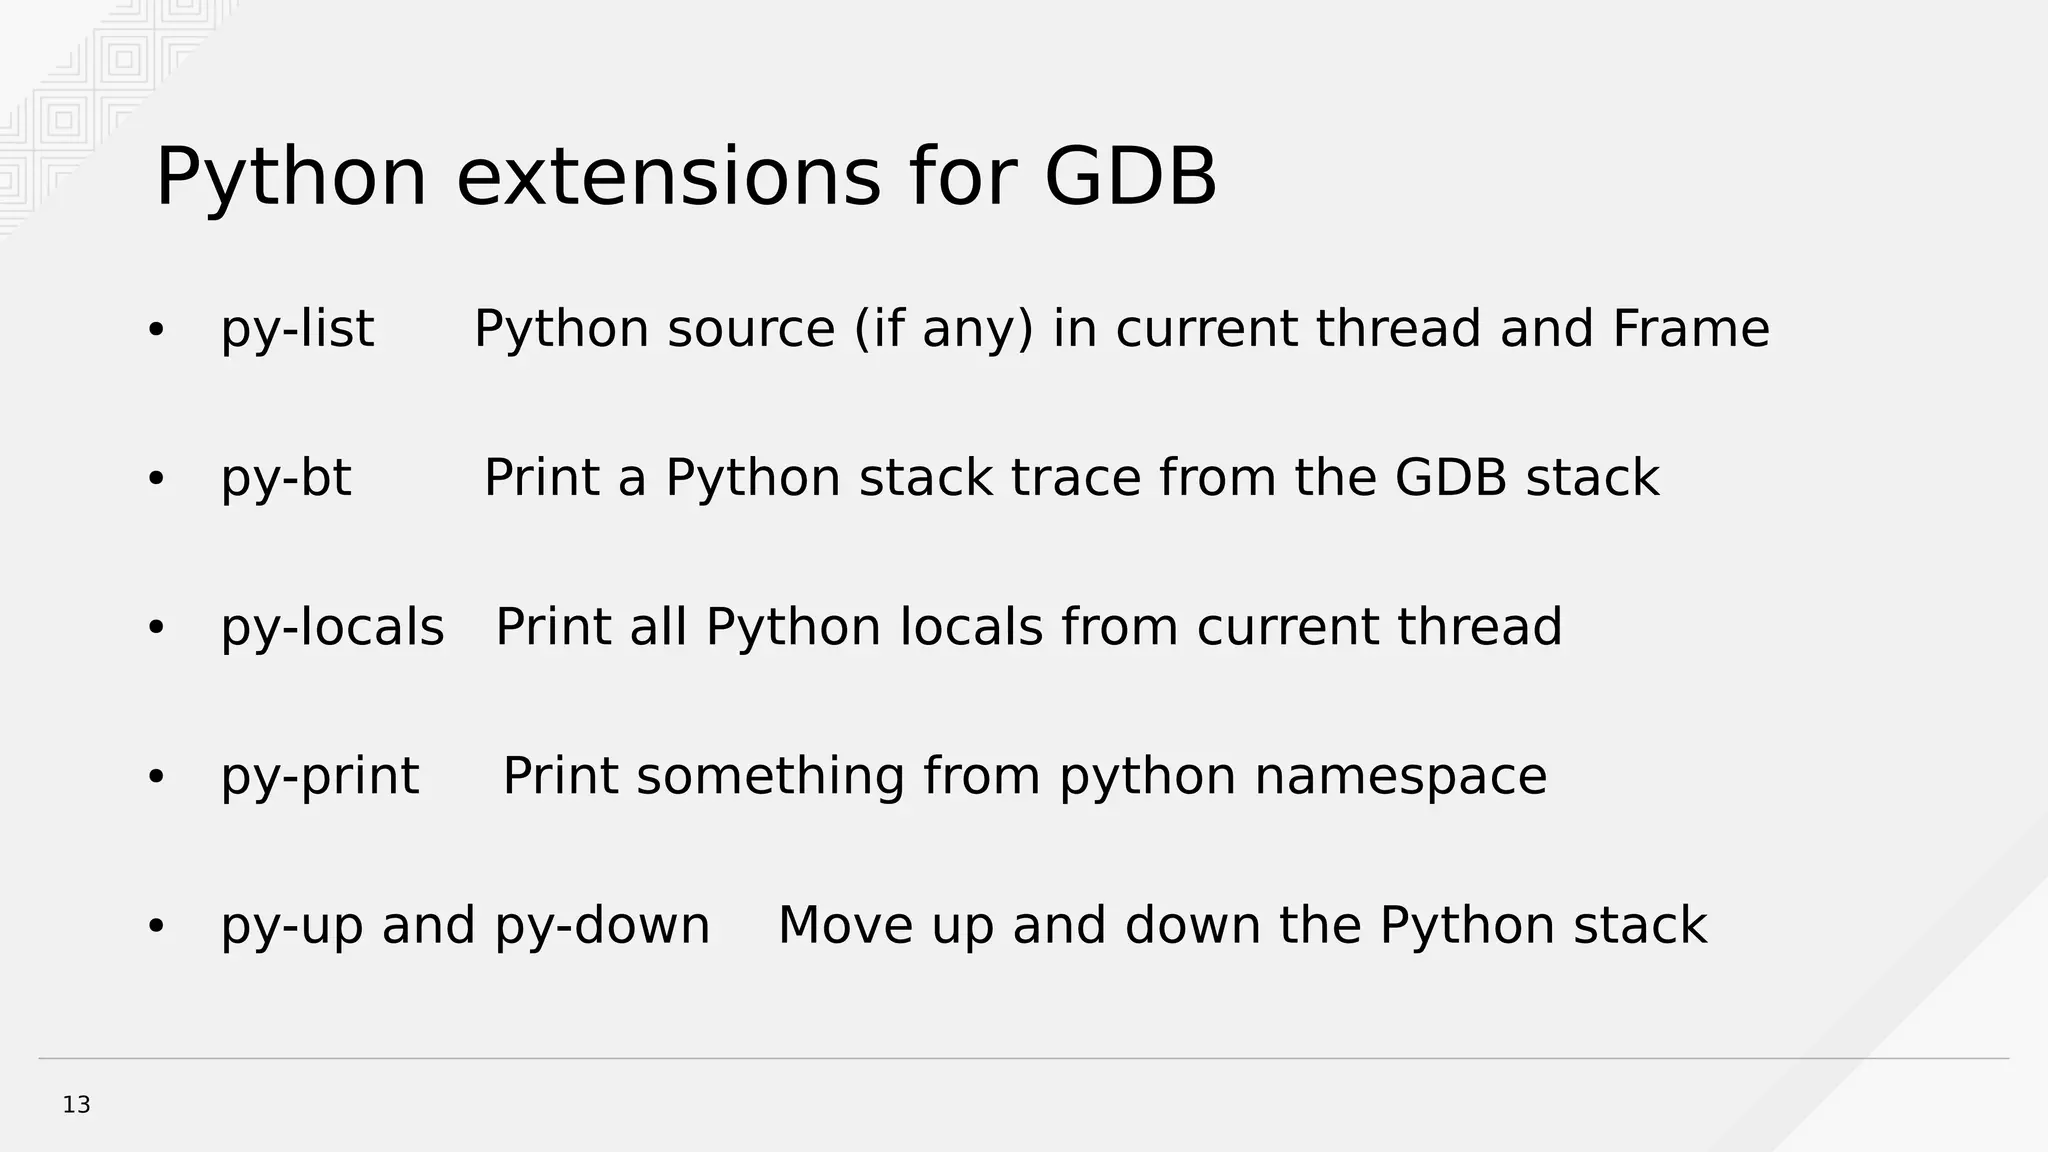
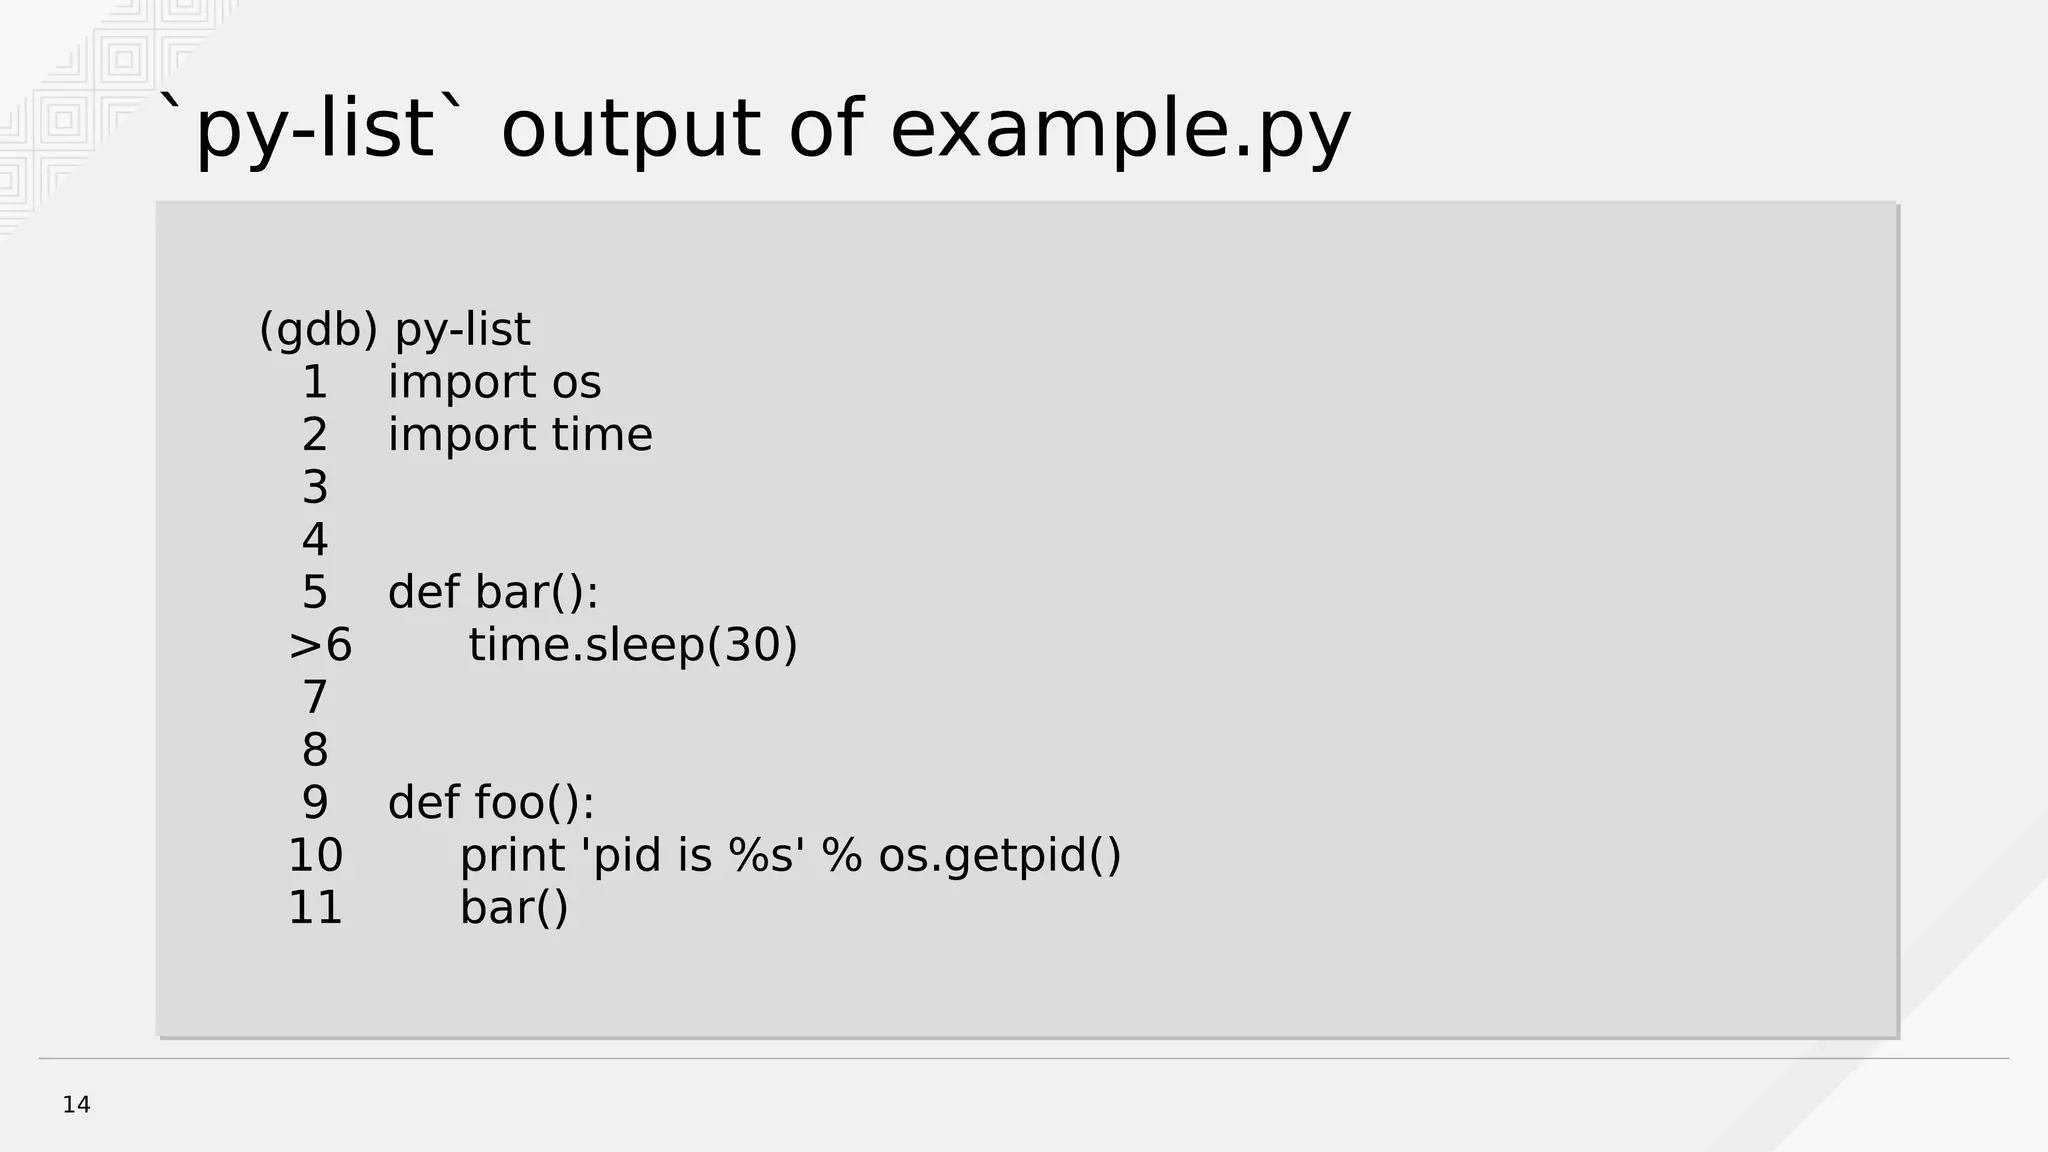
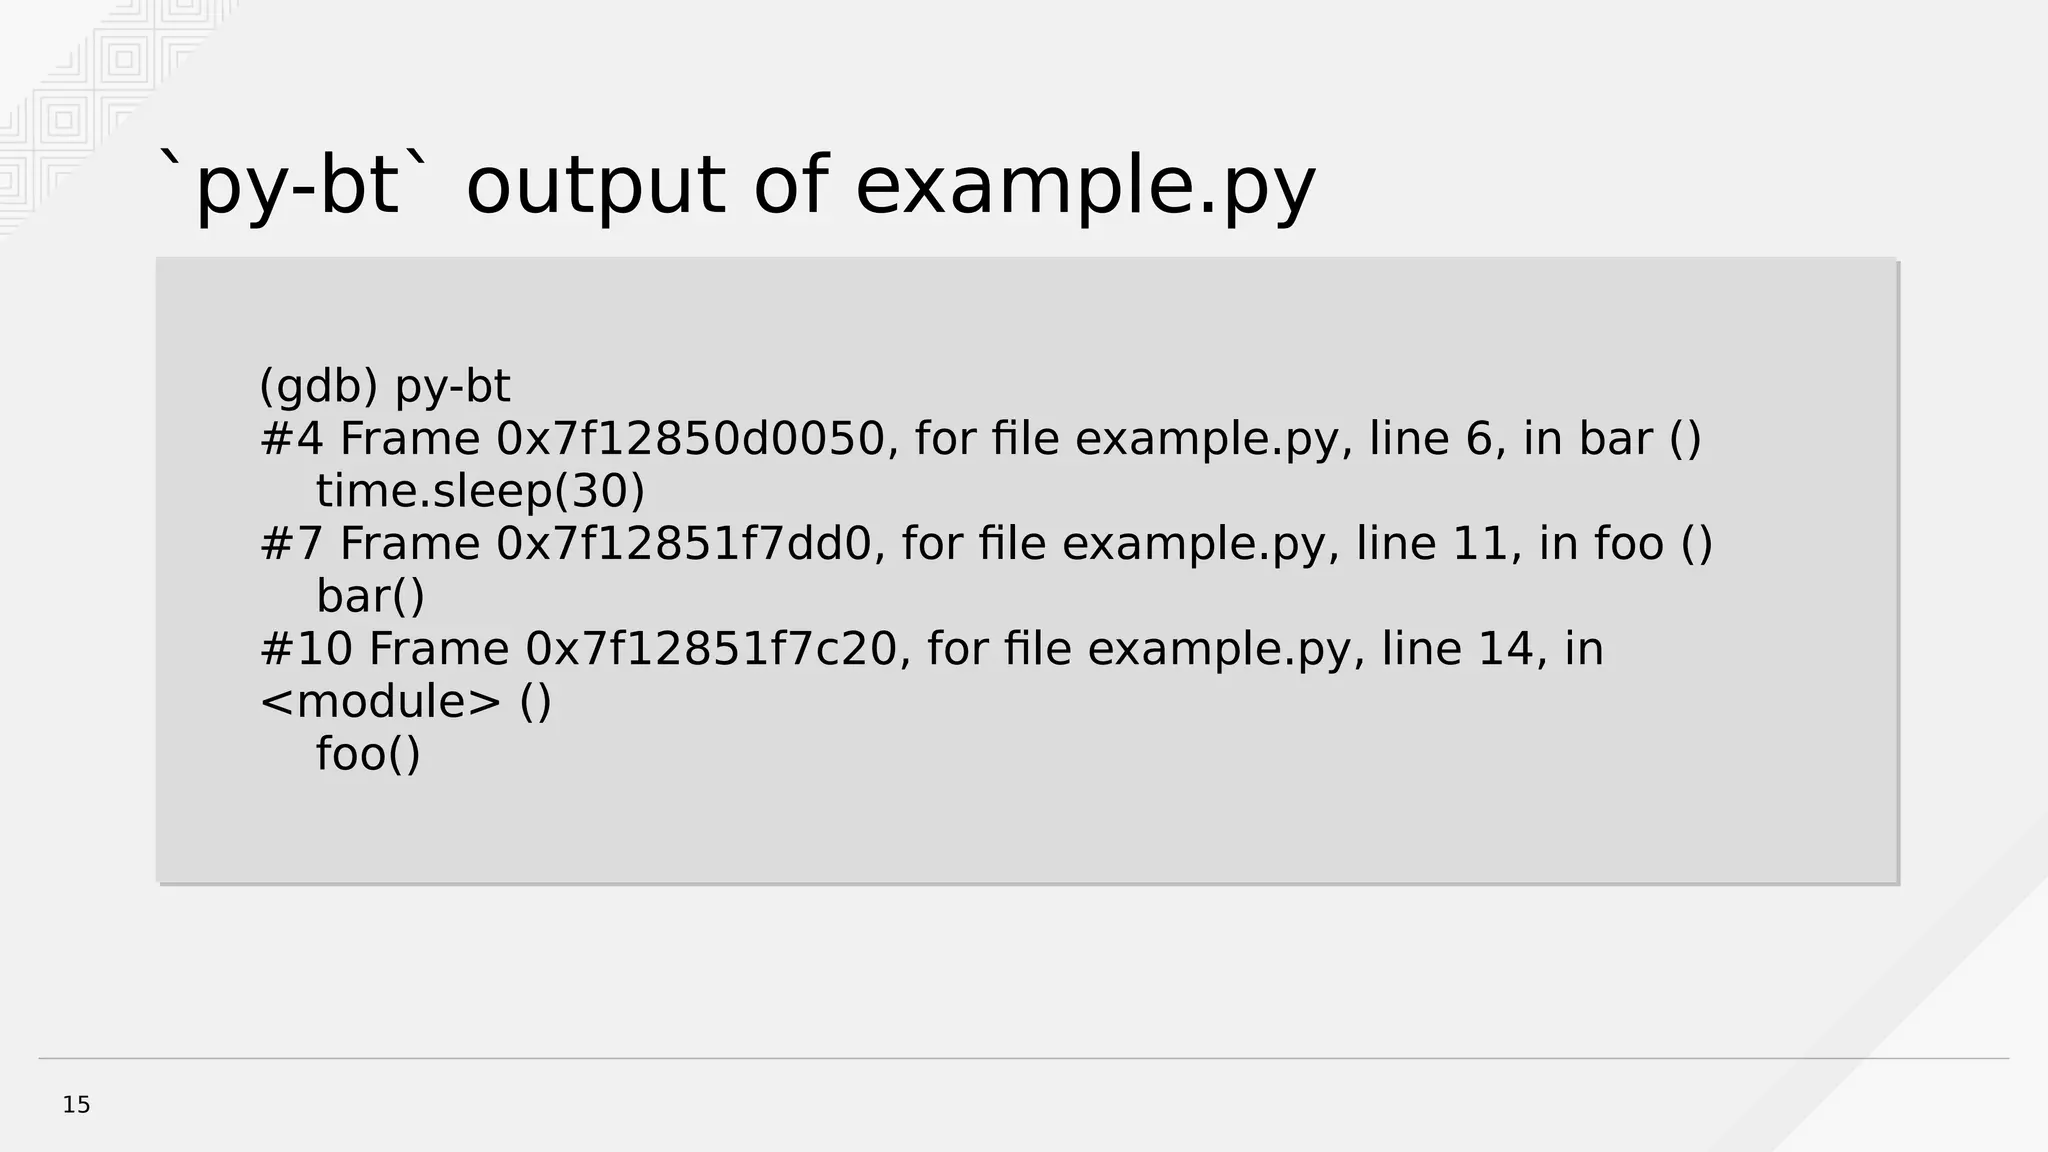
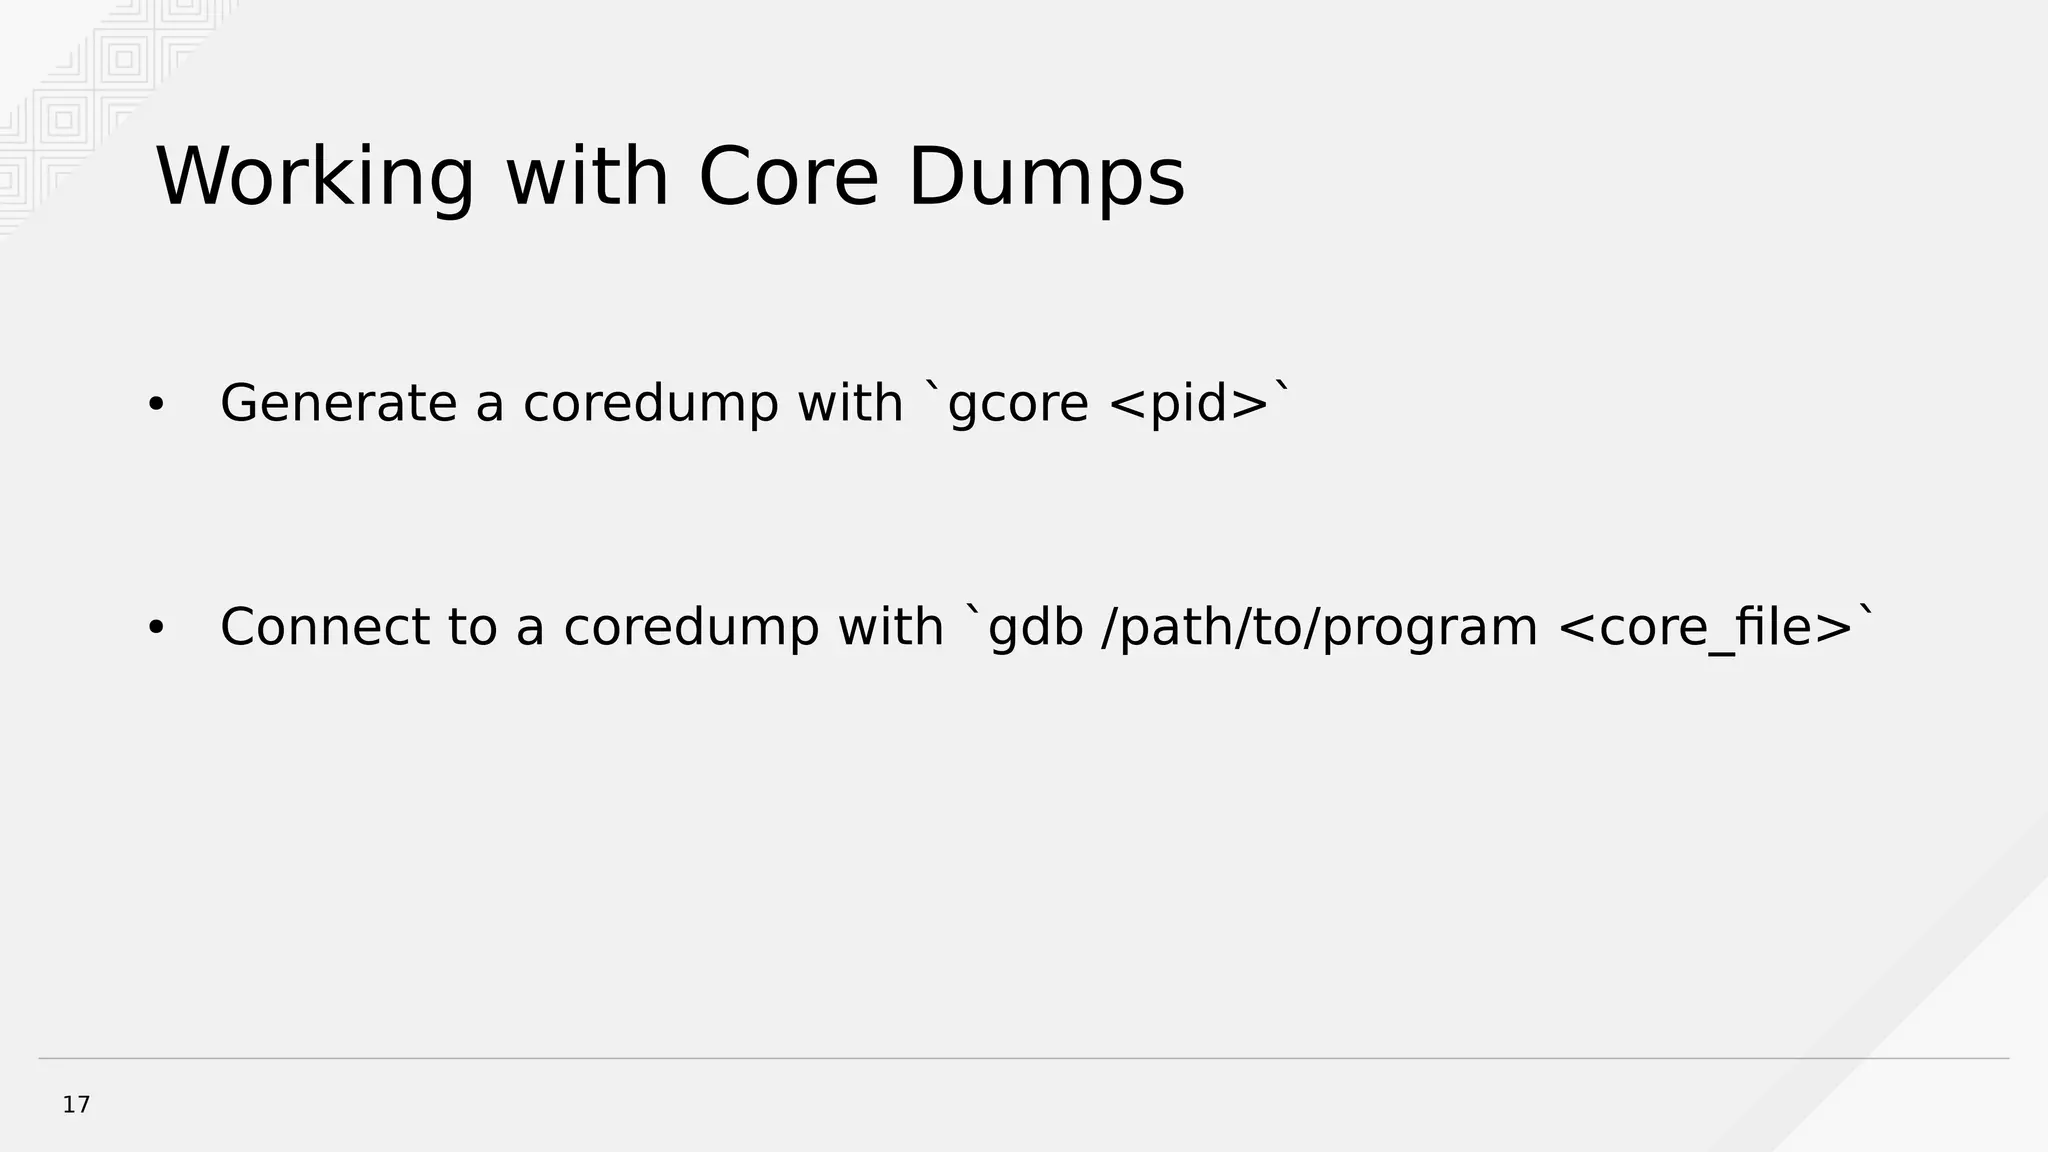
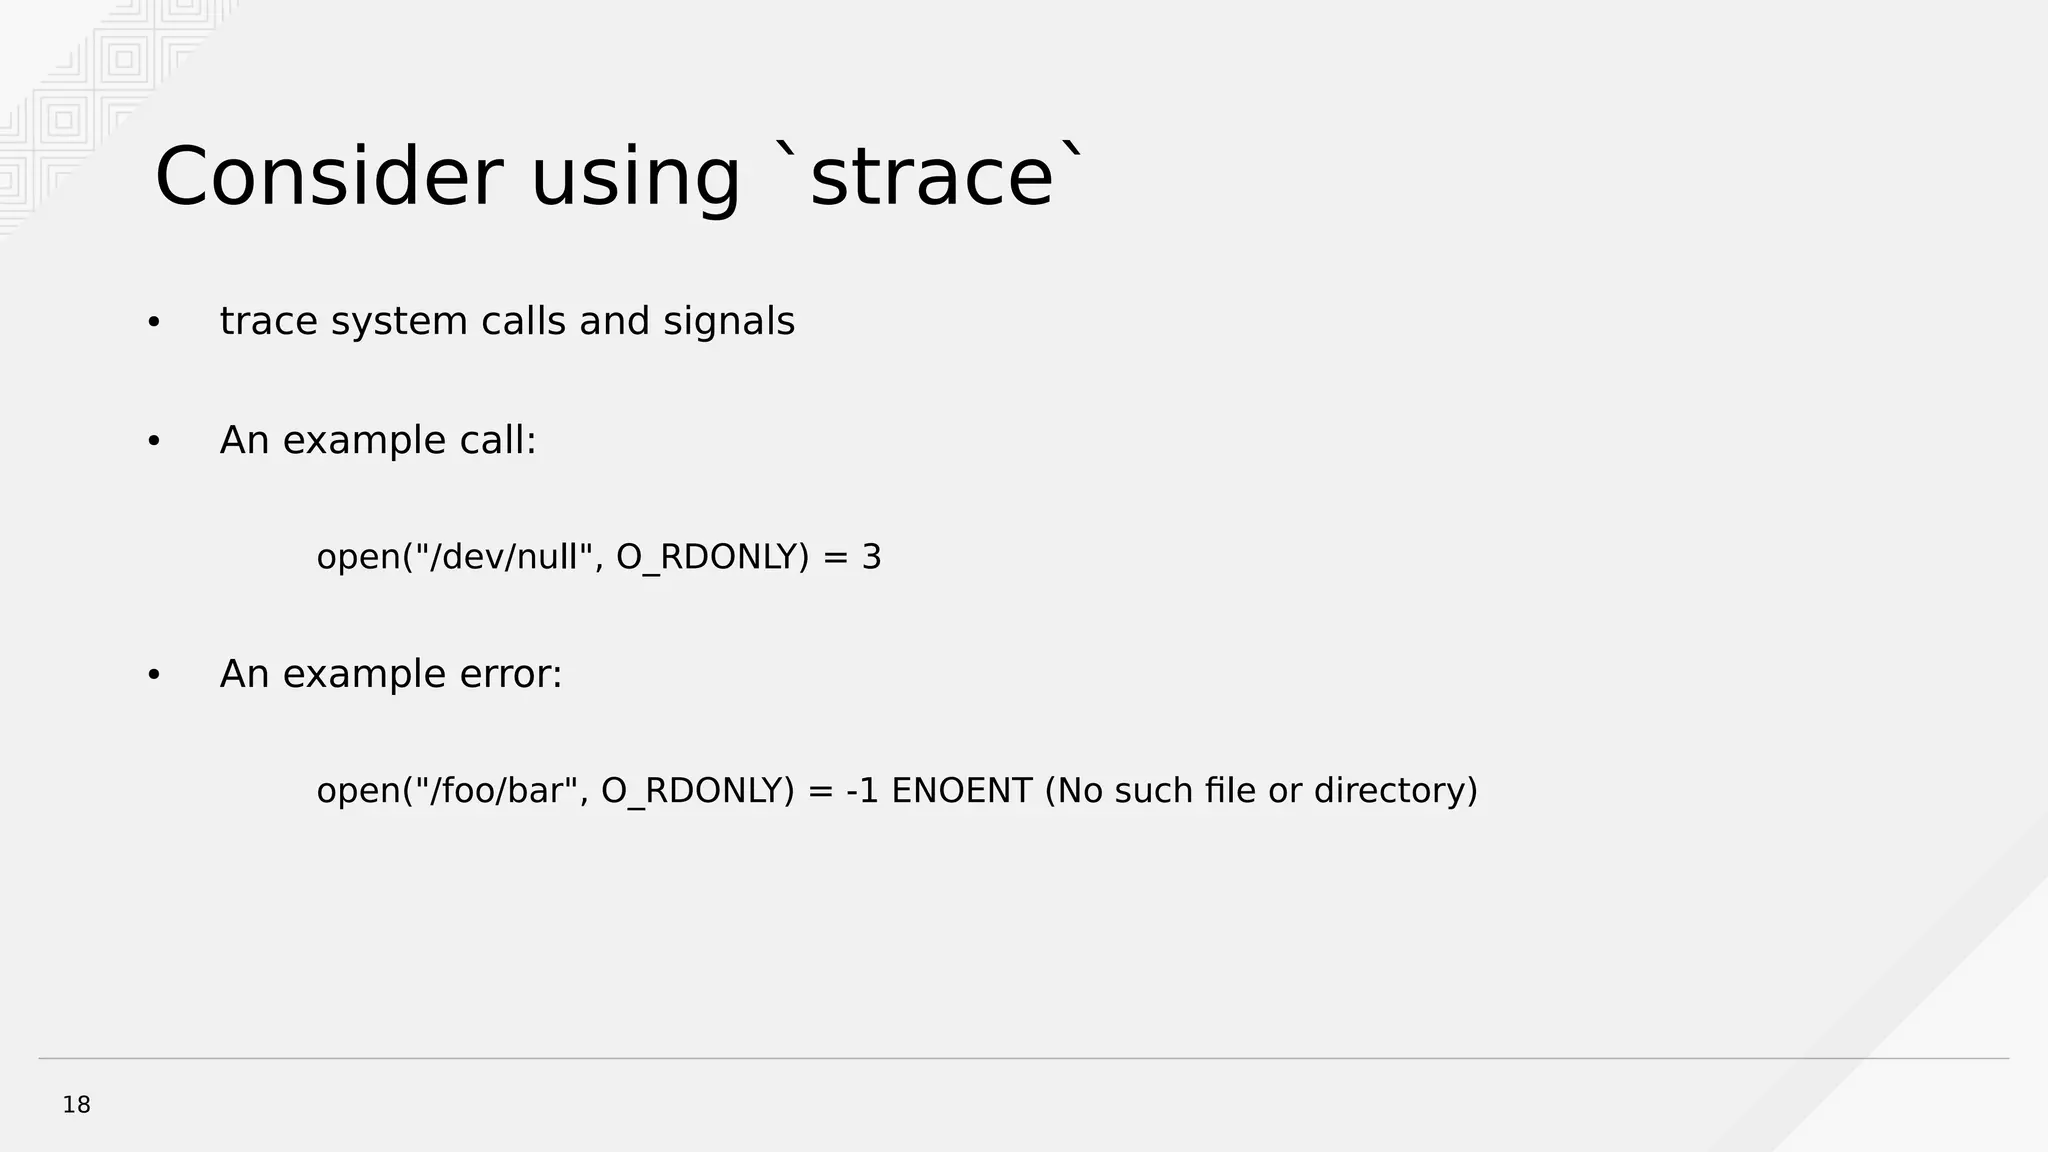
KEMBAR78
Debugging Hung Python Processes With GDB | PDF
Debugging Hung Python Processes
With GDB
Brian Bouterse
Principle Software Engineer, Red Hat.
2
Who Am I?
● Python user since 2005
● Love Free and Open Source
● Principle Software Engineer with Red Hat since 2015
● Work on Pulp ( http://pulpproject.org/ )
● Contribute to several Open Source projects (Kombu, Celery)
3
Why use GDB to debug Python software?
4 http://www.developermemes.com/wp-content/uploads/2013/12/Defect-In-Production-Works-On-My-Machine.jpg
5
Why use GDB to debug Python software?
● Production application where pdb can't go
● Remote applications where rpdb isn't available
● Rarely occurring issues
● Deadlocking applications
6
Conceptual Model
CPython
Python Code
GDB Debugger
7
example.py
import os
import time
def bar():
time.sleep(30)
def foo():
print 'pid is %s' % os.getpid()
bar()
foo()
import os
import time
def bar():
time.sleep(30)
def foo():
print 'pid is %s' % os.getpid()
bar()
foo()
8
GDB Basics
● Connect to a running process: `gdb /path/to/program/ 1234`
● Connect to a running process by pid: `gdb -p <pid>`
● `c` to continue
● `Ctrl + C` to stop execution again
● `Ctrl + D` to detach (which continues)
9
Demo of basics + `bt`
10
A function call in CPython
#8 0x00007ff43137e666 in fast_function (nk=<optimized out>,
na=0, n=0, pp_stack=0x7ffd25b961a0, func=<function at remote
0x7ff43172d6e0>)
at /usr/src/debug/Python-2.7.10/Python/ceval.c:4198
#9 call_function (oparg=<optimized out>,
pp_stack=0x7ffd25b961a0) at /usr/src/debug/Python-
2.7.10/Python/ceval.c:4133
#10 PyEval_EvalFrameEx (f=f@entry=Frame 0x7ff43185fc20, for
file example.py, line 14, in <module> (),
throwflag=throwflag@entry=0)
at /usr/src/debug/Python-2.7.10/Python/ceval.c:2755
11
Calling into the kernel
#0 0x00007ff4306add43 in __select_nocancel () from
/lib64/libc.so.6
#1 0x00007ff42fe2ffc0 in floatsleep (secs=<optimized out>) at
/usr/src/debug/Python-2.7.10/Modules/timemodule.c:948
#2 time_sleep (self=<optimized out>, args=<optimized out>)
at /usr/src/debug/Python-2.7.10/Modules/timemodule.c:206
#3 0x00007ff43137e8be in call_function (oparg=<optimized
out>, pp_stack=0x7ffd25b95f40) at /usr/src/debug/Python-
2.7.10/Python/ceval.c:4112
#4 PyEval_EvalFrameEx (f=f@entry=Frame 0x7ff431738050, for
file example.py, line 6, in bar (), throwflag=throwflag@entry=0)
at /usr/src/debug/Python-2.7.10/Python/ceval.c:2755
12
Python extensions for GDB
Thanks David Malcolm (dmalcolm)
13
Python extensions for GDB
● py-list Python source (if any) in current thread and Frame
● py-bt Print a Python stack trace from the GDB stack
● py-locals Print all Python locals from current thread
● py-print Print something from python namespace
● py-up and py-down Move up and down the Python stack
14
`py-list` output of example.py
(gdb) py-list
1 import os
2 import time
3
4
5 def bar():
>6 time.sleep(30)
7
8
9 def foo():
10 print 'pid is %s' % os.getpid()
11 bar()
(gdb) py-list
1 import os
2 import time
3
4
5 def bar():
>6 time.sleep(30)
7
8
9 def foo():
10 print 'pid is %s' % os.getpid()
11 bar()
15
`py-bt` output of example.py
(gdb) py-bt
#4 Frame 0x7f12850d0050, for file example.py, line 6, in bar ()
time.sleep(30)
#7 Frame 0x7f12851f7dd0, for file example.py, line 11, in foo ()
bar()
#10 Frame 0x7f12851f7c20, for file example.py, line 14, in
<module> ()
foo()
(gdb) py-bt
#4 Frame 0x7f12850d0050, for file example.py, line 6, in bar ()
time.sleep(30)
#7 Frame 0x7f12851f7dd0, for file example.py, line 11, in foo ()
bar()
#10 Frame 0x7f12851f7c20, for file example.py, line 14, in
<module> ()
foo()
16
GDB and threads
● `info threads` Shows you information about threads in process
● Current thread is marked with *
● `thread <id>` Switches the current thread to <id>
● `thread apply all <COMMAND>` applies command to all threads
● `thread apply all py-bt`
● `thread apply all py-list`
17
Working with Core Dumps
● Generate a coredump with `gcore <pid>`
● Connect to a coredump with `gdb /path/to/program <core_file>`
18
Consider using `strace`
● trace system calls and signals
● An example call:
open("/dev/null", O_RDONLY) = 3
● An example error:
open("/foo/bar", O_RDONLY) = -1 ENOENT (No such file or directory)
19
strace demo
`strace python example.py`
20
Better Demo
21
Gotchas
● You need debuginfo libraries installed
● GDB will tell you what you need
● Your packages need to be the same as the ones gdb wants
● Optimized out Python code removes GDB's ability to see it
● Root is required to connect other user's processes
22
Trigger rpdb.set_trace() with a signal
● Add a signal handler which triggers rpdb.set_trace()
● Make it yourself or let rpdb do it. Recent versions have it build in.
● set_trace() can be triggered at any time by using the TRAP signal handler
import rpdb
rpdb.handle_trap()
# As with set_trace, you can optionally specify addr and port
rpdb.handle_trap("0.0.0.0", 54321)
import rpdb
rpdb.handle_trap()
# As with set_trace, you can optionally specify addr and port
rpdb.handle_trap("0.0.0.0", 54321)
23
● https://wiki.python.org/moin/DebuggingWithGdb
● https://fedoraproject.org/wiki/Features/EasierPythonDebugging
● https://sourceware.org/gdb/current/onlinedocs/gdb/Threads.html
● https://github.com/tamentis/rpdb#trigger-rpdb-with-signal
● http://bugs.python.org/issue8032
Brian Bouterse
bbouterse@redhat.com
bmbouter on freenode
References
Contact Info
Slides ->

Debugging Hung Python Processes With GDB

  • 1.
    Debugging Hung PythonProcesses With GDB Brian Bouterse Principle Software Engineer, Red Hat.
  • 2.
    2 Who Am I? ●Python user since 2005 ● Love Free and Open Source ● Principle Software Engineer with Red Hat since 2015 ● Work on Pulp ( http://pulpproject.org/ ) ● Contribute to several Open Source projects (Kombu, Celery)
  • 3.
    3 Why use GDBto debug Python software?
  • 4.
  • 5.
    5 Why use GDBto debug Python software? ● Production application where pdb can't go ● Remote applications where rpdb isn't available ● Rarely occurring issues ● Deadlocking applications
  • 6.
  • 7.
    7 example.py import os import time defbar(): time.sleep(30) def foo(): print 'pid is %s' % os.getpid() bar() foo() import os import time def bar(): time.sleep(30) def foo(): print 'pid is %s' % os.getpid() bar() foo()
  • 8.
    8 GDB Basics ● Connectto a running process: `gdb /path/to/program/ 1234` ● Connect to a running process by pid: `gdb -p <pid>` ● `c` to continue ● `Ctrl + C` to stop execution again ● `Ctrl + D` to detach (which continues)
  • 9.
  • 10.
    10 A function callin CPython #8 0x00007ff43137e666 in fast_function (nk=<optimized out>, na=0, n=0, pp_stack=0x7ffd25b961a0, func=<function at remote 0x7ff43172d6e0>) at /usr/src/debug/Python-2.7.10/Python/ceval.c:4198 #9 call_function (oparg=<optimized out>, pp_stack=0x7ffd25b961a0) at /usr/src/debug/Python- 2.7.10/Python/ceval.c:4133 #10 PyEval_EvalFrameEx (f=f@entry=Frame 0x7ff43185fc20, for file example.py, line 14, in <module> (), throwflag=throwflag@entry=0) at /usr/src/debug/Python-2.7.10/Python/ceval.c:2755 #8 0x00007ff43137e666 in fast_function (nk=<optimized out>, na=0, n=0, pp_stack=0x7ffd25b961a0, func=<function at remote 0x7ff43172d6e0>) at /usr/src/debug/Python-2.7.10/Python/ceval.c:4198 #9 call_function (oparg=<optimized out>, pp_stack=0x7ffd25b961a0) at /usr/src/debug/Python- 2.7.10/Python/ceval.c:4133 #10 PyEval_EvalFrameEx (f=f@entry=Frame 0x7ff43185fc20, for file example.py, line 14, in <module> (), throwflag=throwflag@entry=0) at /usr/src/debug/Python-2.7.10/Python/ceval.c:2755
  • 11.
    11 Calling into thekernel #0 0x00007ff4306add43 in __select_nocancel () from /lib64/libc.so.6 #1 0x00007ff42fe2ffc0 in floatsleep (secs=<optimized out>) at /usr/src/debug/Python-2.7.10/Modules/timemodule.c:948 #2 time_sleep (self=<optimized out>, args=<optimized out>) at /usr/src/debug/Python-2.7.10/Modules/timemodule.c:206 #3 0x00007ff43137e8be in call_function (oparg=<optimized out>, pp_stack=0x7ffd25b95f40) at /usr/src/debug/Python- 2.7.10/Python/ceval.c:4112 #4 PyEval_EvalFrameEx (f=f@entry=Frame 0x7ff431738050, for file example.py, line 6, in bar (), throwflag=throwflag@entry=0) at /usr/src/debug/Python-2.7.10/Python/ceval.c:2755 #0 0x00007ff4306add43 in __select_nocancel () from /lib64/libc.so.6 #1 0x00007ff42fe2ffc0 in floatsleep (secs=<optimized out>) at /usr/src/debug/Python-2.7.10/Modules/timemodule.c:948 #2 time_sleep (self=<optimized out>, args=<optimized out>) at /usr/src/debug/Python-2.7.10/Modules/timemodule.c:206 #3 0x00007ff43137e8be in call_function (oparg=<optimized out>, pp_stack=0x7ffd25b95f40) at /usr/src/debug/Python- 2.7.10/Python/ceval.c:4112 #4 PyEval_EvalFrameEx (f=f@entry=Frame 0x7ff431738050, for file example.py, line 6, in bar (), throwflag=throwflag@entry=0) at /usr/src/debug/Python-2.7.10/Python/ceval.c:2755
  • 12.
    12 Python extensions forGDB Thanks David Malcolm (dmalcolm)
  • 13.
    13 Python extensions forGDB ● py-list Python source (if any) in current thread and Frame ● py-bt Print a Python stack trace from the GDB stack ● py-locals Print all Python locals from current thread ● py-print Print something from python namespace ● py-up and py-down Move up and down the Python stack
  • 14.
    14 `py-list` output ofexample.py (gdb) py-list 1 import os 2 import time 3 4 5 def bar(): >6 time.sleep(30) 7 8 9 def foo(): 10 print 'pid is %s' % os.getpid() 11 bar() (gdb) py-list 1 import os 2 import time 3 4 5 def bar(): >6 time.sleep(30) 7 8 9 def foo(): 10 print 'pid is %s' % os.getpid() 11 bar()
  • 15.
    15 `py-bt` output ofexample.py (gdb) py-bt #4 Frame 0x7f12850d0050, for file example.py, line 6, in bar () time.sleep(30) #7 Frame 0x7f12851f7dd0, for file example.py, line 11, in foo () bar() #10 Frame 0x7f12851f7c20, for file example.py, line 14, in <module> () foo() (gdb) py-bt #4 Frame 0x7f12850d0050, for file example.py, line 6, in bar () time.sleep(30) #7 Frame 0x7f12851f7dd0, for file example.py, line 11, in foo () bar() #10 Frame 0x7f12851f7c20, for file example.py, line 14, in <module> () foo()
  • 16.
    16 GDB and threads ●`info threads` Shows you information about threads in process ● Current thread is marked with * ● `thread <id>` Switches the current thread to <id> ● `thread apply all <COMMAND>` applies command to all threads ● `thread apply all py-bt` ● `thread apply all py-list`
  • 17.
    17 Working with CoreDumps ● Generate a coredump with `gcore <pid>` ● Connect to a coredump with `gdb /path/to/program <core_file>`
  • 18.
    18 Consider using `strace` ●trace system calls and signals ● An example call: open("/dev/null", O_RDONLY) = 3 ● An example error: open("/foo/bar", O_RDONLY) = -1 ENOENT (No such file or directory)
  • 19.
  • 20.
  • 21.
    21 Gotchas ● You needdebuginfo libraries installed ● GDB will tell you what you need ● Your packages need to be the same as the ones gdb wants ● Optimized out Python code removes GDB's ability to see it ● Root is required to connect other user's processes
  • 22.
    22 Trigger rpdb.set_trace() witha signal ● Add a signal handler which triggers rpdb.set_trace() ● Make it yourself or let rpdb do it. Recent versions have it build in. ● set_trace() can be triggered at any time by using the TRAP signal handler import rpdb rpdb.handle_trap() # As with set_trace, you can optionally specify addr and port rpdb.handle_trap("0.0.0.0", 54321) import rpdb rpdb.handle_trap() # As with set_trace, you can optionally specify addr and port rpdb.handle_trap("0.0.0.0", 54321)
  • 23.
    23 ● https://wiki.python.org/moin/DebuggingWithGdb ● https://fedoraproject.org/wiki/Features/EasierPythonDebugging ●https://sourceware.org/gdb/current/onlinedocs/gdb/Threads.html ● https://github.com/tamentis/rpdb#trigger-rpdb-with-signal ● http://bugs.python.org/issue8032 Brian Bouterse bbouterse@redhat.com bmbouter on freenode References Contact Info Slides ->