Download to read offline


![More complex
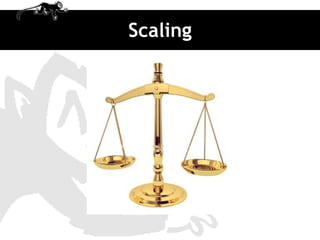
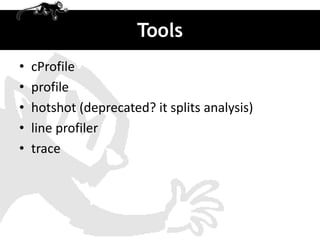
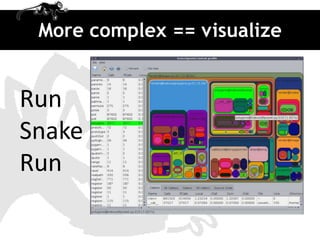
import profile Source: http://www.doughellmann.com/PyMOTW/profile/
def fib(n):
# from http://en.literateprograms.org/Fibonacci_numbers_(Python)
if n == 0:
return 0
elif n == 1:
return 1
else:
return fib(n-1) + fib(n-2)
def fib_seq(n):
seq = [ ]
if n > 0:
seq.extend(fib_seq(n-1))
seq.append(fib(n))
return seq
print 'RAW'
print '=' * 80
profile.run('print fib_seq(20); print')](https://image.slidesharecdn.com/djangomeetup20120418-profiling-120419022535-phpapp02/85/Down-the-rabbit-hole-profiling-in-Django-15-320.jpg)
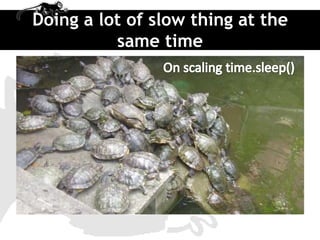
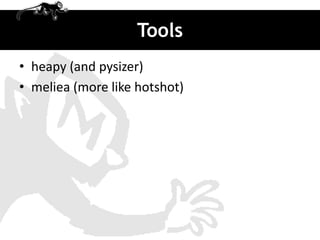
![Output
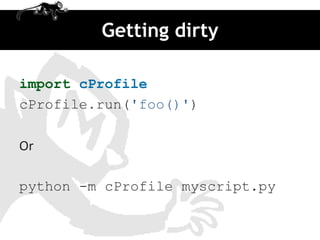
$ python profile_fibonacci_raw.py
RAW
================================================================================
[0, 1, 1, 2, 3, 5, 8, 13, 21, 34, 55, 89, 144, 233, 377, 610, 987, 1597, 2584, 41
81, 6765]
57356 function calls (66 primitive calls) in 0.746 CPU seconds
Ordered by: standard name
ncalls tottime percall cumtime percallfilename:lineno(function)
21 0.000 0.000 0.000 0.000:0(append)
20 0.000 0.000 0.000 0.000:0(extend)
1 0.001 0.001 0.001 0.001:0(setprofile)
1 0.000 0.000 0.744 0.744<string>:1(<module>)
1 0.000 0.000 0.746 0.746profile:0(print fib_seq(20); print)
0 0.000 0.000 profile:0(profiler)
57291/21 0.743 0.000 0.743 0.035 profile_fibonacci_raw.py:13(fib)
21/1 0.001 0.000 0.744 0.744 profile_fibonacci_raw.py:22](https://image.slidesharecdn.com/djangomeetup20120418-profiling-120419022535-phpapp02/85/Down-the-rabbit-hole-profiling-in-Django-16-320.jpg)
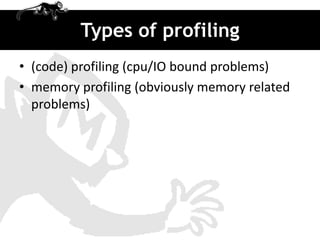
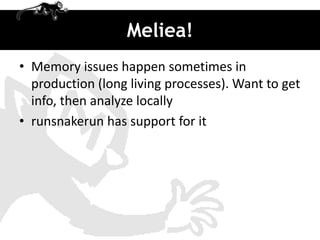
![Output
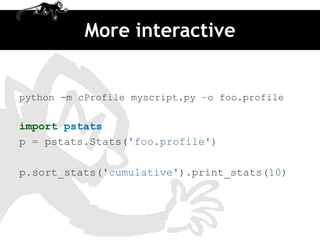
$ python profile_fibonacci_raw.py
RAW
================================================================================
[0, 1, 1, 2, 3, 5, 8, 13, 21, 34, 55, 89, 144, 233, 377, 610, 987, 1597, 2584, 41
81, 6765]
57356 function calls (66 primitive calls) in 0.746 CPU seconds
Ordered by: standard name
ncalls tottime percall cumtime percallfilename:lineno(function)
21 0.000 0.000 0.000 0.000:0(append)
20 0.000 0.000 0.000 0.000:0(extend)
1 0.001 0.001 0.001 0.001:0(setprofile)
1 0.000 0.000 0.744 0.744<string>:1(<module>)
1 0.000 0.000 0.746 0.746profile:0(print fib_seq(20); print)
0 0.000 0.000 profile:0(profiler)
57291/21 0.743 0.000 0.743 0.035 profile_fibonacci_raw.py:13(fib)
21/1 0.001 0.000 0.744 0.744 profile_fibonacci_raw.py:22](https://image.slidesharecdn.com/djangomeetup20120418-profiling-120419022535-phpapp02/85/Down-the-rabbit-hole-profiling-in-Django-17-320.jpg)
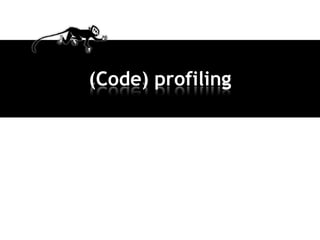
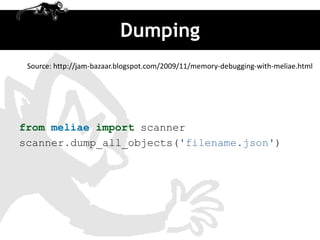
![Yeah!
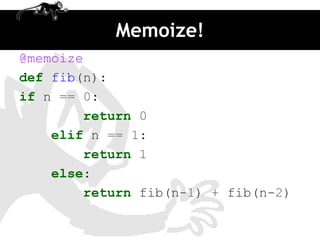
$ python profile_fibonacci_memoized.py
MEMOIZED
================================================================================
[0, 1, 1, 2, 3, 5, 8, 13, 21, 34, 55, 89, 144, 233, 377, 610, 987, 1597, 2584, 41
81, 6765]
145 function calls (87 primitive calls) in 0.003 CPU seconds
Ordered by: standard name
ncalls tottime percall cumtime percallfilename:lineno(function)
21 0.000 0.000 0.000 0.000:0(append)
20 0.000 0.000 0.000 0.000:0(extend)
1 0.001 0.001 0.001 0.001:0(setprofile)
1 0.000 0.000 0.002 0.002<string>:1(<module>)
1 0.000 0.000 0.003 0.003profile:0(print fib_seq(20); print)
0 0.000 0.000 profile:0(profiler)
59/21 0.001 0.000 0.001 0.000 profile_fibonacci.py:19(__call__)
21 0.000 0.000 0.001 0.000 profile_fibonacci.py:26(fib)
21/1 0.001 0.000 0.002 0.002 profile_fibonacci.py:36(fib_seq)](https://image.slidesharecdn.com/djangomeetup20120418-profiling-120419022535-phpapp02/85/Down-the-rabbit-hole-profiling-in-Django-19-320.jpg)


![More complex
import profile Source: http://www.doughellmann.com/PyMOTW/profile/
def fib(n):
# from http://en.literateprograms.org/Fibonacci_numbers_(Python)
if n == 0:
return 0
elif n == 1:
return 1
else:
return fib(n-1) + fib(n-2)
def fib_seq(n):
seq = [ ]
if n > 0:
seq.extend(fib_seq(n-1))
seq.append(fib(n))
return seq
print 'RAW'
print '=' * 80
profile.run('print fib_seq(20); print')](https://image.slidesharecdn.com/djangomeetup20120418-profiling-120419022535-phpapp02/75/Down-the-rabbit-hole-profiling-in-Django-15-2048.jpg)
![Output
$ python profile_fibonacci_raw.py
RAW
================================================================================
[0, 1, 1, 2, 3, 5, 8, 13, 21, 34, 55, 89, 144, 233, 377, 610, 987, 1597, 2584, 41
81, 6765]
57356 function calls (66 primitive calls) in 0.746 CPU seconds
Ordered by: standard name
ncalls tottime percall cumtime percallfilename:lineno(function)
21 0.000 0.000 0.000 0.000:0(append)
20 0.000 0.000 0.000 0.000:0(extend)
1 0.001 0.001 0.001 0.001:0(setprofile)
1 0.000 0.000 0.744 0.744<string>:1(<module>)
1 0.000 0.000 0.746 0.746profile:0(print fib_seq(20); print)
0 0.000 0.000 profile:0(profiler)
57291/21 0.743 0.000 0.743 0.035 profile_fibonacci_raw.py:13(fib)
21/1 0.001 0.000 0.744 0.744 profile_fibonacci_raw.py:22](https://image.slidesharecdn.com/djangomeetup20120418-profiling-120419022535-phpapp02/75/Down-the-rabbit-hole-profiling-in-Django-16-2048.jpg)
![Output
$ python profile_fibonacci_raw.py
RAW
================================================================================
[0, 1, 1, 2, 3, 5, 8, 13, 21, 34, 55, 89, 144, 233, 377, 610, 987, 1597, 2584, 41
81, 6765]
57356 function calls (66 primitive calls) in 0.746 CPU seconds
Ordered by: standard name
ncalls tottime percall cumtime percallfilename:lineno(function)
21 0.000 0.000 0.000 0.000:0(append)
20 0.000 0.000 0.000 0.000:0(extend)
1 0.001 0.001 0.001 0.001:0(setprofile)
1 0.000 0.000 0.744 0.744<string>:1(<module>)
1 0.000 0.000 0.746 0.746profile:0(print fib_seq(20); print)
0 0.000 0.000 profile:0(profiler)
57291/21 0.743 0.000 0.743 0.035 profile_fibonacci_raw.py:13(fib)
21/1 0.001 0.000 0.744 0.744 profile_fibonacci_raw.py:22](https://image.slidesharecdn.com/djangomeetup20120418-profiling-120419022535-phpapp02/75/Down-the-rabbit-hole-profiling-in-Django-17-2048.jpg)

![Yeah!
$ python profile_fibonacci_memoized.py
MEMOIZED
================================================================================
[0, 1, 1, 2, 3, 5, 8, 13, 21, 34, 55, 89, 144, 233, 377, 610, 987, 1597, 2584, 41
81, 6765]
145 function calls (87 primitive calls) in 0.003 CPU seconds
Ordered by: standard name
ncalls tottime percall cumtime percallfilename:lineno(function)
21 0.000 0.000 0.000 0.000:0(append)
20 0.000 0.000 0.000 0.000:0(extend)
1 0.001 0.001 0.001 0.001:0(setprofile)
1 0.000 0.000 0.002 0.002<string>:1(<module>)
1 0.000 0.000 0.003 0.003profile:0(print fib_seq(20); print)
0 0.000 0.000 profile:0(profiler)
59/21 0.001 0.000 0.001 0.000 profile_fibonacci.py:19(__call__)
21 0.000 0.000 0.001 0.000 profile_fibonacci.py:26(fib)
21/1 0.001 0.000 0.002 0.002 profile_fibonacci.py:36(fib_seq)](https://image.slidesharecdn.com/djangomeetup20120418-profiling-120419022535-phpapp02/75/Down-the-rabbit-hole-profiling-in-Django-19-2048.jpg)
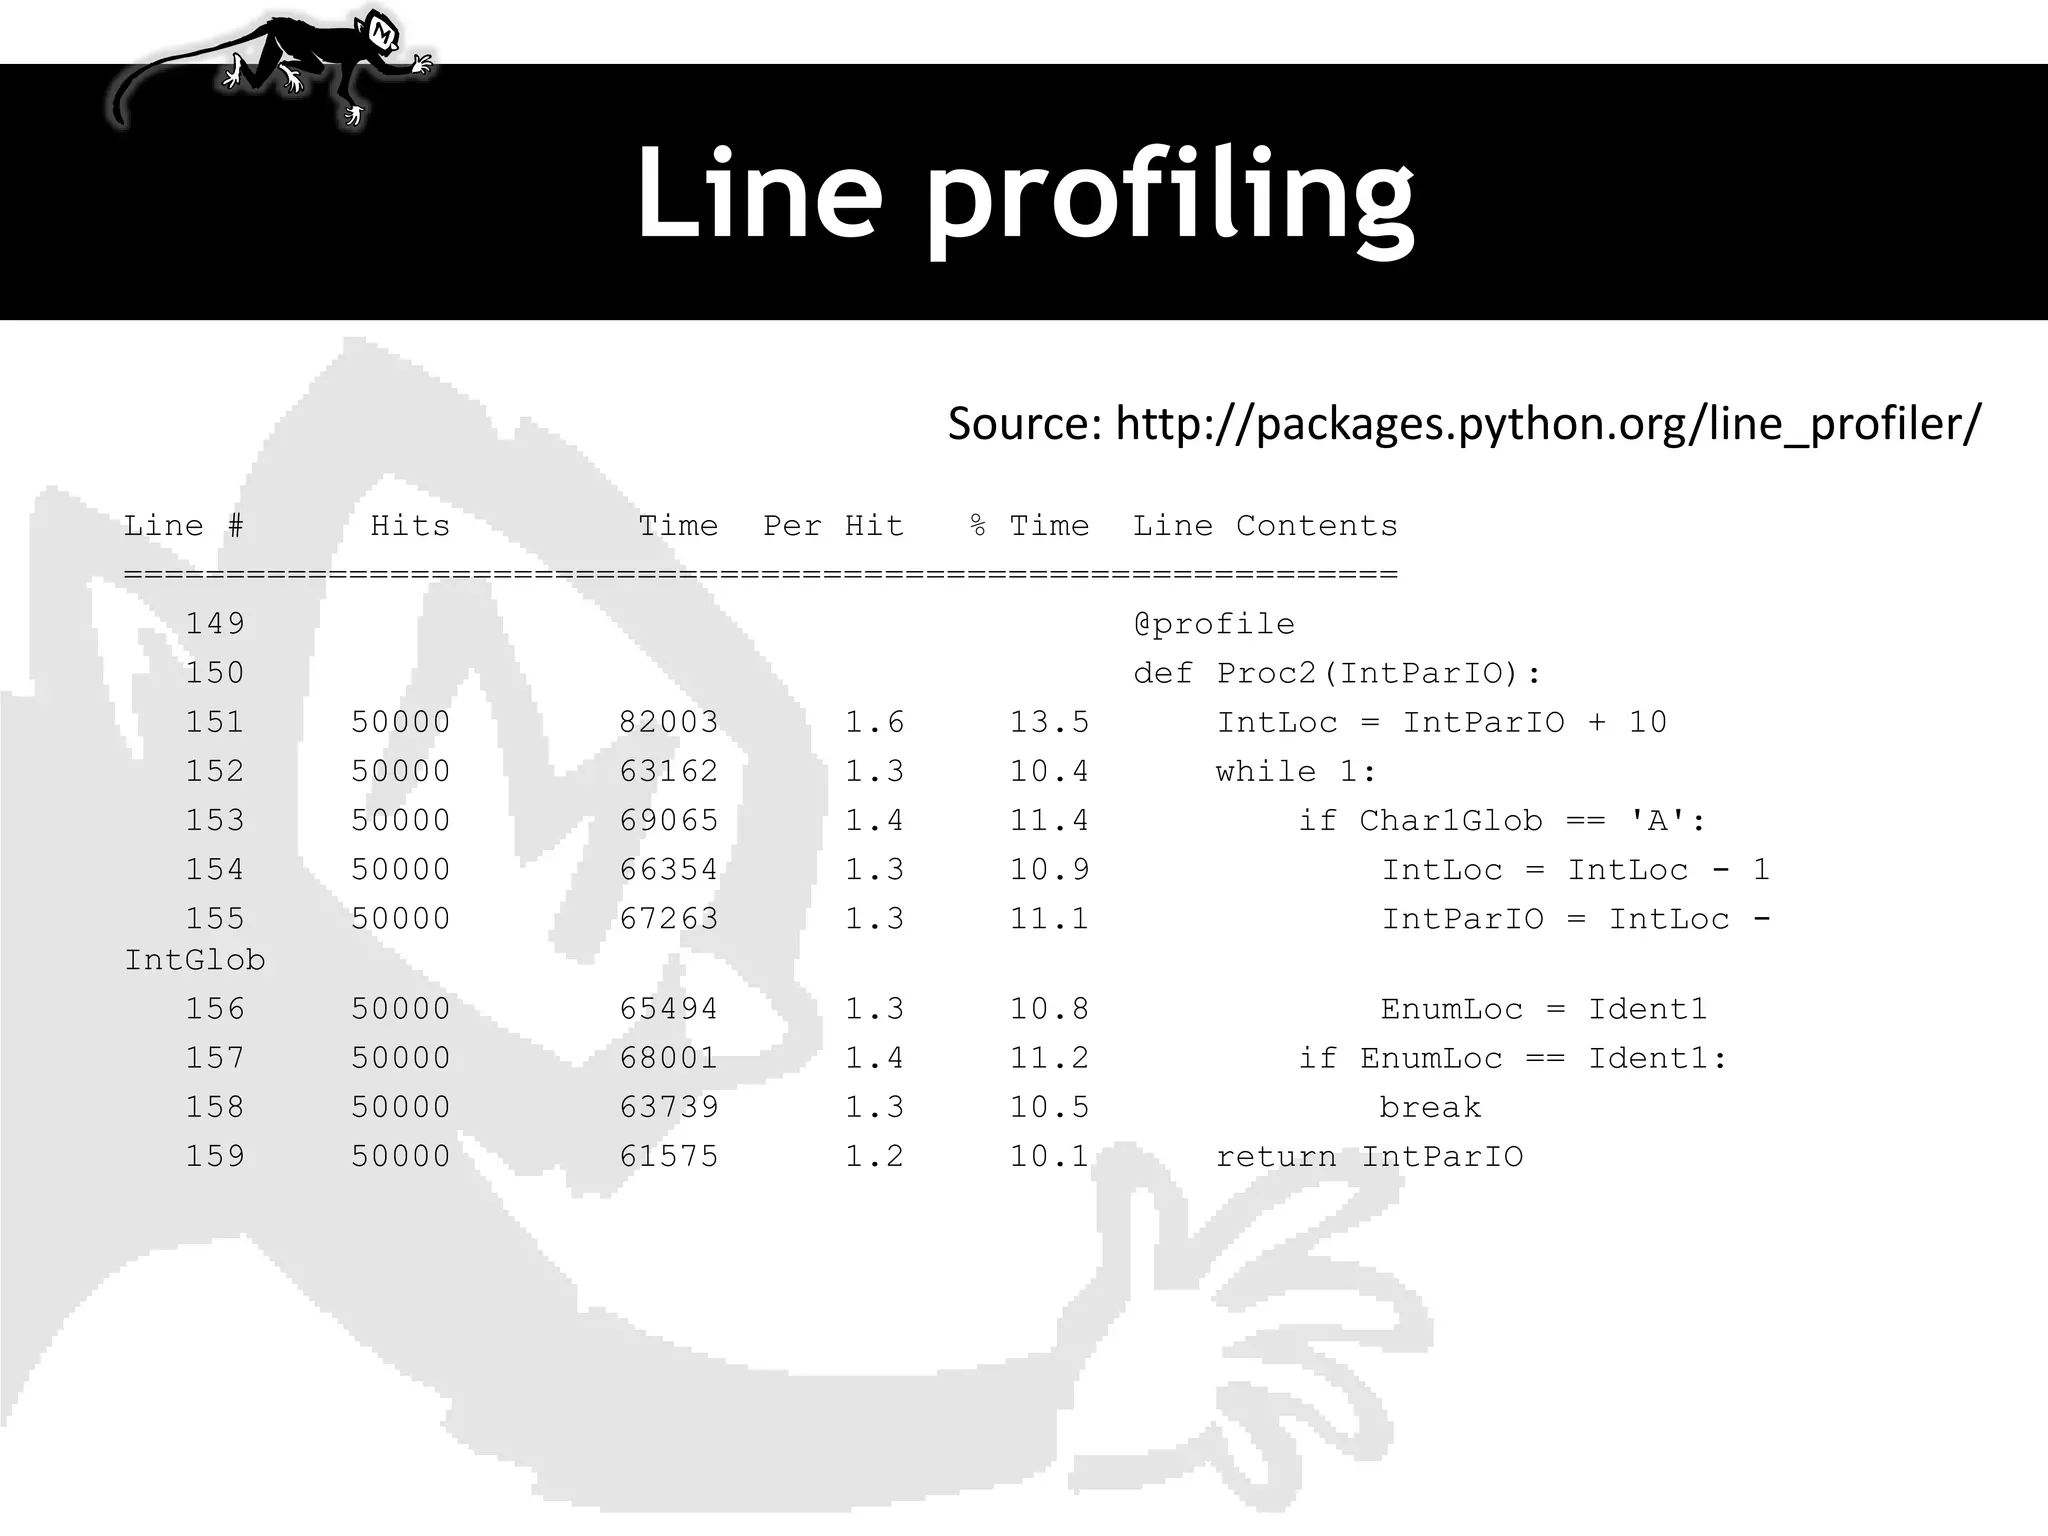
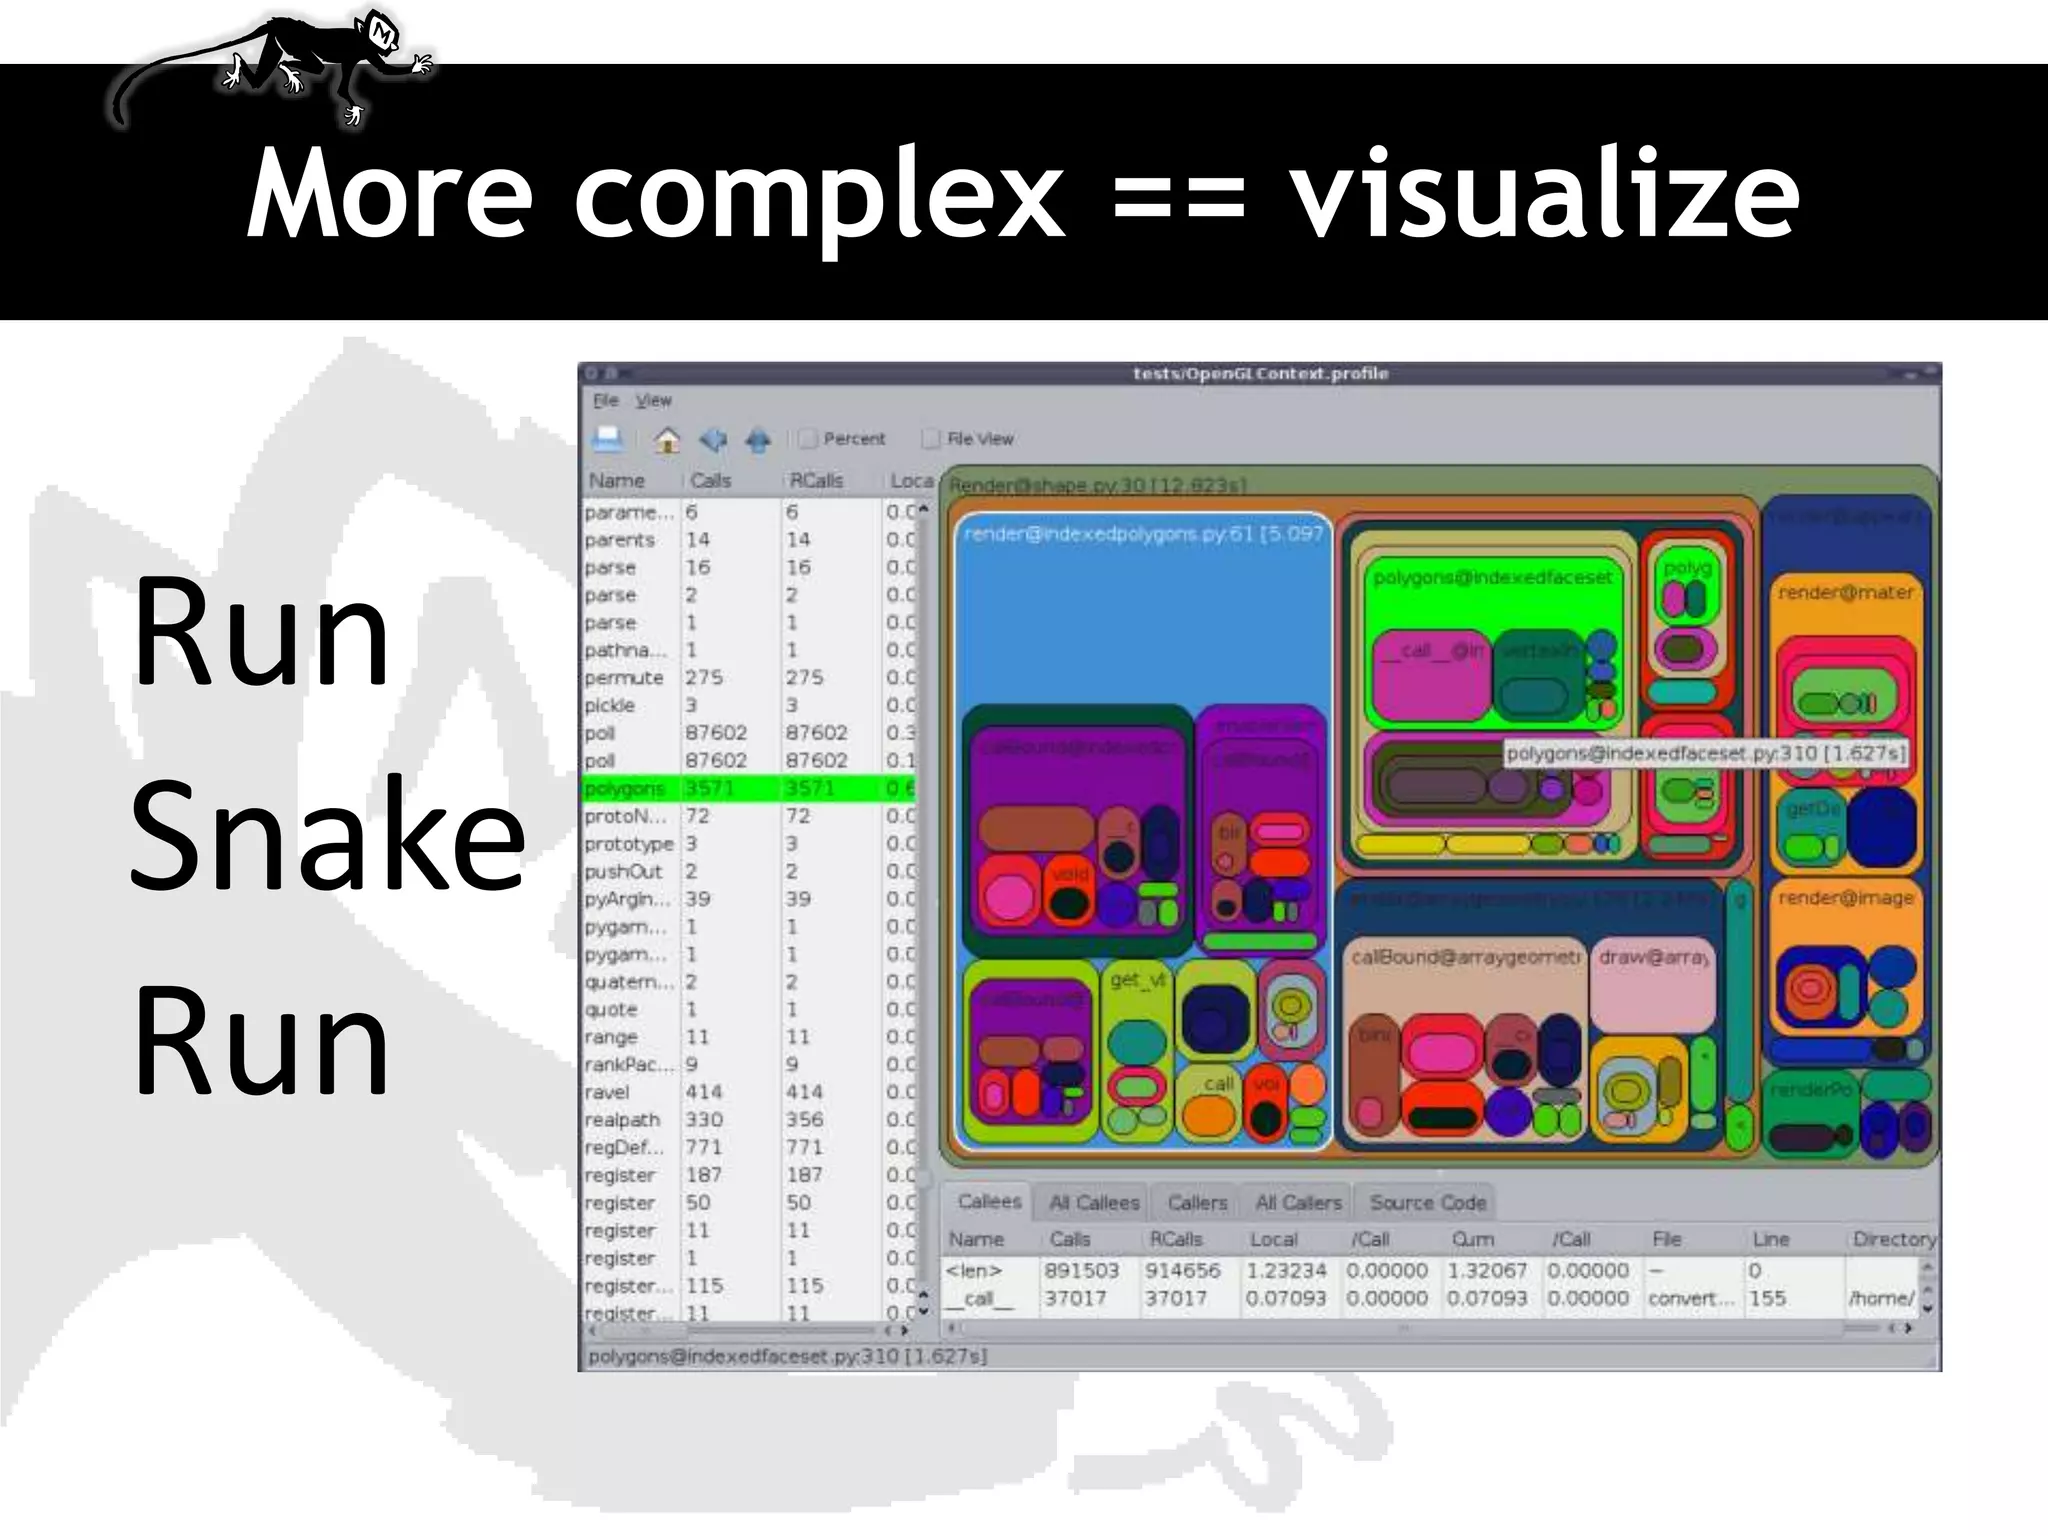


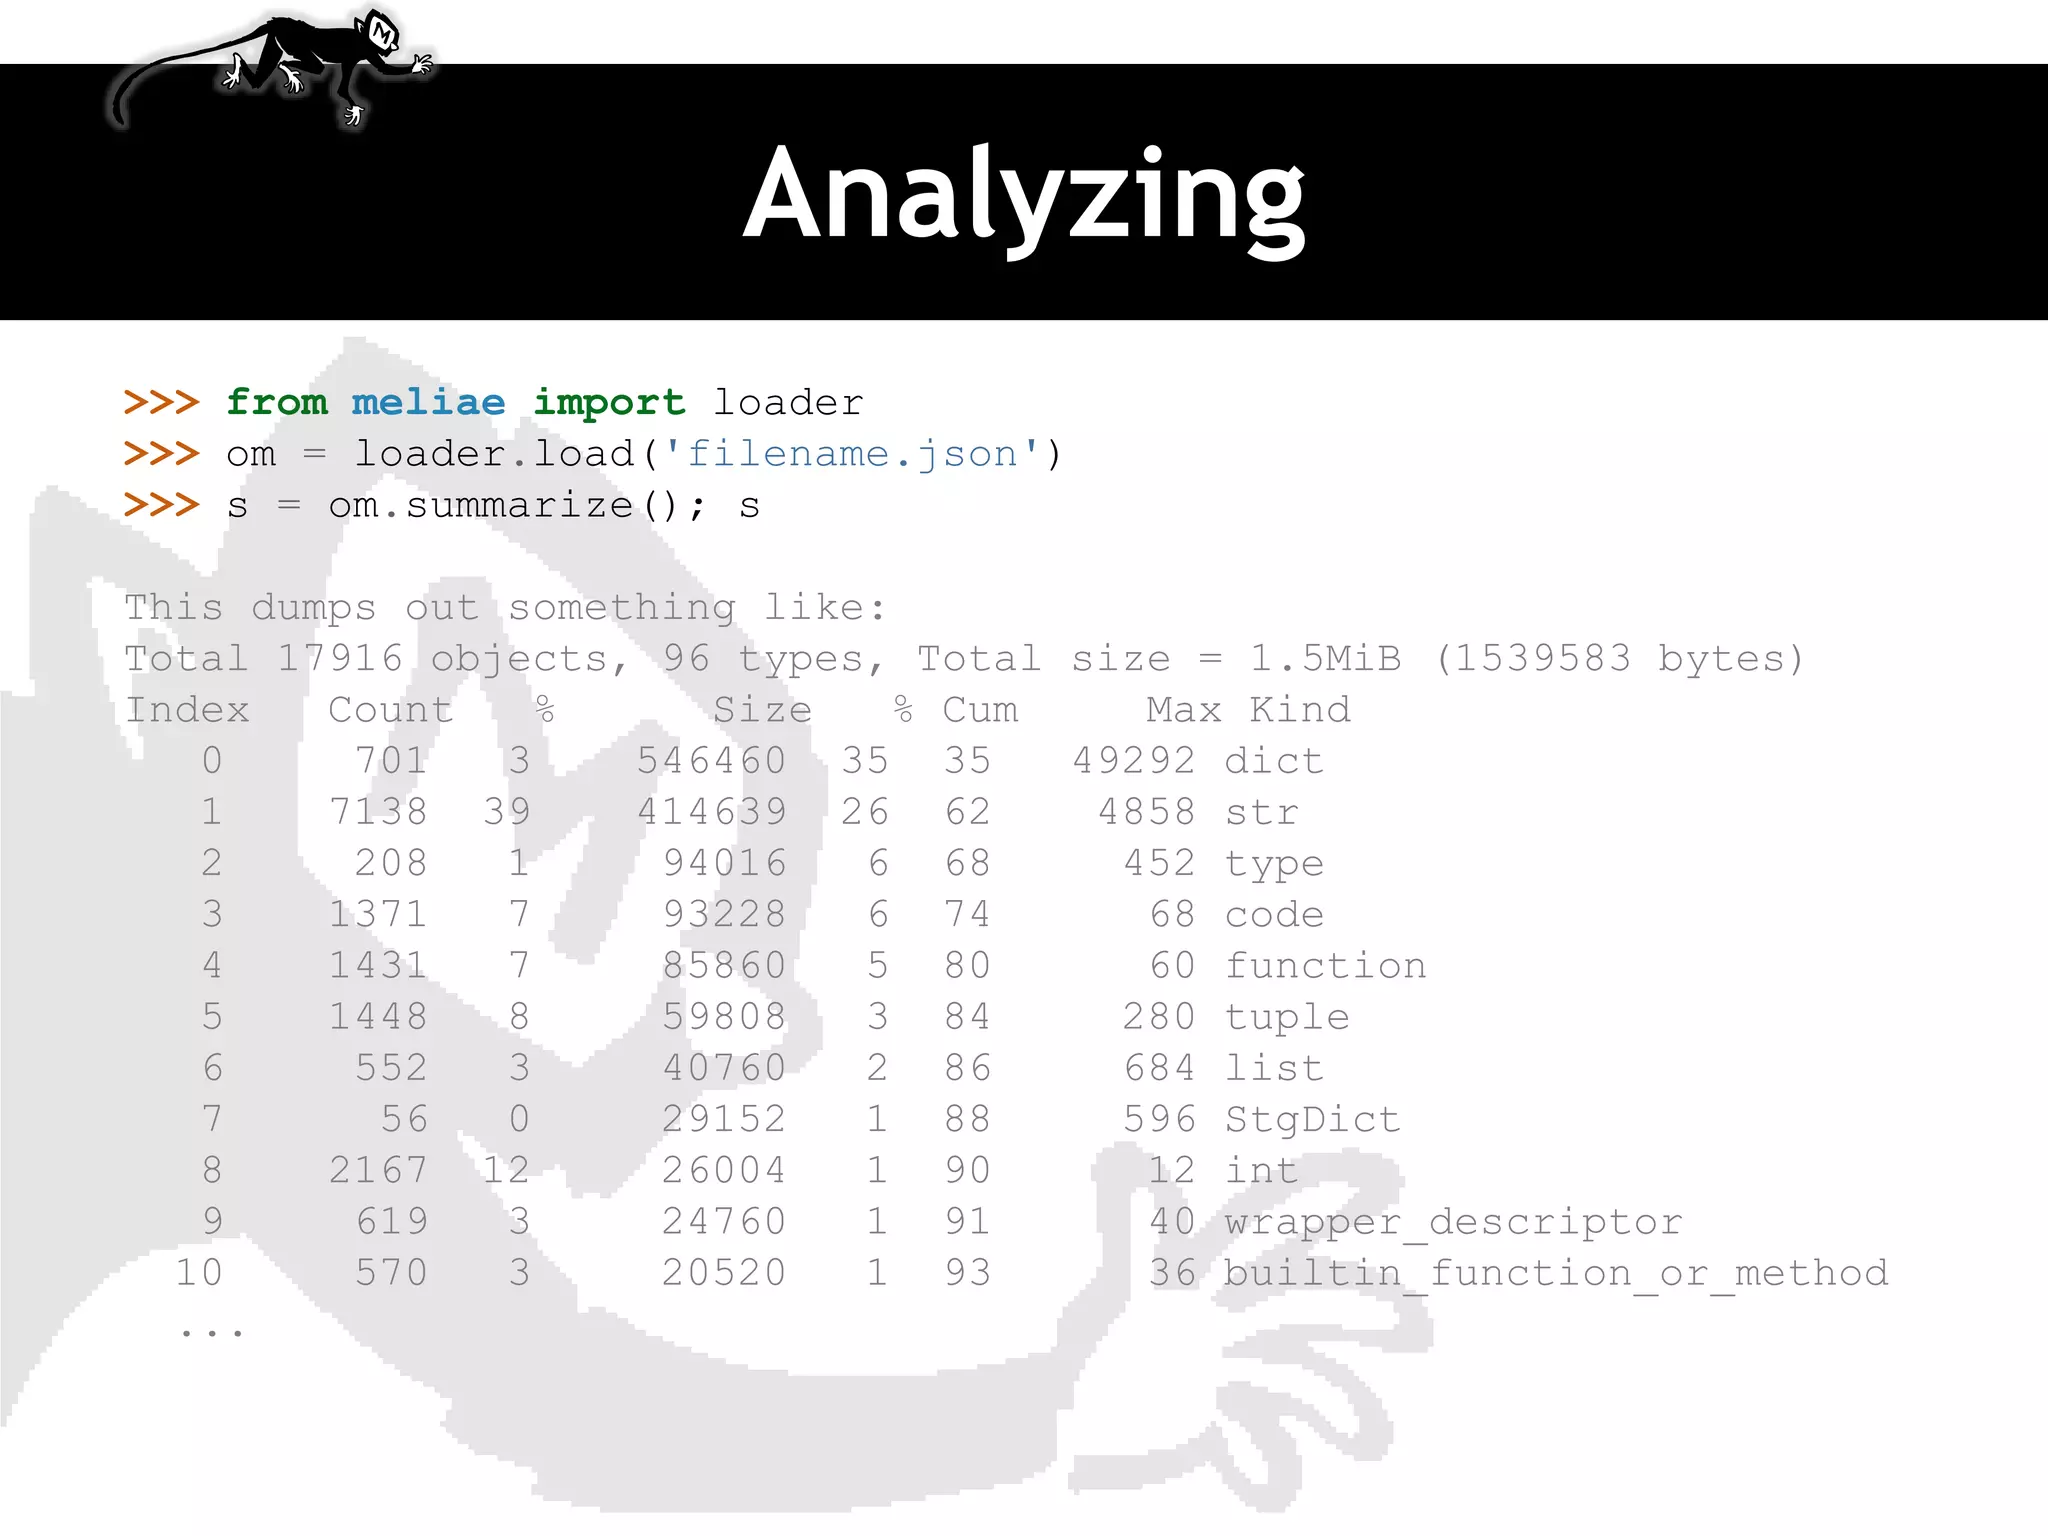
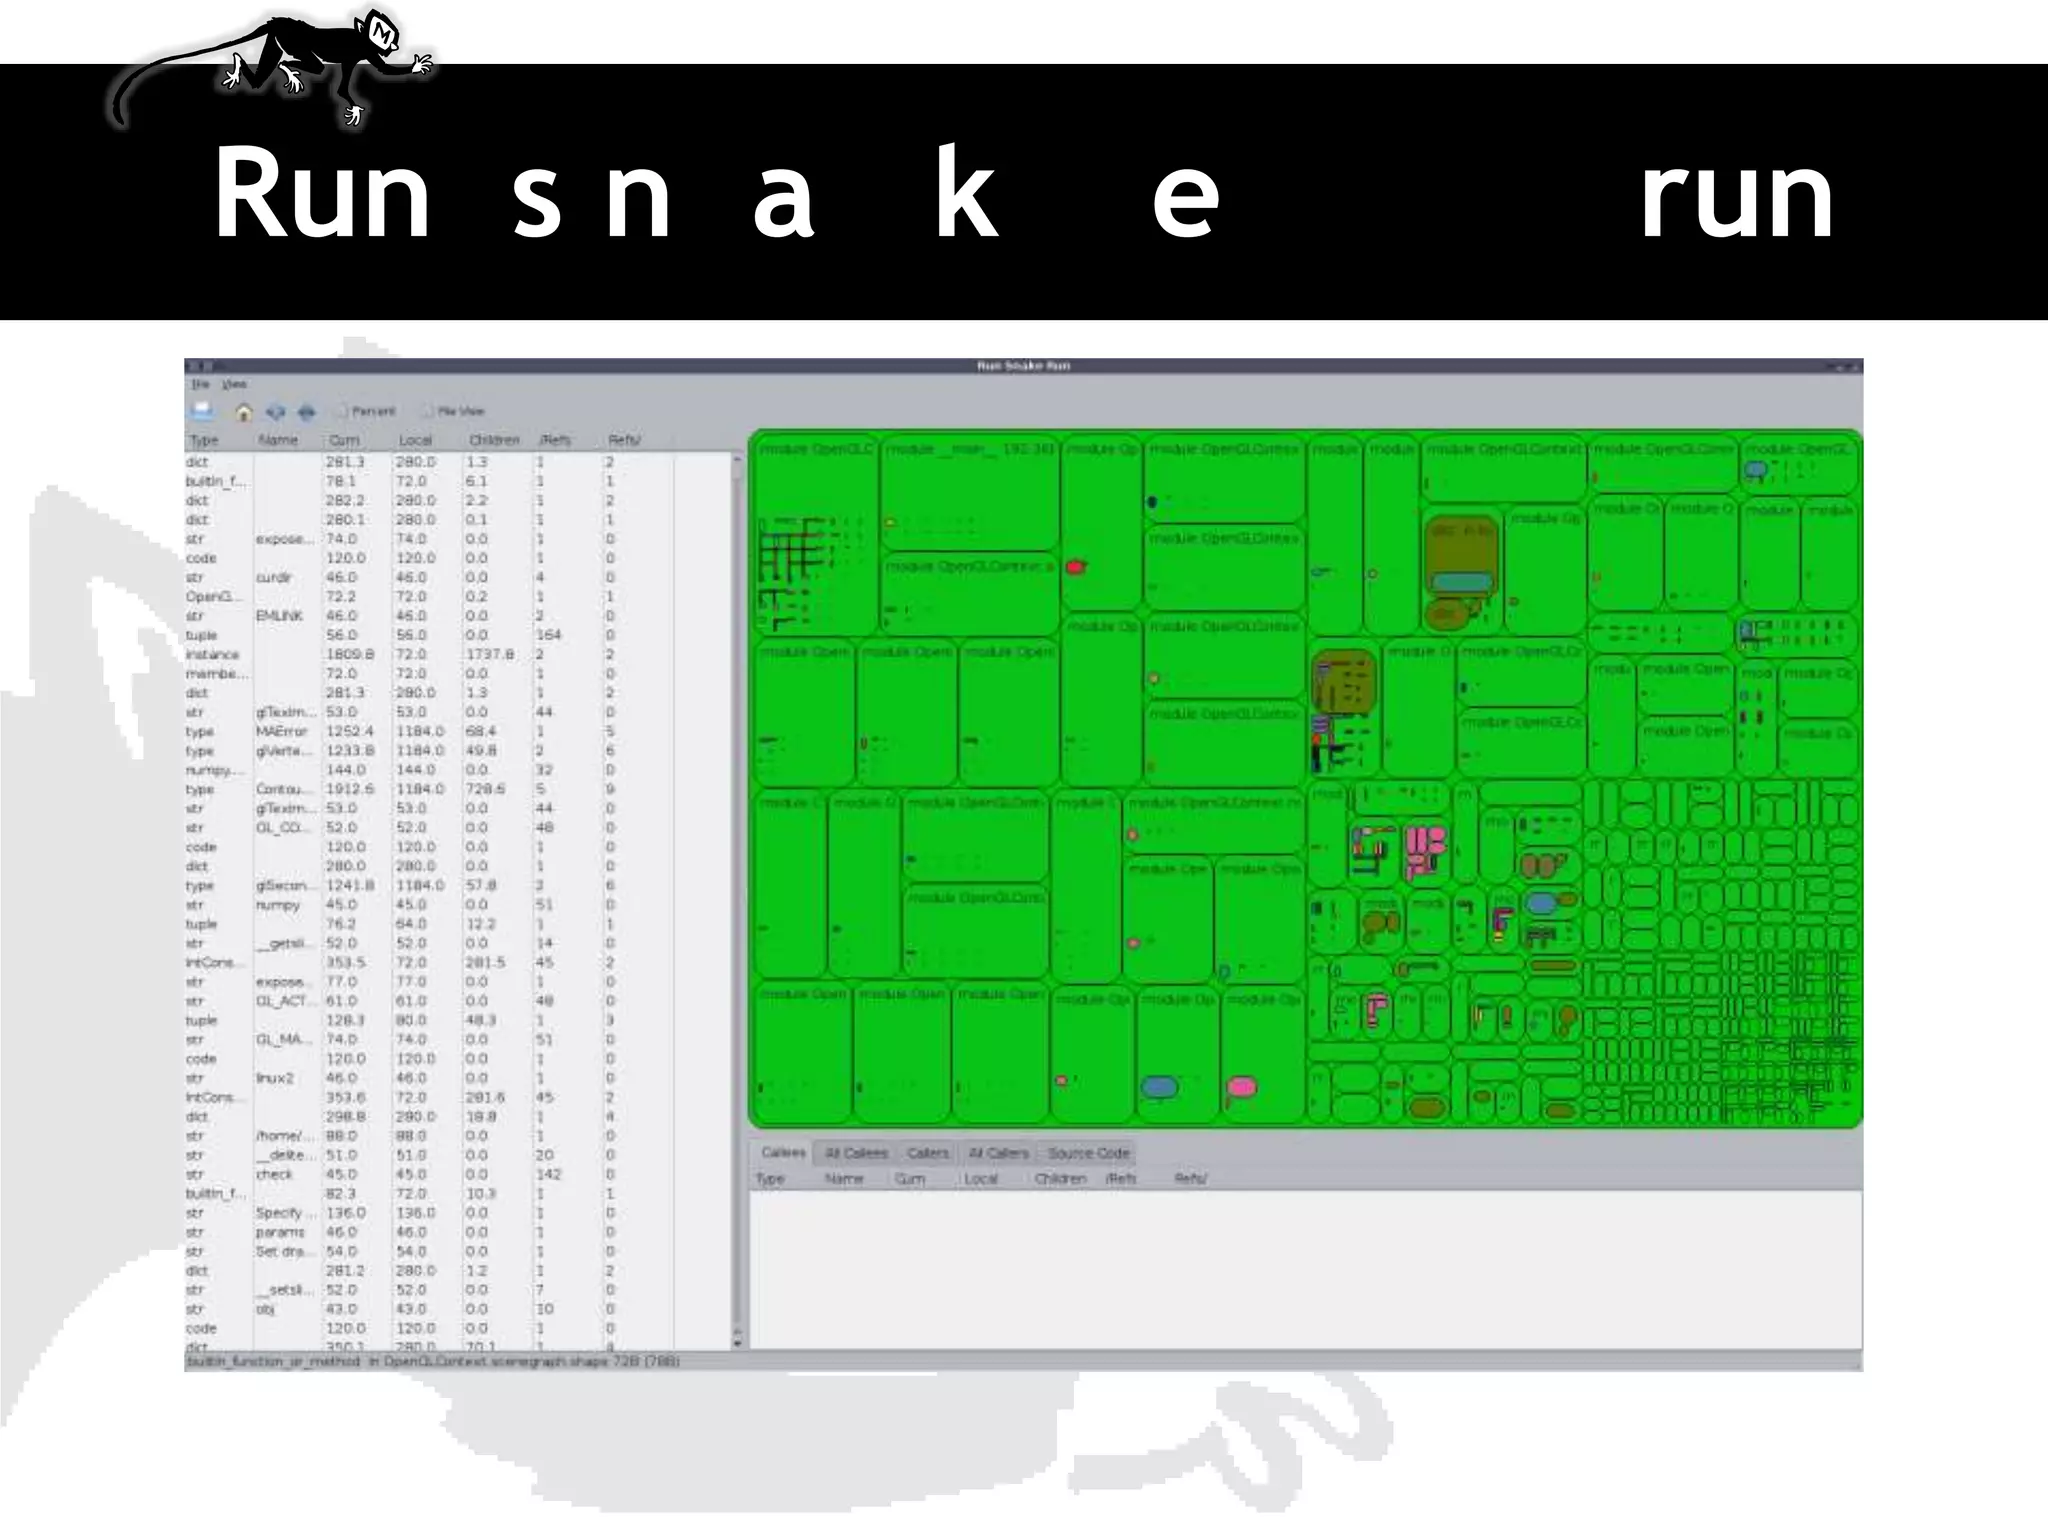


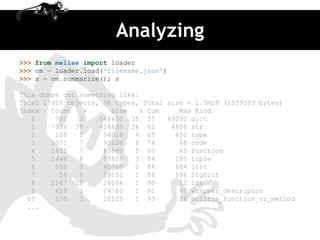
The document discusses various tools for profiling Python code such as cProfile, profile, hotshot, line profiler, and trace to identify inefficient code and bottlenecks. It covers using these tools to profile CPU and I/O bound problems as well as memory profiling issues. The document also demonstrates how to optimize code through caching, removing unnecessary function calls, and memoization.


![[131]해커의 관점에서 바라보기](https://cdn.slidesharecdn.com/ss_thumbnails/131deview2018hackerperspectivesubmit-181010154431-thumbnail.jpg?width=600ounds&width=560&fit=bounds)


