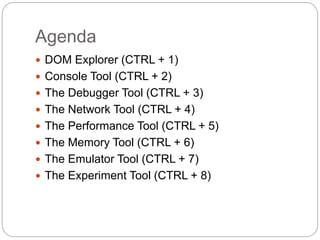
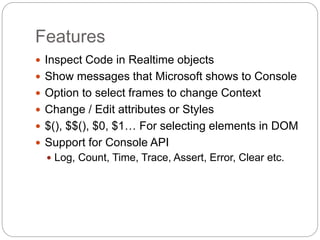
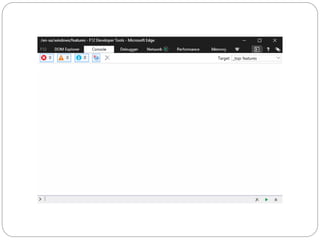
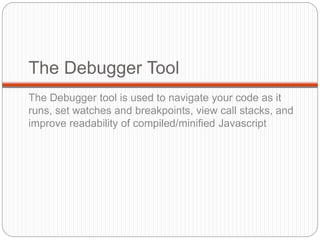
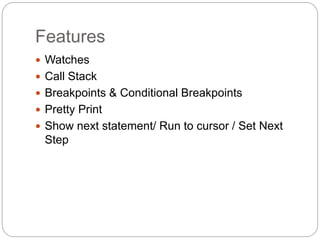
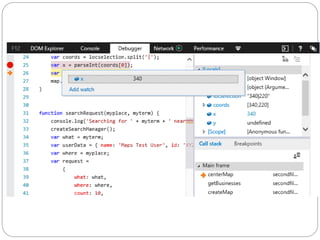
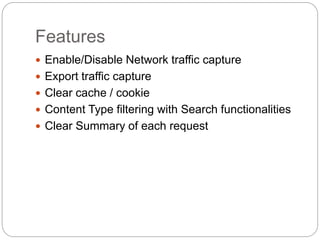
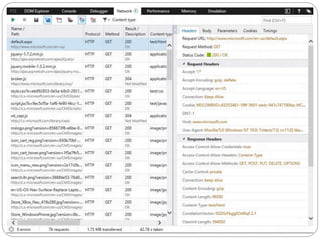
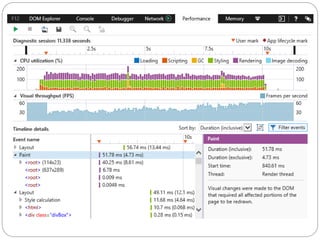
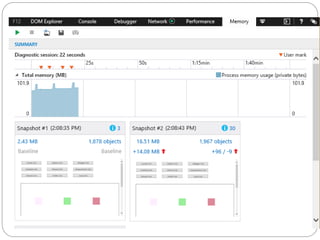
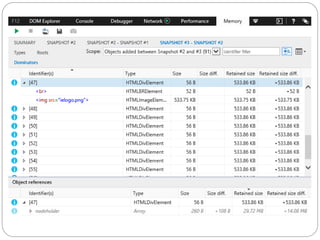
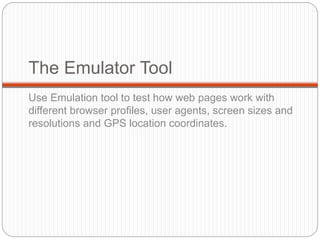
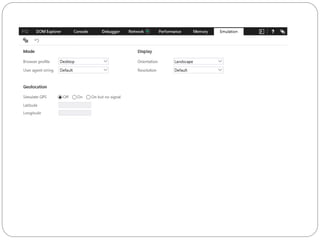
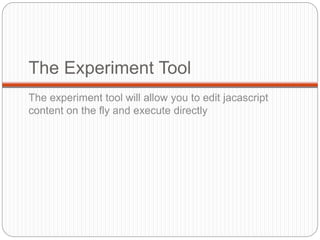
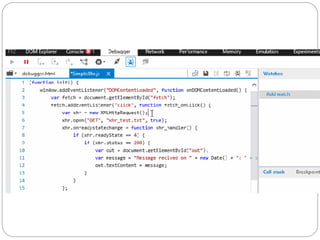
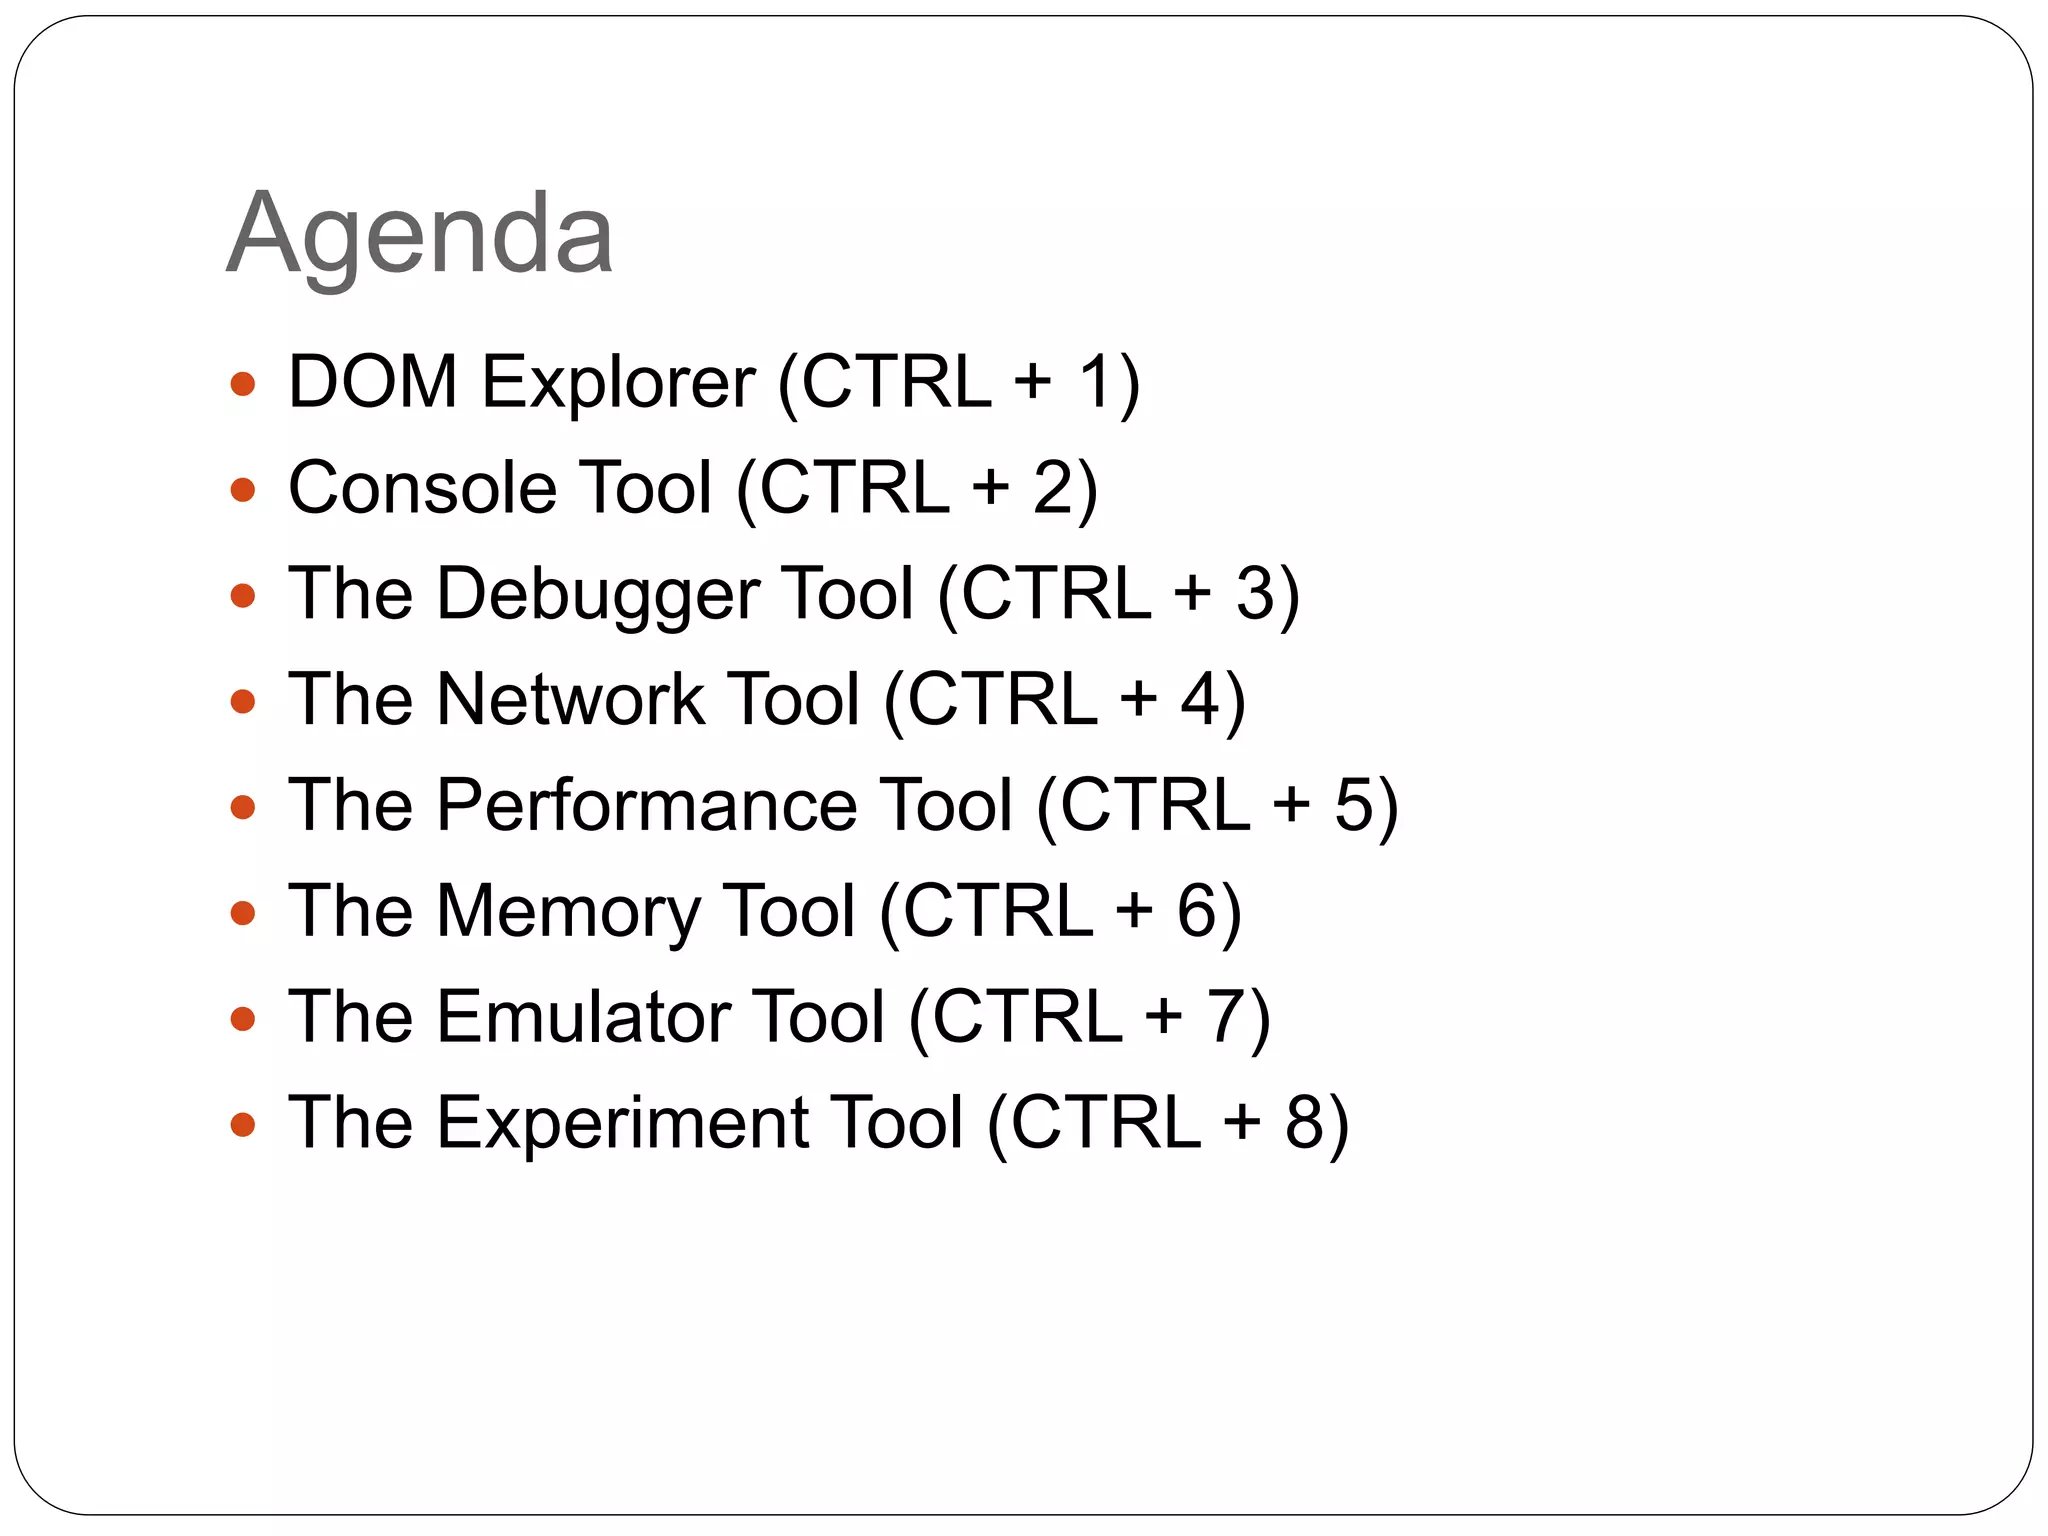
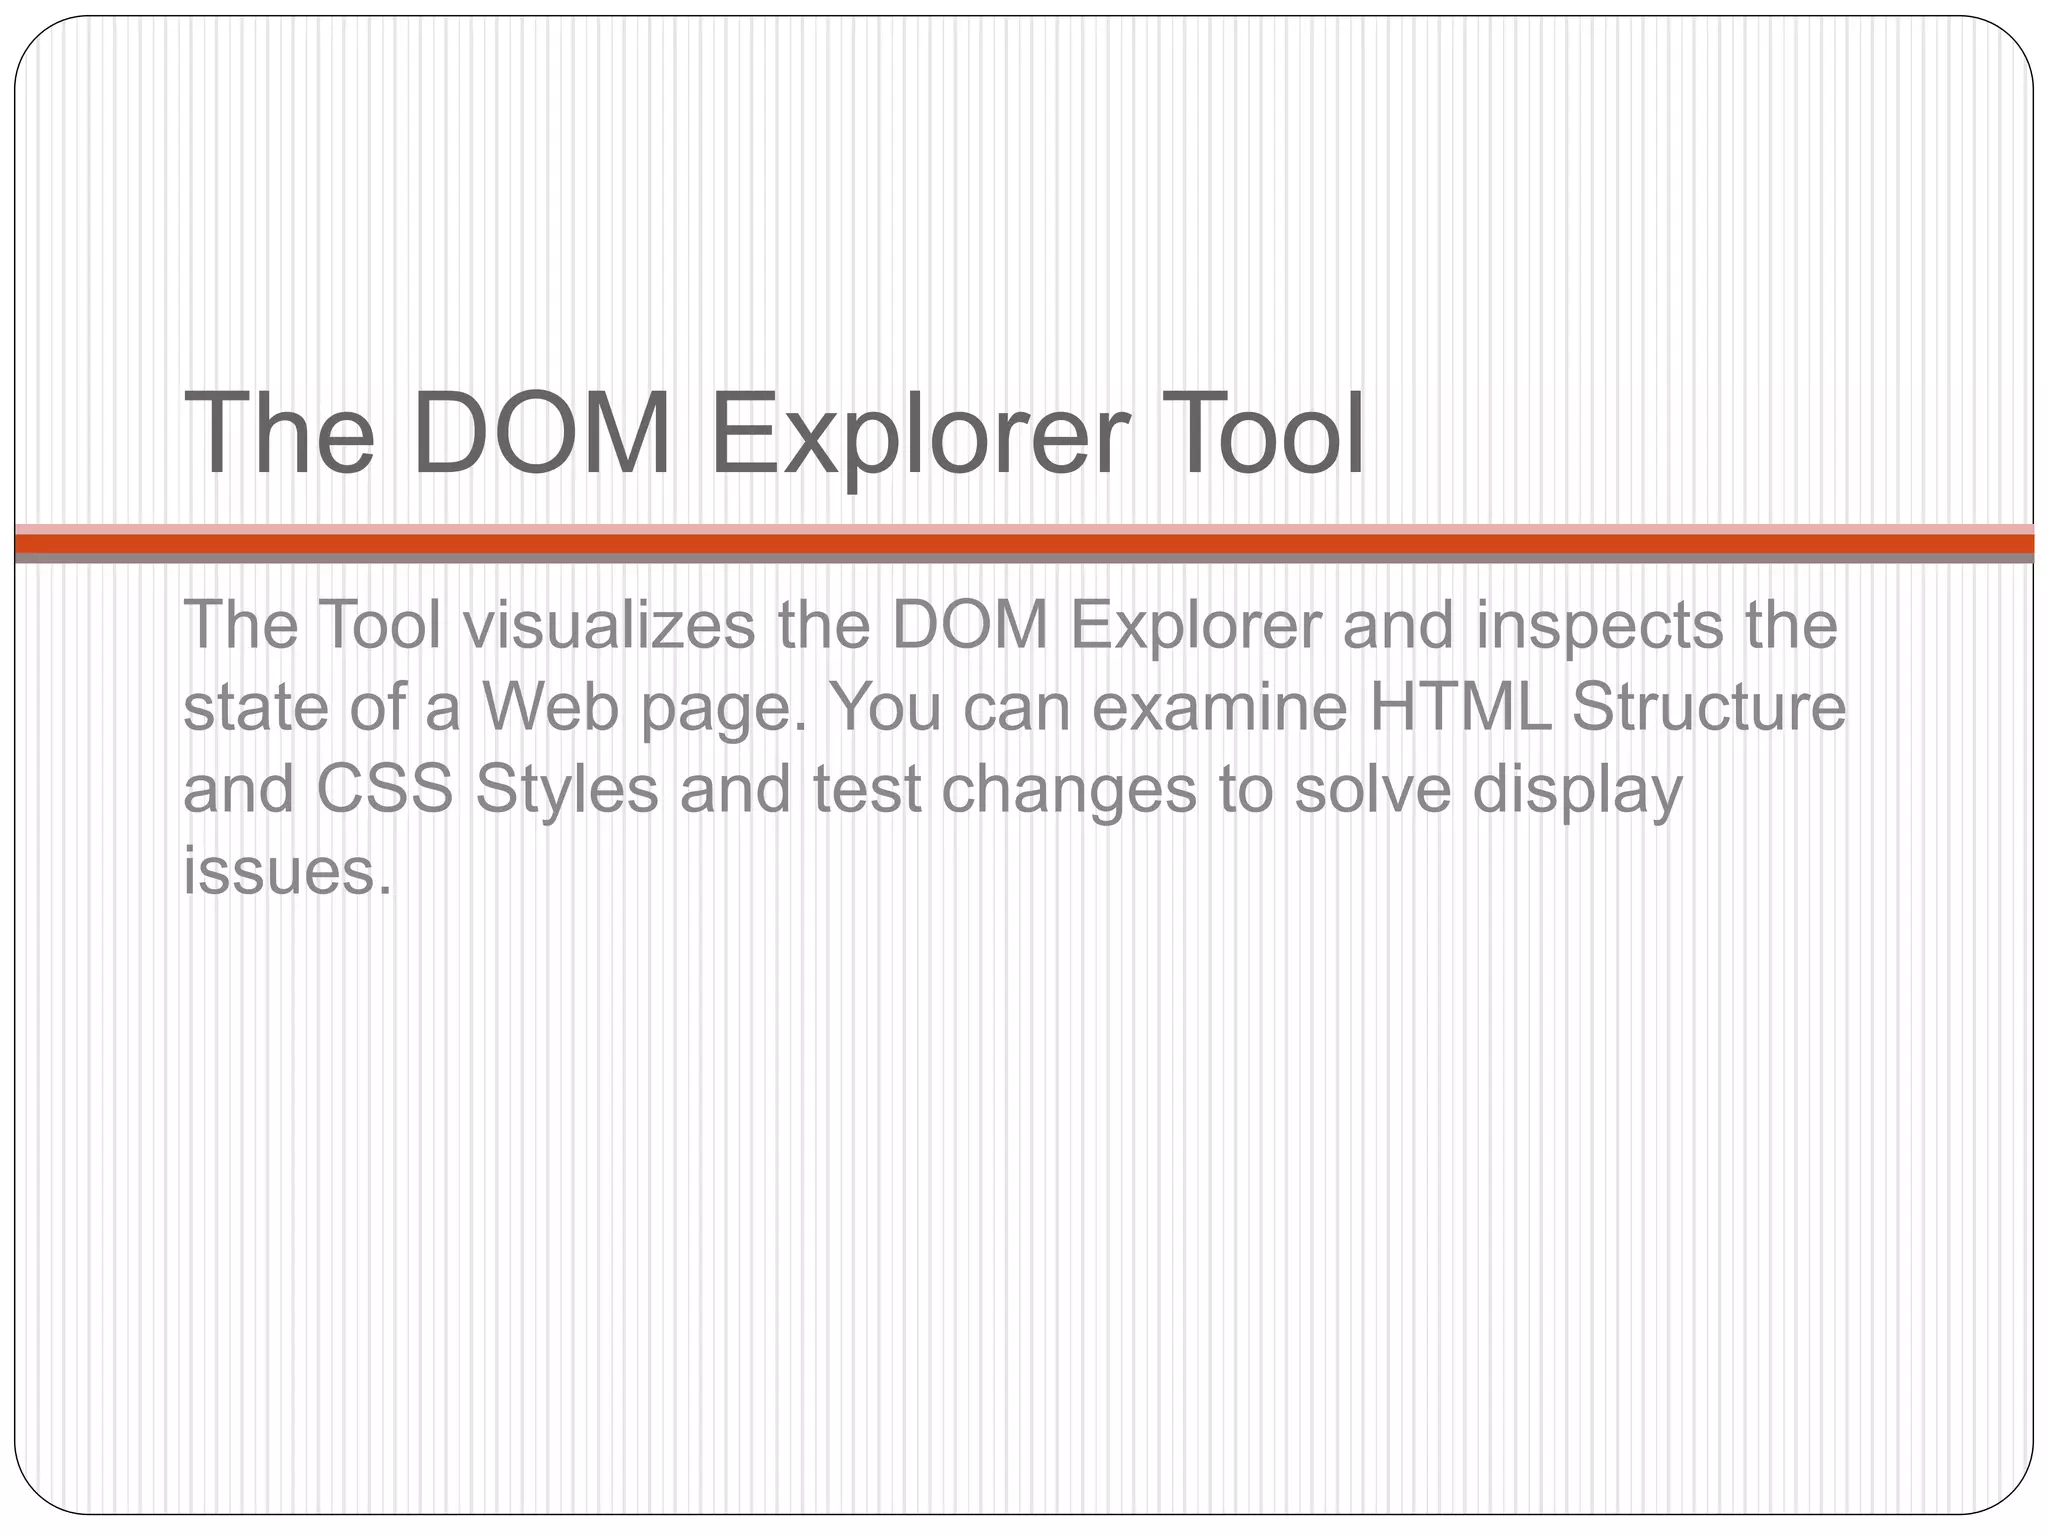
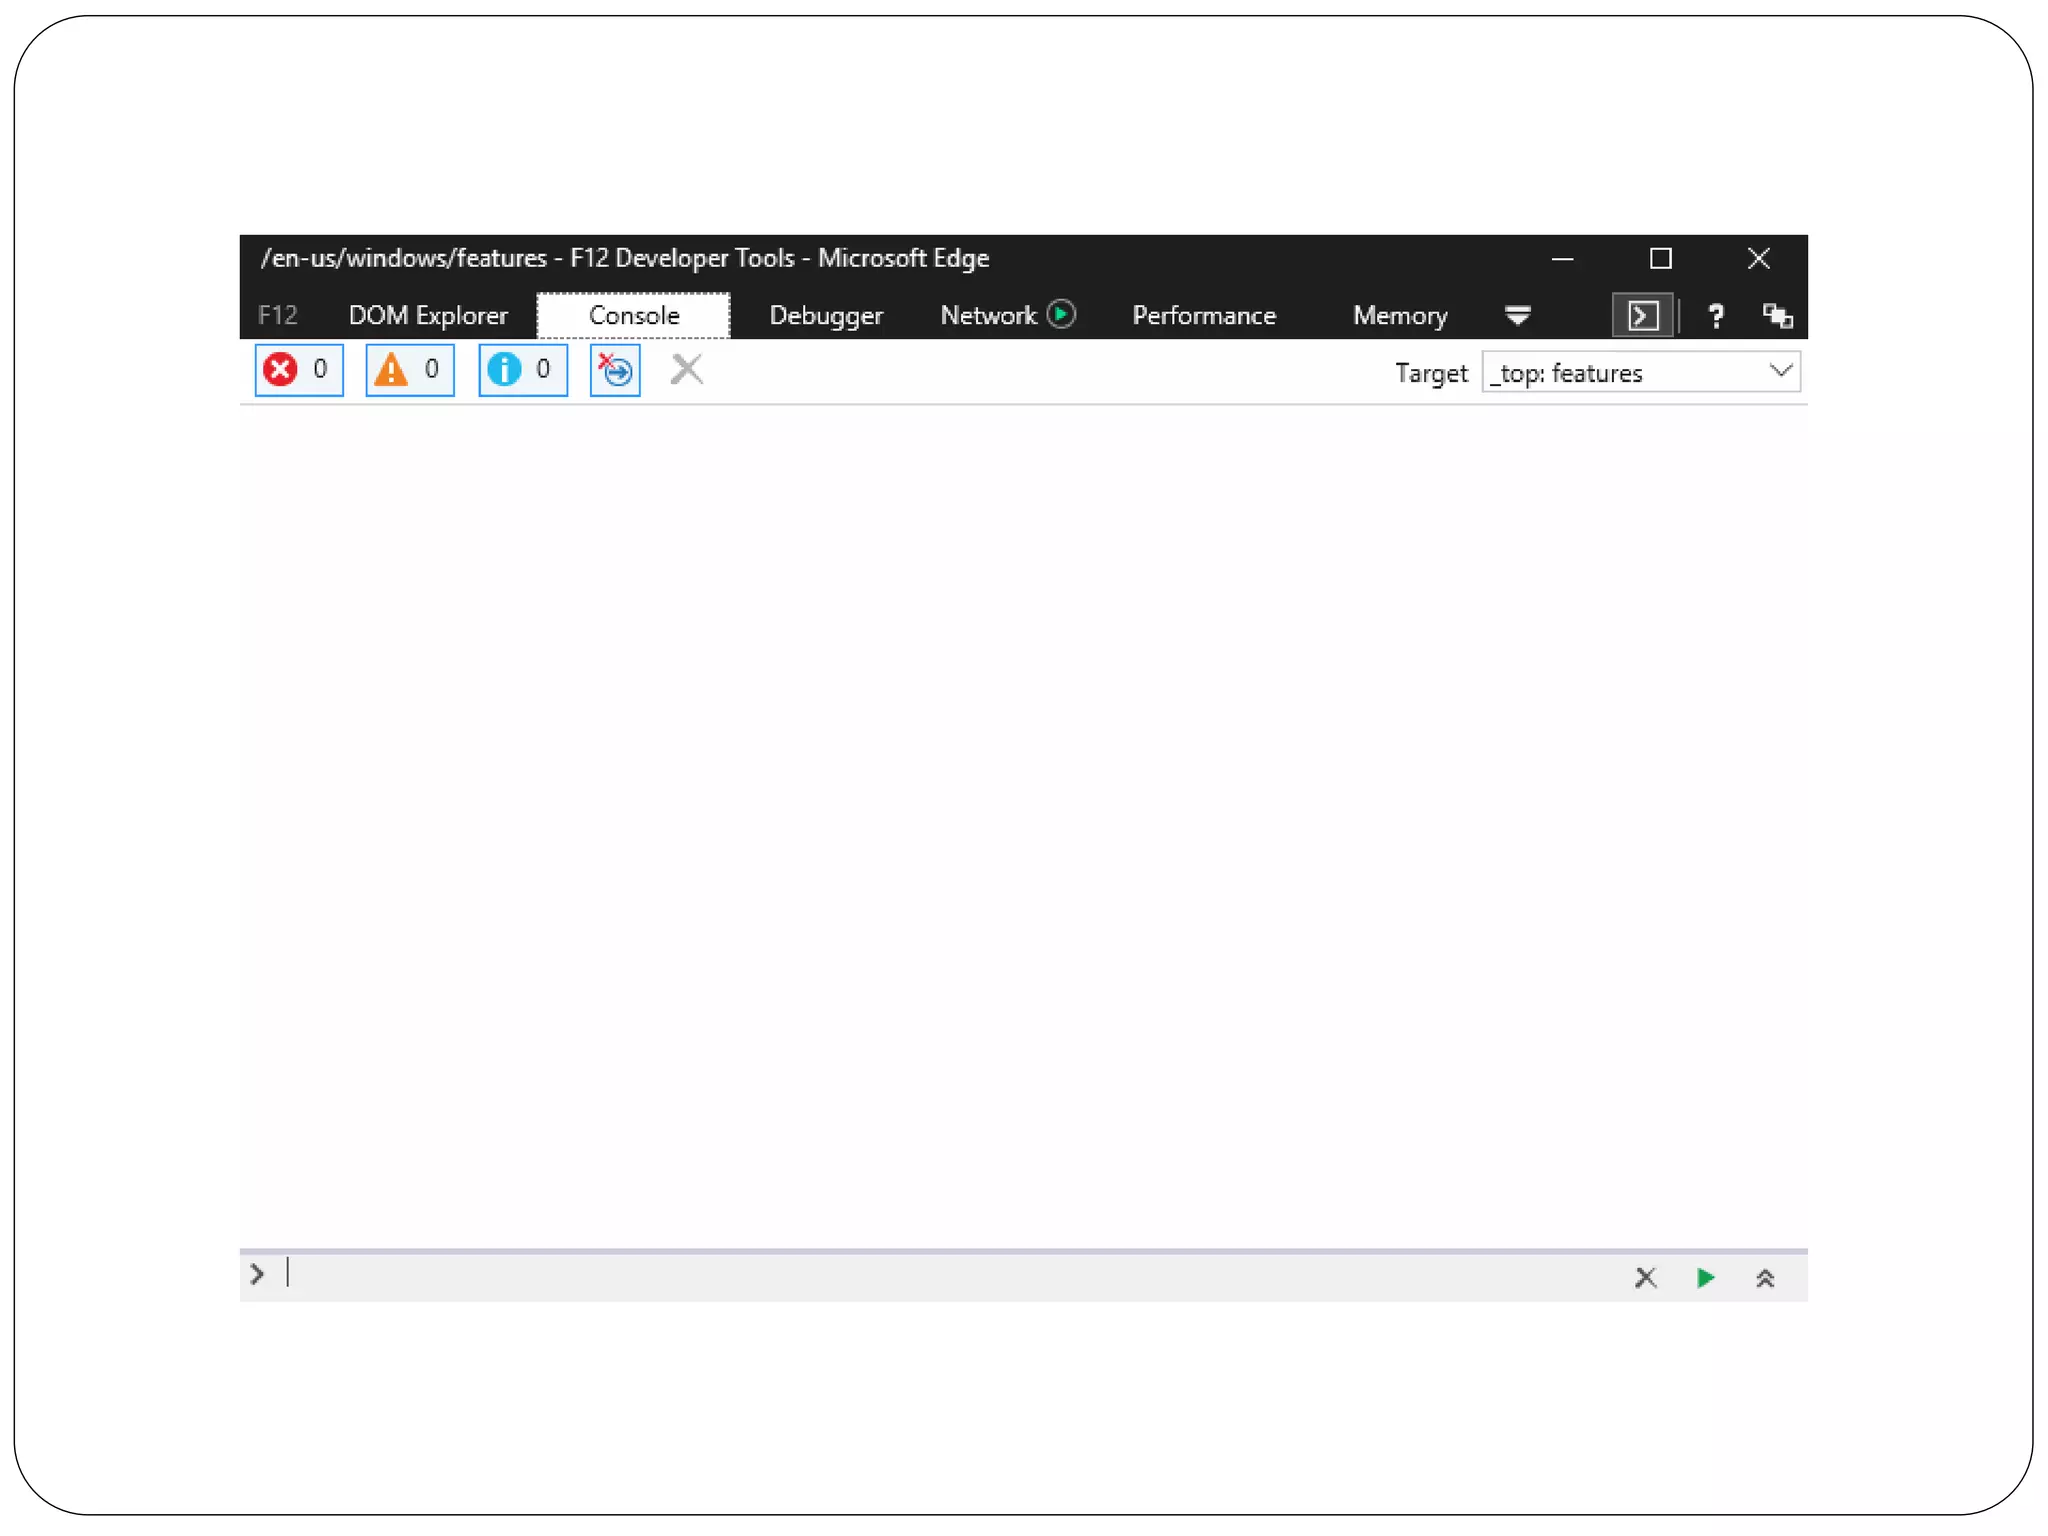
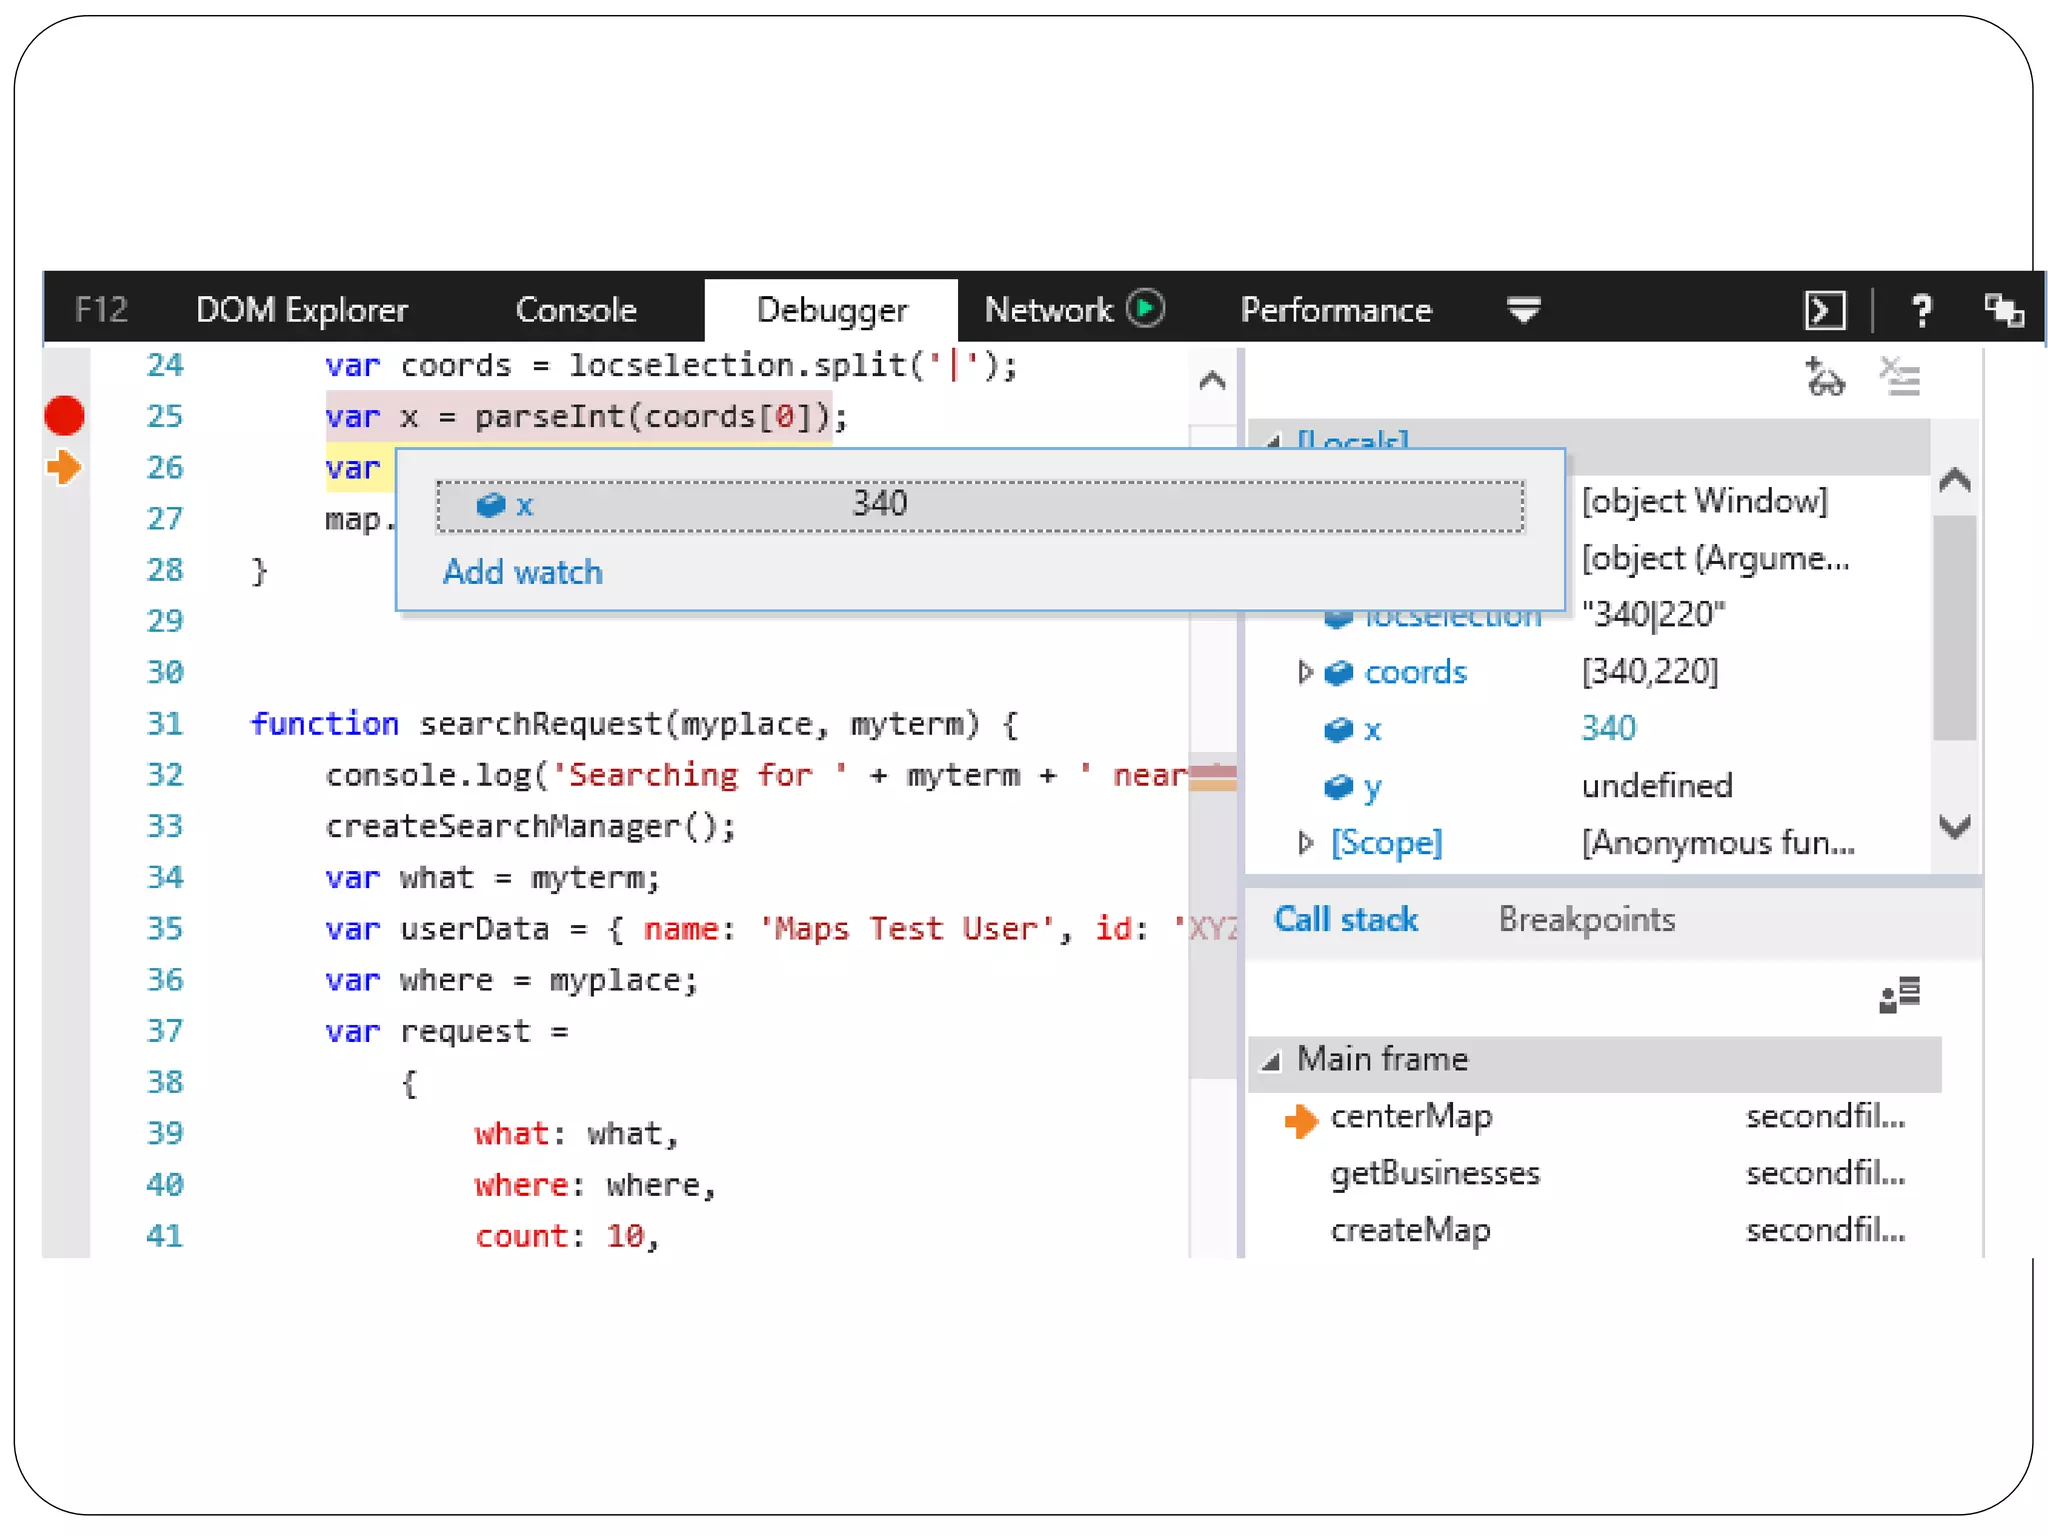
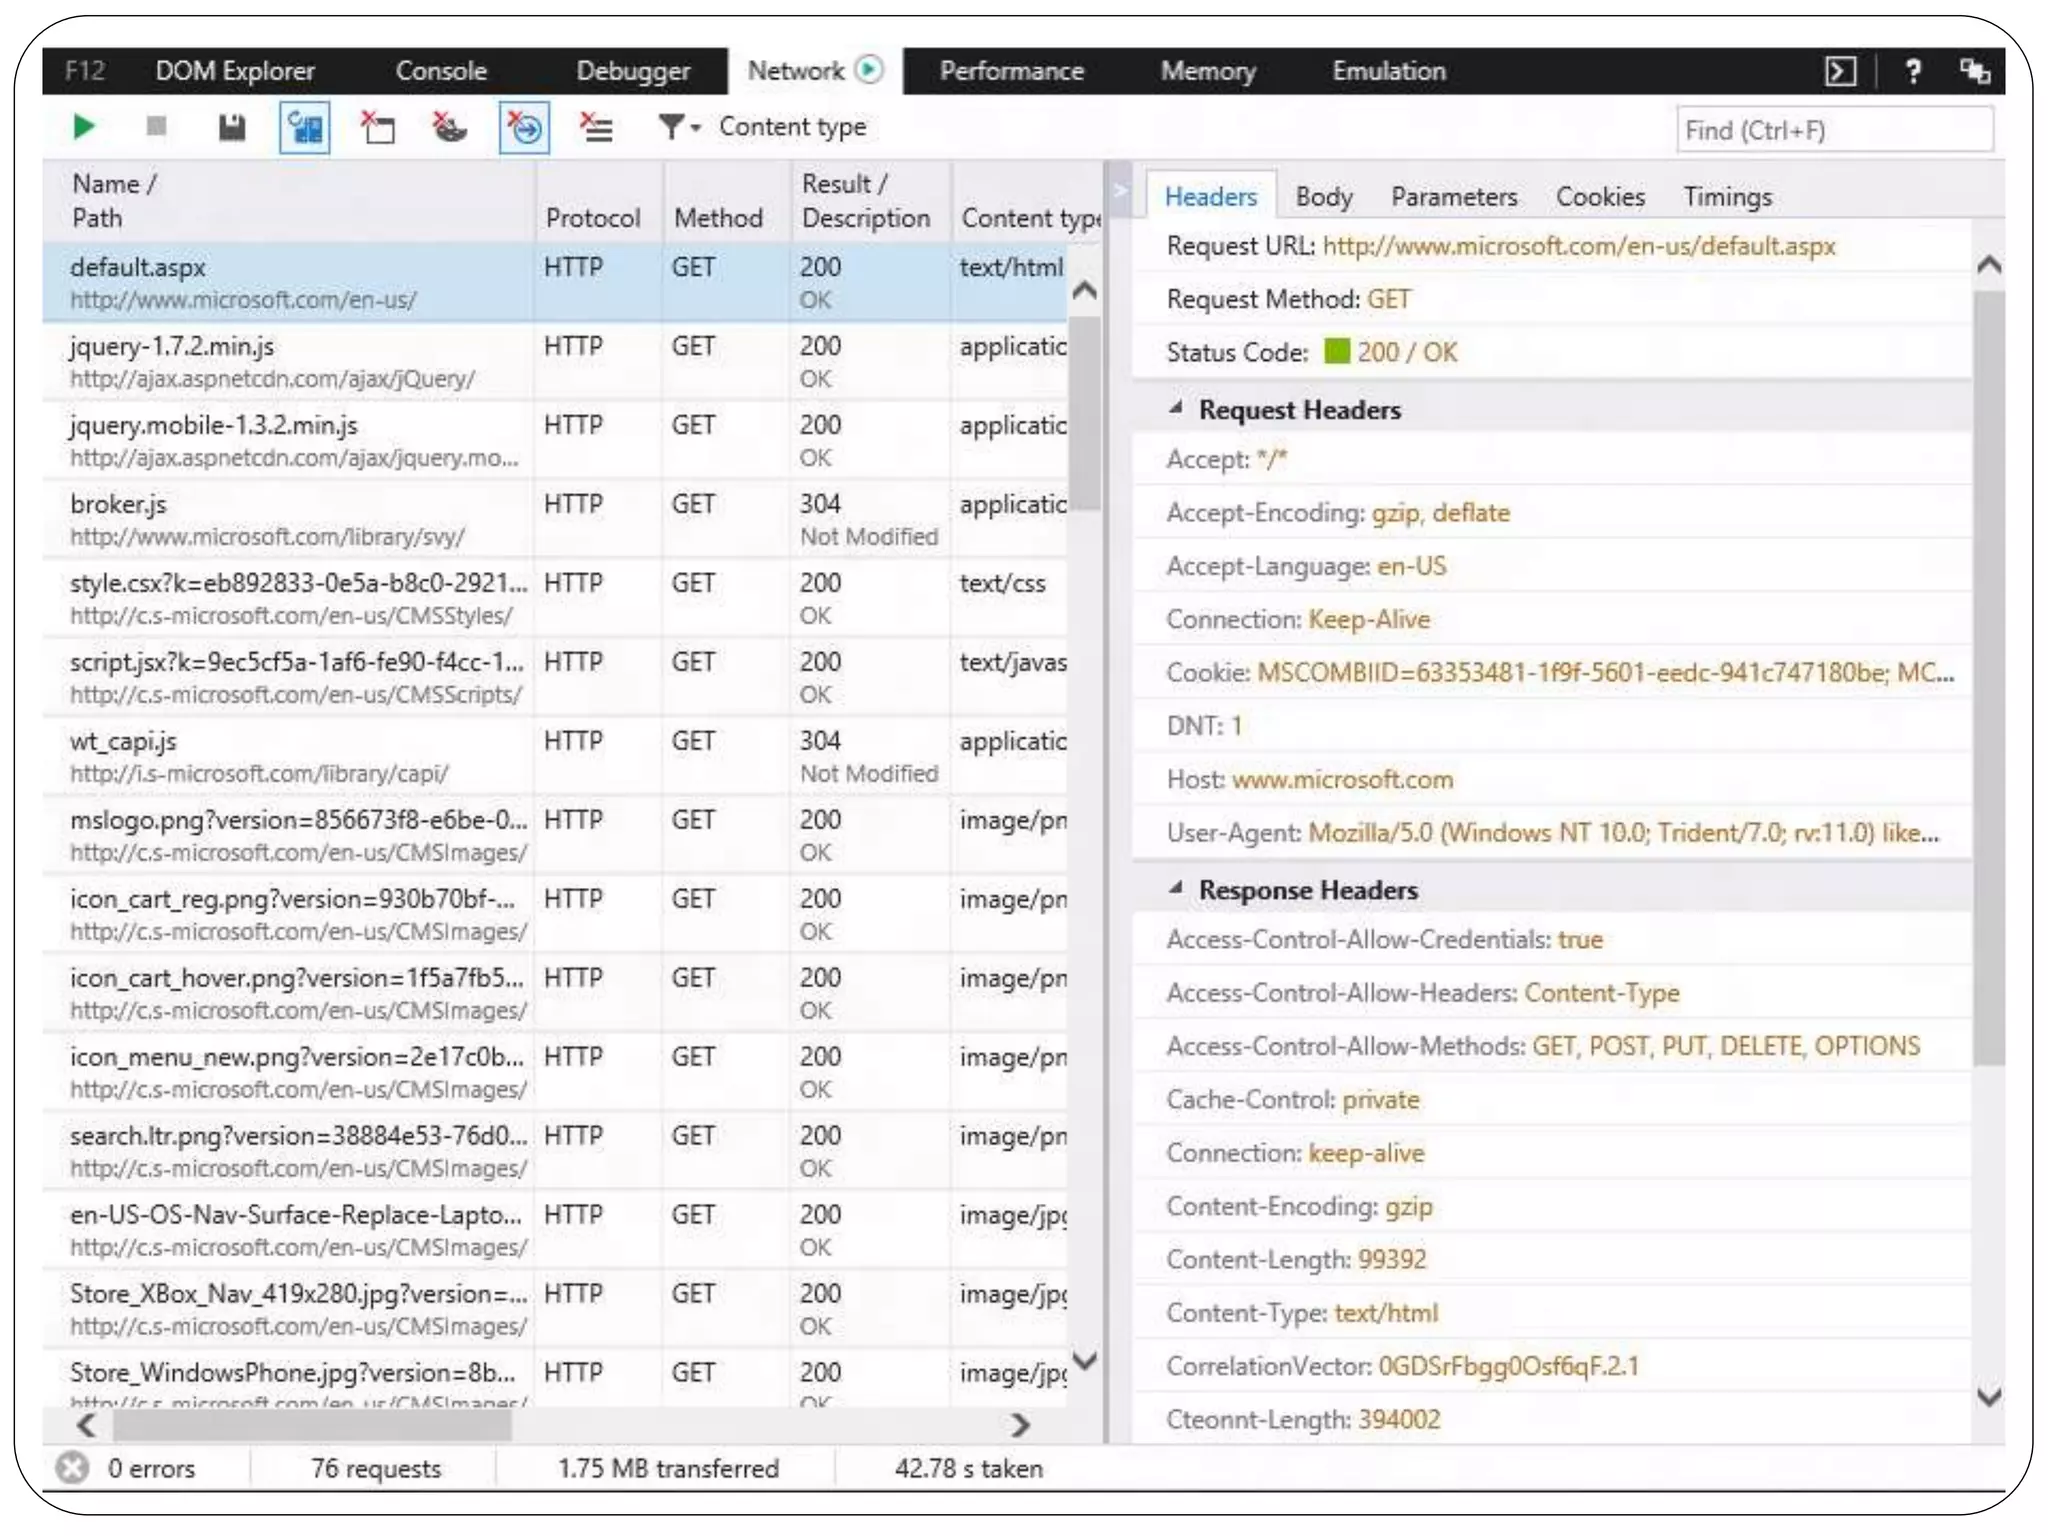
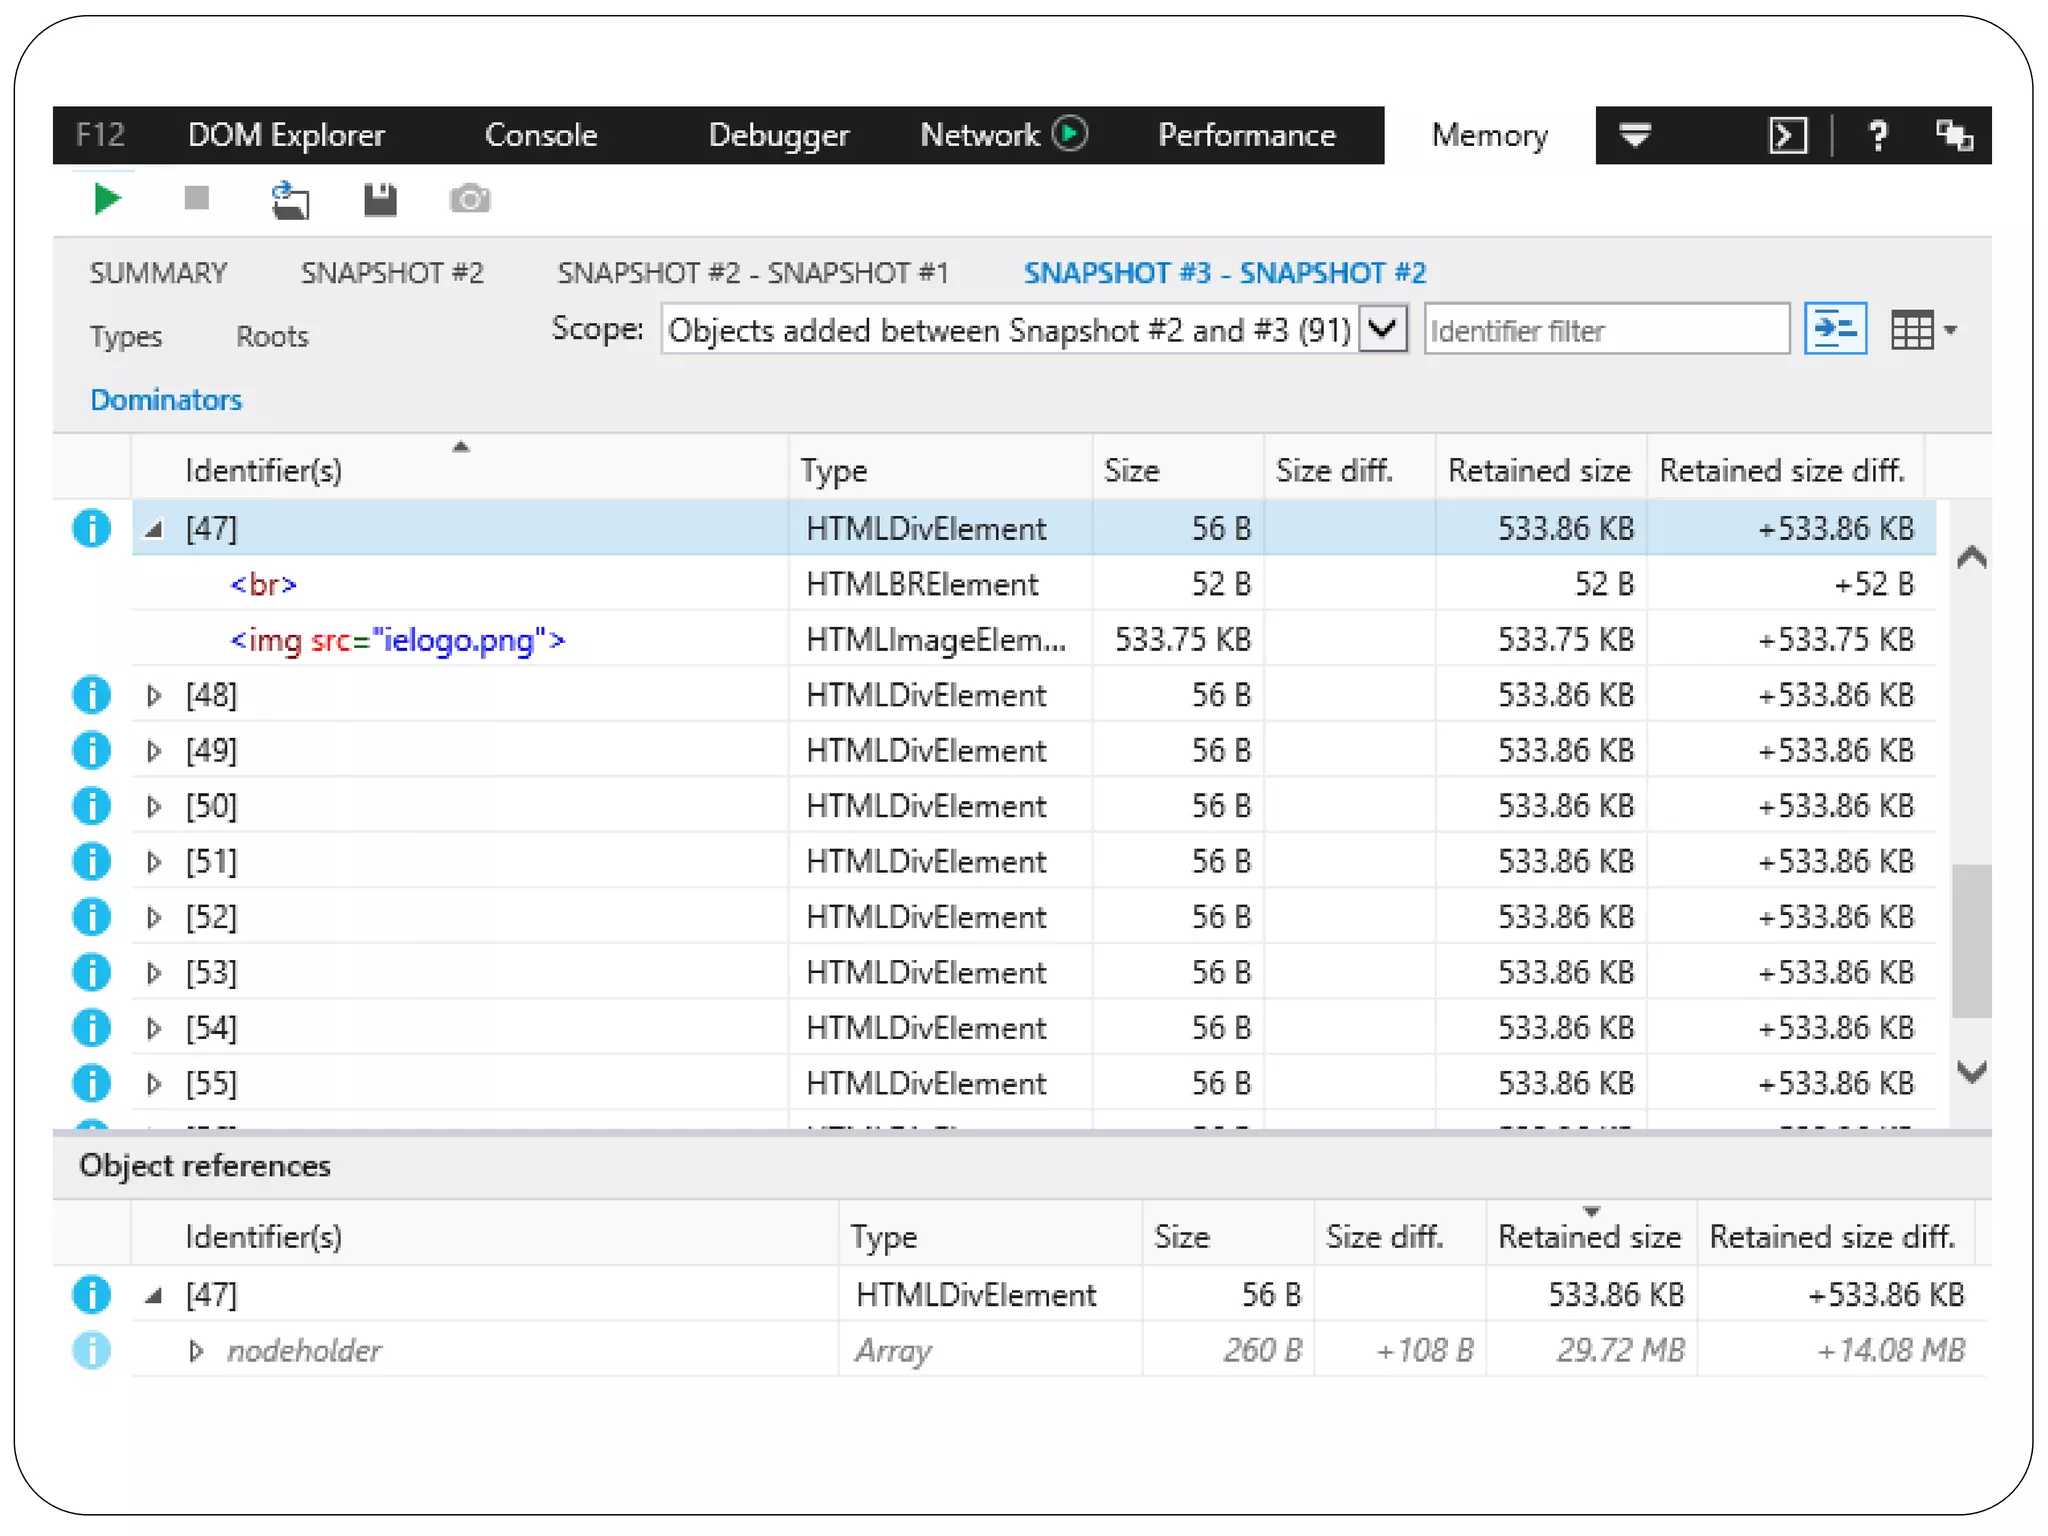
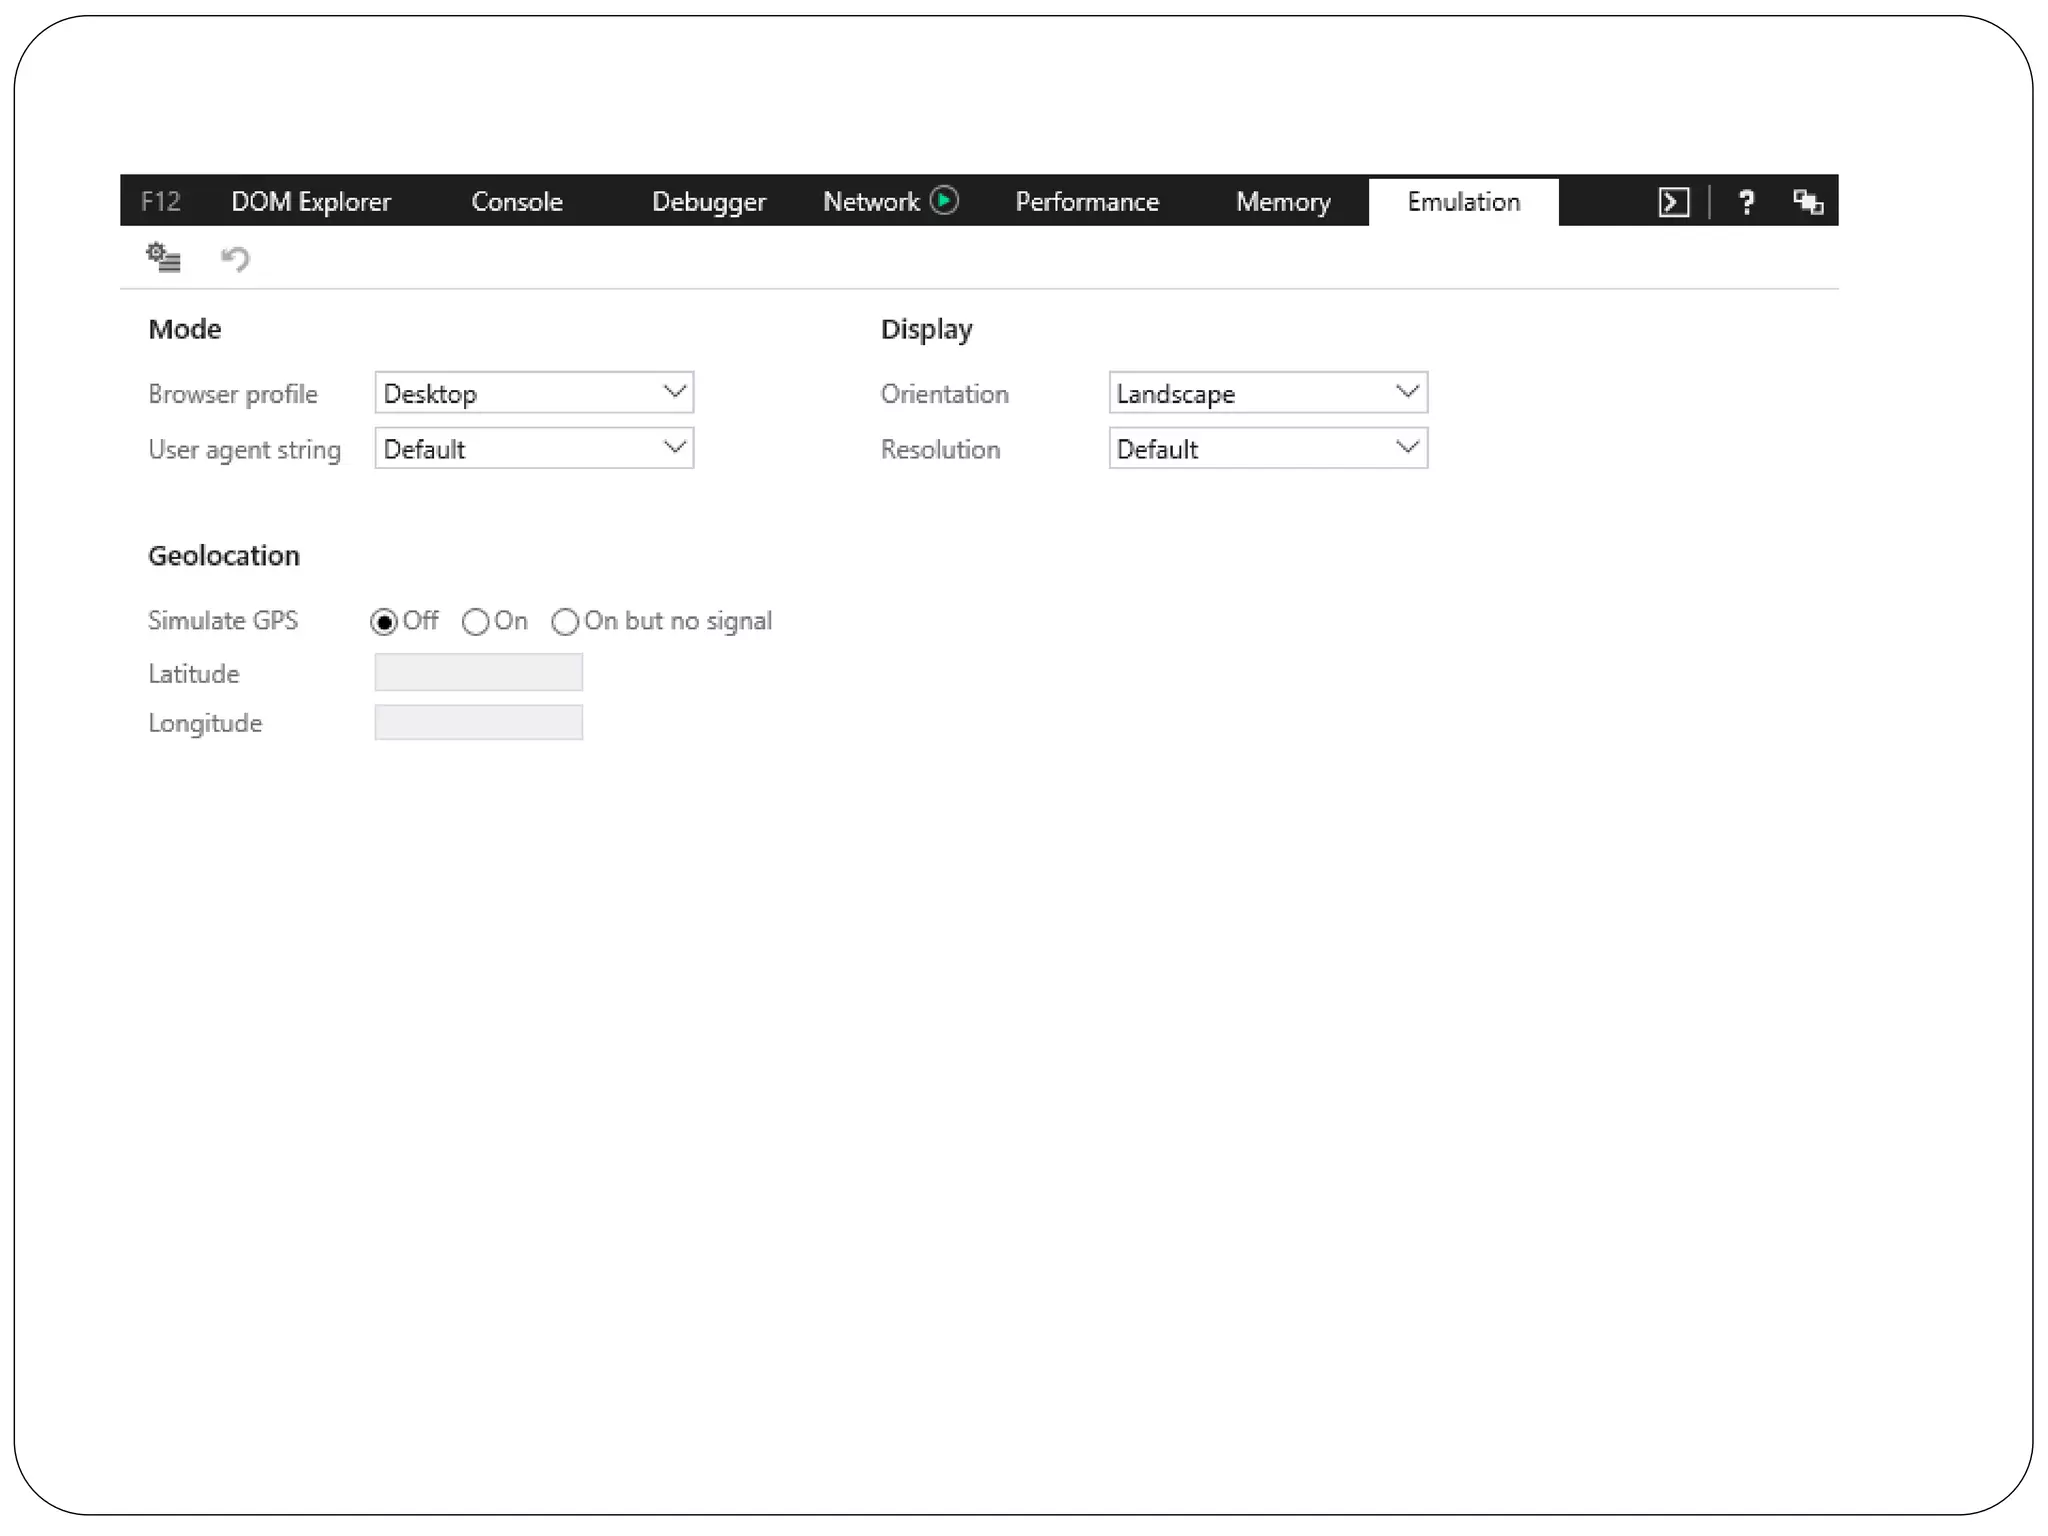
KEMBAR78
F12 debugging in Ms edge | PPTX
Abhishek Sur, Microsoft MVP
Architect, Insync
F12 Debugging in MS Edge
Agenda
 DOM Explorer (CTRL + 1)
 Console Tool (CTRL + 2)
 The Debugger Tool (CTRL + 3)
 The Network Tool (CTRL + 4)
 The Performance Tool (CTRL + 5)
 The Memory Tool (CTRL + 6)
 The Emulator Tool (CTRL + 7)
 The Experiment Tool (CTRL + 8)
Built in .NET and TypeScript in
background Edge utilizes the
power of Microsoft .NET and
produces awesome rendering
experience.
The DOM Explorer Tool
The Tool visualizes the DOM Explorer and inspects the
state of a Web page. You can examine HTML Structure
and CSS Styles and test changes to solve display
issues.
Features
 Inspect Element
 BreadCrumbs
 Search
 Change / Edit attributes or Styles
 Drag DOM Elements
 Layout or Box model diagram of element
 Events for DOM
 Change Tracking
The Console Tool
The Tool is used to view errors and other messages,
send debug outputs, inspect Javascript objects and
XML nodes, and to run Javascript in the context of
selected window or frame.
Features
 Inspect Code in Realtime objects
 Show messages that Microsoft shows to Console
 Option to select frames to change Context
 Change / Edit attributes or Styles
 $(), $$(), $0, $1… For selecting elements in DOM
 Support for Console API
 Log, Count, Time, Trace, Assert, Error, Clear etc.
The Debugger Tool
The Debugger tool is used to navigate your code as it
runs, set watches and breakpoints, view call stacks, and
improve readability of compiled/minified Javascript
Features
 Watches
 Call Stack
 Breakpoints & Conditional Breakpoints
 Pretty Print
 Show next statement/ Run to cursor / Set Next
Step
Network Tool
Use the network tool to view communication between
browser and server, inspect request and reply headers,
see response codes and debug ajax.
Features
 Enable/Disable Network traffic capture
 Export traffic capture
 Clear cache / cookie
 Content Type filtering with Search functionalities
 Clear Summary of each request
The Performance Tool
Performance tool allows you profile your webpage
framerate with timeline and javascript execution times
with javascript call stack. The reports on different types
of CPU usage and javascript execution profiling help
you analyze UI performance problems.
Features
 Visual Throughput
 CPU utilization
 Timeline Details
 API for performance.mark() and
performance.measure() to measure performance
of a method.
The Memory Tool
Use Memory tool to diagonise memory issues that can
impact the speed and stability of web pages.
Features
 Profile using Snapshots of heap
 Details of each snapshot with size of each DOM
Element in memory
 Comparison view between two snapshots
The Emulator Tool
Use Emulation tool to test how web pages work with
different browser profiles, user agents, screen sizes and
resolutions and GPS location coordinates.
Features
 Emulate on different browser profiles and screen
sizes
 Emulate Desktop vs Phone
 Change Geo location to emulate
The Experiment Tool
The experiment tool will allow you to edit jacascript
content on the fly and execute directly
More Resources
 Edge documentation
https://dev.windows.com/en-us/microsoft-
edge/platform/documentation
 Static website performance scanner
https://dev.windows.com/en-us/microsoft-
edge/tools/staticscan/
 Microsoft Edge in Git
https://github.com/MicrosoftEdge
Thank you

F12 debugging in Ms edge

  • 1.
    Abhishek Sur, MicrosoftMVP Architect, Insync F12 Debugging in MS Edge
  • 2.
    Agenda  DOM Explorer(CTRL + 1)  Console Tool (CTRL + 2)  The Debugger Tool (CTRL + 3)  The Network Tool (CTRL + 4)  The Performance Tool (CTRL + 5)  The Memory Tool (CTRL + 6)  The Emulator Tool (CTRL + 7)  The Experiment Tool (CTRL + 8)
  • 3.
    Built in .NETand TypeScript in background Edge utilizes the power of Microsoft .NET and produces awesome rendering experience.
  • 4.
    The DOM ExplorerTool The Tool visualizes the DOM Explorer and inspects the state of a Web page. You can examine HTML Structure and CSS Styles and test changes to solve display issues.
  • 5.
    Features  Inspect Element BreadCrumbs  Search  Change / Edit attributes or Styles  Drag DOM Elements  Layout or Box model diagram of element  Events for DOM  Change Tracking
  • 7.
    The Console Tool TheTool is used to view errors and other messages, send debug outputs, inspect Javascript objects and XML nodes, and to run Javascript in the context of selected window or frame.
  • 8.
    Features  Inspect Codein Realtime objects  Show messages that Microsoft shows to Console  Option to select frames to change Context  Change / Edit attributes or Styles  $(), $$(), $0, $1… For selecting elements in DOM  Support for Console API  Log, Count, Time, Trace, Assert, Error, Clear etc.
  • 10.
    The Debugger Tool TheDebugger tool is used to navigate your code as it runs, set watches and breakpoints, view call stacks, and improve readability of compiled/minified Javascript
  • 11.
    Features  Watches  CallStack  Breakpoints & Conditional Breakpoints  Pretty Print  Show next statement/ Run to cursor / Set Next Step
  • 13.
    Network Tool Use thenetwork tool to view communication between browser and server, inspect request and reply headers, see response codes and debug ajax.
  • 14.
    Features  Enable/Disable Networktraffic capture  Export traffic capture  Clear cache / cookie  Content Type filtering with Search functionalities  Clear Summary of each request
  • 16.
    The Performance Tool Performancetool allows you profile your webpage framerate with timeline and javascript execution times with javascript call stack. The reports on different types of CPU usage and javascript execution profiling help you analyze UI performance problems.
  • 17.
    Features  Visual Throughput CPU utilization  Timeline Details  API for performance.mark() and performance.measure() to measure performance of a method.
  • 19.
    The Memory Tool UseMemory tool to diagonise memory issues that can impact the speed and stability of web pages.
  • 20.
    Features  Profile usingSnapshots of heap  Details of each snapshot with size of each DOM Element in memory  Comparison view between two snapshots
  • 23.
    The Emulator Tool UseEmulation tool to test how web pages work with different browser profiles, user agents, screen sizes and resolutions and GPS location coordinates.
  • 24.
    Features  Emulate ondifferent browser profiles and screen sizes  Emulate Desktop vs Phone  Change Geo location to emulate
  • 26.
    The Experiment Tool Theexperiment tool will allow you to edit jacascript content on the fly and execute directly
  • 28.
    More Resources  Edgedocumentation https://dev.windows.com/en-us/microsoft- edge/platform/documentation  Static website performance scanner https://dev.windows.com/en-us/microsoft- edge/tools/staticscan/  Microsoft Edge in Git https://github.com/MicrosoftEdge
  • 29.