Download to read offline


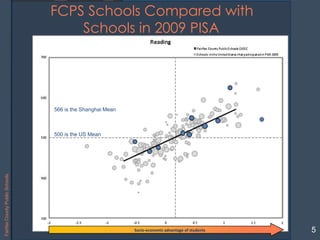
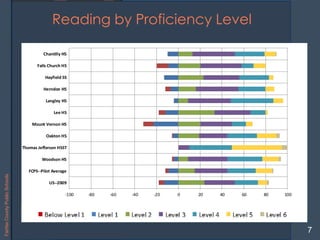
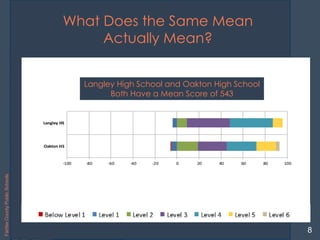


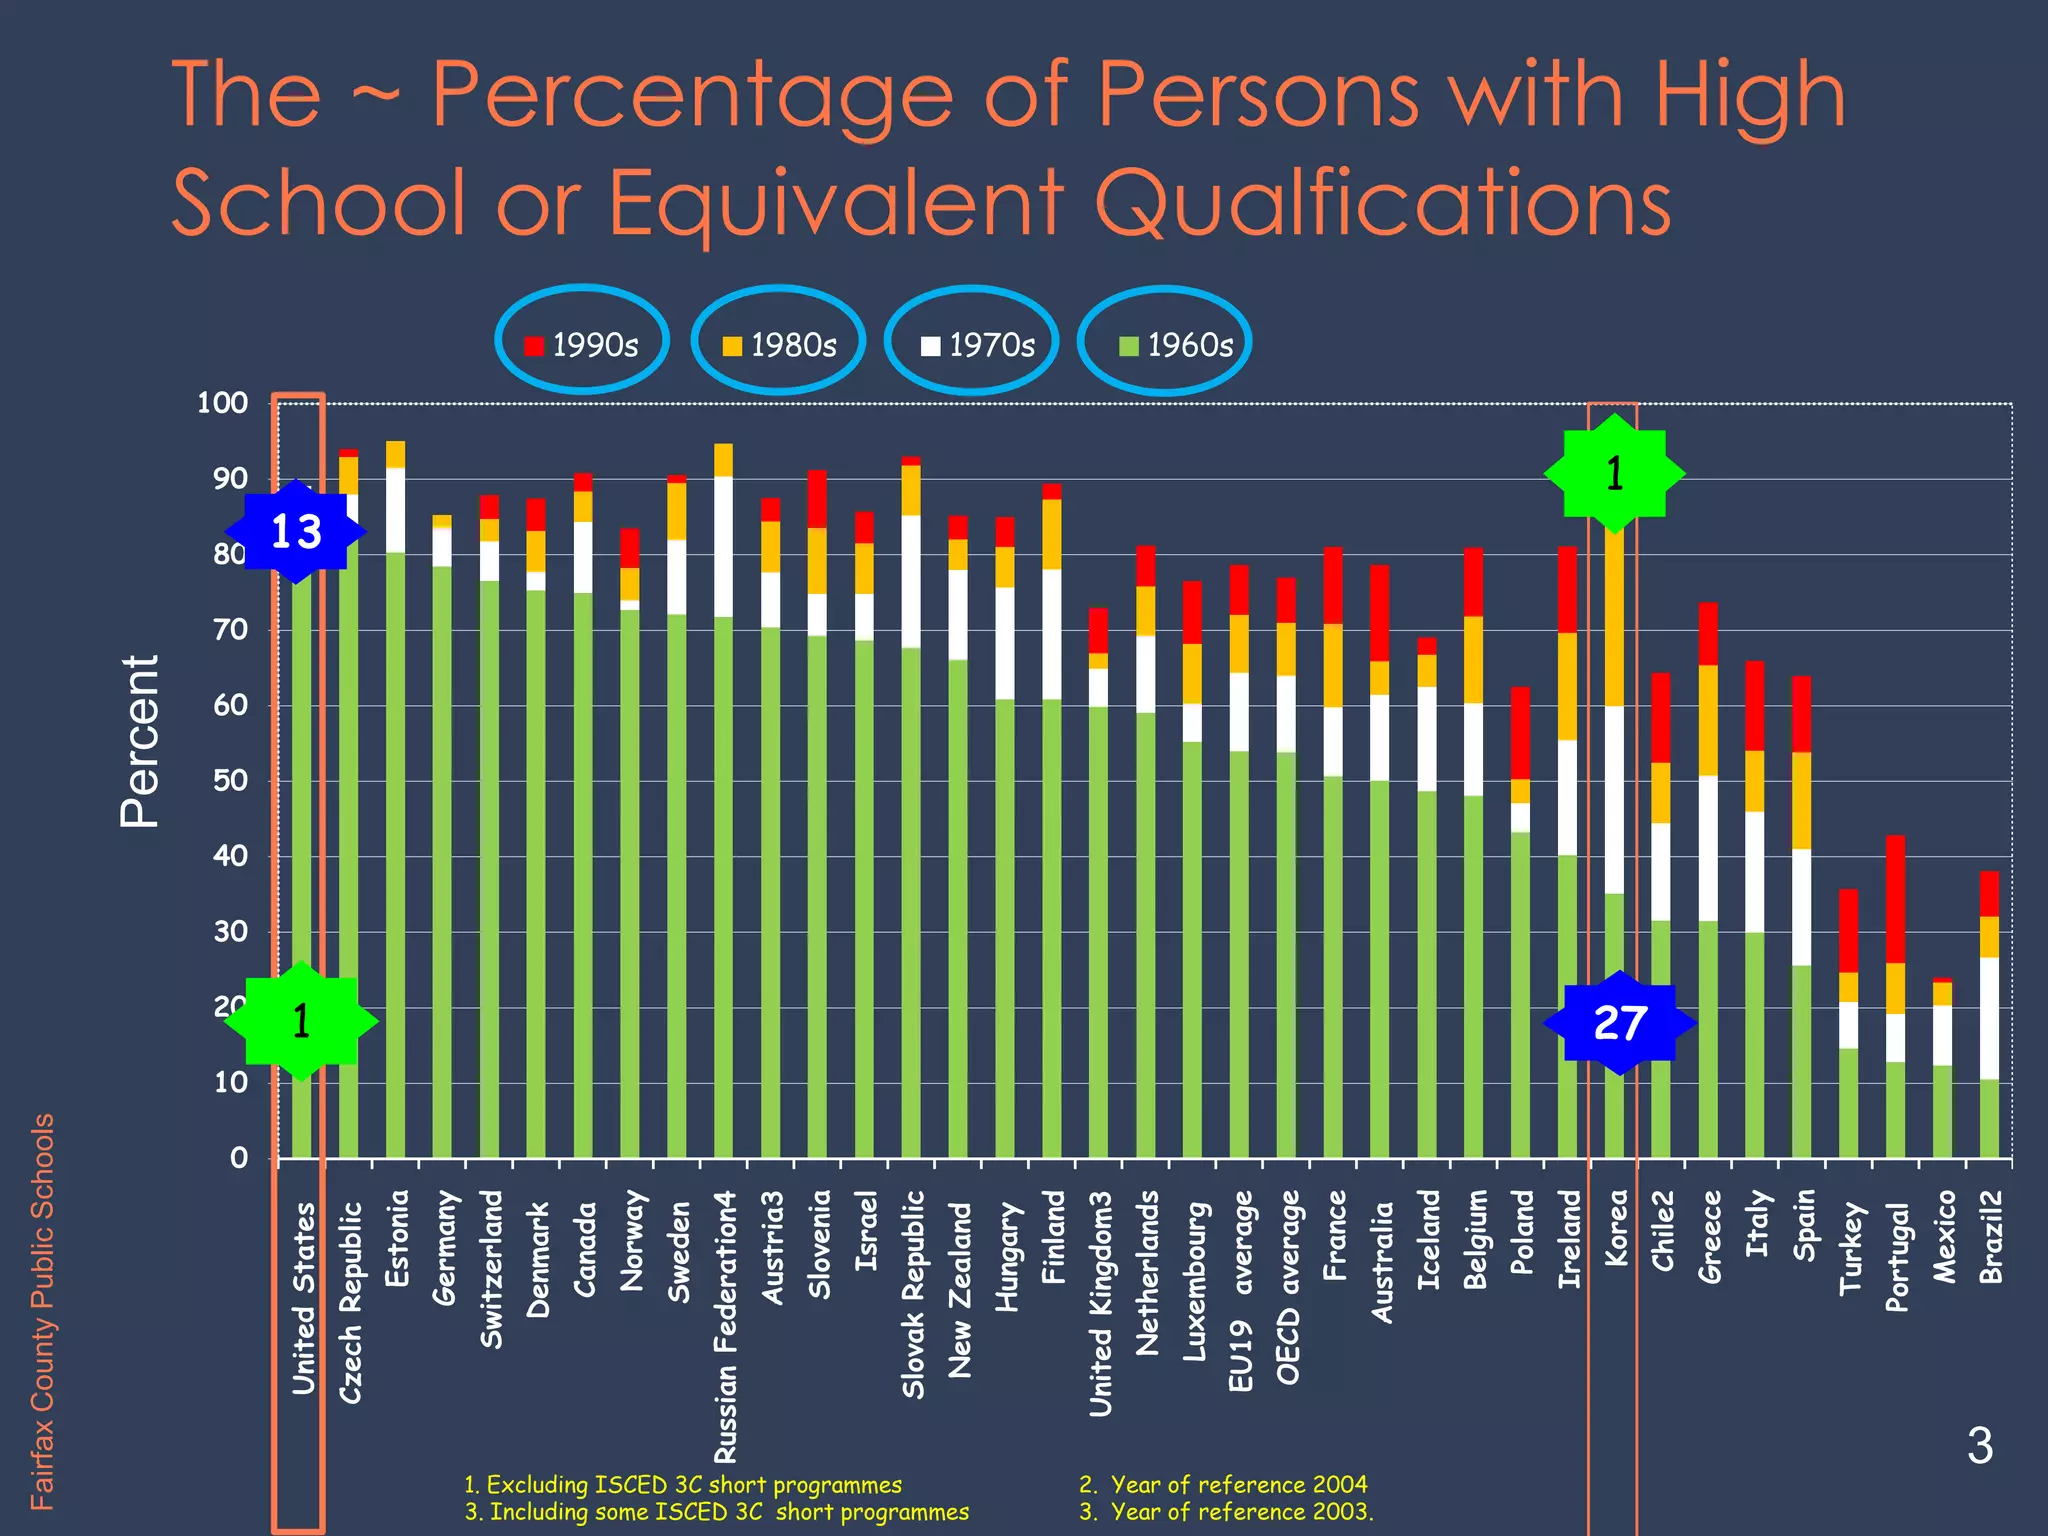
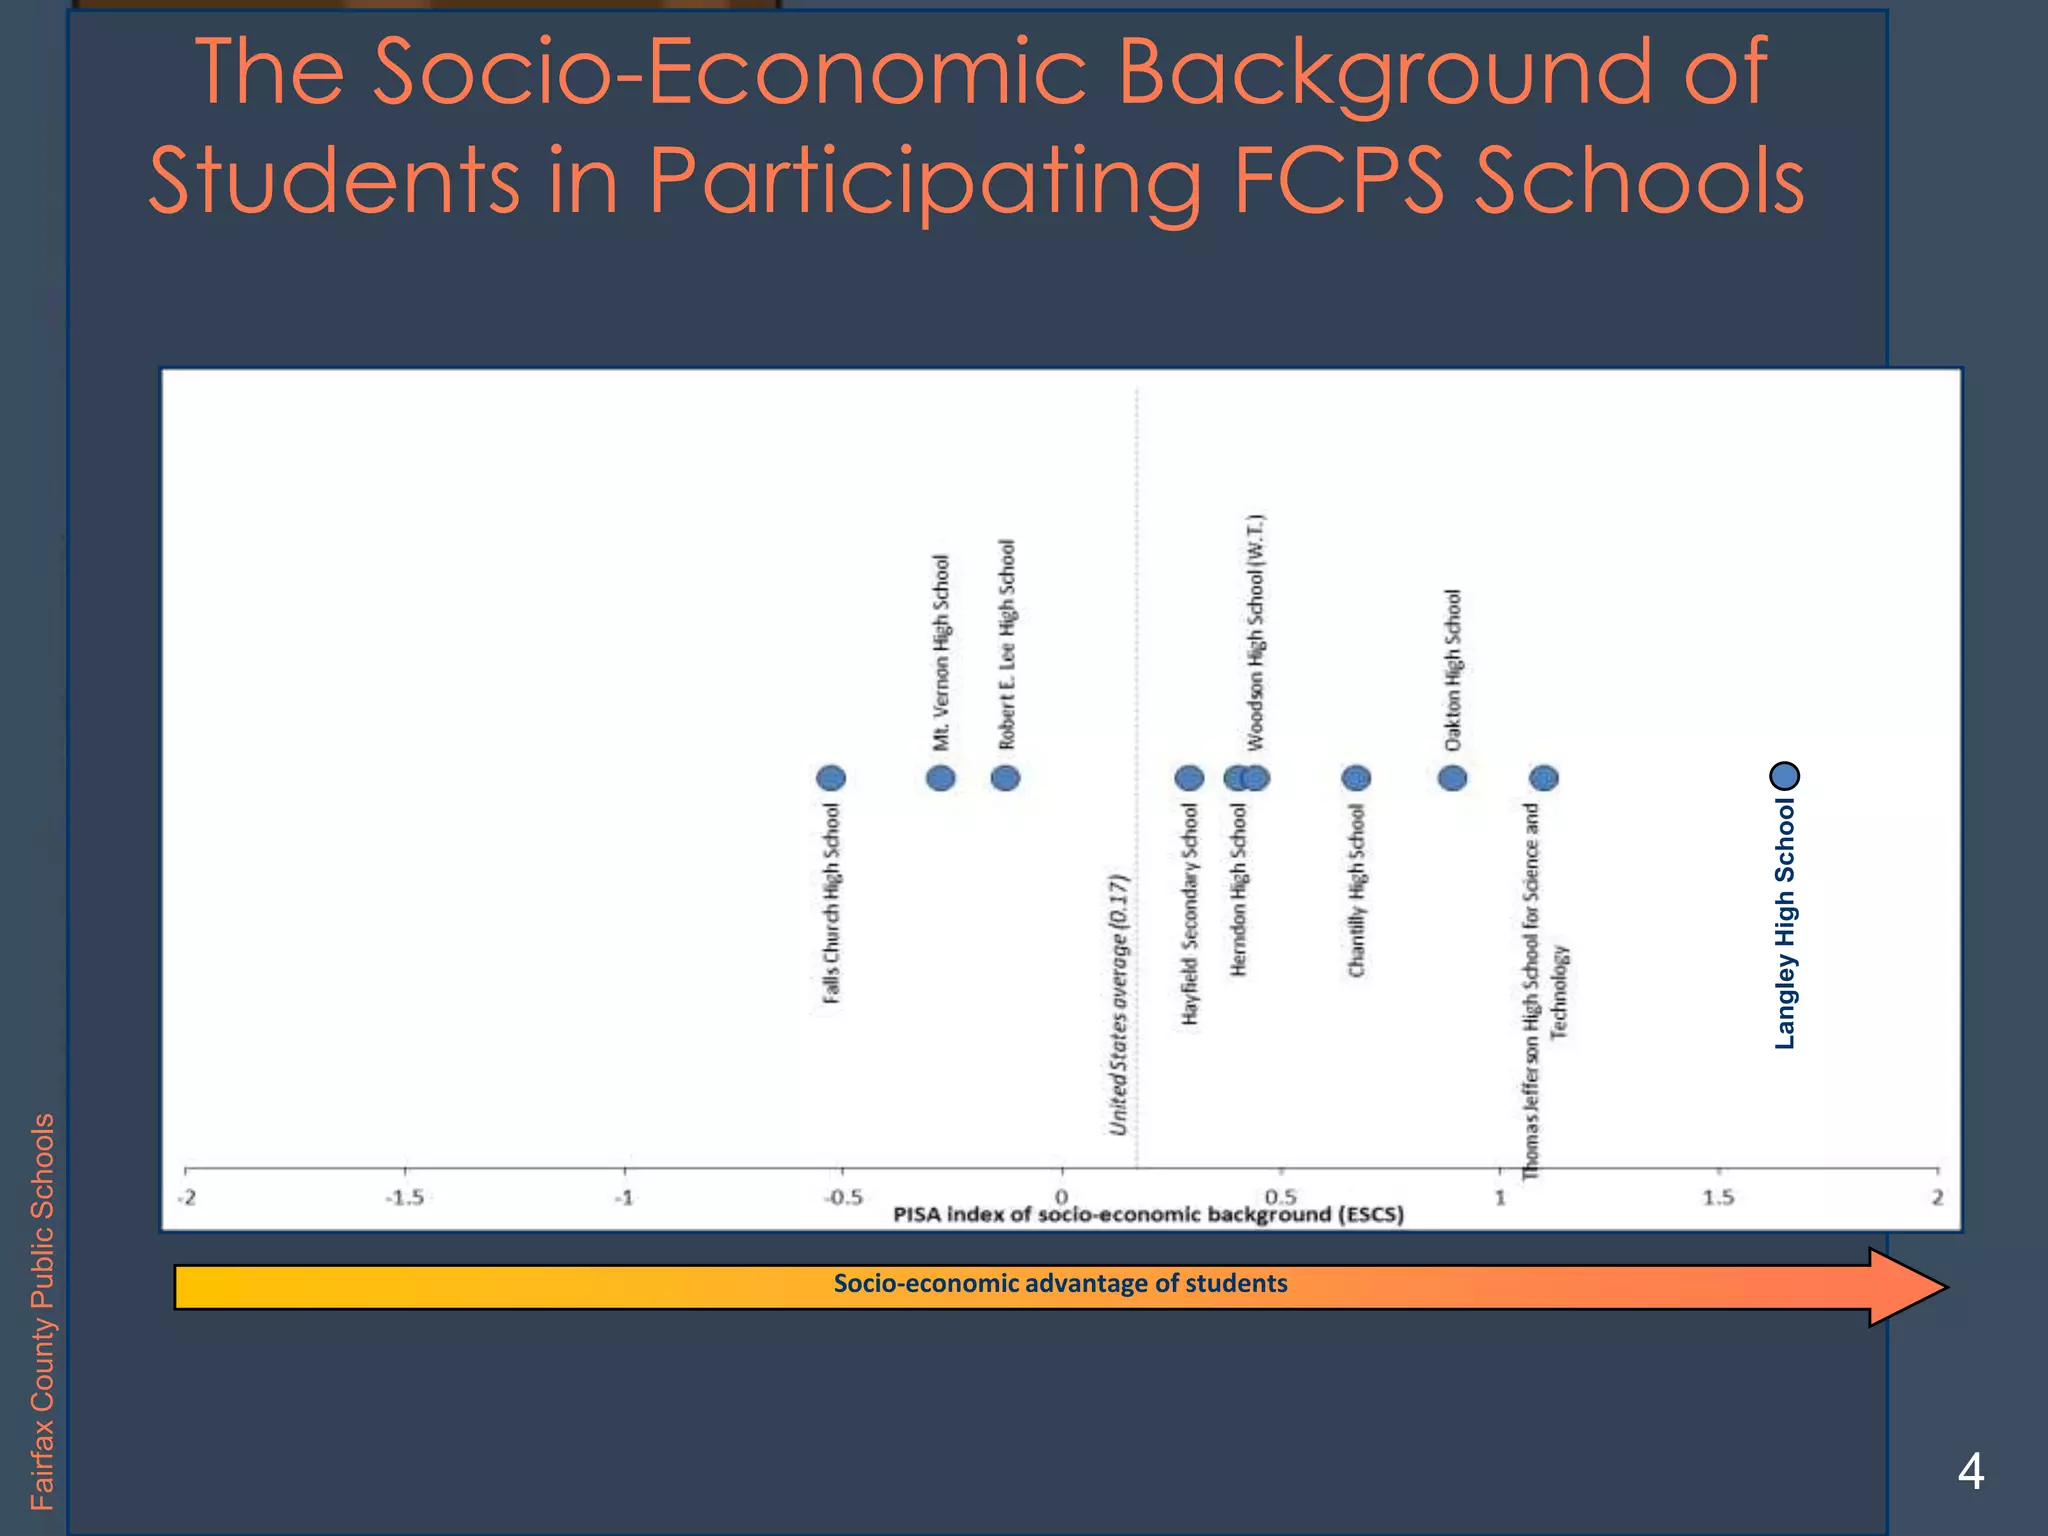
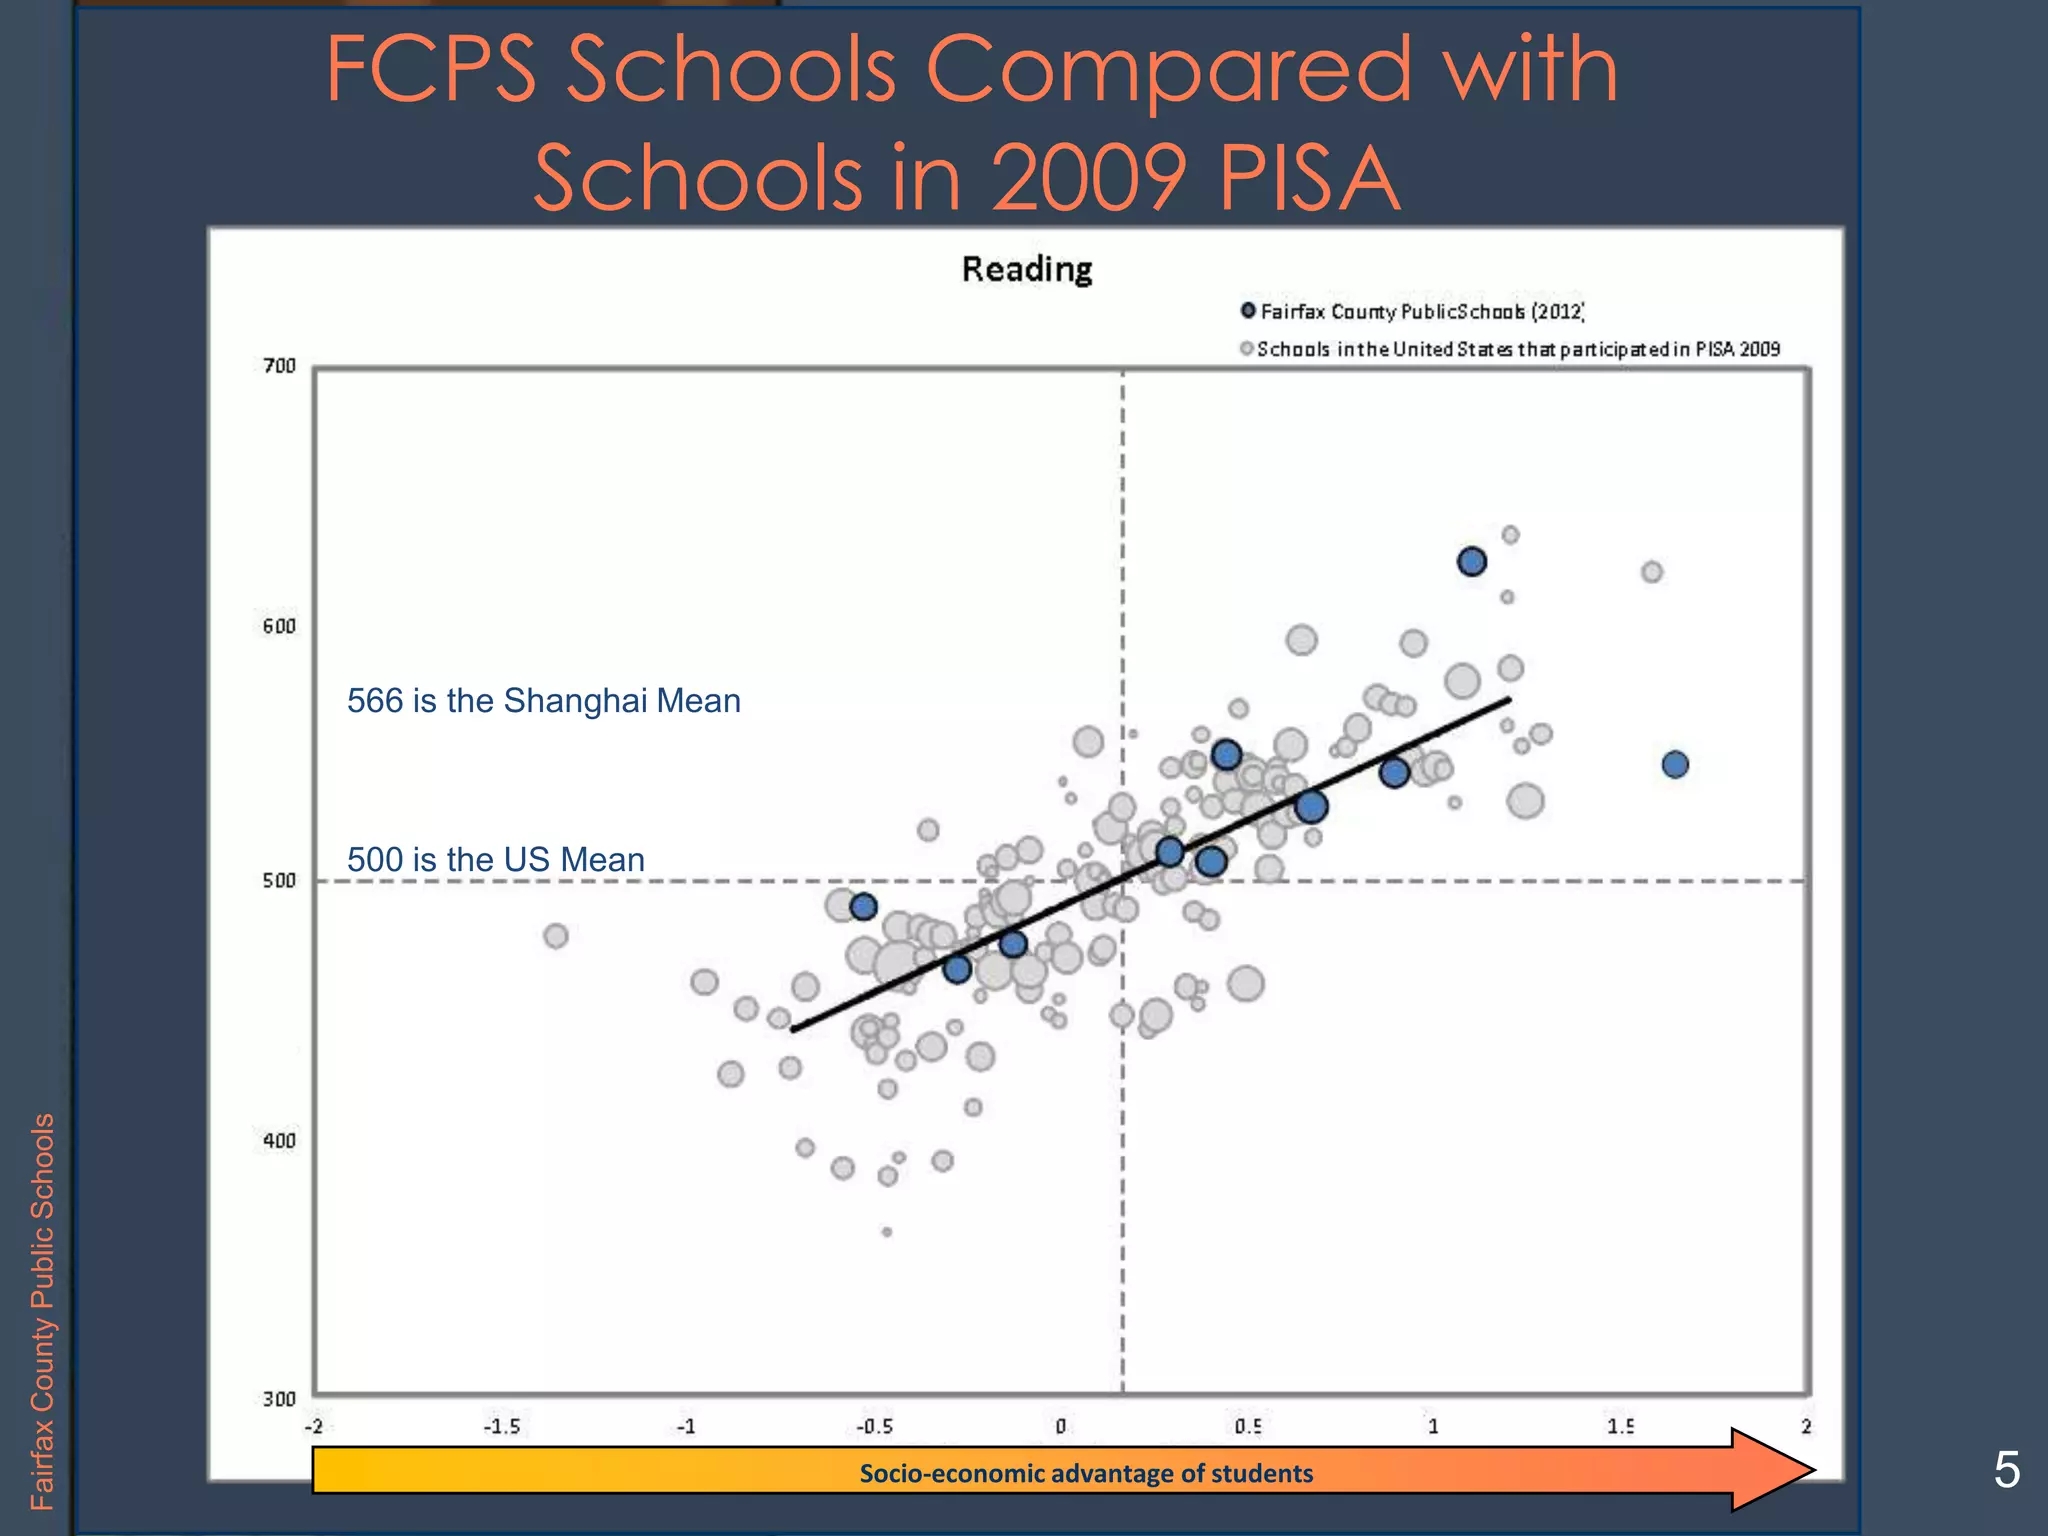
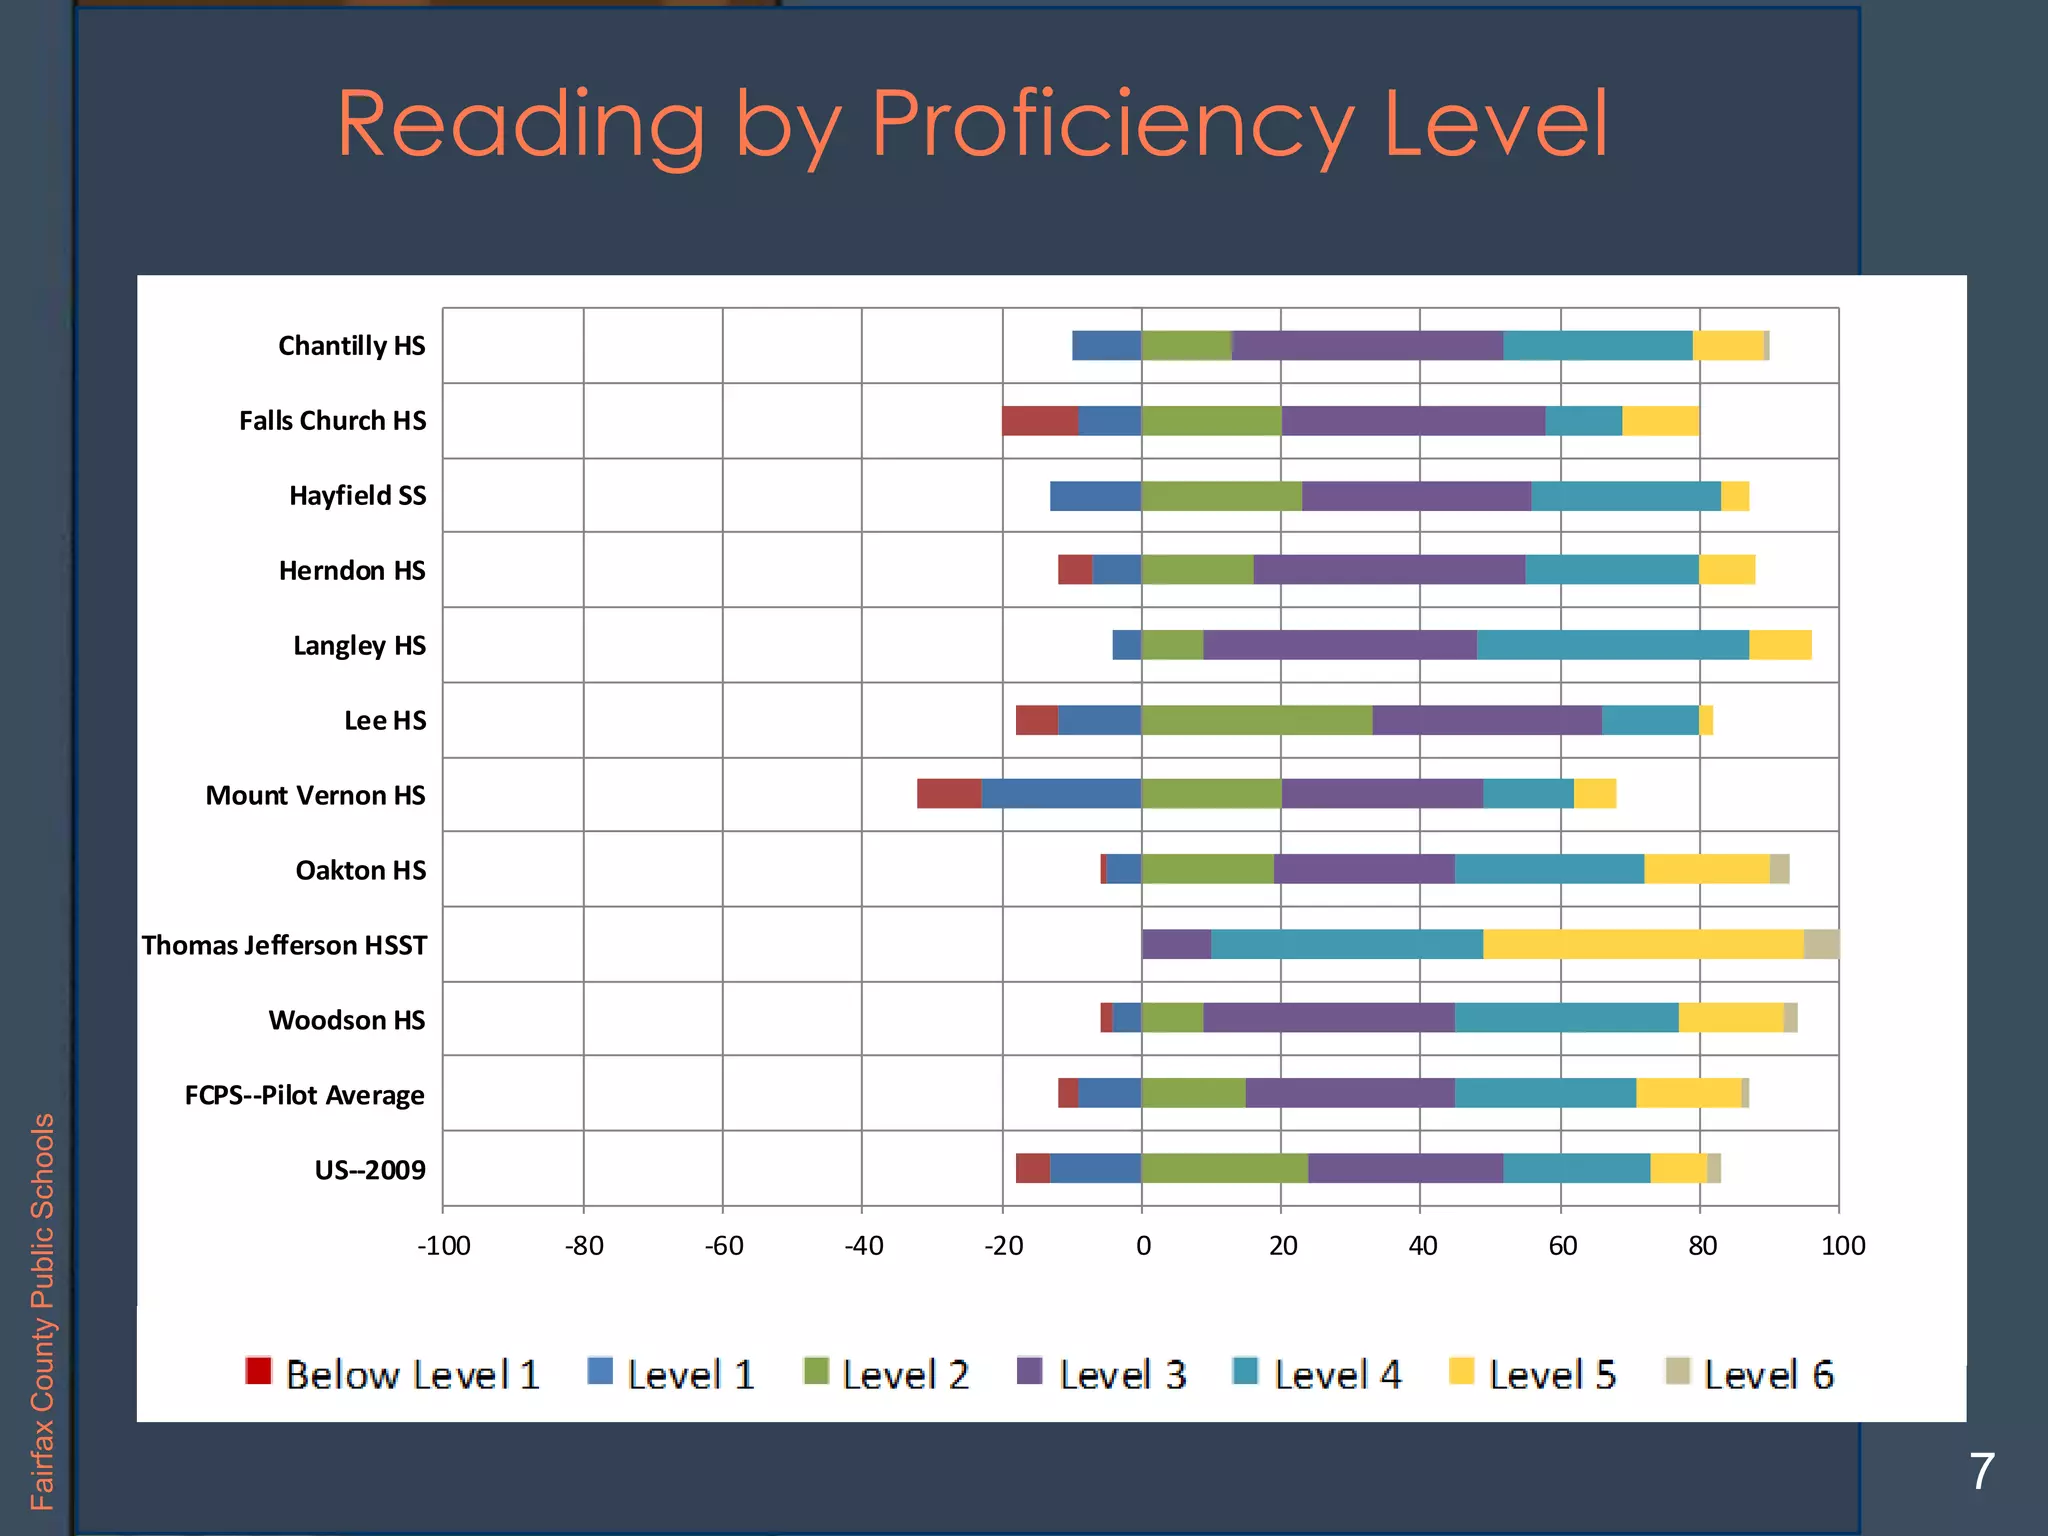
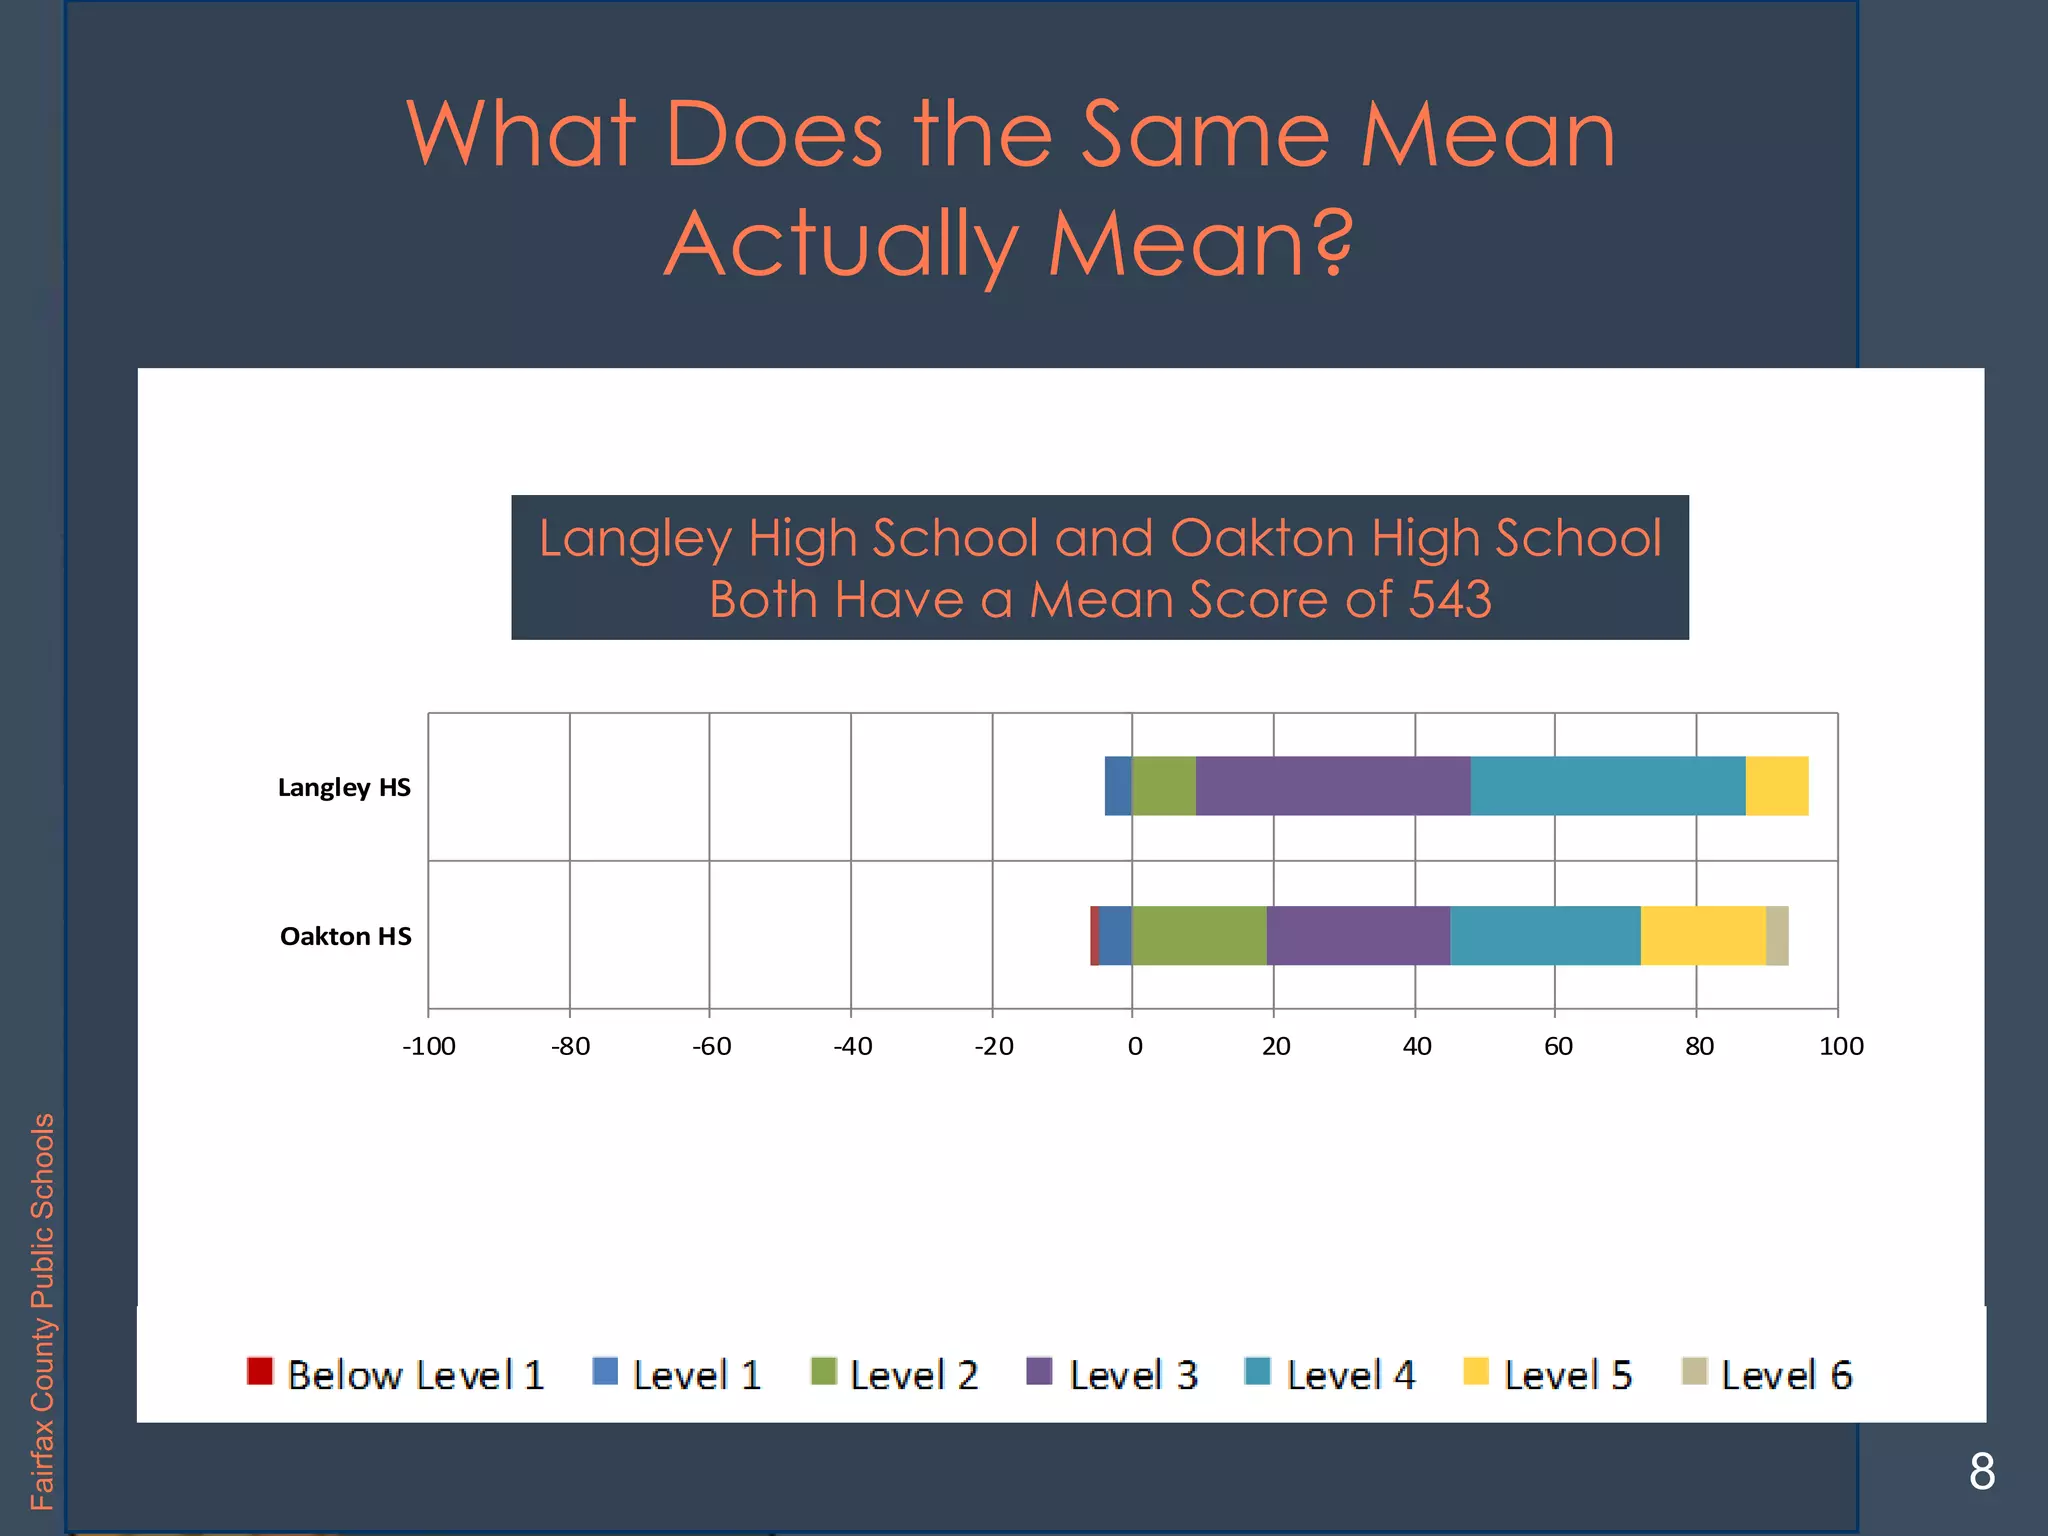


The document summarizes the results of an OECD Test for Schools Pilot administered in Fairfax County Public Schools (FCPS). It provides the following key details: - The pilot involved 10 FCPS schools and tested 7,400 students on reading, math and science. It also included questionnaires about classroom management and teacher relationships. - The document shows FCPS school performance compared to US and international averages, with some FCPS schools performing above average. It also examines student self-efficacy and teacher-student relationships. - Next steps proposed for FCPS include networking with other participating US schools, sharing results more broadly, and examining policies to support best learning conditions.


