COMP-7150-002 Fundamentals ofData Science Fall
Term 2023
Heart Disease Prediction using machine learning
algorithms.
Instructor: Salim Sazzed
Himasri Kowluri(U00886709)
Prem Kumar Cheeepurpalli(U00857844)
Sai Saranya Bathula(U00885943)
DATE: -12/10/2023
Abstract
Our goal is to develop a machine learning model that can accurately
predict the presence or absence of heart disease based on the patient's
clinical and laboratory parameters. We will use various supervised
learning algorithms, such as logistic regression, decision trees, and
support vector machine, to build and evaluate the performance of our
model. We will also perform feature selection and data preprocessing
techniques to improve the accuracy and interpretability of our model.The
outcome of this project has the potential to be useful in the medical field,
as it can aid doctors in diagnosing heart disease early and taking
appropriate measures to prevent further damage to the heart. The use of
machine learning in healthcare is a rapidly growing field, and this project
can contribute to the development of more accurate and efficient
diagnostic tools for heart disease.
2.
Introduction
Heart disease, alsoknown as cardiovascular disease, refers to a
range of conditions that affect the heart and blood vessels. It is a leading
cause of death worldwide, with an estimated 17.9 million deaths each
year, according to the World Health Organization.There are many
different types of heart disease, including coronary artery disease, heart
failure, and arrhythmias. These conditions can be caused by a variety of
factors, including high blood pressure, high cholesterol, smoking, obesity,
diabetes, and a family history of heart disease.In the United States, heart
disease is the leading cause of death for both men and women, accounting
for around 1 in every 4 deaths. It is also a major cause of disability and
can have a significant impact on quality of life.Fortunately, many cases of
heart disease can be prevented or treated with lifestyle changes and/or
medication. This makes early detection and diagnosis crucial for
improving outcomes and reducing the risk of complications.In this
project, we will use classification analysis in R to build a model for
detecting heart disease. We will use a dataset containing various clinical
and demographic features to train and test our model, with the goal of
accurately predicting the presence or absence of heart disease.
Data Collection:
Dataset link - https://ieee-dataport.org/open-access/heart-disease-dataset-comprehensive
This heart disease dataset is curated by combining 5 popular heart
disease datasets already available independently but not combined before.
In this dataset, 5 heart datasets are combined over 11 common features
which makes it the largest heart disease dataset available so far for
research purposes. This dataset consists of 1190 instances with 11features.
3.
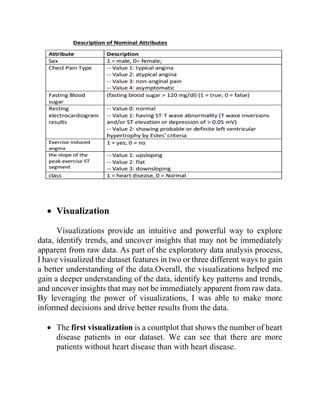
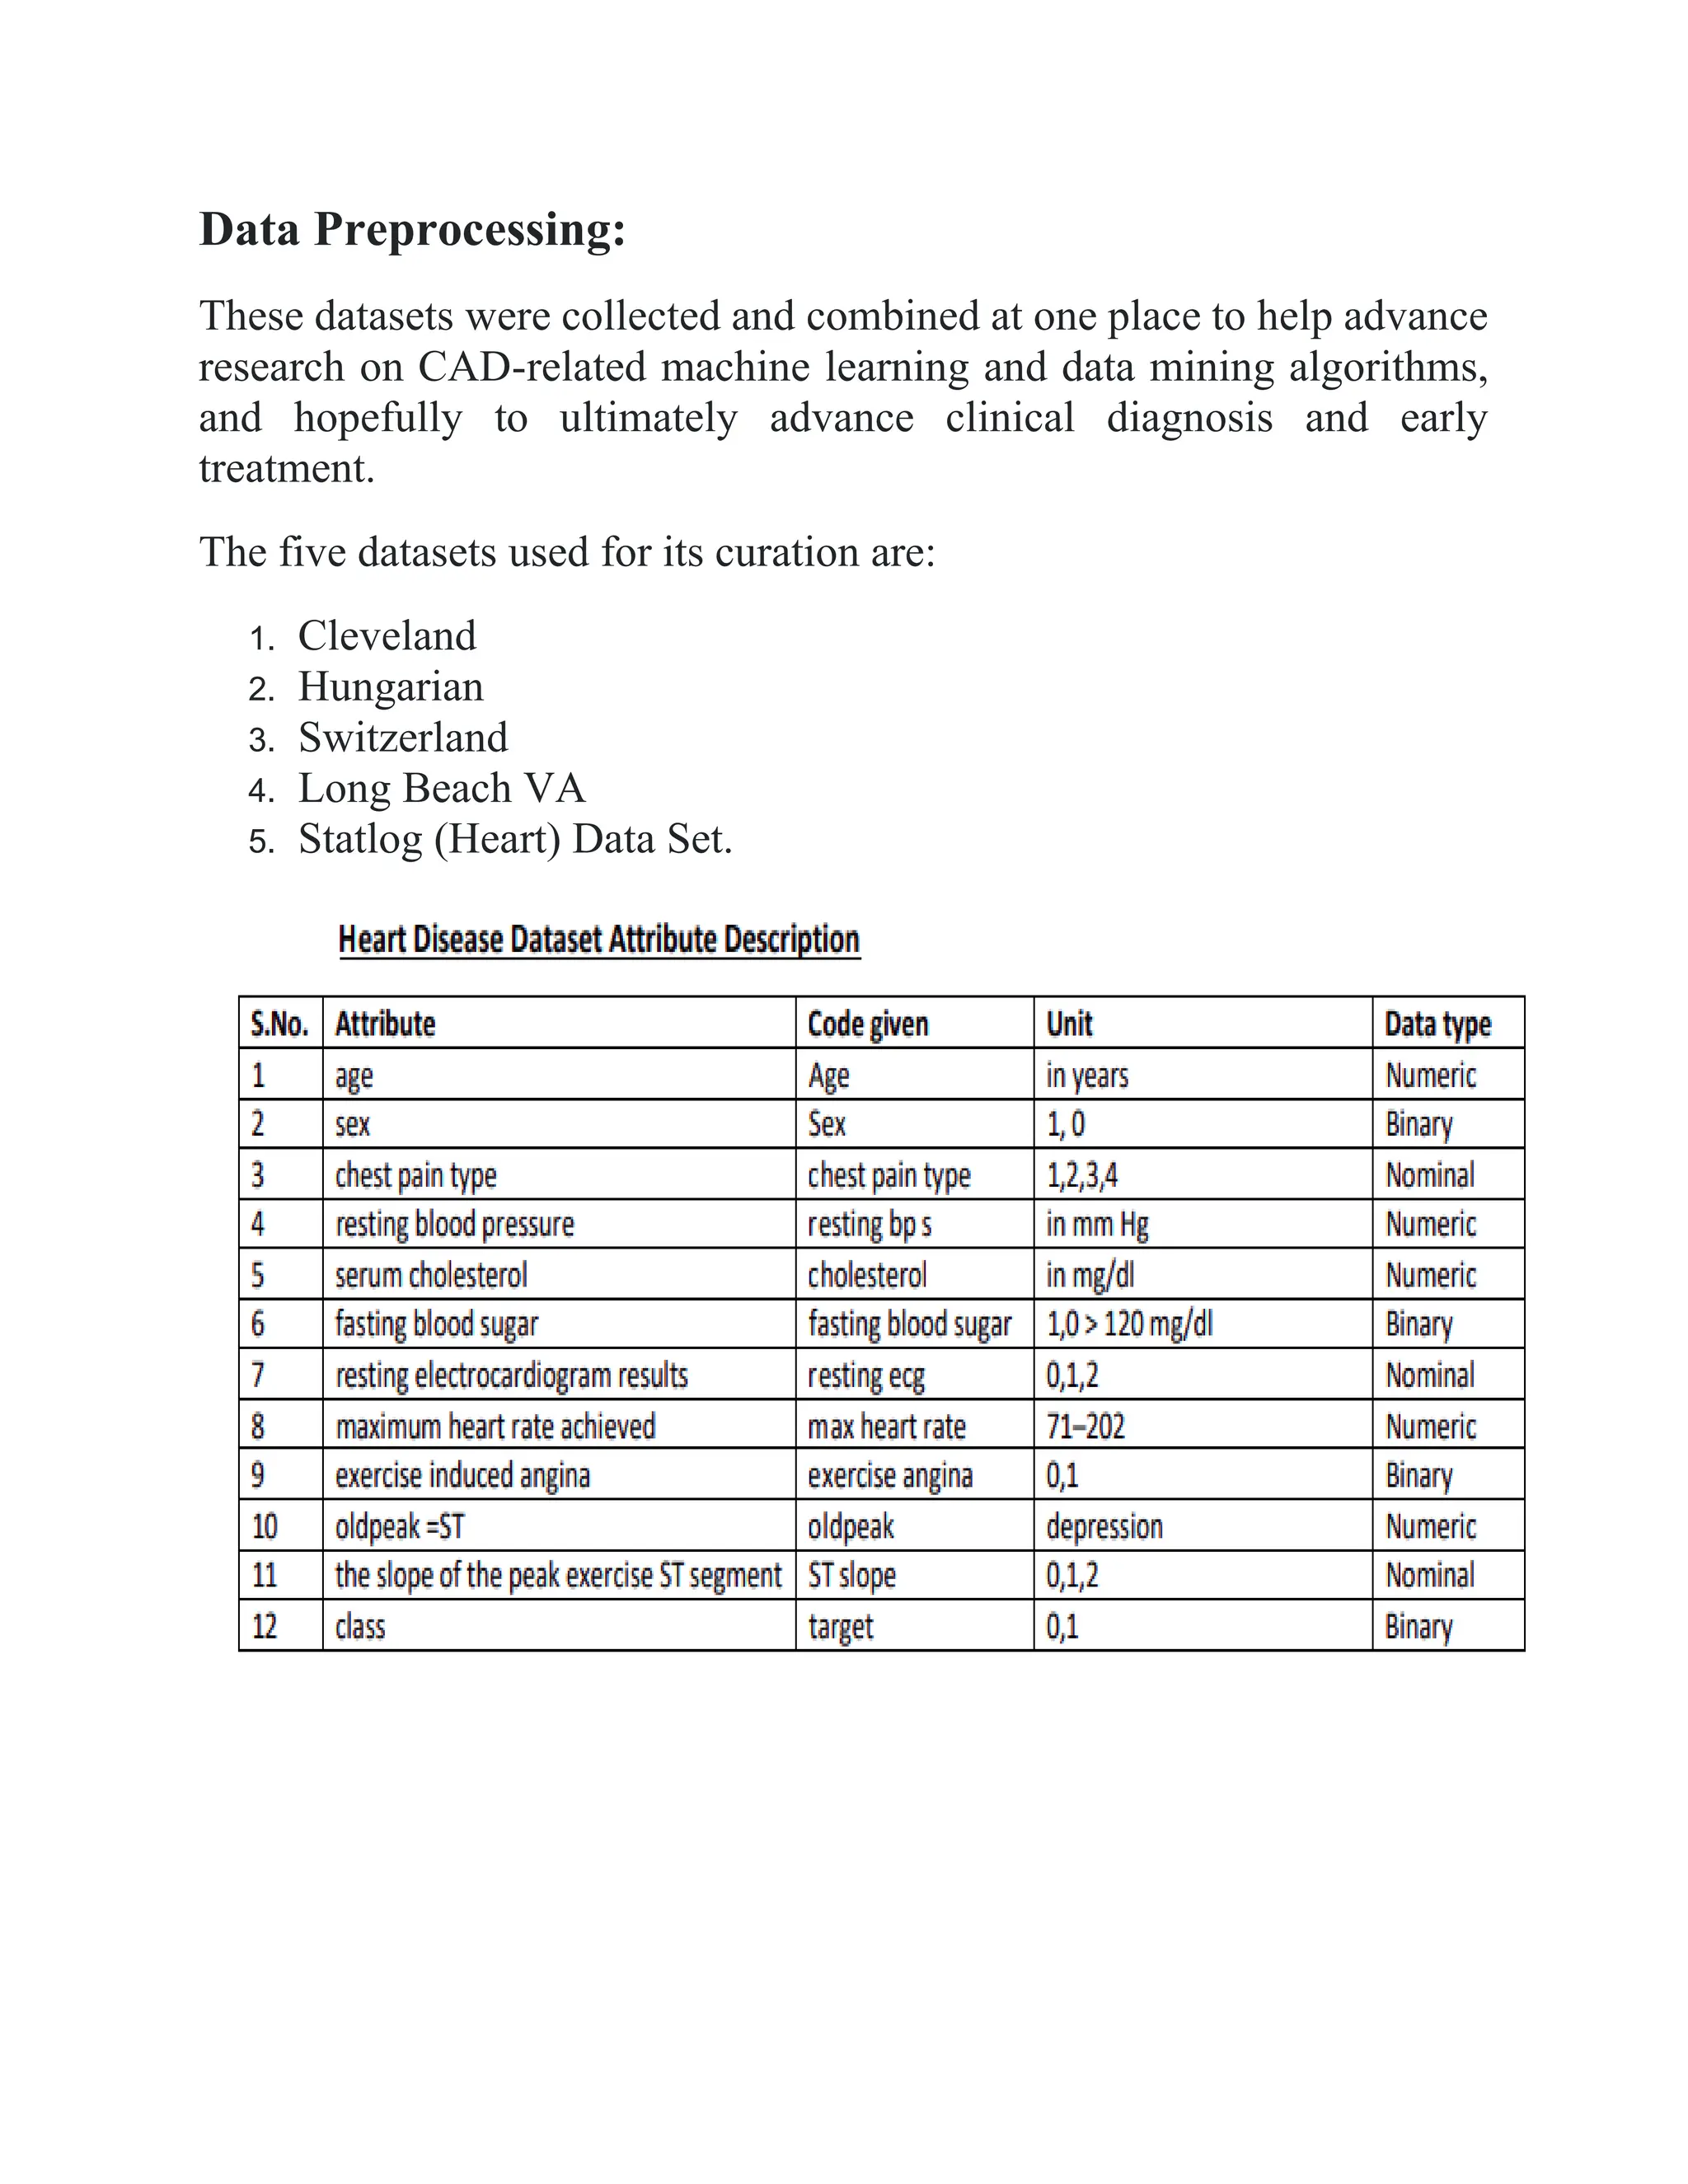
Data Preprocessing:
These datasetswere collected and combined at one place to help advance
research on CAD-related machine learning and data mining algorithms,
and hopefully to ultimately advance clinical diagnosis and early
treatment.
The five datasets used for its curation are:
1. Cleveland
2. Hungarian
3. Switzerland
4. Long Beach VA
5. Statlog (Heart) Data Set.
4.
• Visualization
Visualizations providean intuitive and powerful way to explore
data, identify trends, and uncover insights that may not be immediately
apparent from raw data. As part of the exploratory data analysis process,
I have visualized the dataset features in two or three different ways to gain
a better understanding of the data.Overall, the visualizations helped me
gain a deeper understanding of the data, identify key patterns and trends,
and uncover insights that may not be immediately apparent from raw data.
By leveraging the power of visualizations, I was able to make more
informed decisions and drive better results from the data.
• The first visualization is a countplot that shows the number of heart
disease patients in our dataset. We can see that there are more
patients without heart disease than with heart disease.
5.
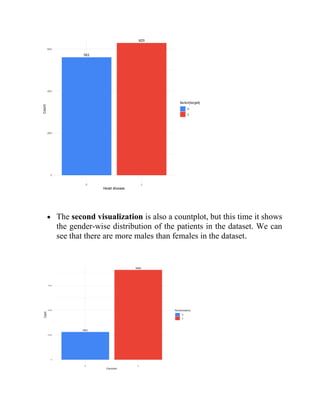
• The secondvisualization is also a countplot, but this time it shows
the gender-wise distribution of the patients in the dataset. We can
see that there are more males than females in the dataset.
6.
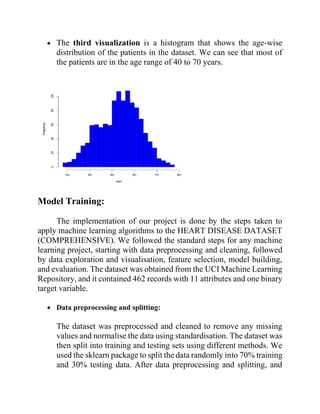
• The thirdvisualization is a histogram that shows the age-wise
distribution of the patients in the dataset. We can see that most of
the patients are in the age range of 40 to 70 years.
Model Training:
The implementation of our project is done by the steps taken to
apply machine learning algorithms to the HEART DISEASE DATASET
(COMPREHENSIVE). We followed the standard steps for any machine
learning project, starting with data preprocessing and cleaning, followed
by data exploration and visualisation, feature selection, model building,
and evaluation. The dataset was obtained from the UCI Machine Learning
Repository, and it contained 462 records with 11 attributes and one binary
target variable.
• Data preprocessing and splitting:
The dataset was preprocessed and cleaned to remove any missing
values and normalise the data using standardisation. The dataset was
then split into training and testing sets using different methods. We
used the sklearn package to split the data randomly into 70% training
and 30% testing data. After data preprocessing and splitting, and
7.
then we proceededwith model building for logistic regression,
SVM, and decision trees.
Model building :
The three different classification algorithms to predict the presence
or absence of heart disease in patients: logistic regression, support
vector machines, and decision trees. Each of these algorithms has its
own strengths and weaknesses, which can affect their accuracy and
overall performance.
• Logistic regression is a popular algorithm that is widely used in
binary classification problems. It models the probability of the
dependent variable (in our case, the presence or absence of heart
disease) based on one or more independent variables (risk factors
such as age, gender, cholesterol level, etc.). Logistic regression is a
simple yet powerful algorithm that is easy to interpret and can
handle both linear and nonlinear relationships between the
independent variables and the dependent variable. However, logistic
regression assumes that the relationship between the independent
variables and the dependent variable is linear, which may not always
be the case in real-world problems. It also assumes that the data is
free from multicollinearity and outliers, which can affect its
performance.
• Support vector machines (SVMs) are another popular algorithm
used for classification problems. SVMs work by finding the
hyperplane that maximizes the margin between the two classes
(presence and absence of heart disease). SVMs are powerful
algorithms that can handle both linear and nonlinear relationships
between the independent variables and the dependent variable. They
can also handle high-dimensional data and are less affected by
outliers and noise in the data. However, SVMs can be
computationally expensive and may require a large amount of
memory to train on large datasets.
8.
• Decision treesare a simple yet powerful algorithm that is widely
used for classification problems. Decision trees work by recursively
partitioning the data based on the values of the independent
variables. They are easy to interpret and can handle both linear and
nonlinear relationships between the independent variables and the
dependent variable. Decision trees can also handle missing data and
outliers in the data. However, decision trees can be prone to
overfitting the data, especially if the tree is too complex.
In our study, we evaluated the performance of these algorithms using the
confusion matrix and classification report. The confusion matrix is a table
that summarizes the performance of the classification algorithm by
comparing the predicted labels to the true labels in the test set. It has four
entries: true positives (TP), true negatives (TN), false positives (FP), and
false negatives (FN). The classification report provides more detailed
metrics such as precision, recall, F1-score, and support.
Accuracy is one of the most commonly used metrics for evaluating the
performance of classification algorithms. It measures the proportion of
correctly classified instances out of the total number of instances. It is
calculated by dividing the number of correctly classified instances by the
total number of instances in the test set.
Accuracy = (Number of correctly classified instances) / (Total number of
instances)
Precision is the proportion of true positives (correctly predicted positive
instances) out of the total number of positive predictions. Recall is the
proportion of true positives out of the total number of actual positives in
the test set. F1-score is the harmonic mean of precision and recall, which
provides a balanced measure of the algorithm's performance. Support is
the number of instances in the test set for each class. In summary,
accuracy is an important metric for evaluating classification algorithms,
but it should be used in conjunction with other metrics such as precision,
recall, and F1-score to provide a more comprehensive evaluation of the
9.
algorithm's performance.
Model Evaluation:
To evaluate the models, we used the confusion matrix and classification
report. The confusion matrix is a table that summarizes the performance
of a classification model by comparing the predicted and actual values. It
shows the number of true positives (TP), true negatives (TN), false
positives (FP), and false negatives (FN) predictions. Based on these
values, several evaluation metrics can be calculated, such as accuracy,
precision, recall, and F1 score.
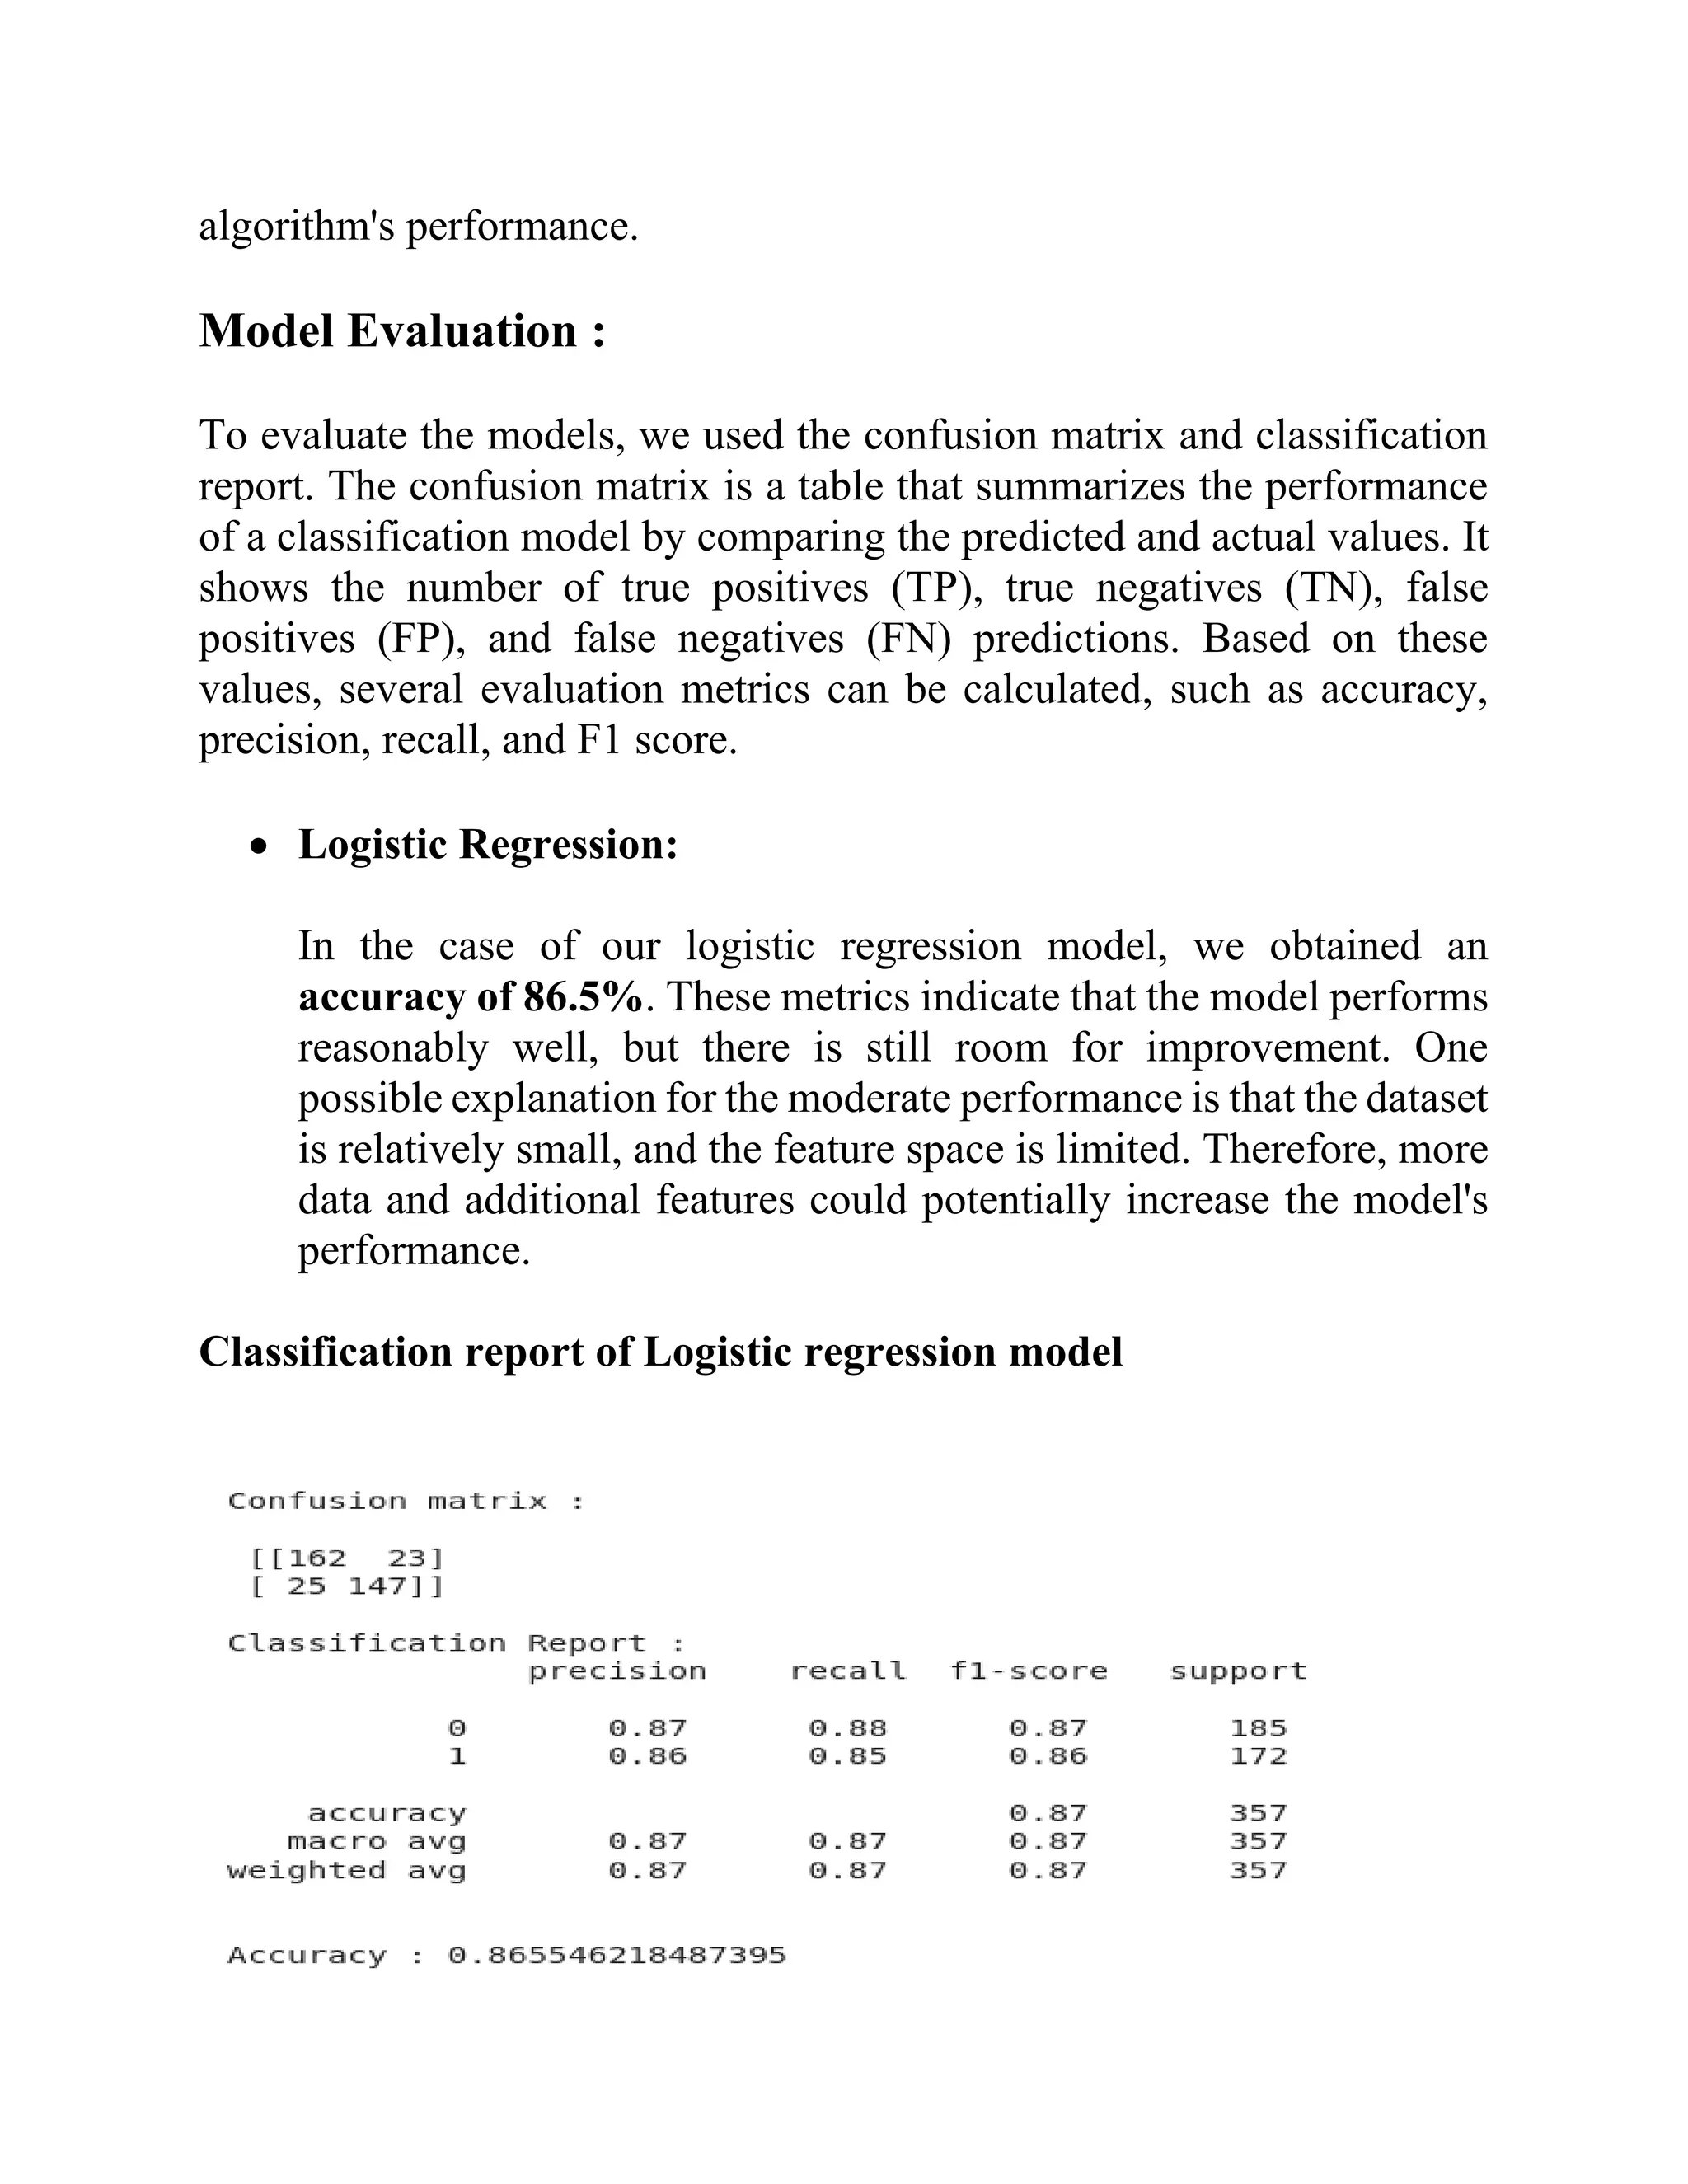
• Logistic Regression:
In the case of our logistic regression model, we obtained an
accuracy of 86.5%. These metrics indicate that the model performs
reasonably well, but there is still room for improvement. One
possible explanation for the moderate performance is that the dataset
is relatively small, and the feature space is limited. Therefore, more
data and additional features could potentially increase the model's
performance.
Classification report of Logistic regression model
10.
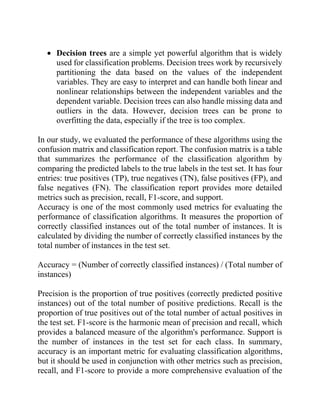
• Decision Tree
Forthe decision tree model, we obtained an accuracy of 84.03% and
a precision of 84.03%. The recall and F1 score were 84.03% and
84.03%, respectively. These metrics indicate that the decision tree
model has the lowest performance among the three models. One
possible reason for this is that the decision tree model is prone to
overfitting, especially when dealing with high-dimensional data.
Therefore, additional techniques, such as pruning and ensemble
learning, could be used to improve the model's performance.
Classification report of Decision Tree model
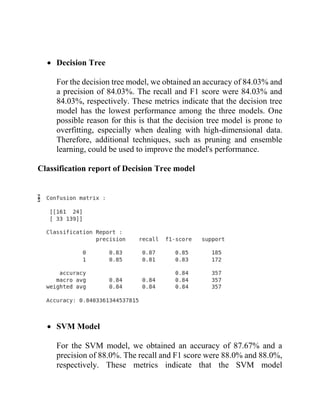
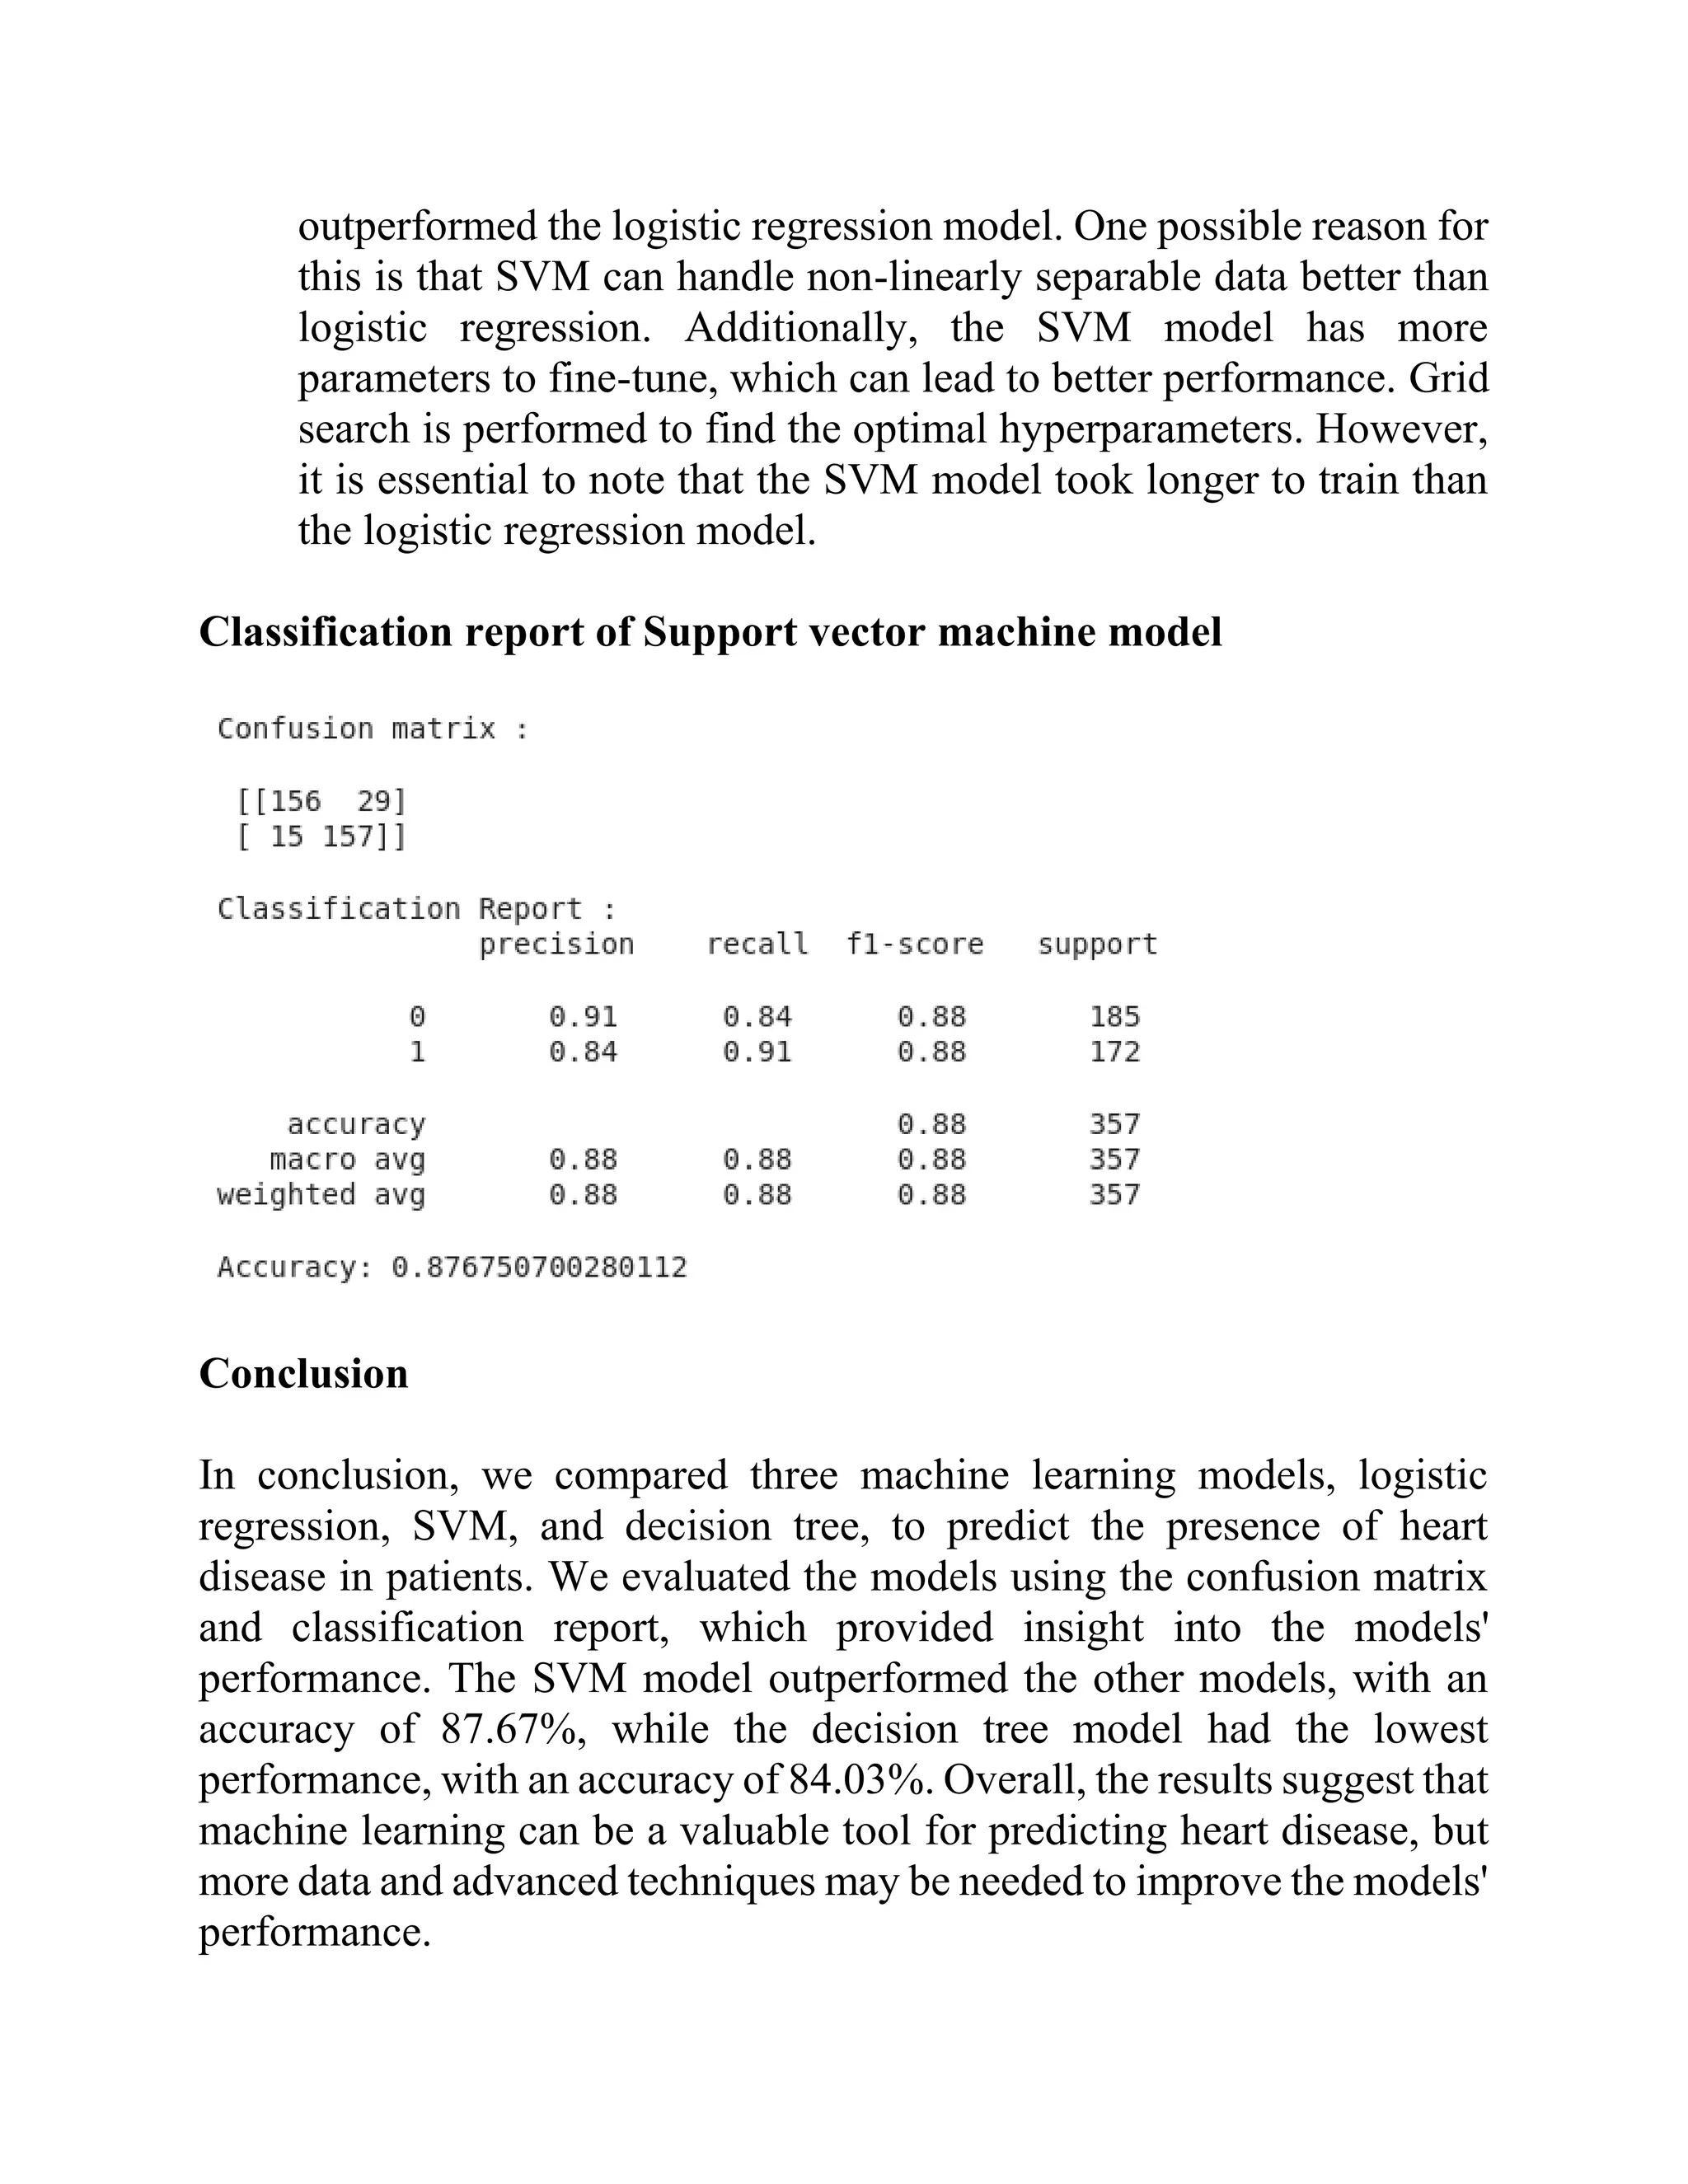
• SVM Model
For the SVM model, we obtained an accuracy of 87.67% and a
precision of 88.0%. The recall and F1 score were 88.0% and 88.0%,
respectively. These metrics indicate that the SVM model
11.
outperformed the logisticregression model. One possible reason for
this is that SVM can handle non-linearly separable data better than
logistic regression. Additionally, the SVM model has more
parameters to fine-tune, which can lead to better performance. Grid
search is performed to find the optimal hyperparameters. However,
it is essential to note that the SVM model took longer to train than
the logistic regression model.
Classification report of Support vector machine model
Conclusion
In conclusion, we compared three machine learning models, logistic
regression, SVM, and decision tree, to predict the presence of heart
disease in patients. We evaluated the models using the confusion matrix
and classification report, which provided insight into the models'
performance. The SVM model outperformed the other models, with an
accuracy of 87.67%, while the decision tree model had the lowest
performance, with an accuracy of 84.03%. Overall, the results suggest that
machine learning can be a valuable tool for predicting heart disease, but
more data and advanced techniques may be needed to improve the models'
performance.


![PPT-HEART-DISEASE[1].pptx presentationss](https://cdn.slidesharecdn.com/ss_thumbnails/ppt-heart-disease1-250901140846-bb7a7155-thumbnail.jpg?width=600ounds&width=560&fit=bounds)


