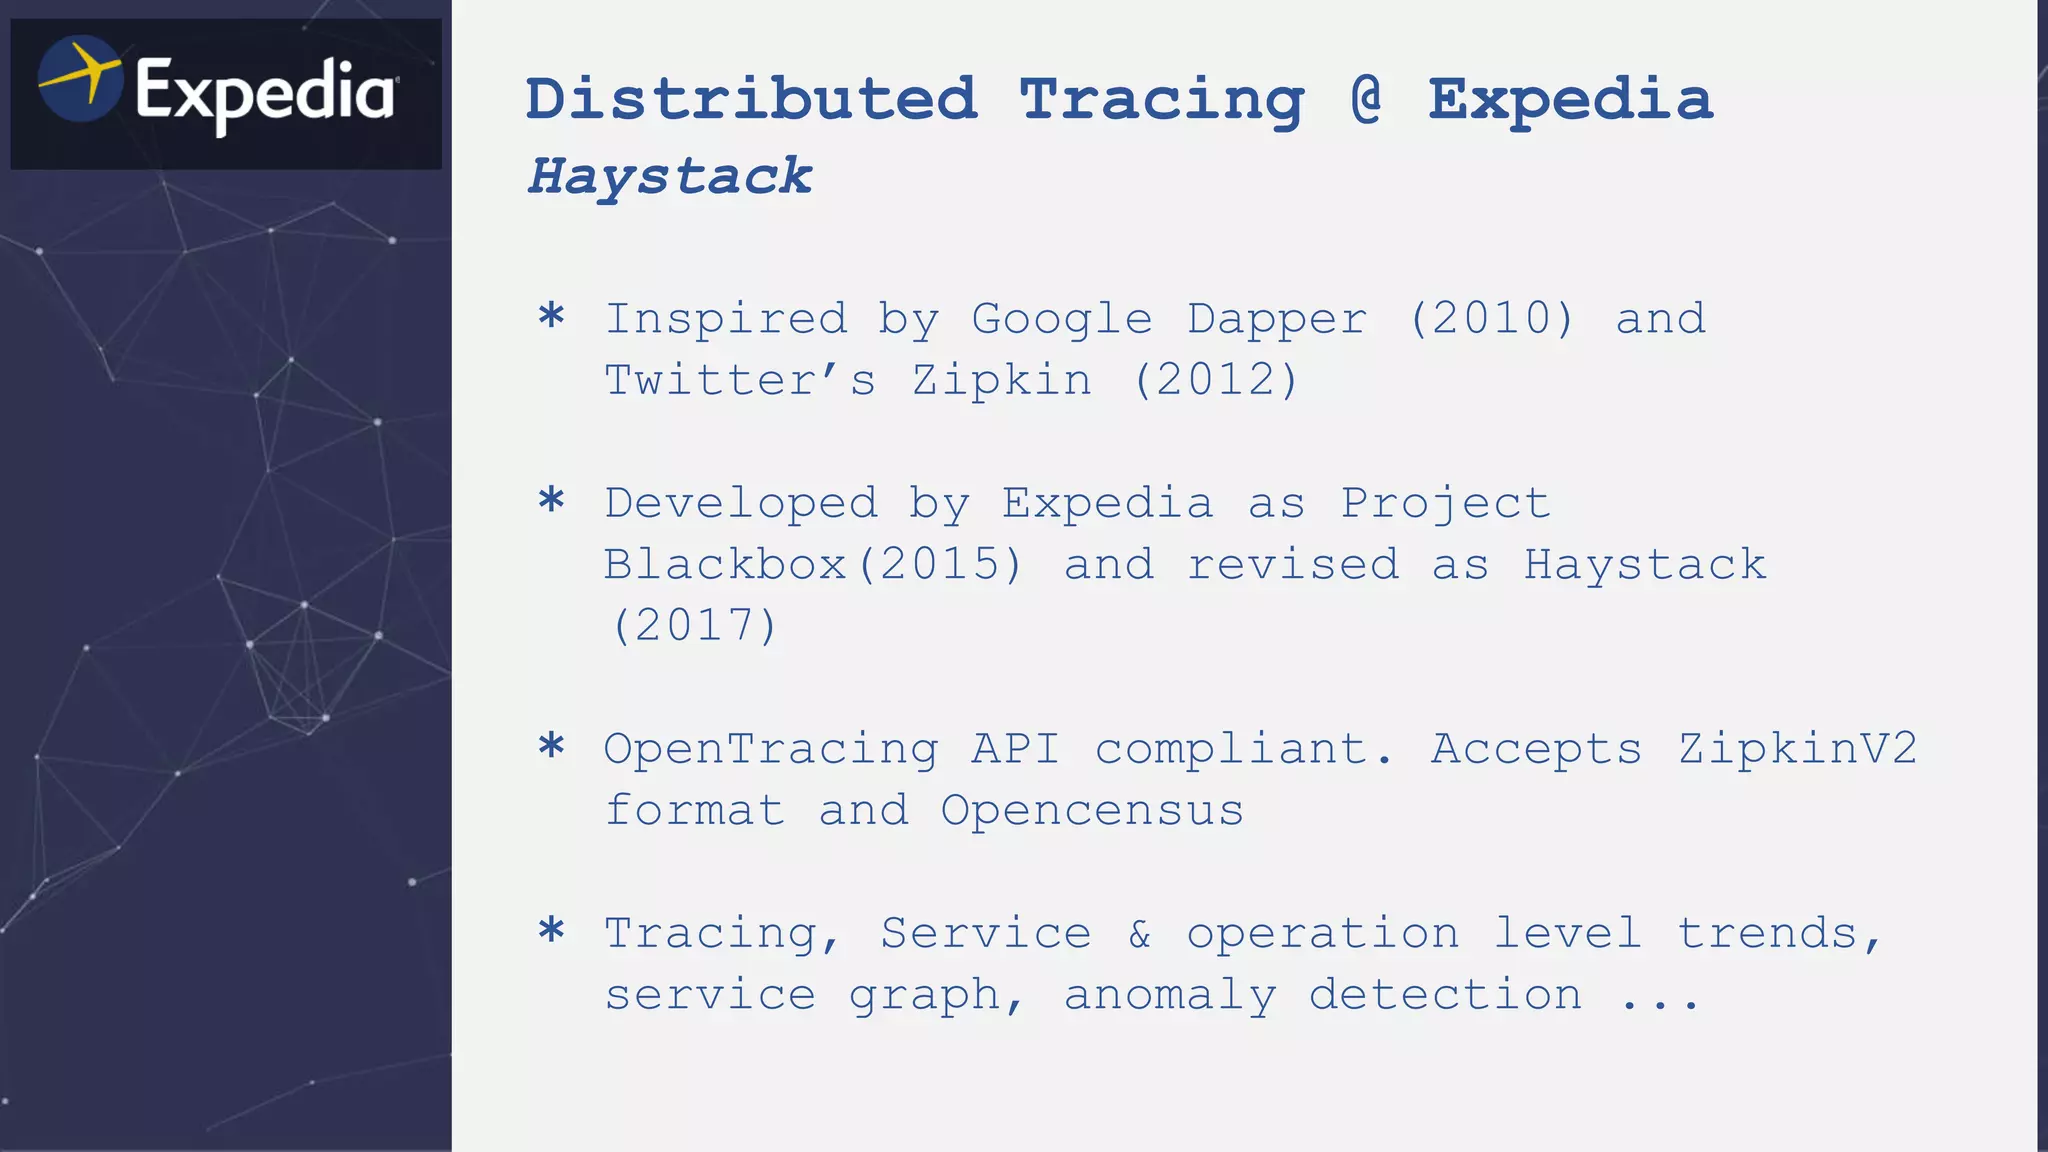
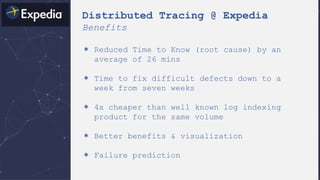
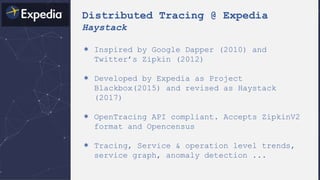
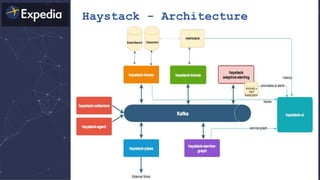
The document discusses distributed tracing and how it helps with observability in distributed systems. It provides an overview of Haystack, Expedia's open source distributed tracing system. Haystack uses distributed tracing to track requests across multiple services to identify failures, bottlenecks, and root causes. It provides visualizations of traces, metrics, service graphs and alerts. The document outlines benefits like reduced mean time to identify issues and lower costs compared to log indexing.


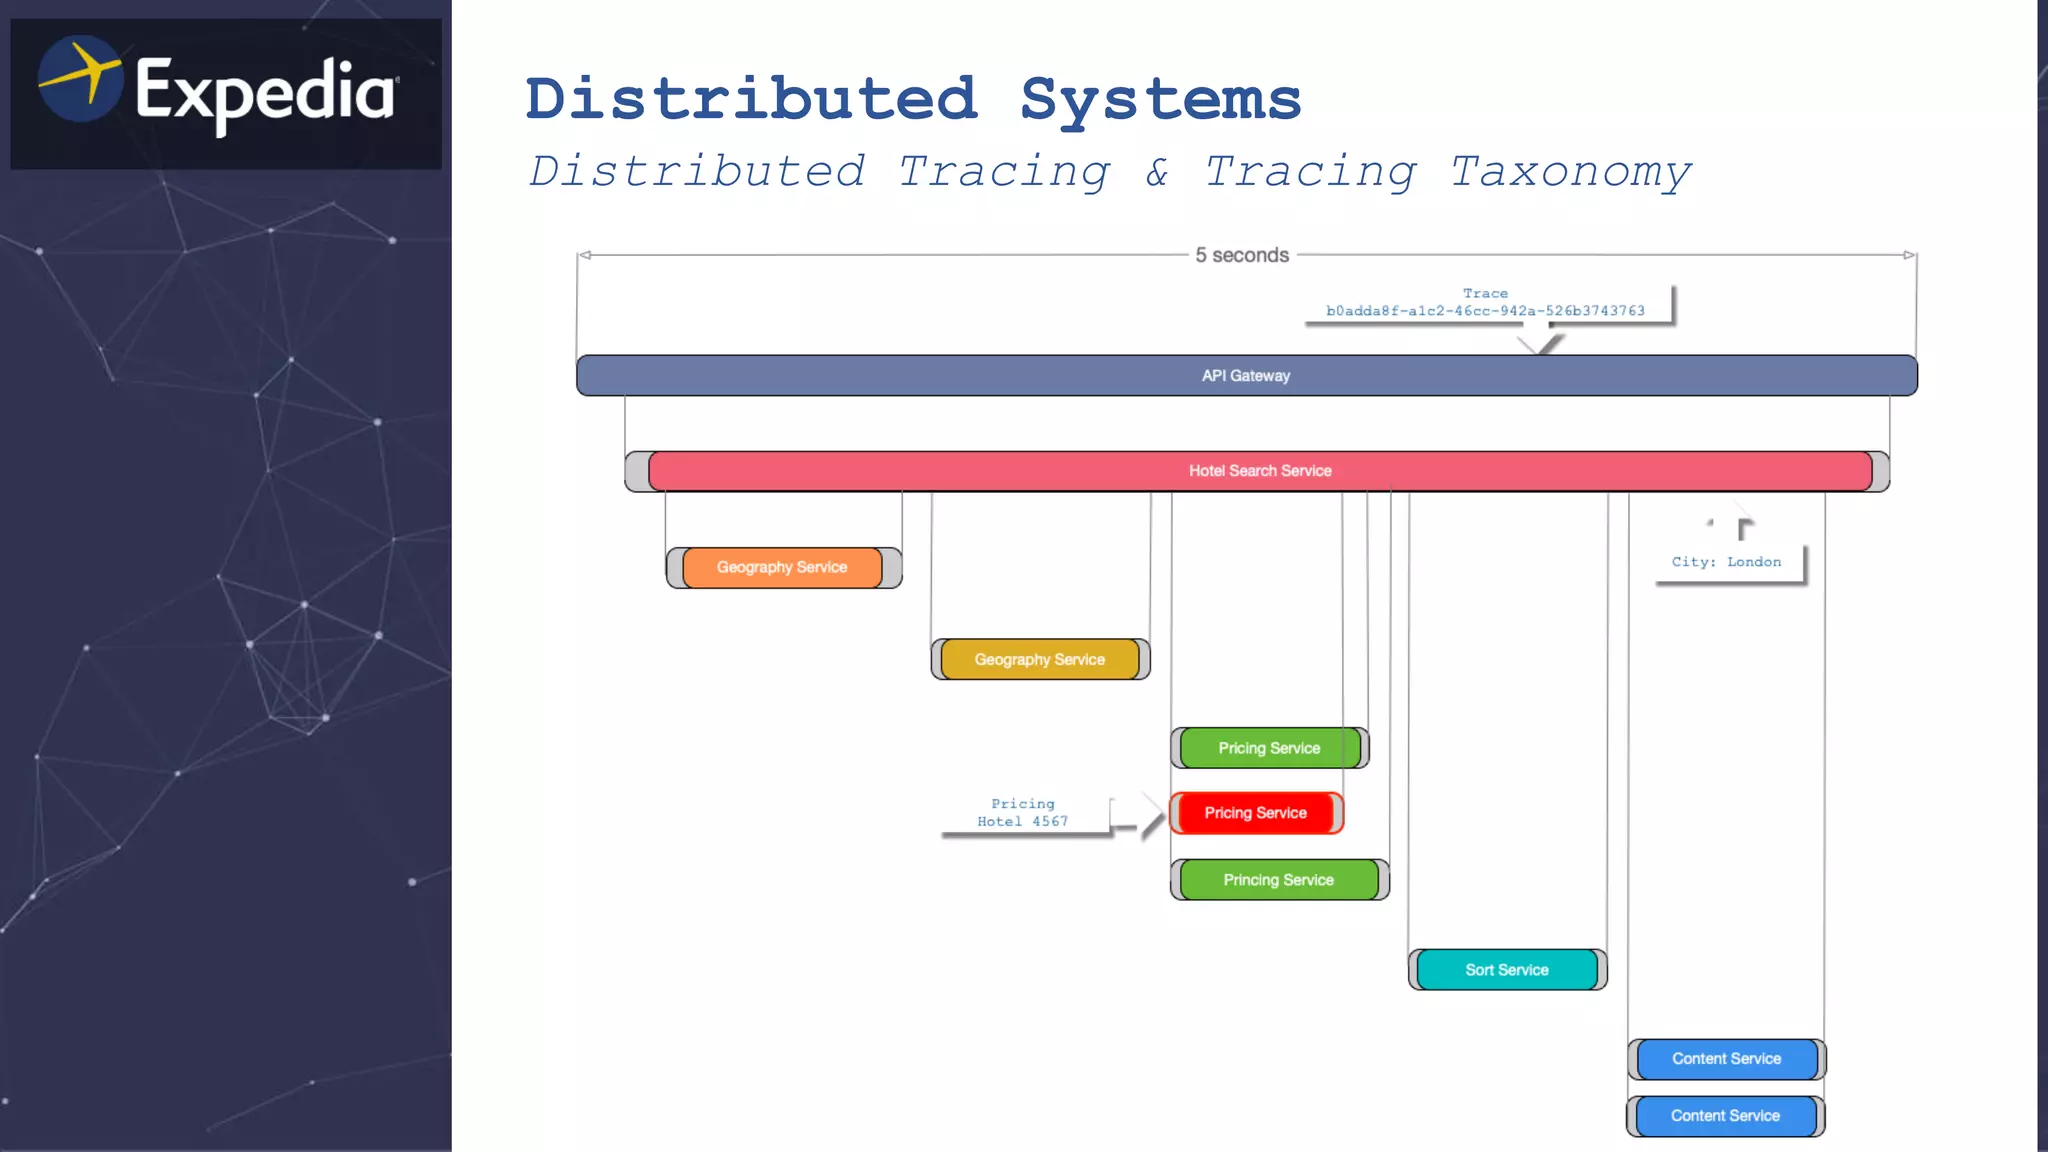
![Distributed Systems
Analyzing (distributed) Logs
[03/Mar/2019 21:49:50 +0000] “GET /search/hotels?city=London HTTP/1.1” 200 …”
[03/Mar/2019 21:49:50 +0000] “GET /geography/polygon?city=Seattle HTTP/1.1” 200 … ”
[03/Mar/2019 21:49:50 +0000] “GET /inventory/hotels?latlong=... HTTP/1.1” 200 … ”
[03/Mar/2019 21:49:50 +0000] “GET /price/hotel/1234 HTTP/1.1” 200 … ”
[03/Mar/2019 21:49:50 +0000] “GET /geography/polygon?city=London HTTP/1.1” 200 …”
[03/Mar/2019 21:49:50 +0000] “GET /inventory/hotels?latlong= HTTP/1.1” 200 … ”
[03/Mar/2019 21:49:50 +0000] “GET /price/hotel/4567 HTTP/1.1” 500 … ”
[03/Mar/2019 21:49:50 +0000] “GET /price/hotel/1379 HTTP/1.1” 200 …”
[03/Mar/2019 21:49:50 +0000] “POST /sort HTTP/1.1” 500 … ”
[03/Mar/2019 21:49:50 +0000] “GET /price/hotel/2468 HTTP/1.1” 200 …”
[03/Mar/2019 21:49:50 +0000] “POST /sort HTTP/1.1” 200 … ”
[03/Mar/2019 21:49:50 +0000] “GET /price/hotel/2580 HTTP/1.1” 200 …”](https://image.slidesharecdn.com/haystack-powerpoint-190417111136/85/Haystack-Distributed-Tracing-6-320.jpg)


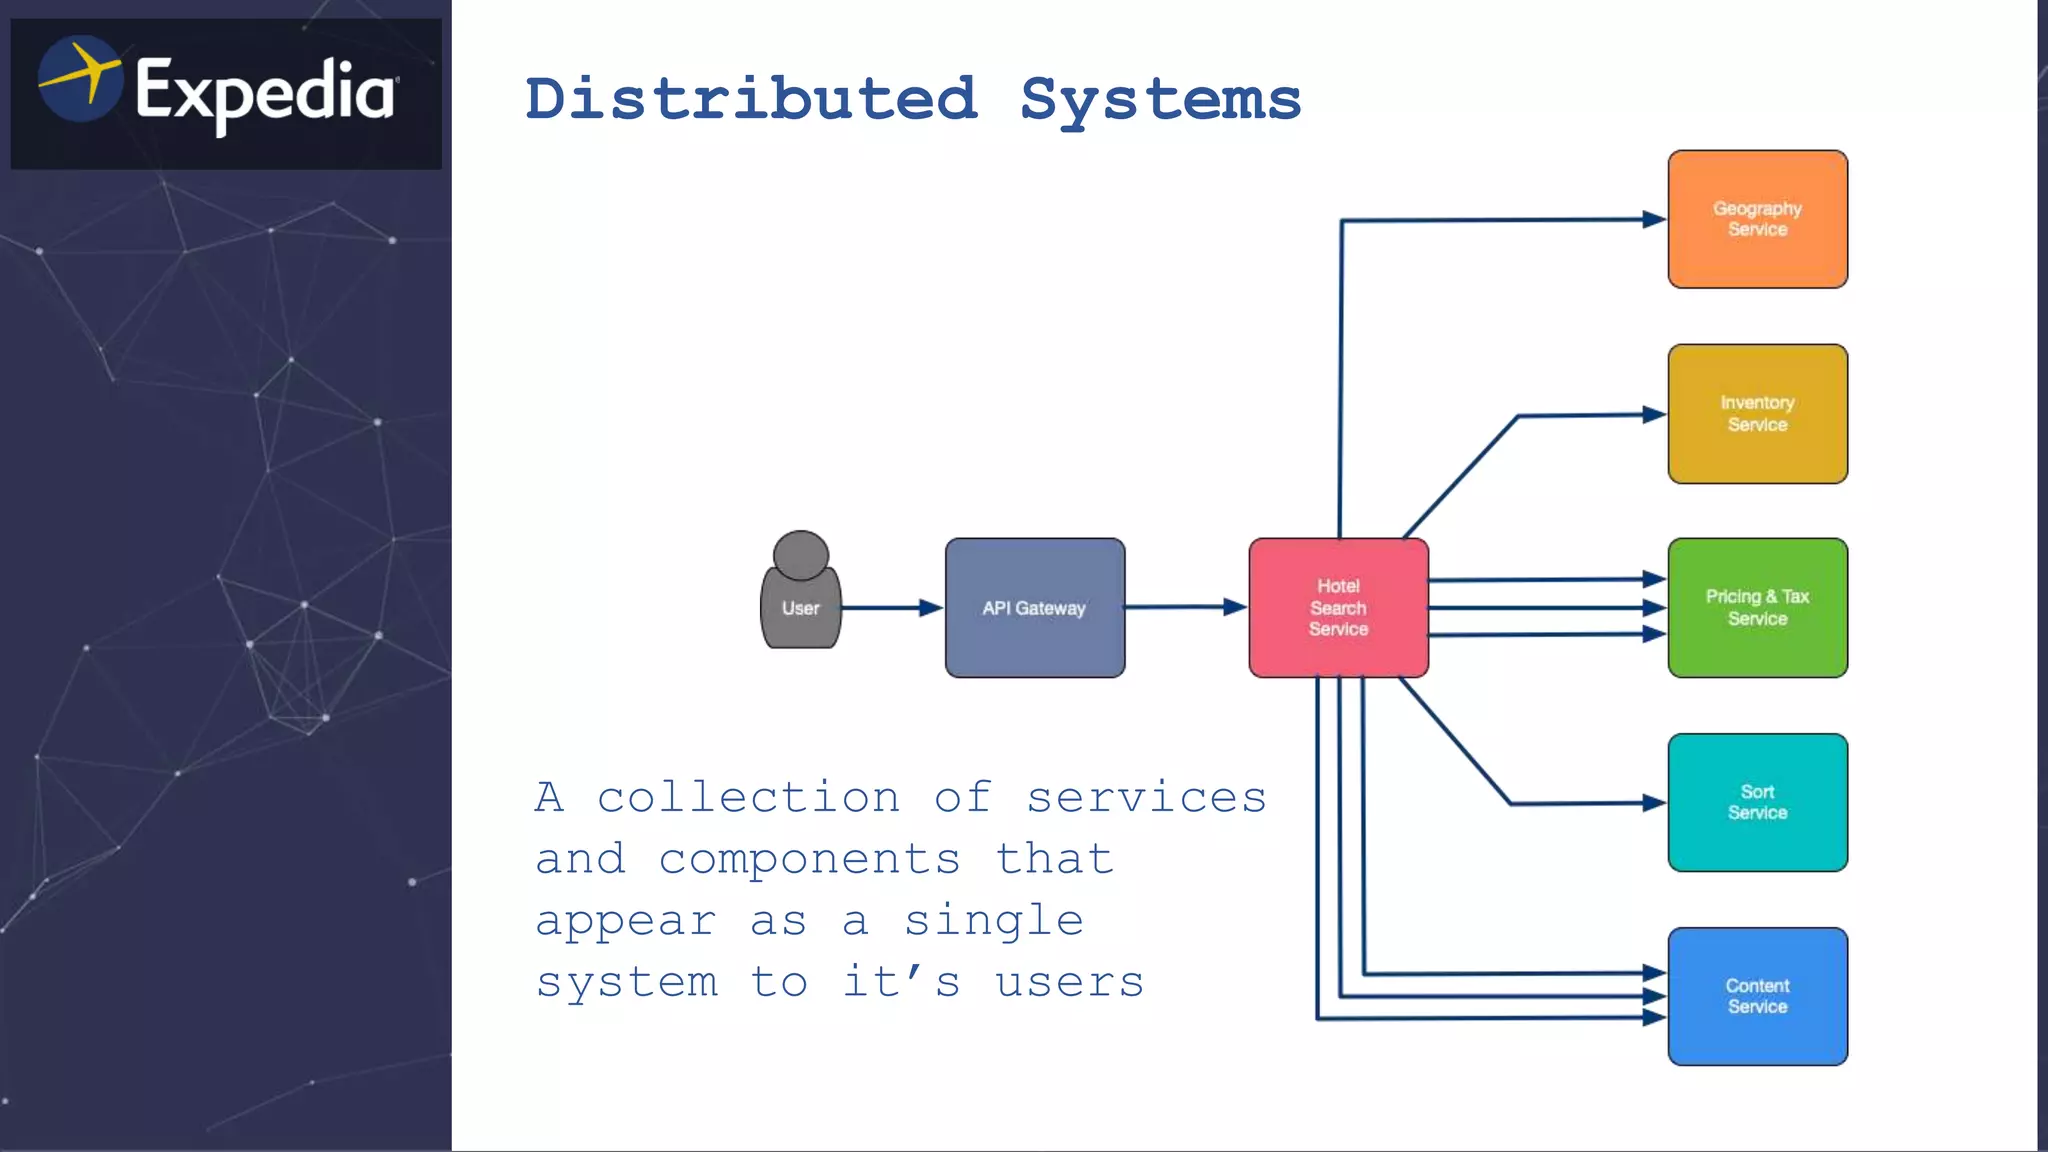

![Distributed Systems
Analyzing (distributed) Logs
[03/Mar/2019 21:49:50 +0000] “GET /search/hotels?city=London HTTP/1.1” 200 …”
[03/Mar/2019 21:49:50 +0000] “GET /geography/polygon?city=Seattle HTTP/1.1” 200 … ”
[03/Mar/2019 21:49:50 +0000] “GET /inventory/hotels?latlong=... HTTP/1.1” 200 … ”
[03/Mar/2019 21:49:50 +0000] “GET /price/hotel/1234 HTTP/1.1” 200 … ”
[03/Mar/2019 21:49:50 +0000] “GET /geography/polygon?city=London HTTP/1.1” 200 …”
[03/Mar/2019 21:49:50 +0000] “GET /inventory/hotels?latlong= HTTP/1.1” 200 … ”
[03/Mar/2019 21:49:50 +0000] “GET /price/hotel/4567 HTTP/1.1” 500 … ”
[03/Mar/2019 21:49:50 +0000] “GET /price/hotel/1379 HTTP/1.1” 200 …”
[03/Mar/2019 21:49:50 +0000] “POST /sort HTTP/1.1” 500 … ”
[03/Mar/2019 21:49:50 +0000] “GET /price/hotel/2468 HTTP/1.1” 200 …”
[03/Mar/2019 21:49:50 +0000] “POST /sort HTTP/1.1” 200 … ”
[03/Mar/2019 21:49:50 +0000] “GET /price/hotel/2580 HTTP/1.1” 200 …”](https://image.slidesharecdn.com/haystack-powerpoint-190417111136/75/Haystack-Distributed-Tracing-6-2048.jpg)