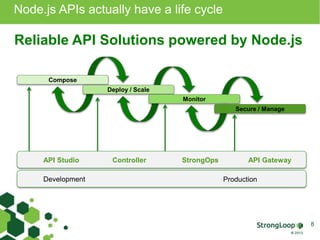
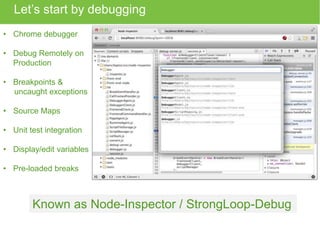
KEMBAR78
Html5 devconf nodejs_devops_shubhra | PPTX
Triage, Diagnose & Scale Node.js 
Shubhra Kar | Director – Products 
twitter:@shubhrakar mail:skar@strongloop.com
Why am I here…or rather who sent me here ?
Node Core 
Bert 
Belder 
Ben 
Noordhuis 
These guys sent me ! 
LoopBack/Express Core 
Raymond 
Feng 
Ritchie 
Martori 
Sam 
Roberts 
Miroslav 
Bajtos 
Ryan 
Graham
To do what ? 
To give you a fresh pair of gloves
Let’s revisit the STORY 
Let’s touch up our 
SOA for 
Mobile…and bring 
Glass @ work 
Architect Developer
The boss does have valid questions  
I recommend 
Node.js for our 
API strategy 
Node is nerdy like systems 
programming !...Where are 
tools ? Do we have an IDE ? 
Architect The Boss
Node.js APIs actually have a life cycle 
8 
Reliable API Solutions powered by Node.js 
Compose 
Deploy / Scale 
Monitor 
Secure / Manage 
API Studio Controller StrongOps API Gateway 
Development Production
Let’s start by debugging 
• Chrome debugger 
• Debug Remotely on 
Production 
• Breakpoints & 
uncaught exceptions 
• Source Maps 
• Unit test integration 
• Display/edit variables 
• Pre-loaded breaks 
Known as Node-Inspector / StrongLoop-Debug
Debugging server side clustered apps 
Debugging single process 
slc debug app.js 
Debugging clustered process in V11 
slc debug app.js 
http://localhost:8080/debug?port=<5858+ID-of-process> 
Debugging clustered process in V10 
%node debug –p <PID> 
connecting…ok 
… 
debug>quit 
%node-inspector 
http://127.0.0.1:8080/debug?port =5858 
Or 
process._debugPort = 5858 + cluster.worker.id
Can Errors be stitched into a trace and recovered ? 
Enter StrongLoop / Zones
But is it enough to convince him ? 
Plus I can now 
diagnose CPU 
hotspots and Memory 
Bottlenecks 
Node is fast you said 
!...what bottlenecks and 
leaks ? 
Architect The Boss
How to diagnose CPU hotspots upto line of code ? 
Enter StrongLoop OSS - Node Profiler 
slc runctl cpu-start/stop PID >> CPU Proc files
Can I visually see my hotspots ? 
Chrome Dev Tools – For Server !
How about a fancy chart for my boss ? 
Call Stack 
Path and 
function 
CPU Cycle 
times
Does Node have memory leaks ? 
StrongLoop OSS - HeapSnapshots 
slc runctl heap-snapshot PID
heapdump for V8 snapshots 
npm install heapdump 
Add to app : var heapdump = require(‘heapdump’) 
Method 1 : writeSnapshot 
var heapdump = require('heapdump') 
... 
heapdump.writeSnapshot() 
Method 2 : SIGUSR2 (Unix only) 
kill –USR2 <pid> 
Make sure your directory is writable 
process.chdir('/path/to/writeable/dir’)
Heap Snapshot strategies 
Programmatic heap snapshots (timer based) 
var heapdump = require('heapdump') 
... 
setInterval(function () { 
heapdump.writeSnapshot() 
}, 6000 * 30) <strong>(1)</strong> 
Programmatic heap snapshots (threshold based) 
var heapdump = require('heapdump') 
var nextMBThreshold = 0 <strong>(1)</strong> 
setInterval(function () { 
var memMB = process.memoryUsage().rss / 1048576 
<strong>(2)</strong> 
if (memMB &gt; nextMBThreshold) { <strong>(3)</strong> 
heapdump.writeSnapshot() 
nextMBThreshold += 100 
} 
}, 6000 * 2) <strong>(4)</strong>
Another fancy chart please
We are getting there… 
See we have 
great Dev 
Tools 
Not at 3:00 a.m. in the night 
!….Show me its Production 
ready 
Architect The Boss
Ok…here is 24x7 monitoring
On-Premises / 3rd Party monitoring ? 
22 
• Graphite 
• Splunk 
• Datadog 
• Introscope 
• Others
And On-Demand Dynamic Instrumentation 
Monkey 
Patching 
Agent App 
Dynamic 
Instrument 
Agent App 
• Live Edit 
• Line Level 
Instrumentation 
• Any package, any 
framework, any code 
• Custom logic 
• Counters, Gauges and 
Timers 
• HA rollback
Almost there … 
Look I got 
monitoring 
Good…but before I promote 
you, show me some scale 
Architect The Boss
Vertical and pseudo-horizontal scaling 
• OSS Controller 
• Cluster Mgmt. 
• Hot Deploy 
• Rolling Restart 
• Cluster State Mgmt. 
• Process Mgmt. 
• Deploy
MESH – All things distributed 
• Distributed 
Deploy 
• Cross MC state 
• HA 
• Docker Containers 
• Auto Scaling 
• Process Mgmt.
Log Aggregation 
• OSS Controller 
• Structured Logging 
• Log Aggregation 
• 3rd Party Integration
That’s how we win. 
hehe…I am a Node Hipster now ! 
The Boss
Nodies are not just silicon valley hipsters ! 
And most recently…. 
#1 Retailer
JUST WIN, 
BABY! 
First there was Node 
Thank you!

Html5 devconf nodejs_devops_shubhra

  • 1.
    Triage, Diagnose &Scale Node.js Shubhra Kar | Director – Products twitter:@shubhrakar mail:skar@strongloop.com
  • 2.
    Why am Ihere…or rather who sent me here ?
  • 3.
    Node Core Bert Belder Ben Noordhuis These guys sent me ! LoopBack/Express Core Raymond Feng Ritchie Martori Sam Roberts Miroslav Bajtos Ryan Graham
  • 4.
    To do what? To give you a fresh pair of gloves
  • 5.
    Let’s revisit theSTORY Let’s touch up our SOA for Mobile…and bring Glass @ work Architect Developer
  • 6.
    The boss doeshave valid questions  I recommend Node.js for our API strategy Node is nerdy like systems programming !...Where are tools ? Do we have an IDE ? Architect The Boss
  • 7.
    Node.js APIs actuallyhave a life cycle 8 Reliable API Solutions powered by Node.js Compose Deploy / Scale Monitor Secure / Manage API Studio Controller StrongOps API Gateway Development Production
  • 8.
    Let’s start bydebugging • Chrome debugger • Debug Remotely on Production • Breakpoints & uncaught exceptions • Source Maps • Unit test integration • Display/edit variables • Pre-loaded breaks Known as Node-Inspector / StrongLoop-Debug
  • 9.
    Debugging server sideclustered apps Debugging single process slc debug app.js Debugging clustered process in V11 slc debug app.js http://localhost:8080/debug?port=<5858+ID-of-process> Debugging clustered process in V10 %node debug –p <PID> connecting…ok … debug>quit %node-inspector http://127.0.0.1:8080/debug?port =5858 Or process._debugPort = 5858 + cluster.worker.id
  • 10.
    Can Errors bestitched into a trace and recovered ? Enter StrongLoop / Zones
  • 11.
    But is itenough to convince him ? Plus I can now diagnose CPU hotspots and Memory Bottlenecks Node is fast you said !...what bottlenecks and leaks ? Architect The Boss
  • 12.
    How to diagnoseCPU hotspots upto line of code ? Enter StrongLoop OSS - Node Profiler slc runctl cpu-start/stop PID >> CPU Proc files
  • 13.
    Can I visuallysee my hotspots ? Chrome Dev Tools – For Server !
  • 14.
    How about afancy chart for my boss ? Call Stack Path and function CPU Cycle times
  • 15.
    Does Node havememory leaks ? StrongLoop OSS - HeapSnapshots slc runctl heap-snapshot PID
  • 16.
    heapdump for V8snapshots npm install heapdump Add to app : var heapdump = require(‘heapdump’) Method 1 : writeSnapshot var heapdump = require('heapdump') ... heapdump.writeSnapshot() Method 2 : SIGUSR2 (Unix only) kill –USR2 <pid> Make sure your directory is writable process.chdir('/path/to/writeable/dir’)
  • 17.
    Heap Snapshot strategies Programmatic heap snapshots (timer based) var heapdump = require('heapdump') ... setInterval(function () { heapdump.writeSnapshot() }, 6000 * 30) <strong>(1)</strong> Programmatic heap snapshots (threshold based) var heapdump = require('heapdump') var nextMBThreshold = 0 <strong>(1)</strong> setInterval(function () { var memMB = process.memoryUsage().rss / 1048576 <strong>(2)</strong> if (memMB &gt; nextMBThreshold) { <strong>(3)</strong> heapdump.writeSnapshot() nextMBThreshold += 100 } }, 6000 * 2) <strong>(4)</strong>
  • 18.
  • 19.
    We are gettingthere… See we have great Dev Tools Not at 3:00 a.m. in the night !….Show me its Production ready Architect The Boss
  • 20.
  • 21.
    On-Premises / 3rdParty monitoring ? 22 • Graphite • Splunk • Datadog • Introscope • Others
  • 22.
    And On-Demand DynamicInstrumentation Monkey Patching Agent App Dynamic Instrument Agent App • Live Edit • Line Level Instrumentation • Any package, any framework, any code • Custom logic • Counters, Gauges and Timers • HA rollback
  • 23.
    Almost there … Look I got monitoring Good…but before I promote you, show me some scale Architect The Boss
  • 24.
    Vertical and pseudo-horizontalscaling • OSS Controller • Cluster Mgmt. • Hot Deploy • Rolling Restart • Cluster State Mgmt. • Process Mgmt. • Deploy
  • 25.
    MESH – Allthings distributed • Distributed Deploy • Cross MC state • HA • Docker Containers • Auto Scaling • Process Mgmt.
  • 26.
    Log Aggregation •OSS Controller • Structured Logging • Log Aggregation • 3rd Party Integration
  • 27.
    That’s how wewin. hehe…I am a Node Hipster now ! The Boss
  • 28.
    Nodies are notjust silicon valley hipsters ! And most recently…. #1 Retailer
  • 29.
    JUST WIN, BABY! First there was Node Thank you!