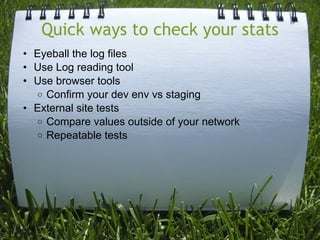
Download as KEY, PPTX


![Eyeball it
Processing UserSessionsController#new (for 127.0.0.1 at
2010-05-15 10:11:09) [GET]
Parameters: {"action"=>"new", "controller"=>"user_sessions"}
Rendering template within layouts/login
Rendering user_sessions/new
Completed in 202ms (View: 105, DB: 42) | 200 OK [http://localhost/
login]](https://image.slidesharecdn.com/performancemonitoringelm-100721113624-phpapp02/85/improving-the-performance-of-Rails-web-Applications-12-320.jpg)


![Eyeball it
Processing UserSessionsController#new (for 127.0.0.1 at
2010-05-15 10:11:09) [GET]
Parameters: {"action"=>"new", "controller"=>"user_sessions"}
Rendering template within layouts/login
Rendering user_sessions/new
Completed in 202ms (View: 105, DB: 42) | 200 OK [http://localhost/
login]](https://image.slidesharecdn.com/performancemonitoringelm-100721113624-phpapp02/75/improving-the-performance-of-Rails-web-Applications-12-2048.jpg)


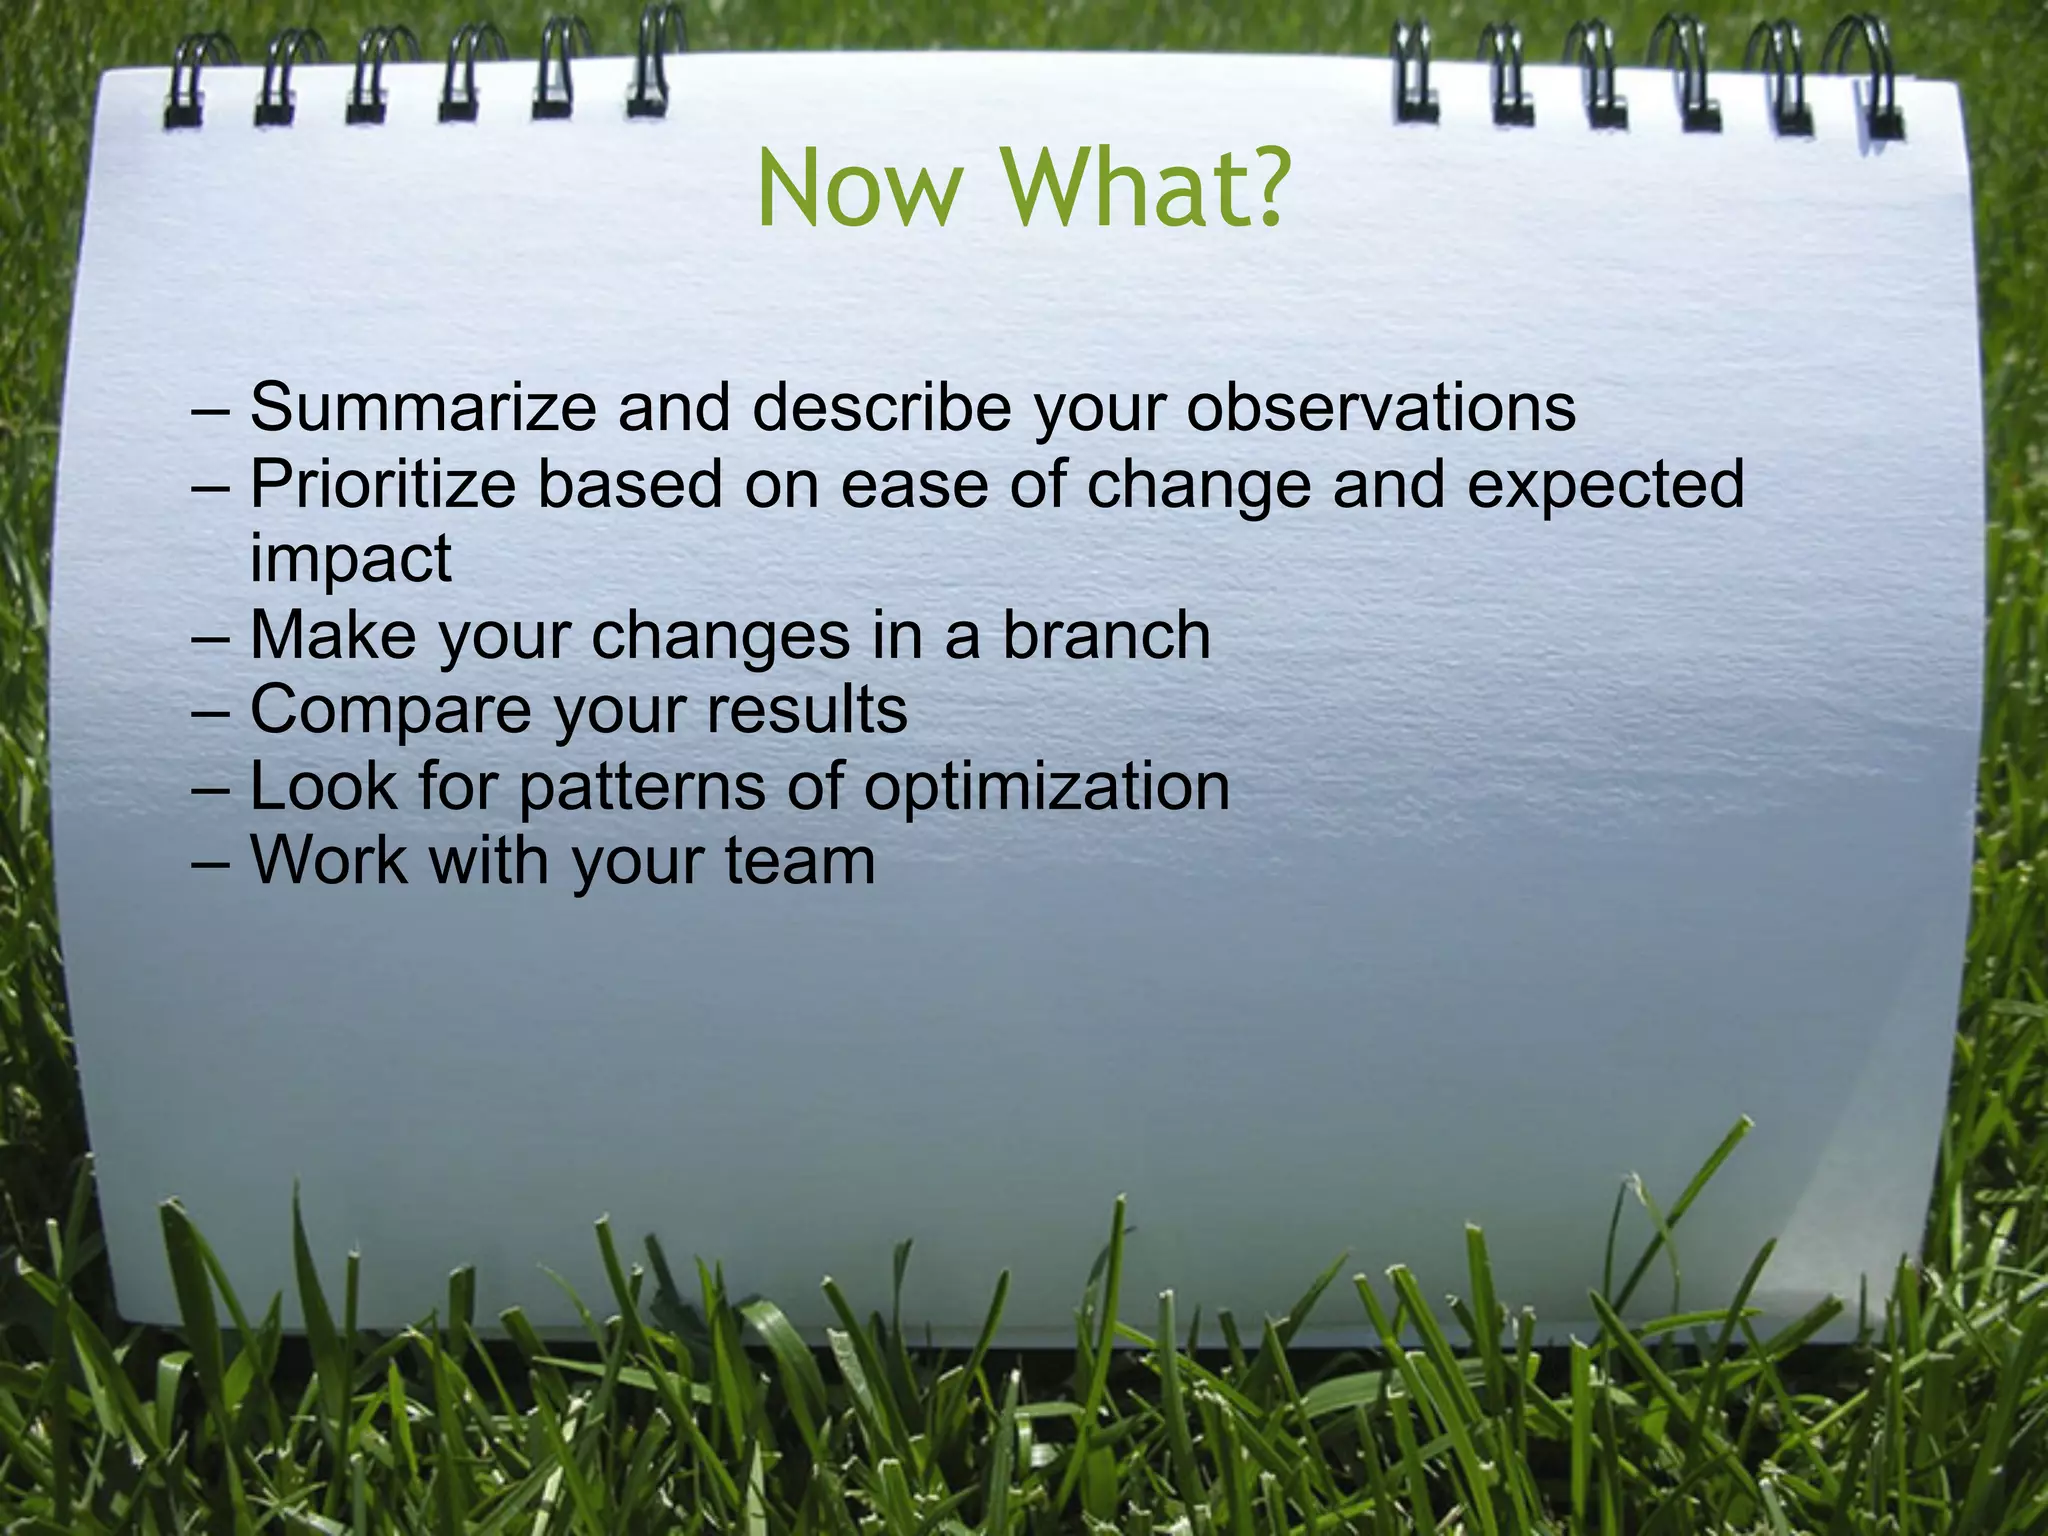


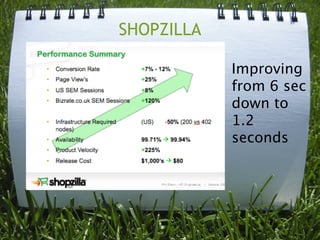
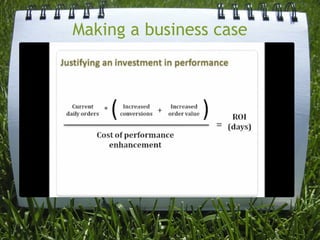
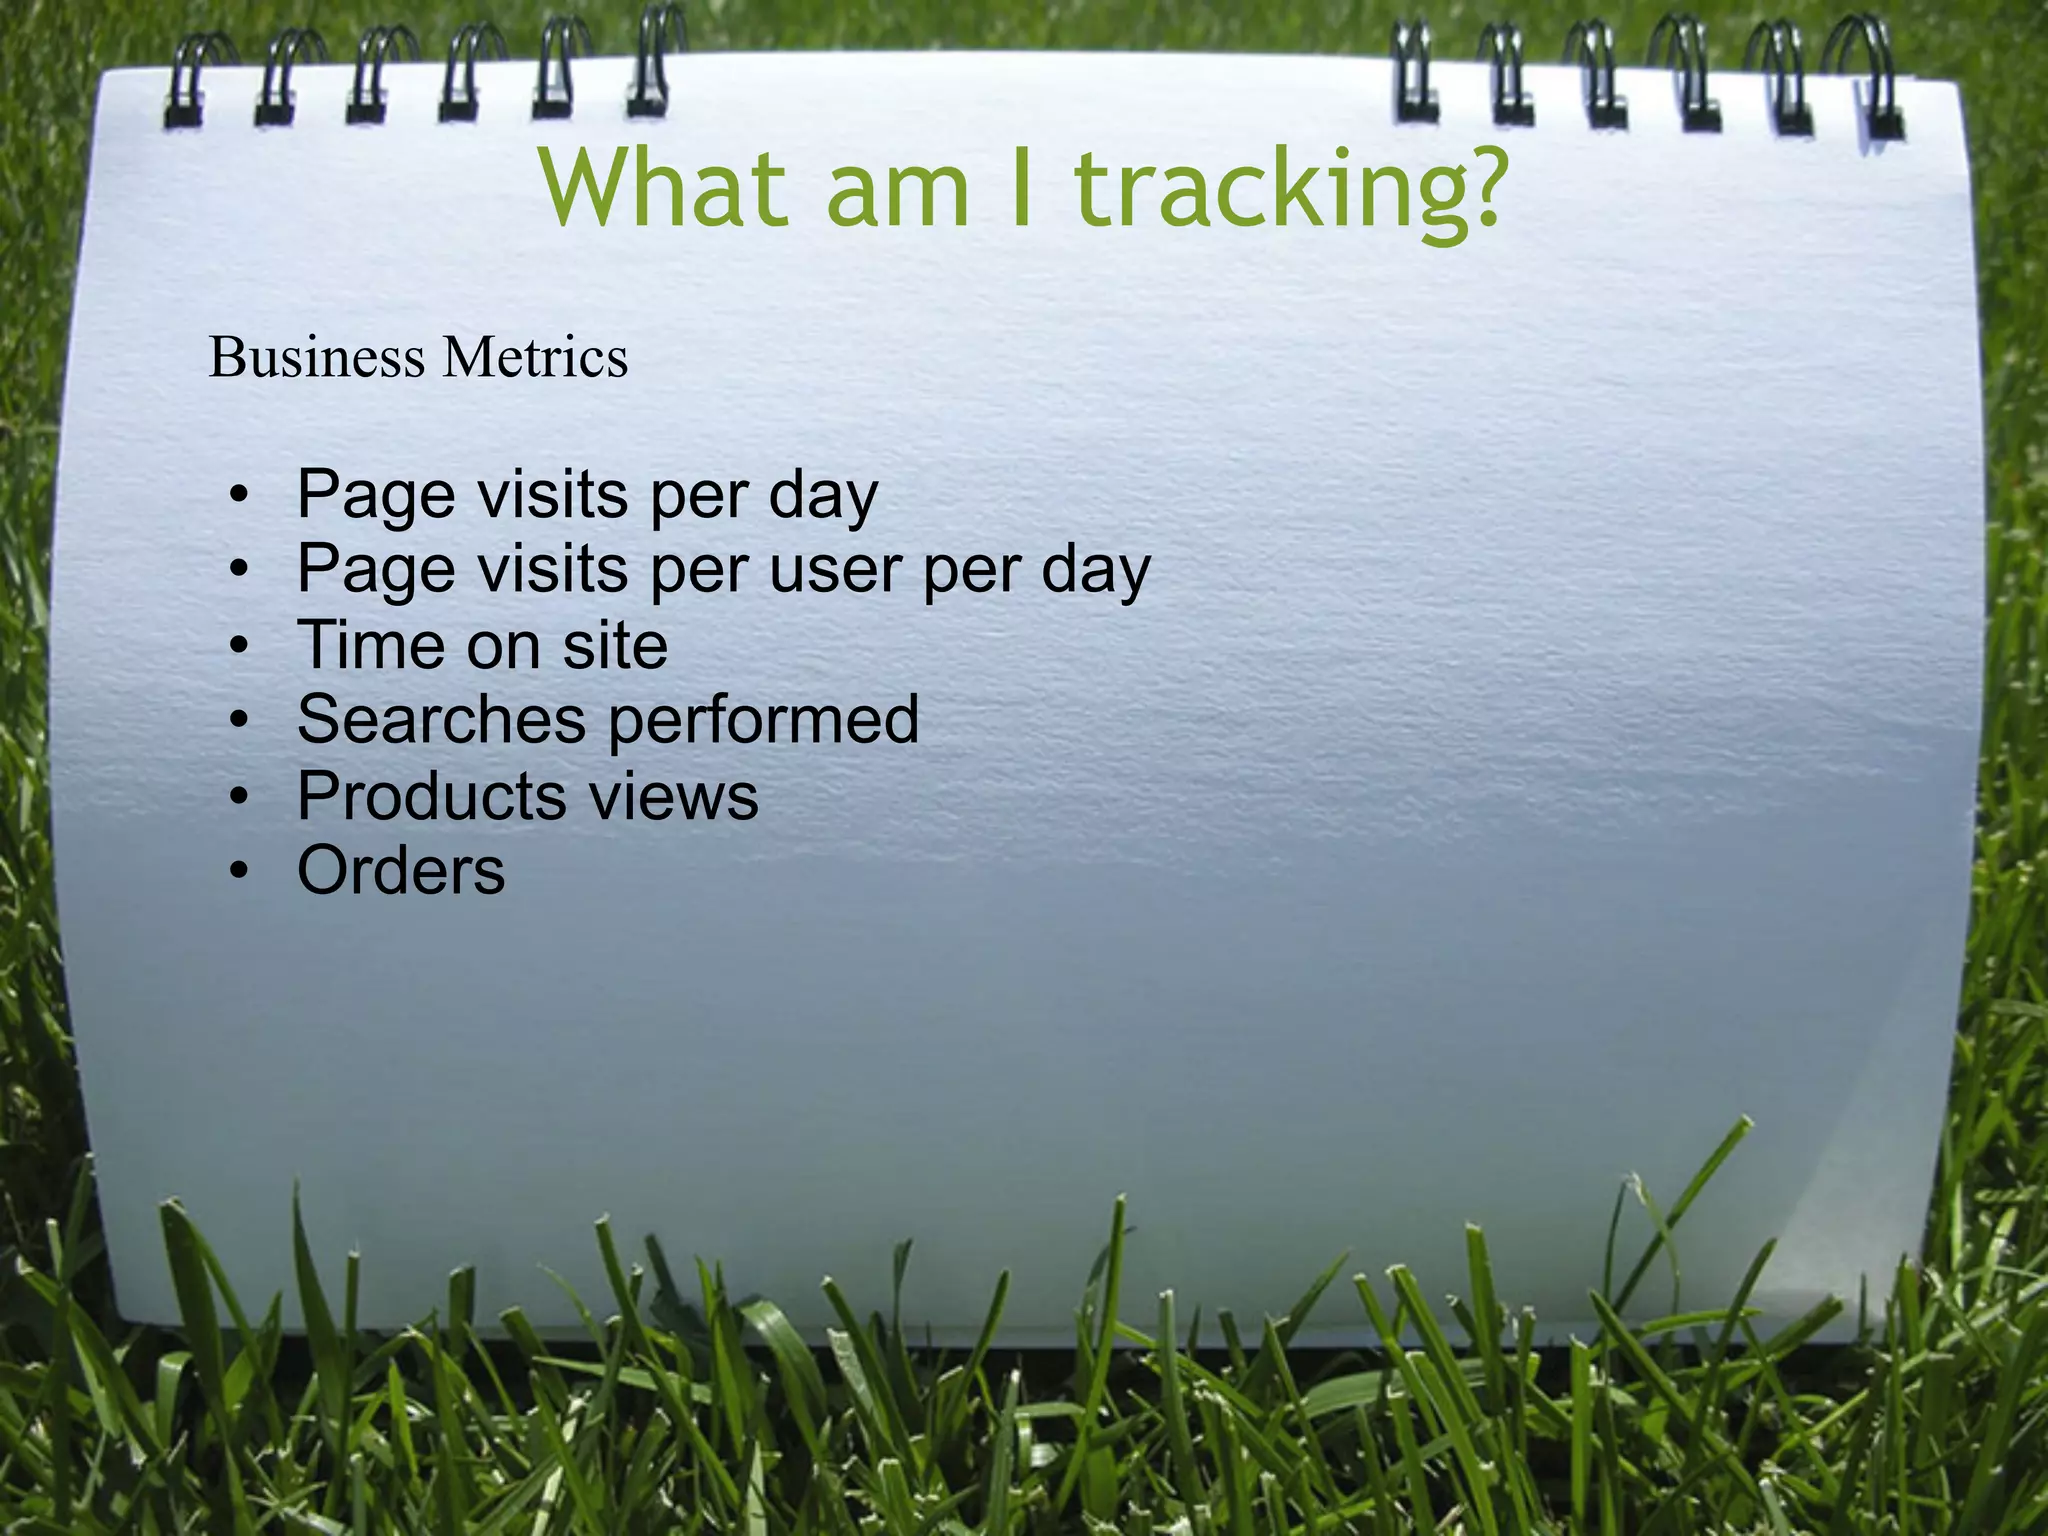
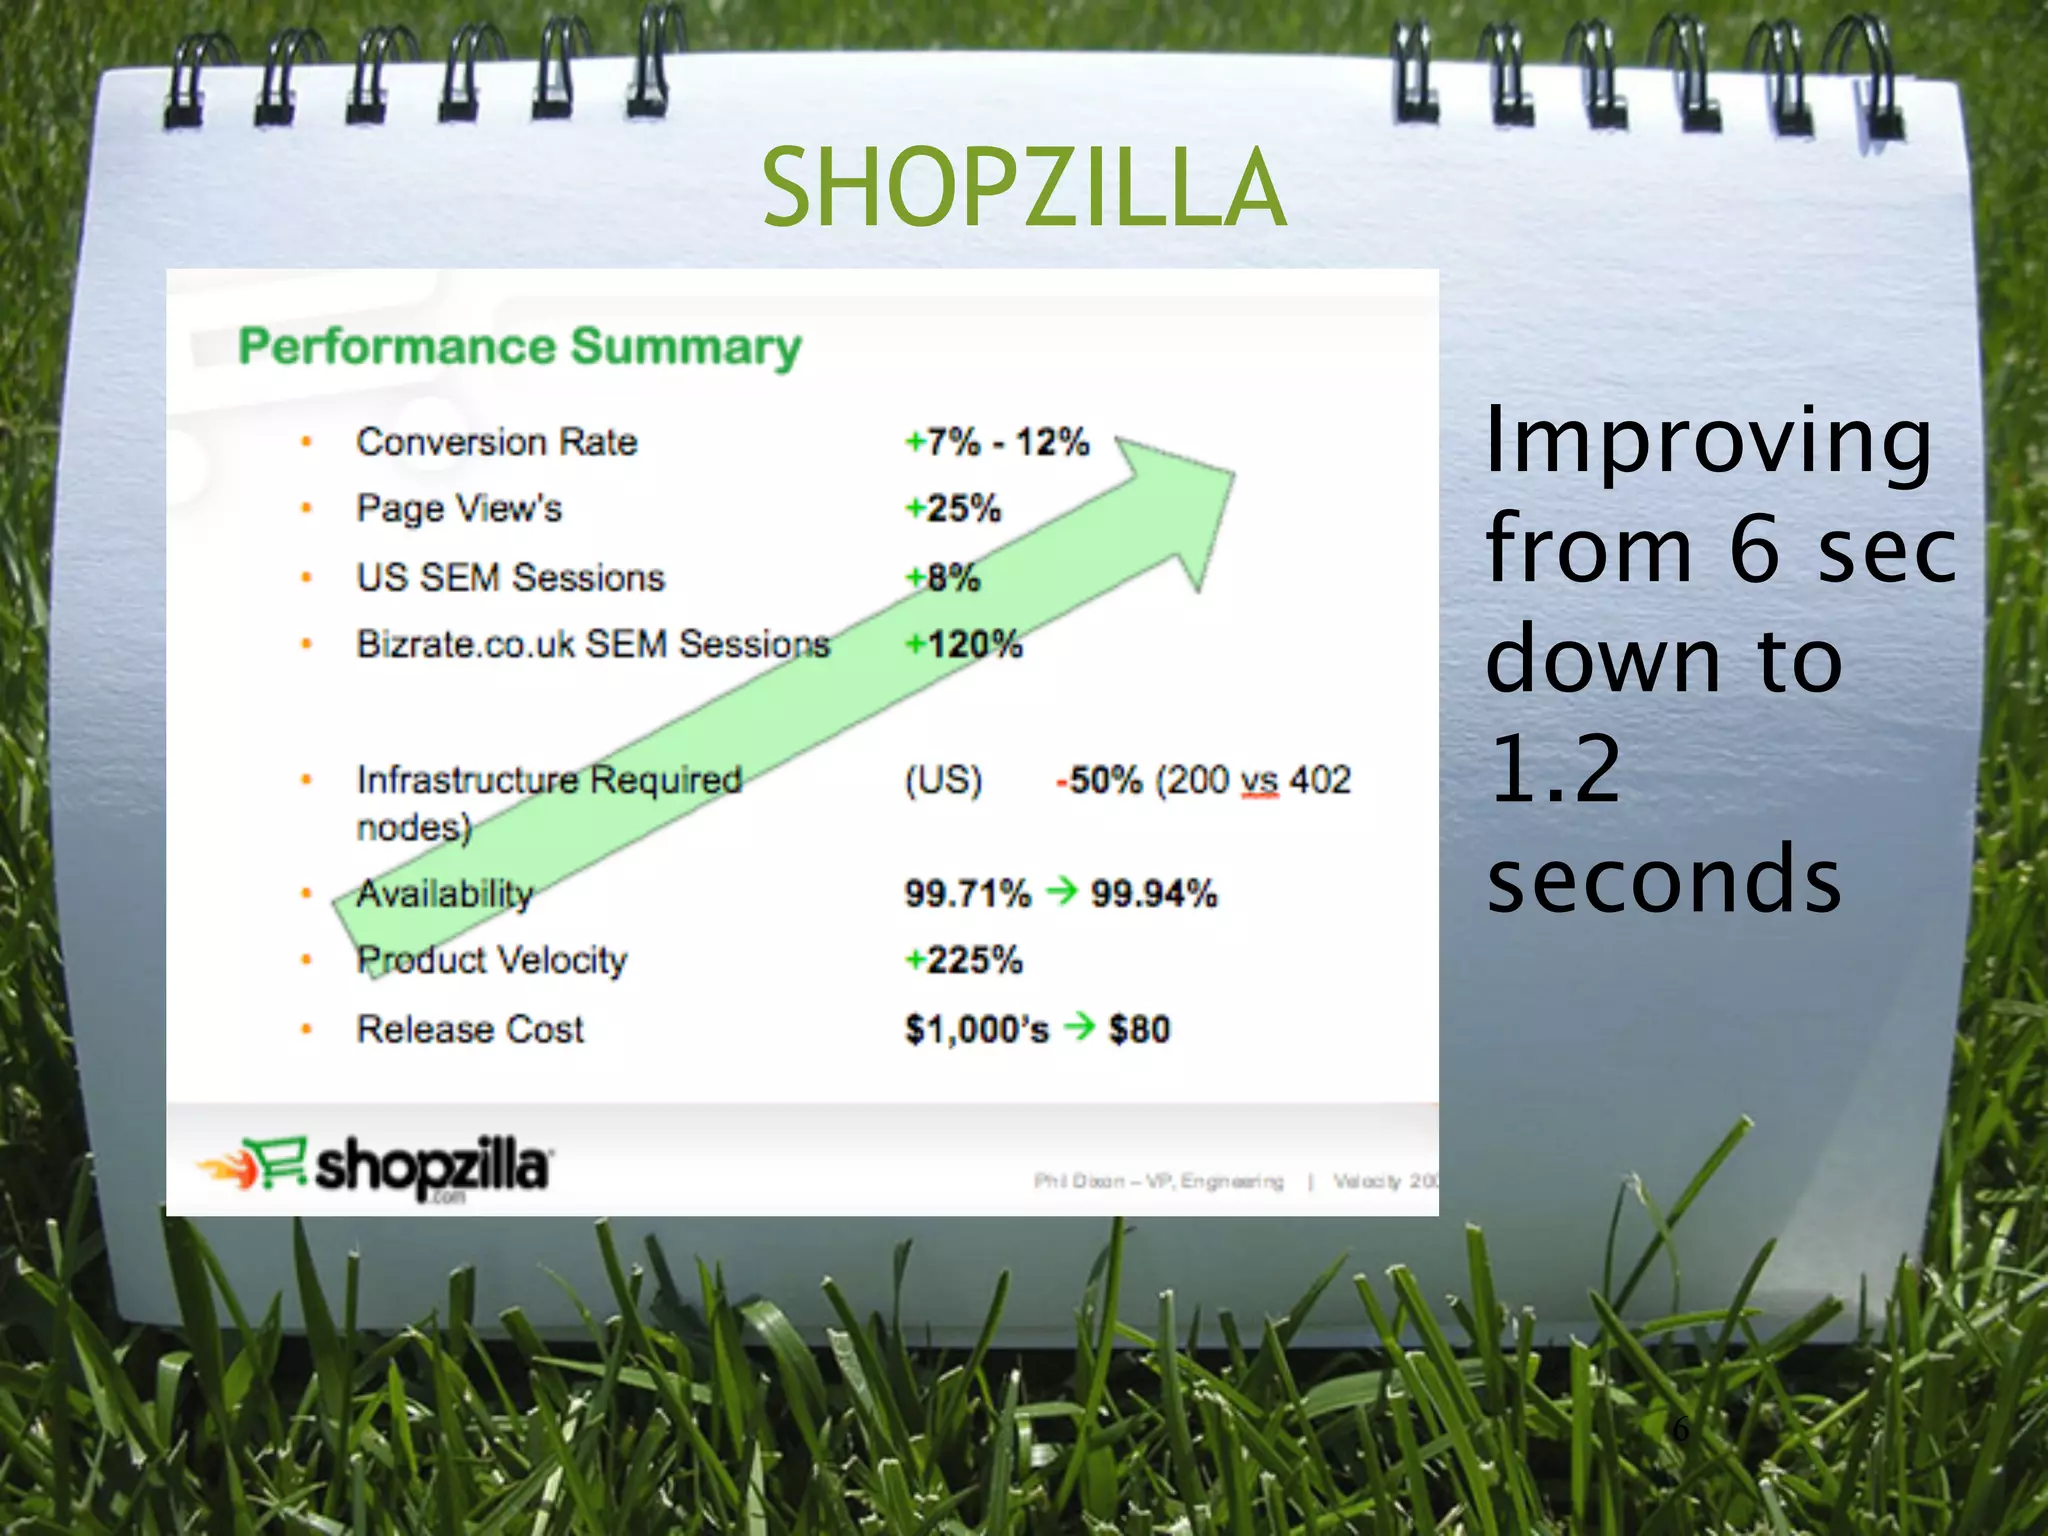
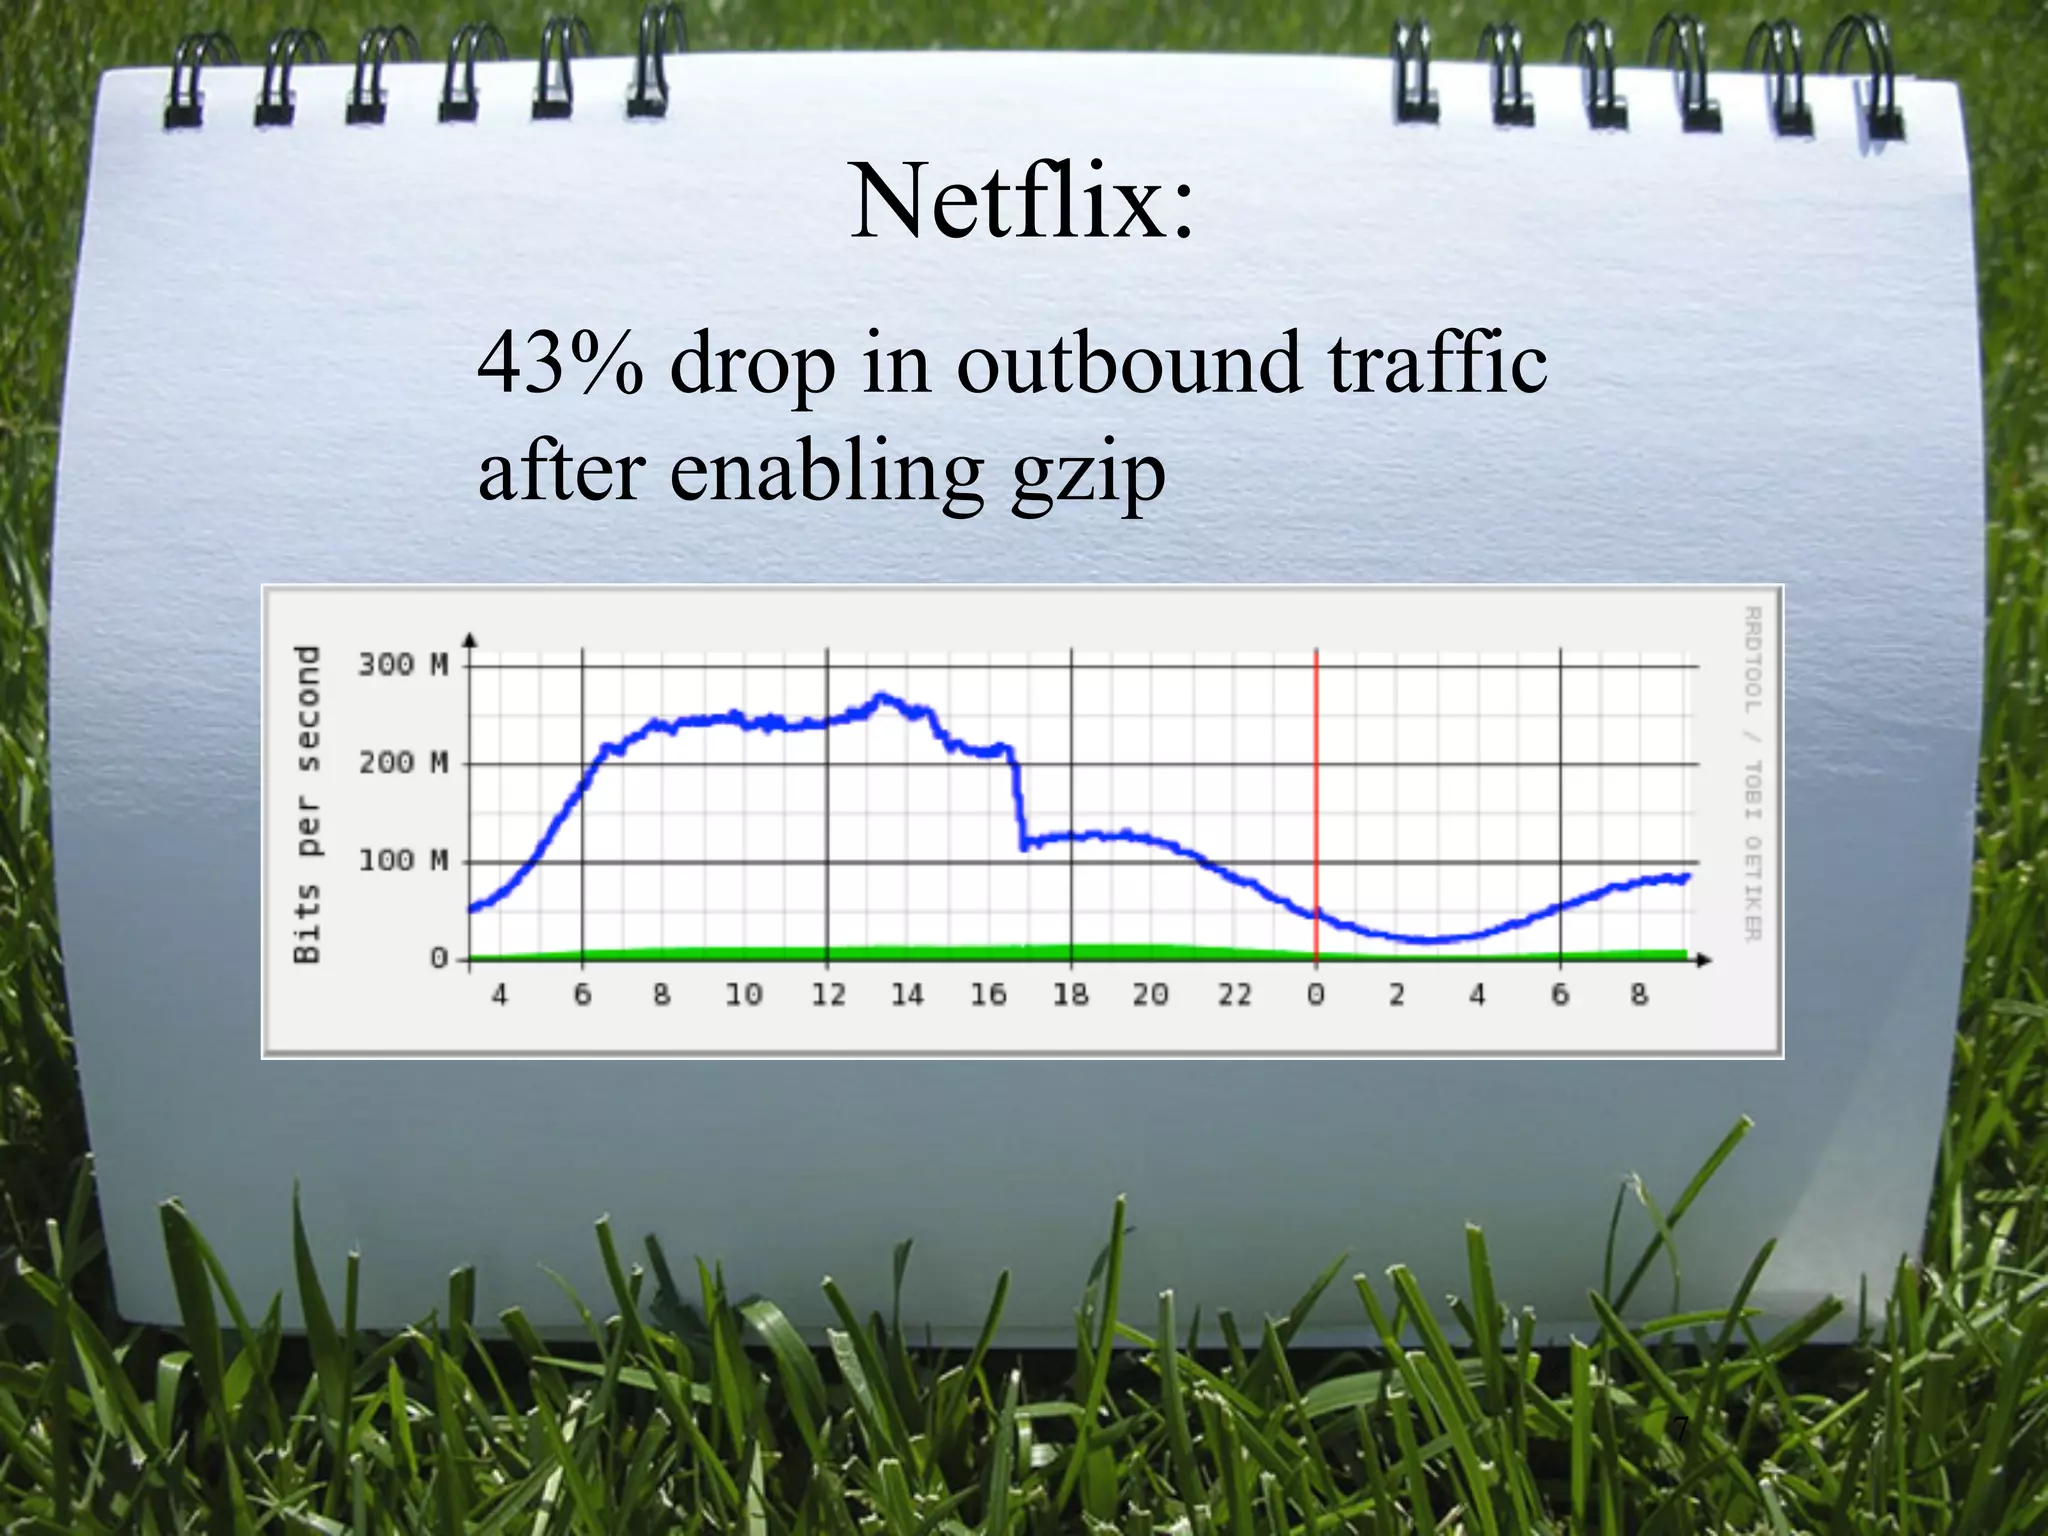
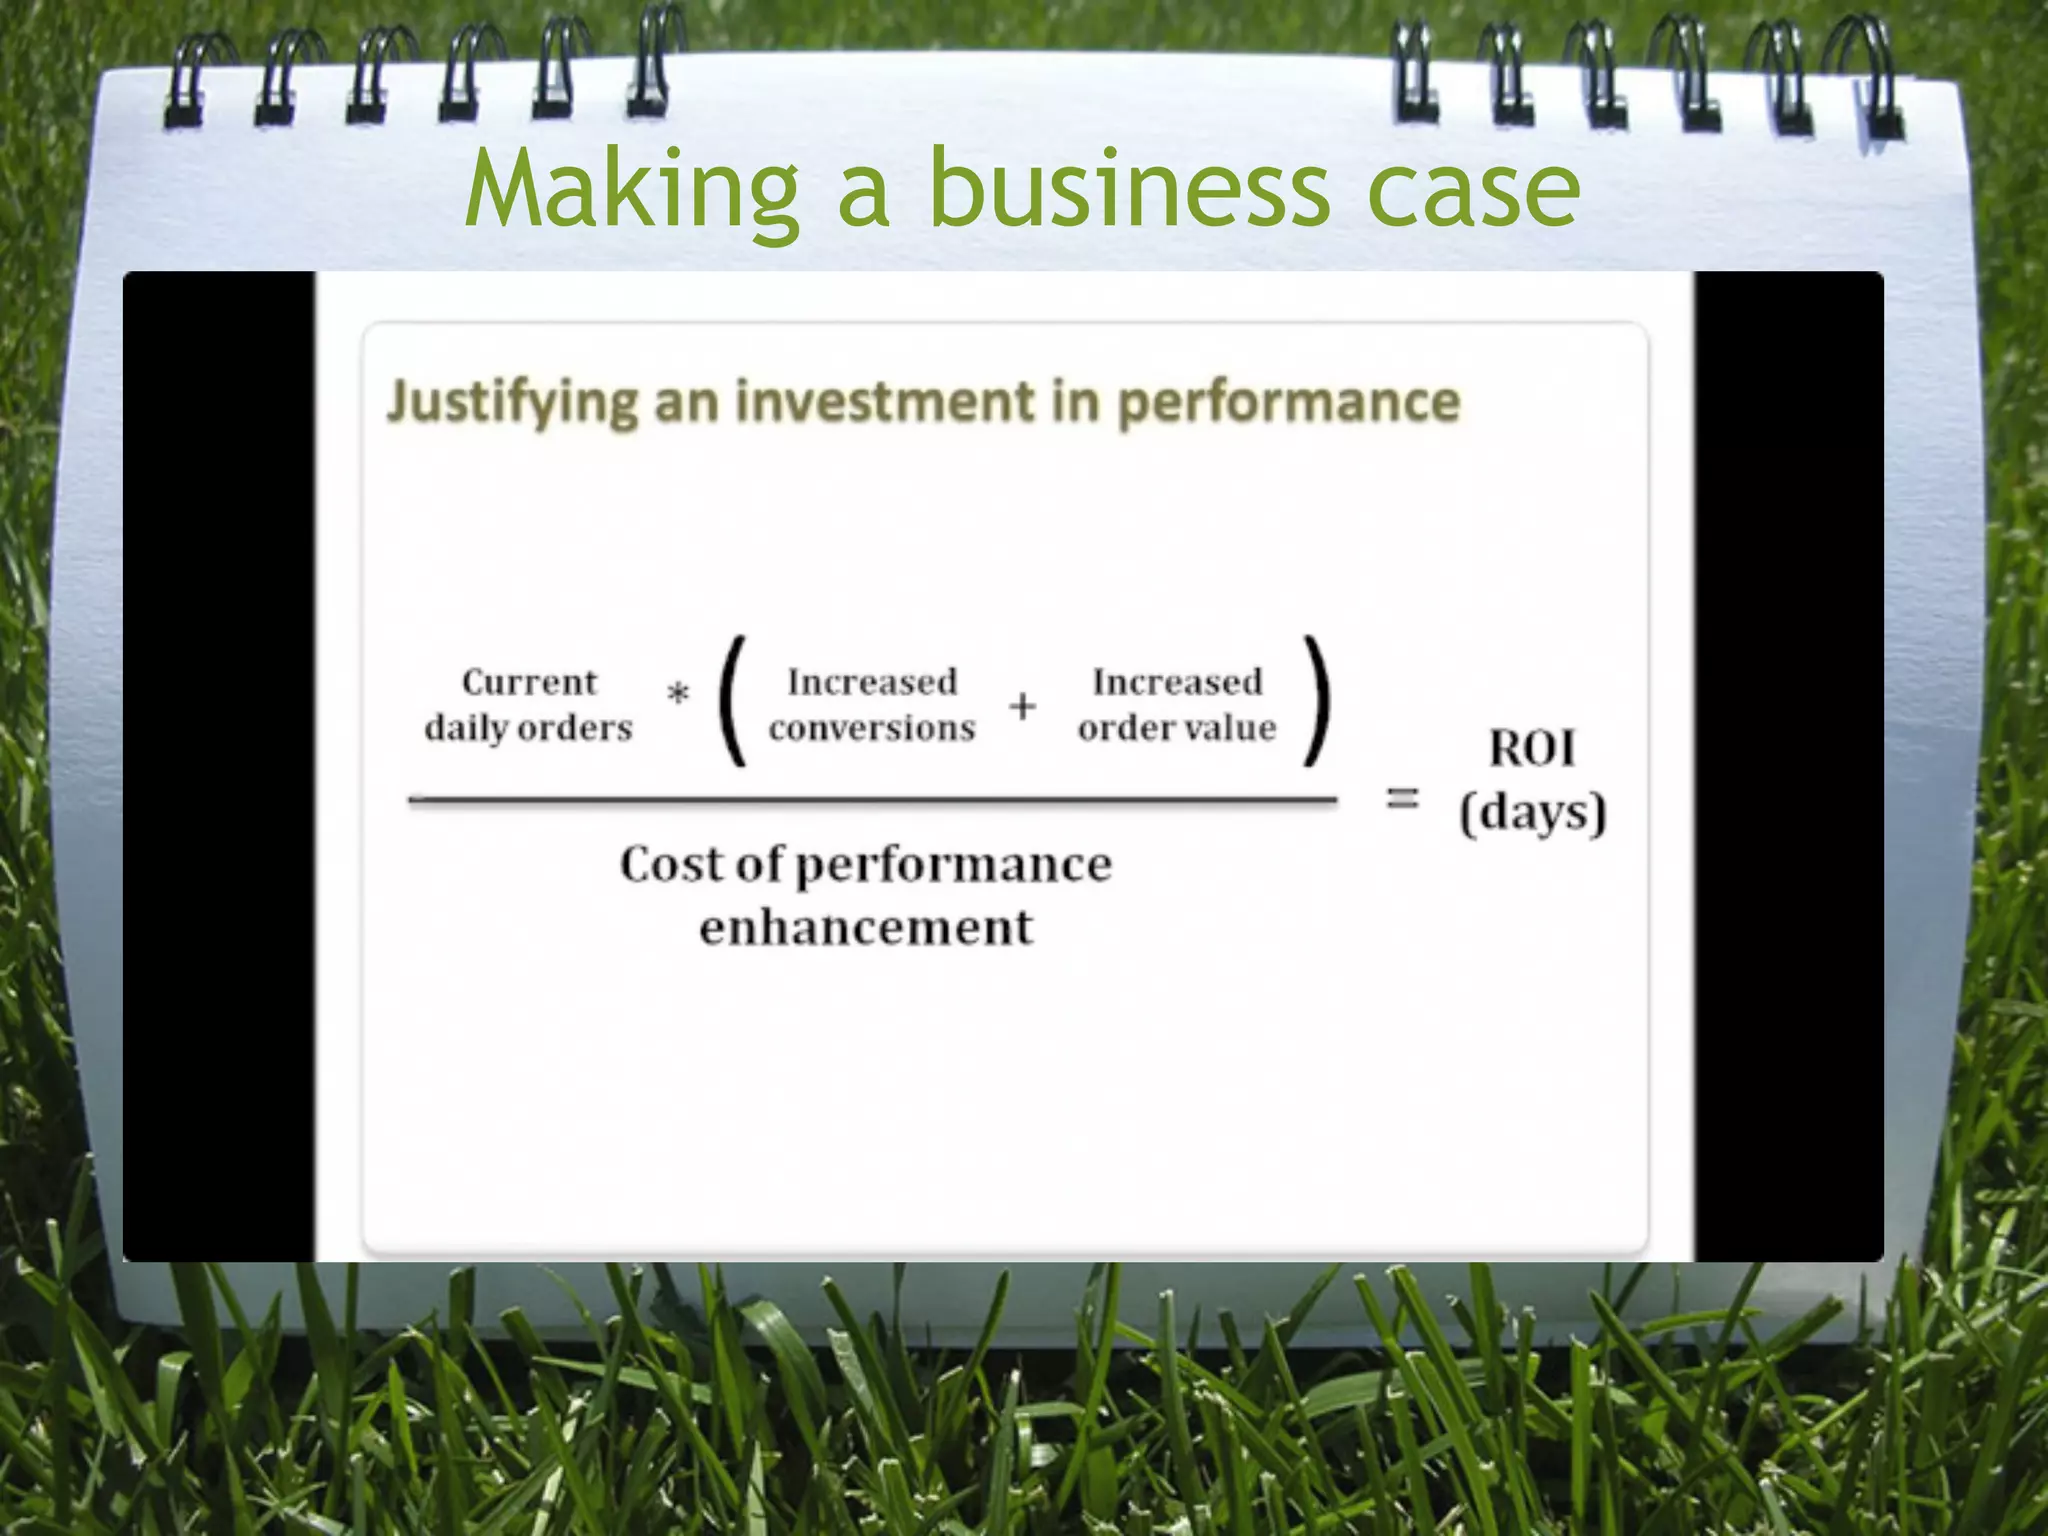
The document discusses the importance of performance monitoring in applications, highlighting the impact on revenue, costs, user satisfaction, and competition. It provides insights into business metrics to track, quick assessment methods, and tools available for monitoring performance, while emphasizing the need for consistent testing and analysis. The document also offers practical advice on making optimization changes and references for further reading.


