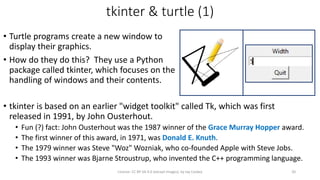
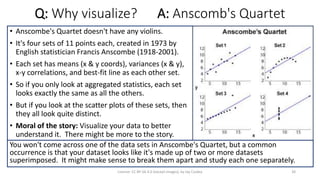
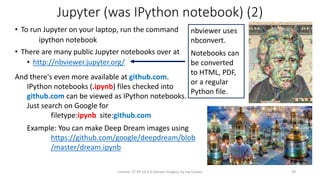
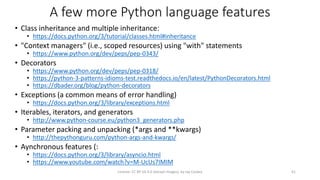
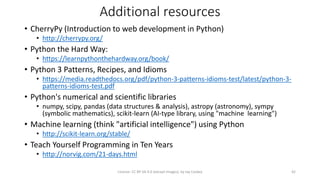
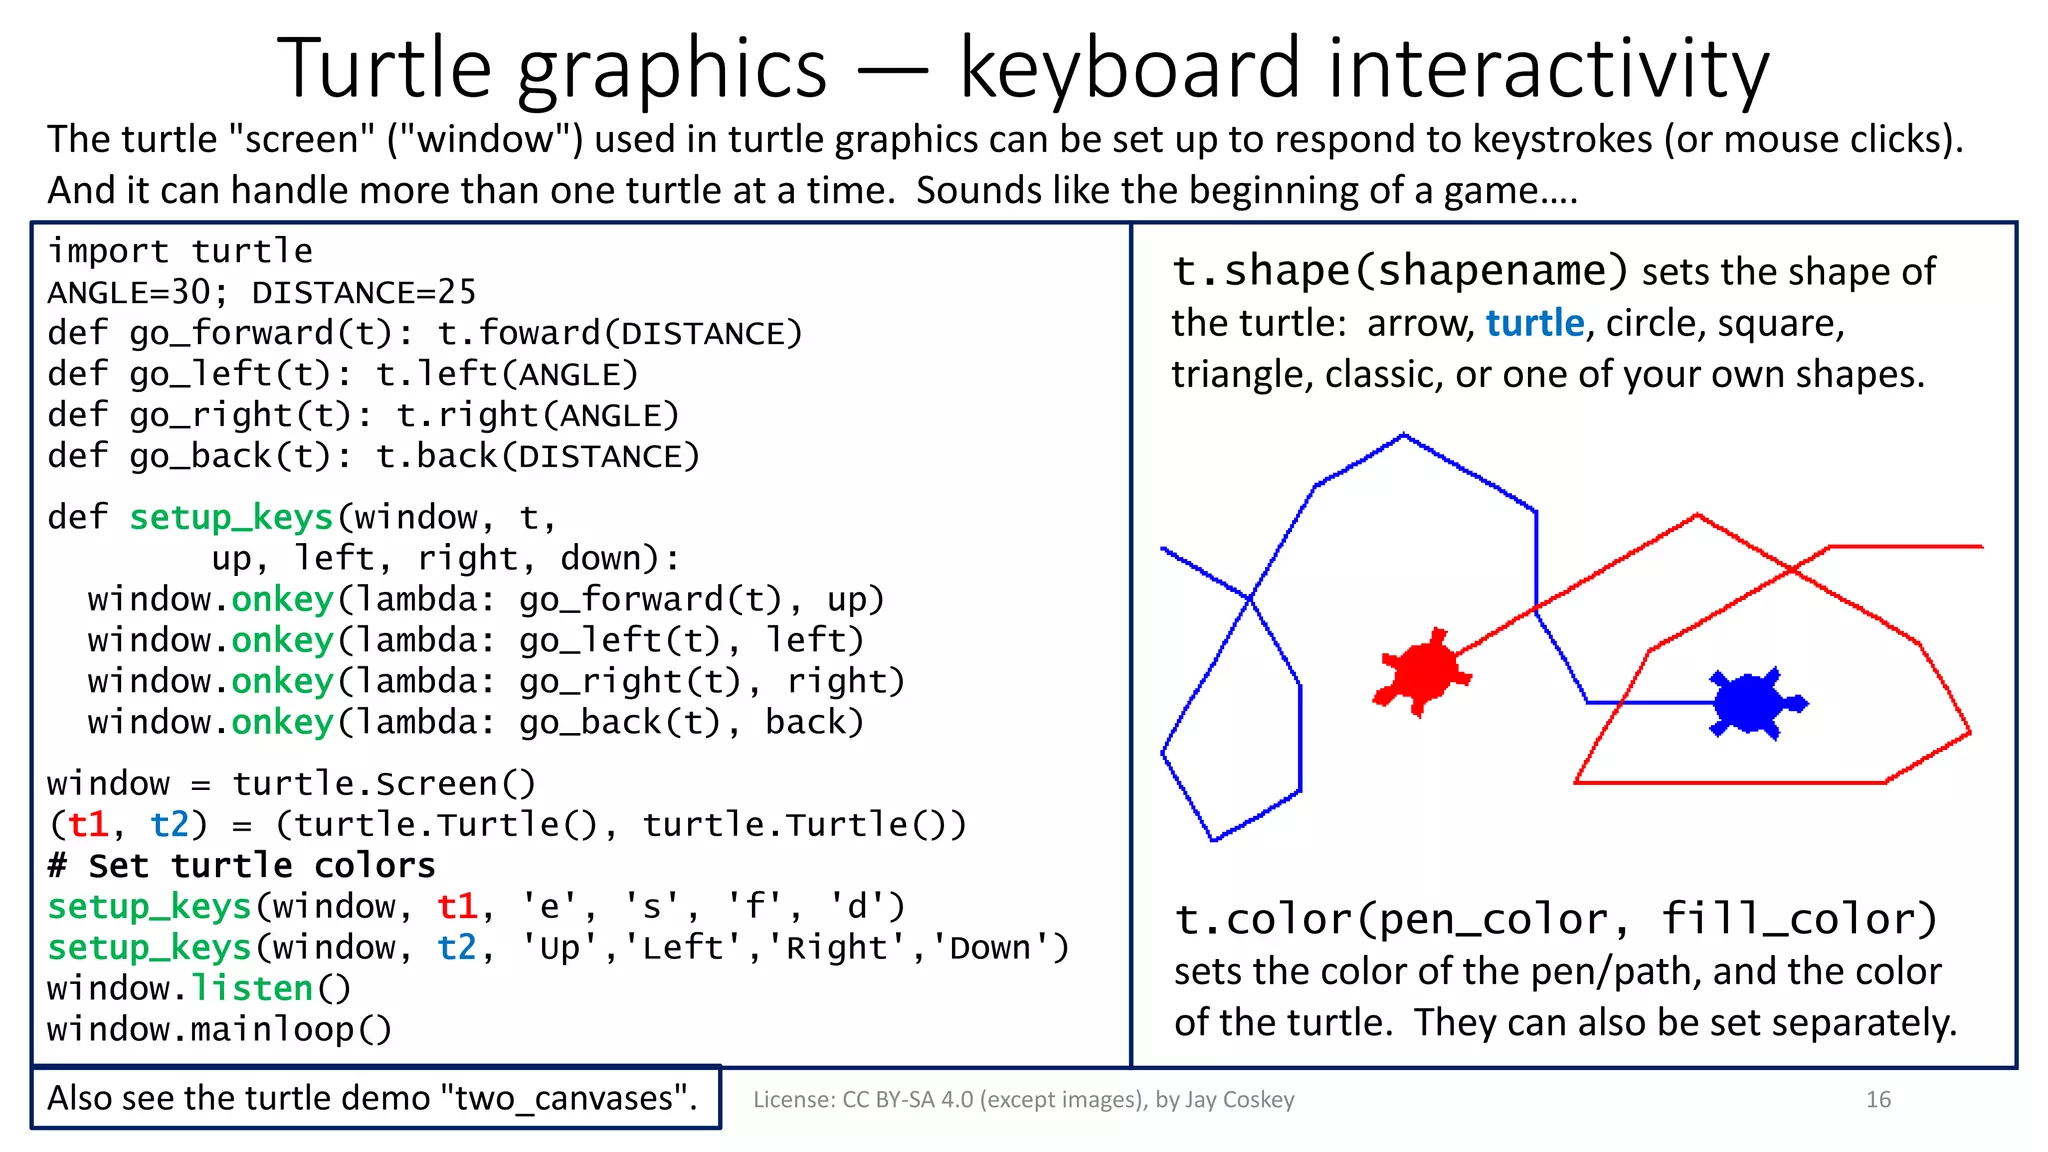
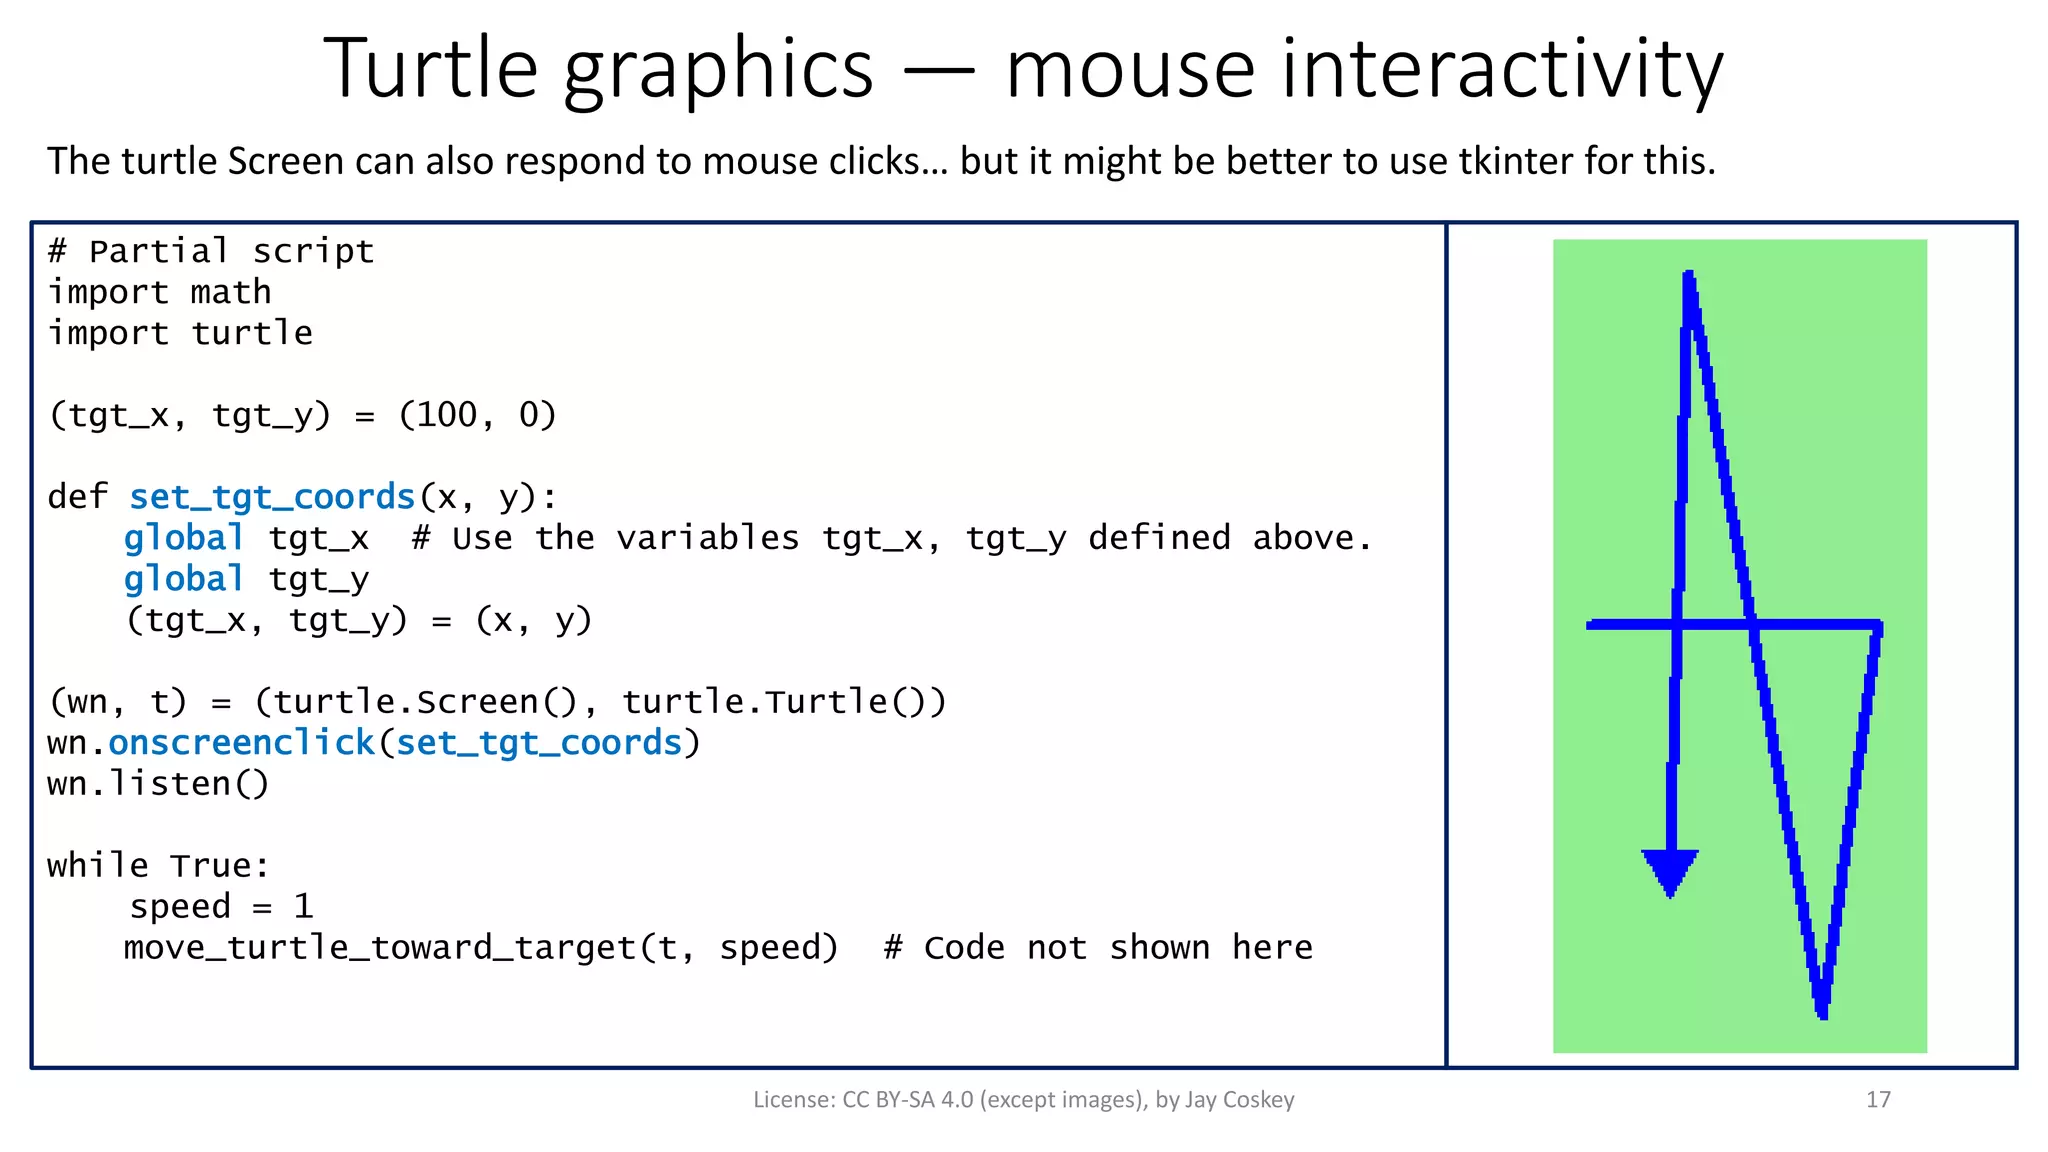
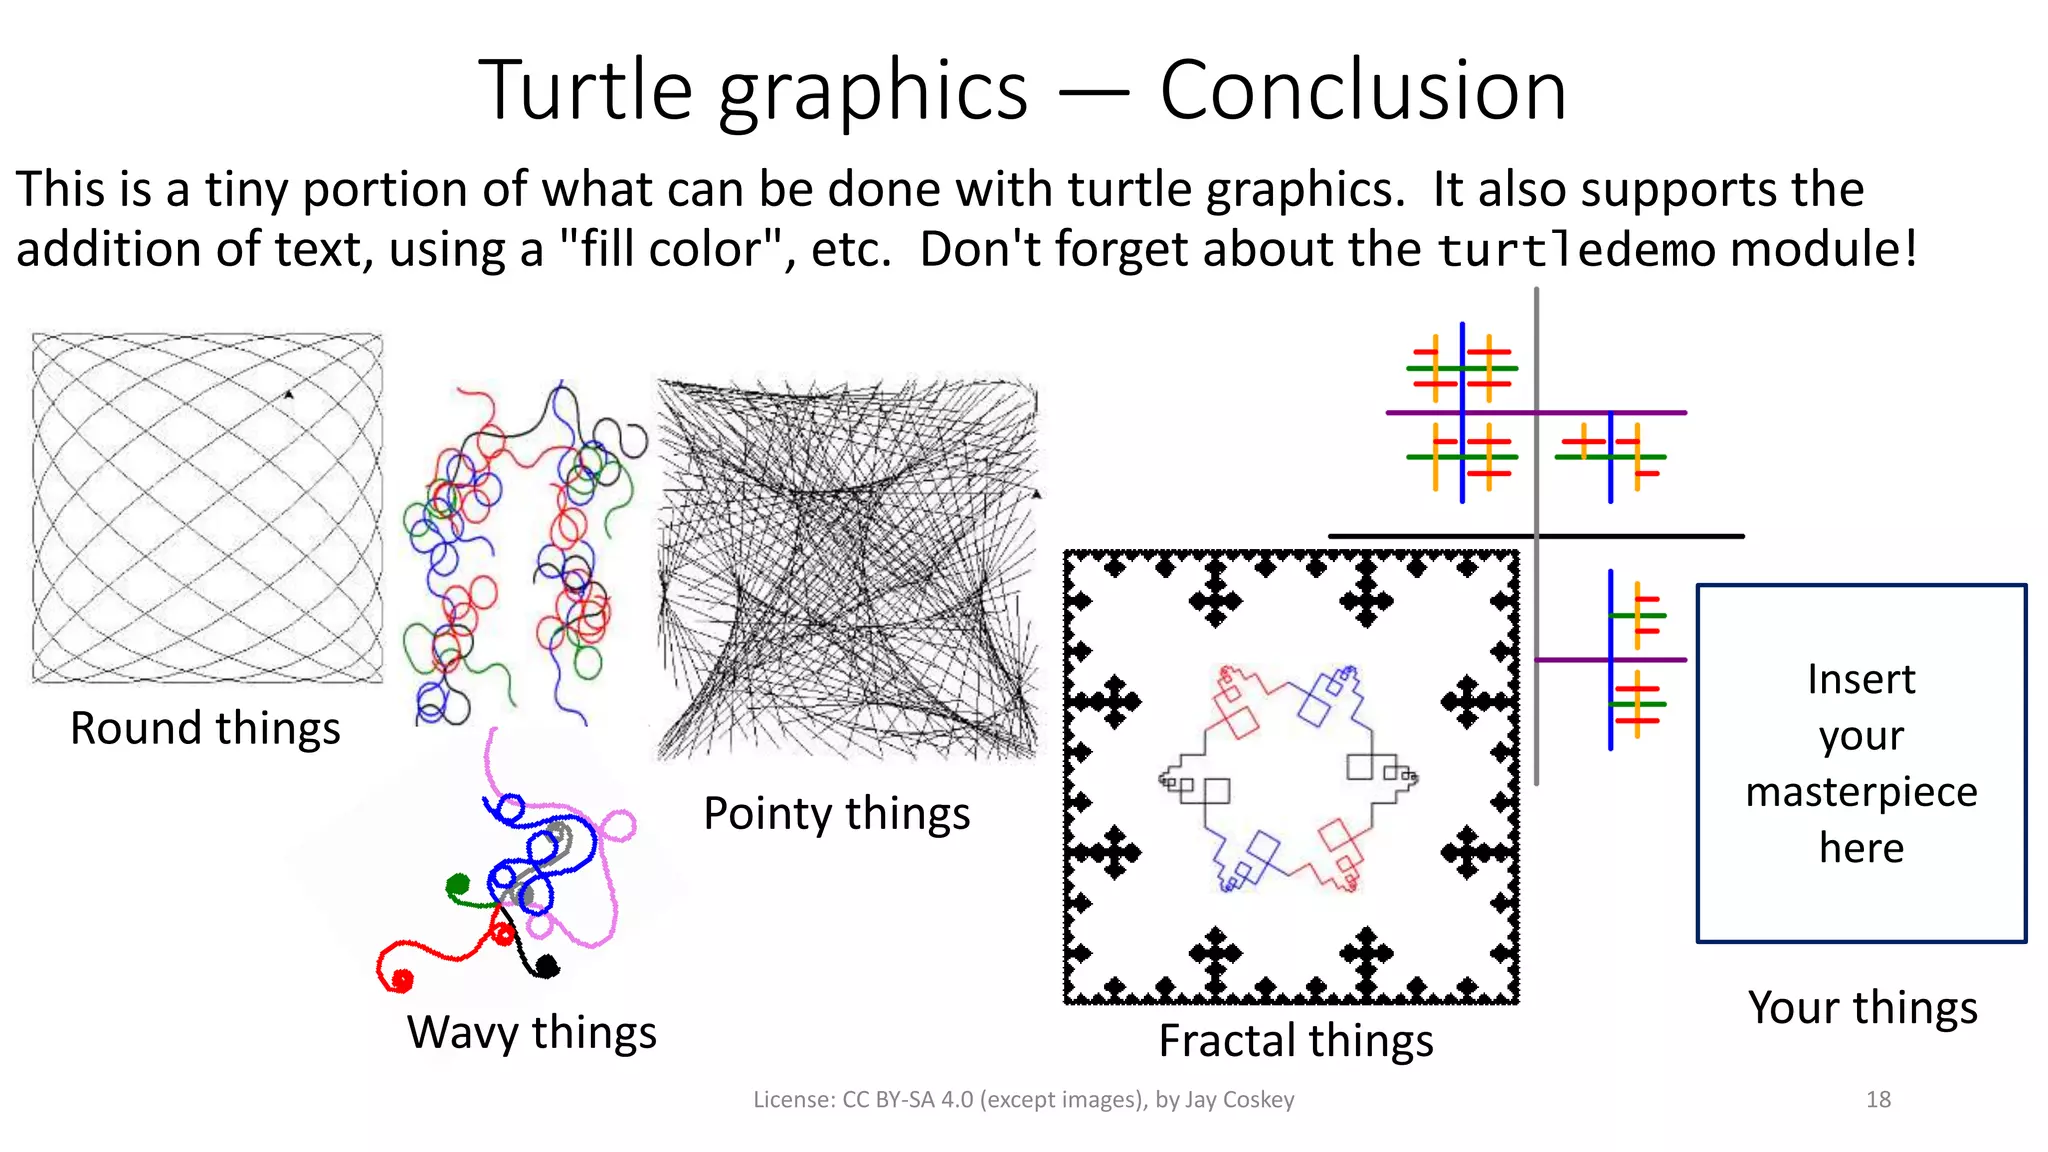
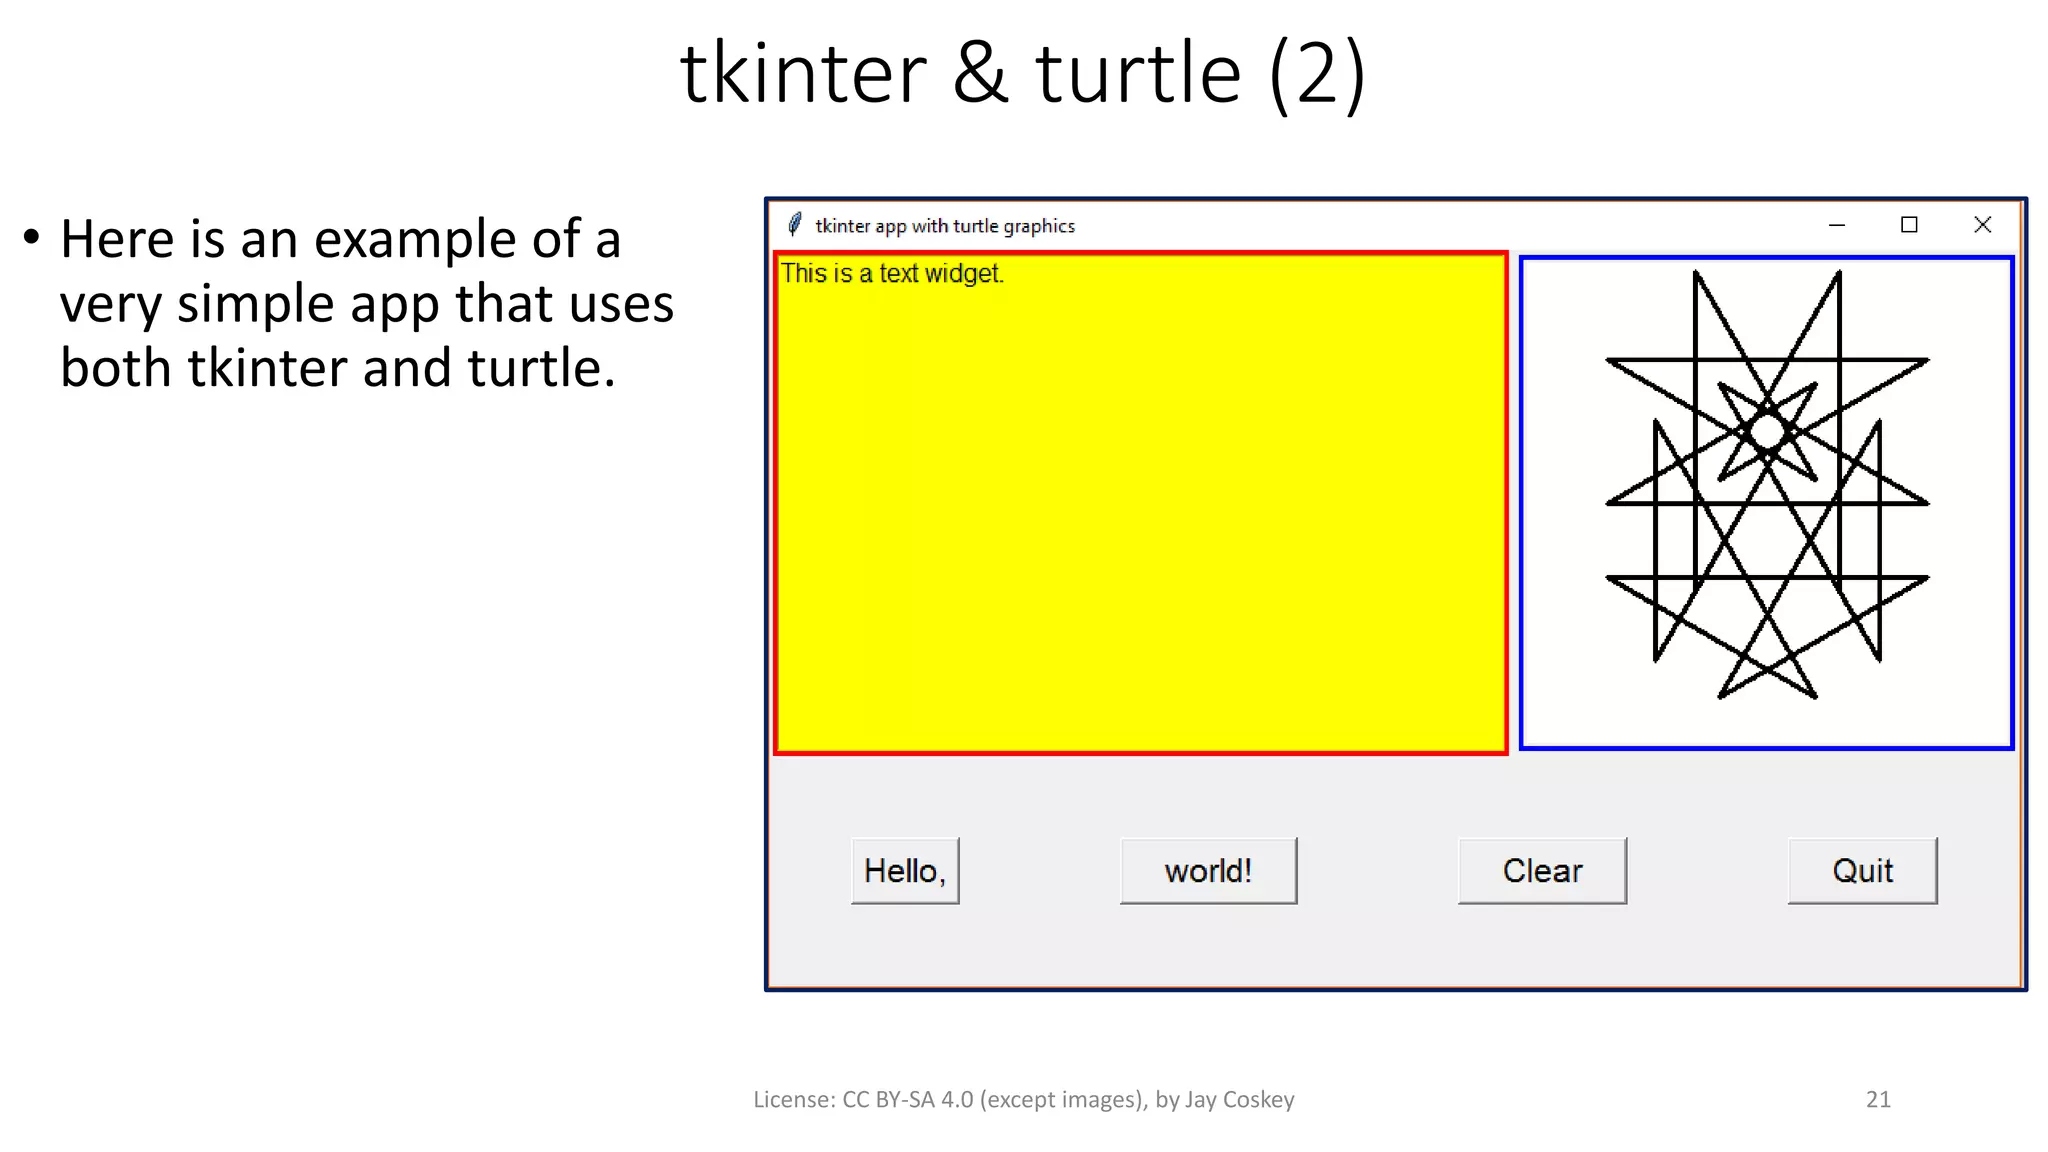
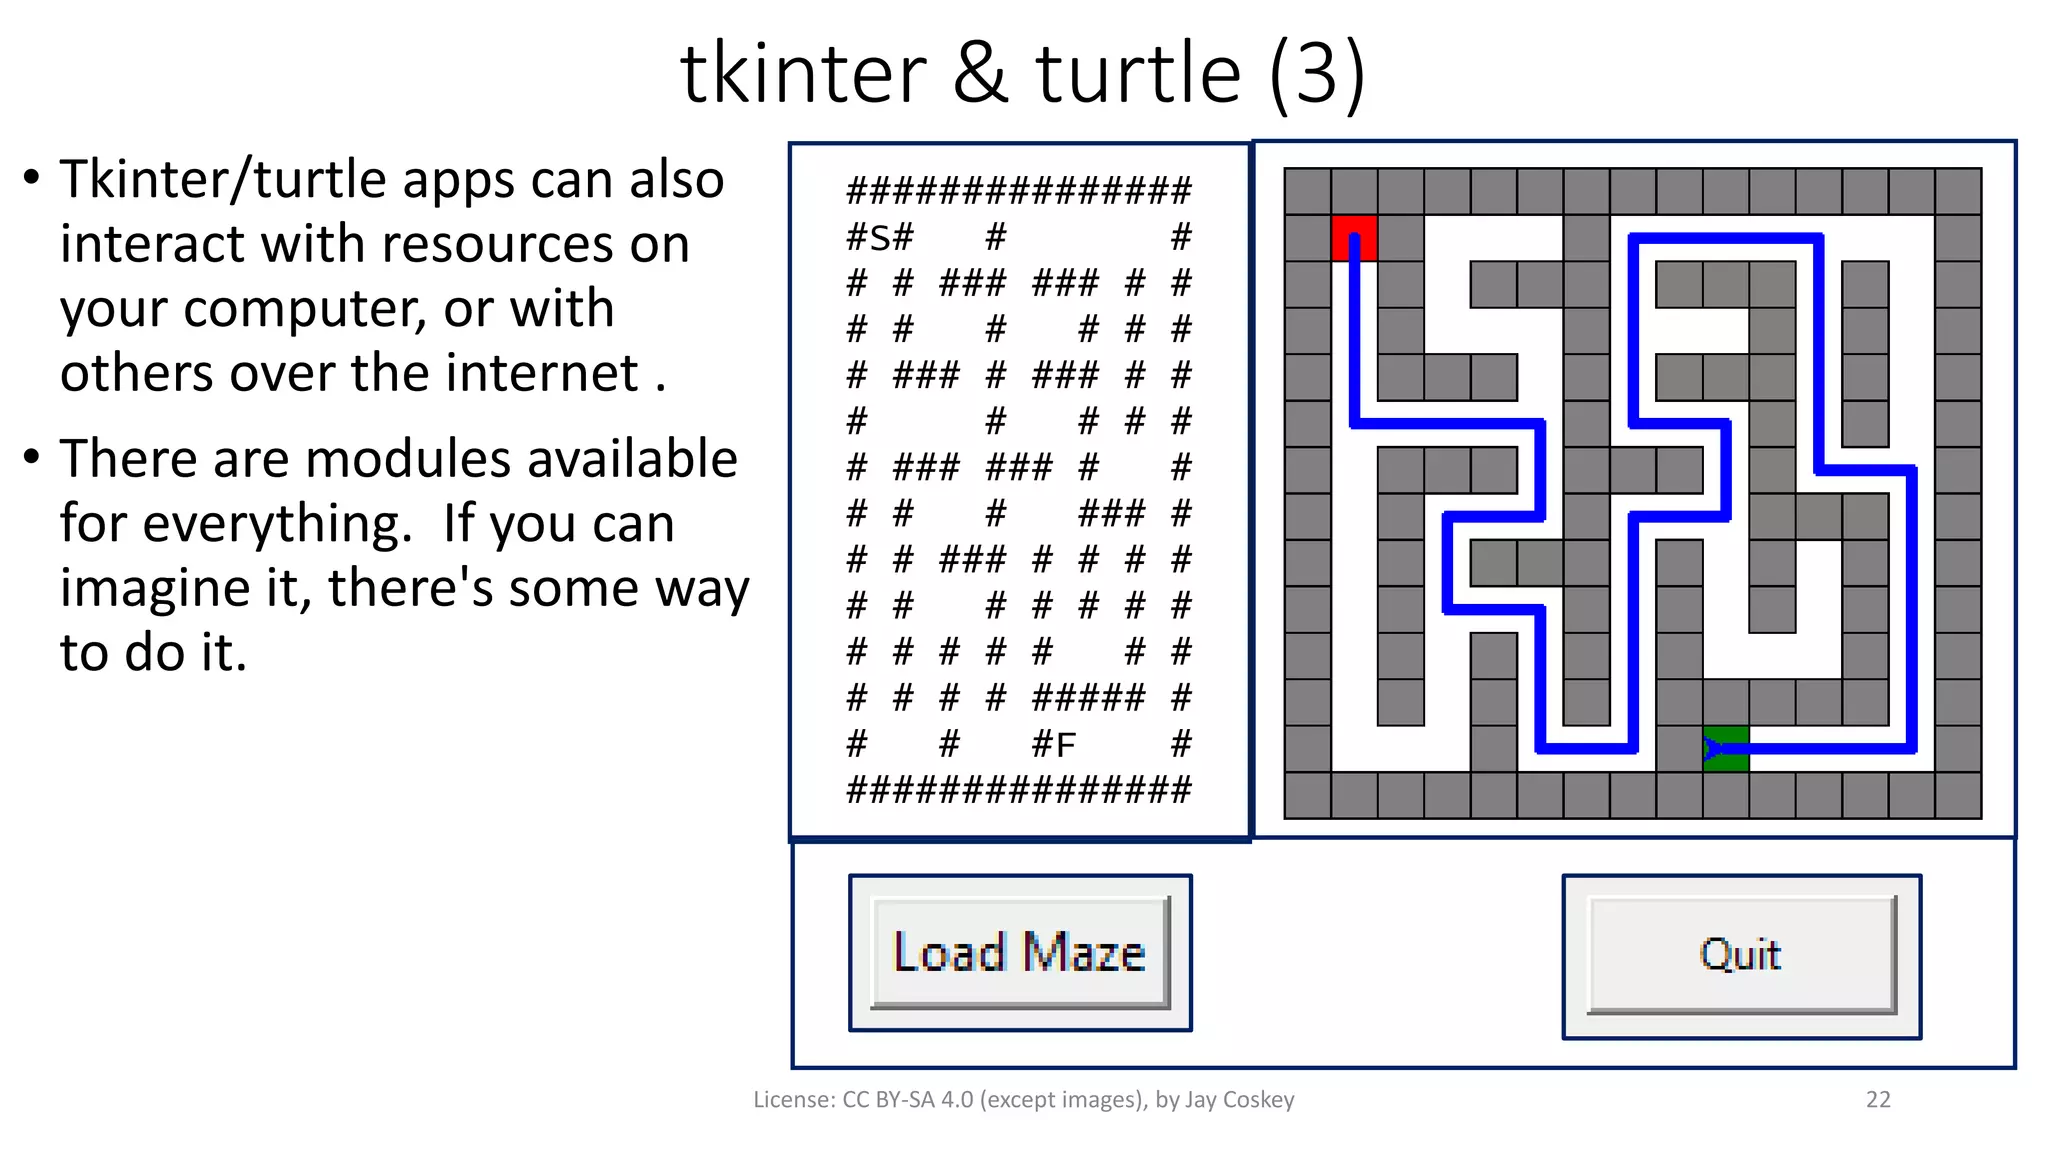
This document provides an introduction to GUI programming using Tkinter and turtle graphics in Python. It discusses how turtle programs use Tkinter to create windows and display graphics. Tkinter is a Python package for building graphical user interfaces based on the Tk widget toolkit. Several examples are provided on how to use turtle graphics to draw shapes, add color and interactivity using keyboard and mouse inputs. GUI programming with Tkinter allows creating more complex programs and games beyond what can be done with turtle graphics alone.


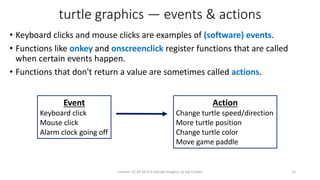


![Tkinter — Hello, world!
# From docs.python.org/3/library/Tkinter.html
import tkinter as tk
class Application(tk.Frame):
def __init__(self, master=None):
super().__init__(master)
self.pack()
self.create_widgets()
def create_widgets(self):
self.hi_there = tk.Button(self)
self.hi_there["text"] = "Hello Worldn(click me)"
self.hi_there["command"] = self.say_hi
self.hi_there.pack(side="top")
self.quit = tk.Button(self, text="QUIT", fg="red",
command=root.destroy)
self.quit.pack(side="bottom")
def say_hi(self):
print("hi there, everyone!")
root = tk.Tk()
app = Application(master=root)
app.mainloop()
License: CC BY-SA 4.0 (except images), by Jay Coskey 23
Place the "hi_there" button in its parent "frame".
Put all the quit button info in this one statement.
Create a button. Set the button's text.
Loop forever, listening for button clicks. Without this, the program quickly exits.
Set the function to be executed on button click.
Create and initialie the application window.
Place the quit button in its parent "Frame".
Create the application window or "frame".](https://image.slidesharecdn.com/introtopythonhighschoolunit3-170614075346/85/Intro-to-Python-High-School-Unit-3-23-320.jpg)


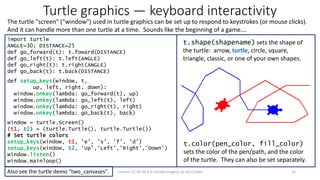
!["ReachOne" step count visualization
# See Question 2(b) on HW #4.
import matplotlib.pyplot as plt
def reachone_next(n: int) -> int:
result = n / 2 if n % 2 == 0 else 3 * n + 1
return result
def reachone_count(n: int) -> int:
count = 0
while n > 1:
count += 1
n = reachone_next(n)
return count
xs = range(1,10001)
ys = [reachone_count(x) for x in xs]
plt.scatter(xs, ys)
plt.show()
License: CC BY-SA 4.0 (except images), by Jay Coskey 31
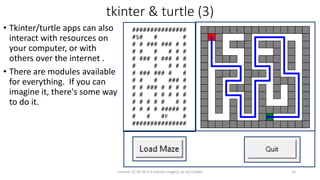
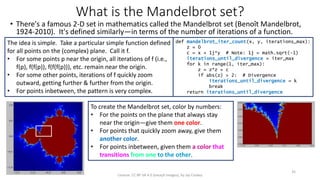
Look — a pattern! One that
would not have become
apparent, except through
such a visualization.](https://image.slidesharecdn.com/introtopythonhighschoolunit3-170614075346/85/Intro-to-Python-High-School-Unit-3-31-320.jpg)
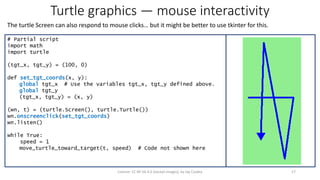
![Palindrome step count visualization (1)
def is_palindrome(n):
return str(n) == str(n)[::-1]
def reachpalindrome_next(n):
return n + int(str(n)[::-1])
def reachpalindrome_step_count(n):
count = 0
while not is_palindrome(n):
count += 1
n = reachpalindrome_next(n)
return count
License: CC BY-SA 4.0 (except images), by Jay Coskey
32
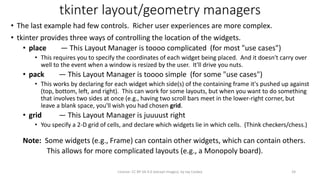
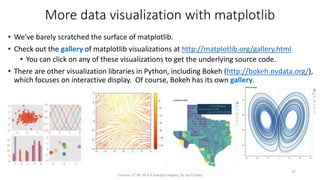
Let's try something similar, but
• Have the "step" be reversing the digits of a number and adding the reversed number to the original
• Repeat until the result is a palindrom, and count the number of steps until that happens.
If we use the number 176 as
an example, it takes 5 steps to
reach a palindrome.
0: 176
1: 176 + 671 = 847
2: 847 + 748 = 1595
3: 1595 + 5951 = 7546
4: 7546 + 6457 = 14003
5: 14003 + 30041 = 44044](https://image.slidesharecdn.com/introtopythonhighschoolunit3-170614075346/85/Intro-to-Python-High-School-Unit-3-32-320.jpg)
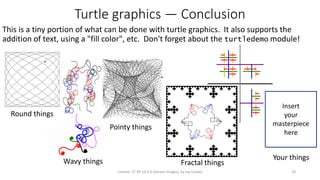
![Palindrome step count visualization (2)
import matplotlib.pyplot as plt
<... functions as on previous slide ...>
pxs = range(1,101)
pys = [reachpalindrome_step_count(px) for px in pxs]
plt.scatter(pxs, pys)
plt.title('ReachPalindrome steps')
plt.xlim(-1,101)
plt.ylim(-1,25)
plt.xlabel('Value')
plt.ylabel('Step count')
for px in pxs:
if pys[px - 1] > 10:
py = pys[px - 1]
plt.annotate('({0},{1})'.format(px,py),
xy=(px,py), xytext=(px-50,py-5-(px-89)),
arrowprops=dict(facecolor='black',shrink=0.05))
plt.show()
License: CC BY-SA 4.0 (except images), by Jay Coskey
33
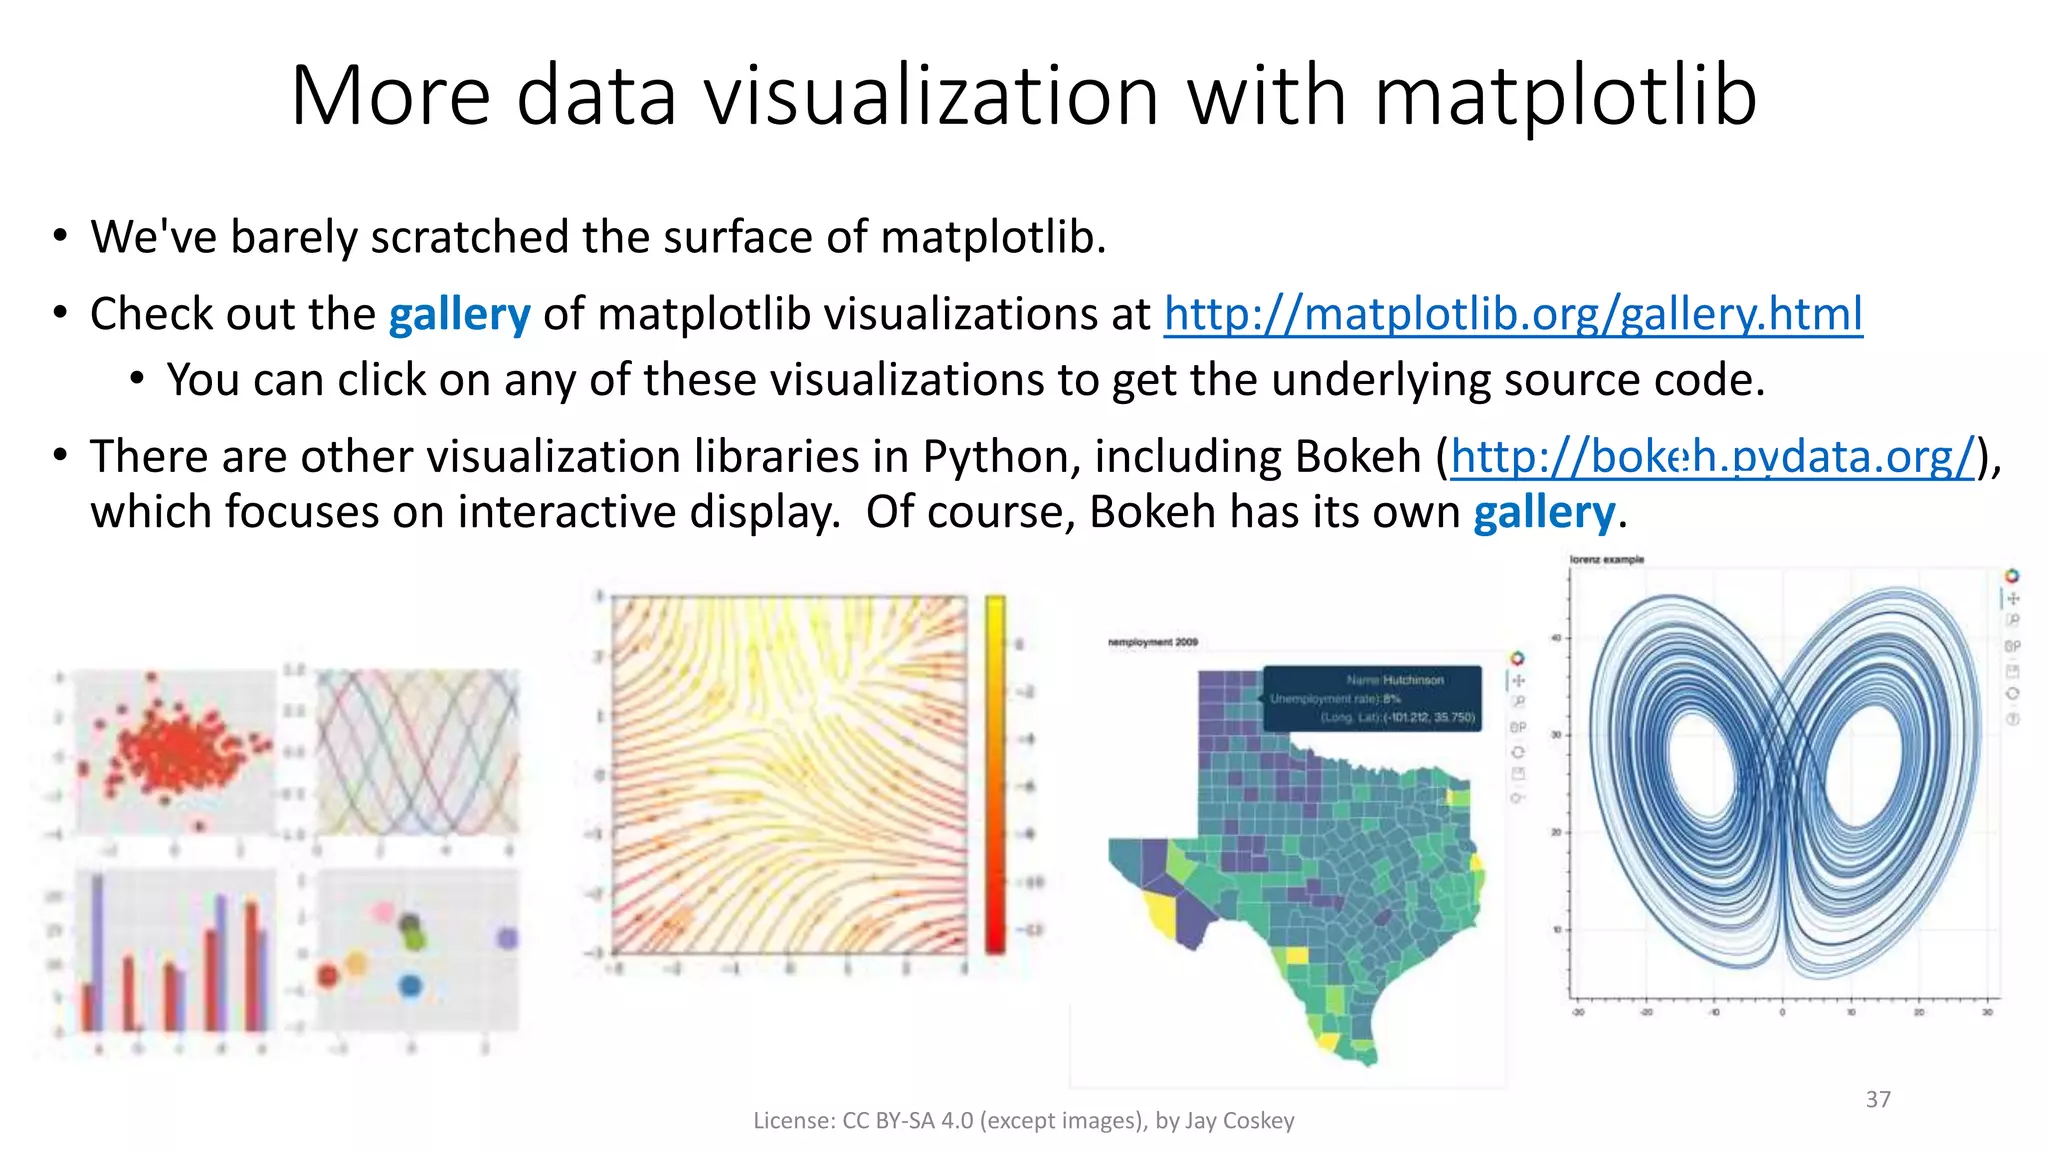
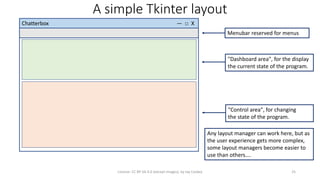
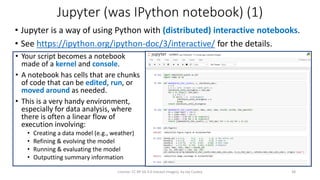
The matplotlib package has support for a broad range of means of visualizations.
• We can add titles, labels, annotations, etc.
• It looks like there are patterns in this "scatterplot" that could lead to other insights….](https://image.slidesharecdn.com/introtopythonhighschoolunit3-170614075346/85/Intro-to-Python-High-School-Unit-3-33-320.jpg)
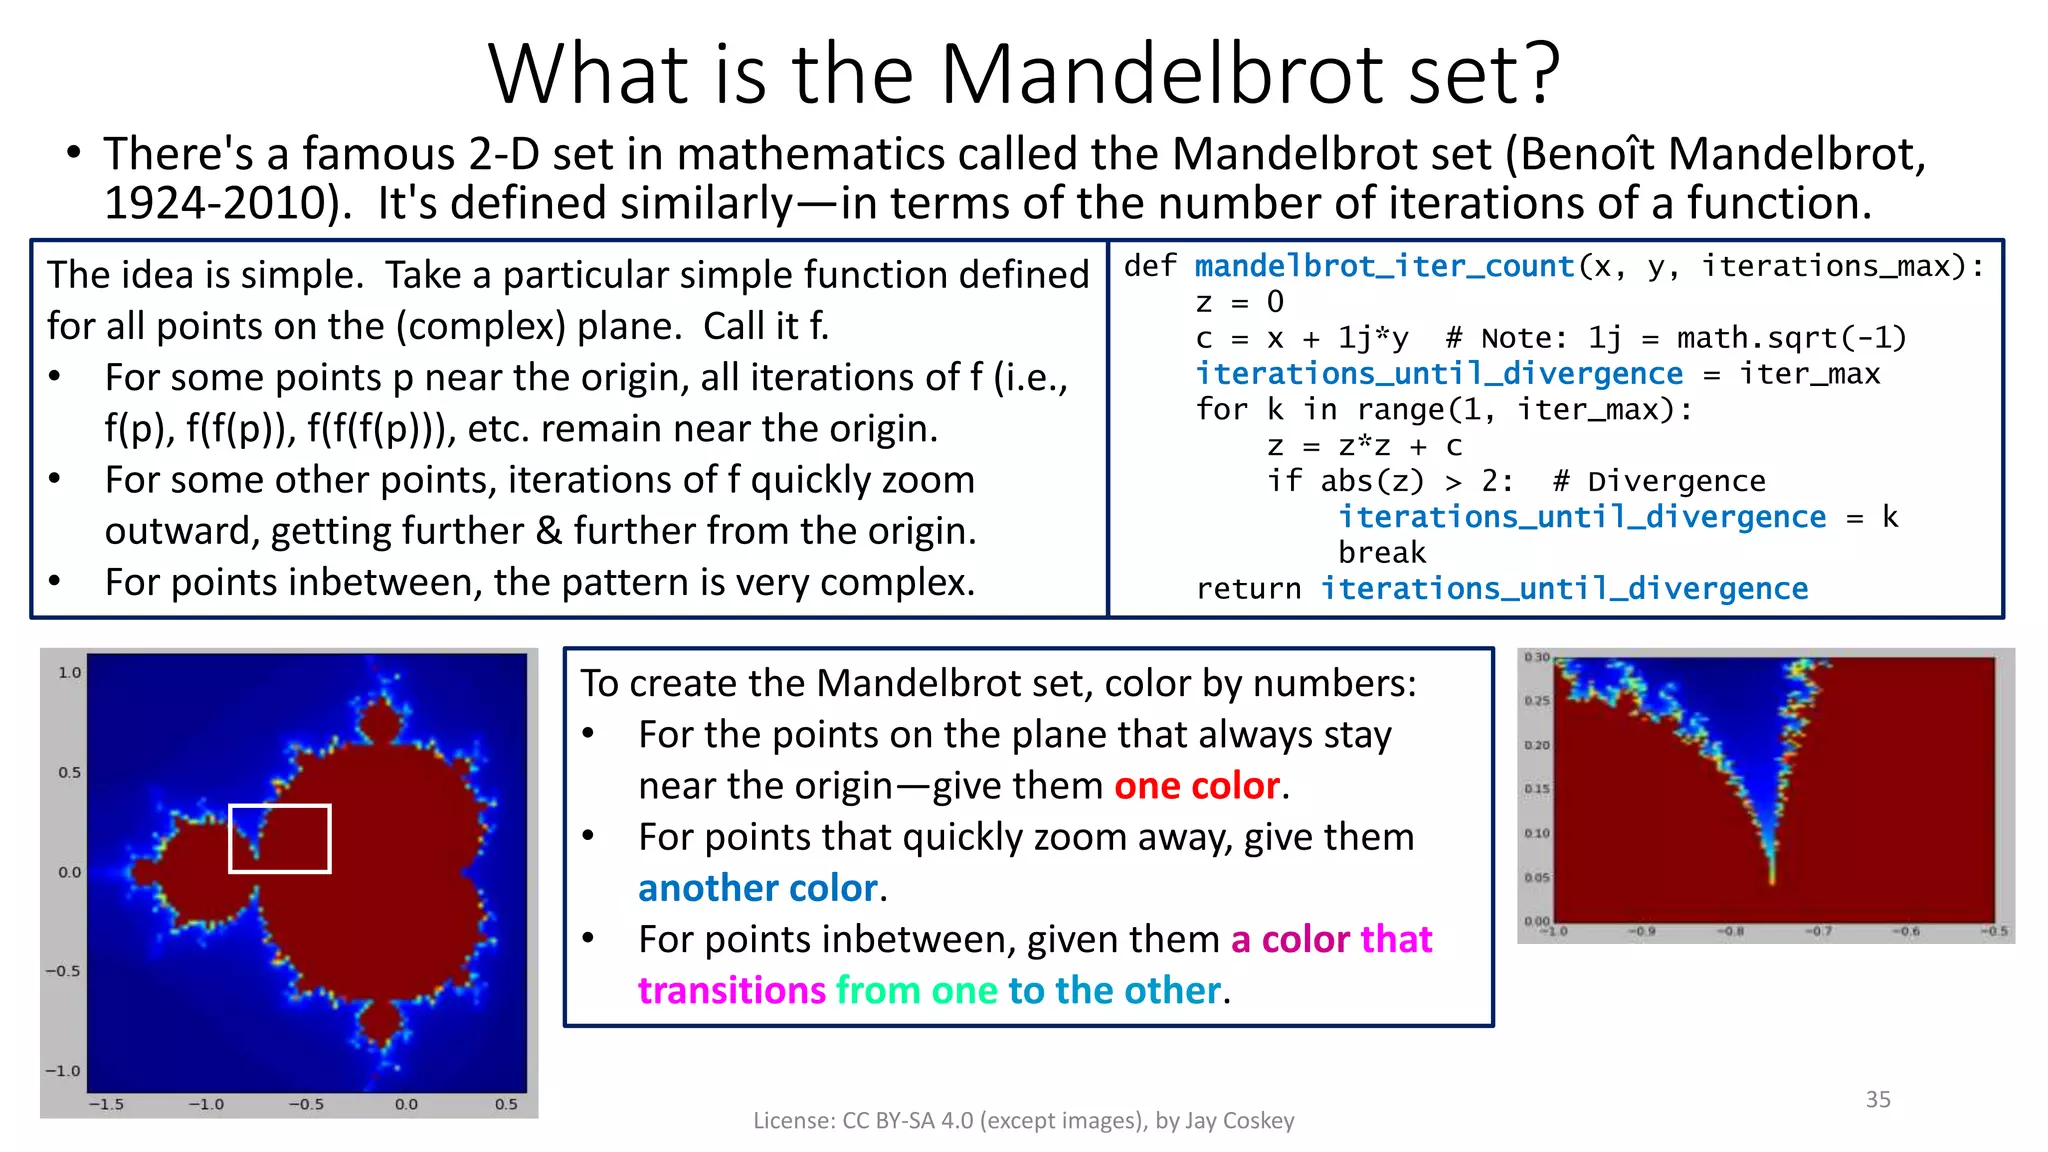
![Mandelbrot set visualization
• I wonder if Mandelbrot liked almond bread. Anyhow, where were we?
License: CC BY-SA 4.0 (except images), by Jay Coskey
36
import matplotlib.pyplot as plt
import numpy as np
def mandelbrot_iter_counts(xmin, xmax, ymin, ymax, nx=500, ny=500, iter_max=500):
dx = (xmax-xmin) / (nx-1)
dy = (ymax-ymin) / (ny-1)
xs = [xmin + i*dx for i in range(nx)]
ys = [ymin + i*dy for i in range(ny)]
return [[mandelbrot_iter_count(x, y, iter_max) for x in xs] for y in ys]
if __name__ == '__main__':
plt.figure()
bounds_all = [-1.6, 0.6, -1.1, 1.1] # The entire set
bounds_a = [-1.0, -0.5, 0.0, 0.3] # Zoom in
bounds_b = [-0.78, -0.73, 0.02, 0.08] # More zoom
bounds_c = [-0.752, -0.749, 0.031, 0.0335] # Enhance!
(xmin, xmax, ymin, ymax) = bounds_all
(nx, ny, iter_max) = (100, 100, 100)
plt.imshow(np.array(mandelbrot_iter_counts(xmin,xmax,ymin,ymax,
nx,ny,iter_max)),
extent=(xmin,xmax,ymin,ymax), origin='lower')
plt.show()
Note: numpy is used for many high-performance computations](https://image.slidesharecdn.com/introtopythonhighschoolunit3-170614075346/85/Intro-to-Python-High-School-Unit-3-36-320.jpg)


![Tkinter — Hello, world!
# From docs.python.org/3/library/Tkinter.html
import tkinter as tk
class Application(tk.Frame):
def __init__(self, master=None):
super().__init__(master)
self.pack()
self.create_widgets()
def create_widgets(self):
self.hi_there = tk.Button(self)
self.hi_there["text"] = "Hello Worldn(click me)"
self.hi_there["command"] = self.say_hi
self.hi_there.pack(side="top")
self.quit = tk.Button(self, text="QUIT", fg="red",
command=root.destroy)
self.quit.pack(side="bottom")
def say_hi(self):
print("hi there, everyone!")
root = tk.Tk()
app = Application(master=root)
app.mainloop()
License: CC BY-SA 4.0 (except images), by Jay Coskey 23
Place the "hi_there" button in its parent "frame".
Put all the quit button info in this one statement.
Create a button. Set the button's text.
Loop forever, listening for button clicks. Without this, the program quickly exits.
Set the function to be executed on button click.
Create and initialie the application window.
Place the quit button in its parent "Frame".
Create the application window or "frame".](https://image.slidesharecdn.com/introtopythonhighschoolunit3-170614075346/75/Intro-to-Python-High-School-Unit-3-23-2048.jpg)


!["ReachOne" step count visualization
# See Question 2(b) on HW #4.
import matplotlib.pyplot as plt
def reachone_next(n: int) -> int:
result = n / 2 if n % 2 == 0 else 3 * n + 1
return result
def reachone_count(n: int) -> int:
count = 0
while n > 1:
count += 1
n = reachone_next(n)
return count
xs = range(1,10001)
ys = [reachone_count(x) for x in xs]
plt.scatter(xs, ys)
plt.show()
License: CC BY-SA 4.0 (except images), by Jay Coskey 31
Look — a pattern! One that
would not have become
apparent, except through
such a visualization.](https://image.slidesharecdn.com/introtopythonhighschoolunit3-170614075346/75/Intro-to-Python-High-School-Unit-3-31-2048.jpg)
![Palindrome step count visualization (1)
def is_palindrome(n):
return str(n) == str(n)[::-1]
def reachpalindrome_next(n):
return n + int(str(n)[::-1])
def reachpalindrome_step_count(n):
count = 0
while not is_palindrome(n):
count += 1
n = reachpalindrome_next(n)
return count
License: CC BY-SA 4.0 (except images), by Jay Coskey
32
Let's try something similar, but
• Have the "step" be reversing the digits of a number and adding the reversed number to the original
• Repeat until the result is a palindrom, and count the number of steps until that happens.
If we use the number 176 as
an example, it takes 5 steps to
reach a palindrome.
0: 176
1: 176 + 671 = 847
2: 847 + 748 = 1595
3: 1595 + 5951 = 7546
4: 7546 + 6457 = 14003
5: 14003 + 30041 = 44044](https://image.slidesharecdn.com/introtopythonhighschoolunit3-170614075346/75/Intro-to-Python-High-School-Unit-3-32-2048.jpg)
![Palindrome step count visualization (2)
import matplotlib.pyplot as plt
<... functions as on previous slide ...>
pxs = range(1,101)
pys = [reachpalindrome_step_count(px) for px in pxs]
plt.scatter(pxs, pys)
plt.title('ReachPalindrome steps')
plt.xlim(-1,101)
plt.ylim(-1,25)
plt.xlabel('Value')
plt.ylabel('Step count')
for px in pxs:
if pys[px - 1] > 10:
py = pys[px - 1]
plt.annotate('({0},{1})'.format(px,py),
xy=(px,py), xytext=(px-50,py-5-(px-89)),
arrowprops=dict(facecolor='black',shrink=0.05))
plt.show()
License: CC BY-SA 4.0 (except images), by Jay Coskey
33
The matplotlib package has support for a broad range of means of visualizations.
• We can add titles, labels, annotations, etc.
• It looks like there are patterns in this "scatterplot" that could lead to other insights….](https://image.slidesharecdn.com/introtopythonhighschoolunit3-170614075346/75/Intro-to-Python-High-School-Unit-3-33-2048.jpg)
![Mandelbrot set visualization
• I wonder if Mandelbrot liked almond bread. Anyhow, where were we?
License: CC BY-SA 4.0 (except images), by Jay Coskey
36
import matplotlib.pyplot as plt
import numpy as np
def mandelbrot_iter_counts(xmin, xmax, ymin, ymax, nx=500, ny=500, iter_max=500):
dx = (xmax-xmin) / (nx-1)
dy = (ymax-ymin) / (ny-1)
xs = [xmin + i*dx for i in range(nx)]
ys = [ymin + i*dy for i in range(ny)]
return [[mandelbrot_iter_count(x, y, iter_max) for x in xs] for y in ys]
if __name__ == '__main__':
plt.figure()
bounds_all = [-1.6, 0.6, -1.1, 1.1] # The entire set
bounds_a = [-1.0, -0.5, 0.0, 0.3] # Zoom in
bounds_b = [-0.78, -0.73, 0.02, 0.08] # More zoom
bounds_c = [-0.752, -0.749, 0.031, 0.0335] # Enhance!
(xmin, xmax, ymin, ymax) = bounds_all
(nx, ny, iter_max) = (100, 100, 100)
plt.imshow(np.array(mandelbrot_iter_counts(xmin,xmax,ymin,ymax,
nx,ny,iter_max)),
extent=(xmin,xmax,ymin,ymax), origin='lower')
plt.show()
Note: numpy is used for many high-performance computations](https://image.slidesharecdn.com/introtopythonhighschoolunit3-170614075346/75/Intro-to-Python-High-School-Unit-3-36-2048.jpg)