In CS 101,we will use Excel to:
1. Store and organize data,
2. Analyze data, and
3. Represent data graphically (e.g., in bar
graphs, histograms, and scatterplots)
3.
Microsoft Excelconsists of Workbooks
Each Workbook is made up of an infinite
number of worksheets
It is possible to name each worksheet to aid
in organizing your data
Excel Basics
4.
Excel Basics
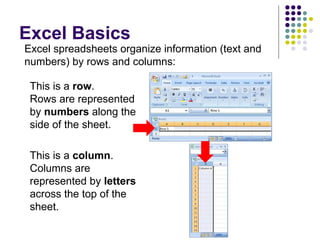
This isa row.
Rows are represented
by numbers along the
side of the sheet.
This is a column.
Columns are
represented by letters
across the top of the
sheet.
Excel spreadsheets organize information (text and
numbers) by rows and columns:
5.
Excel Basics
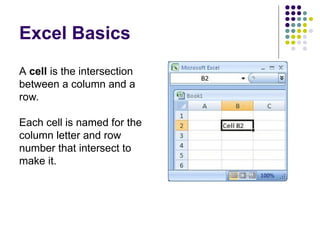
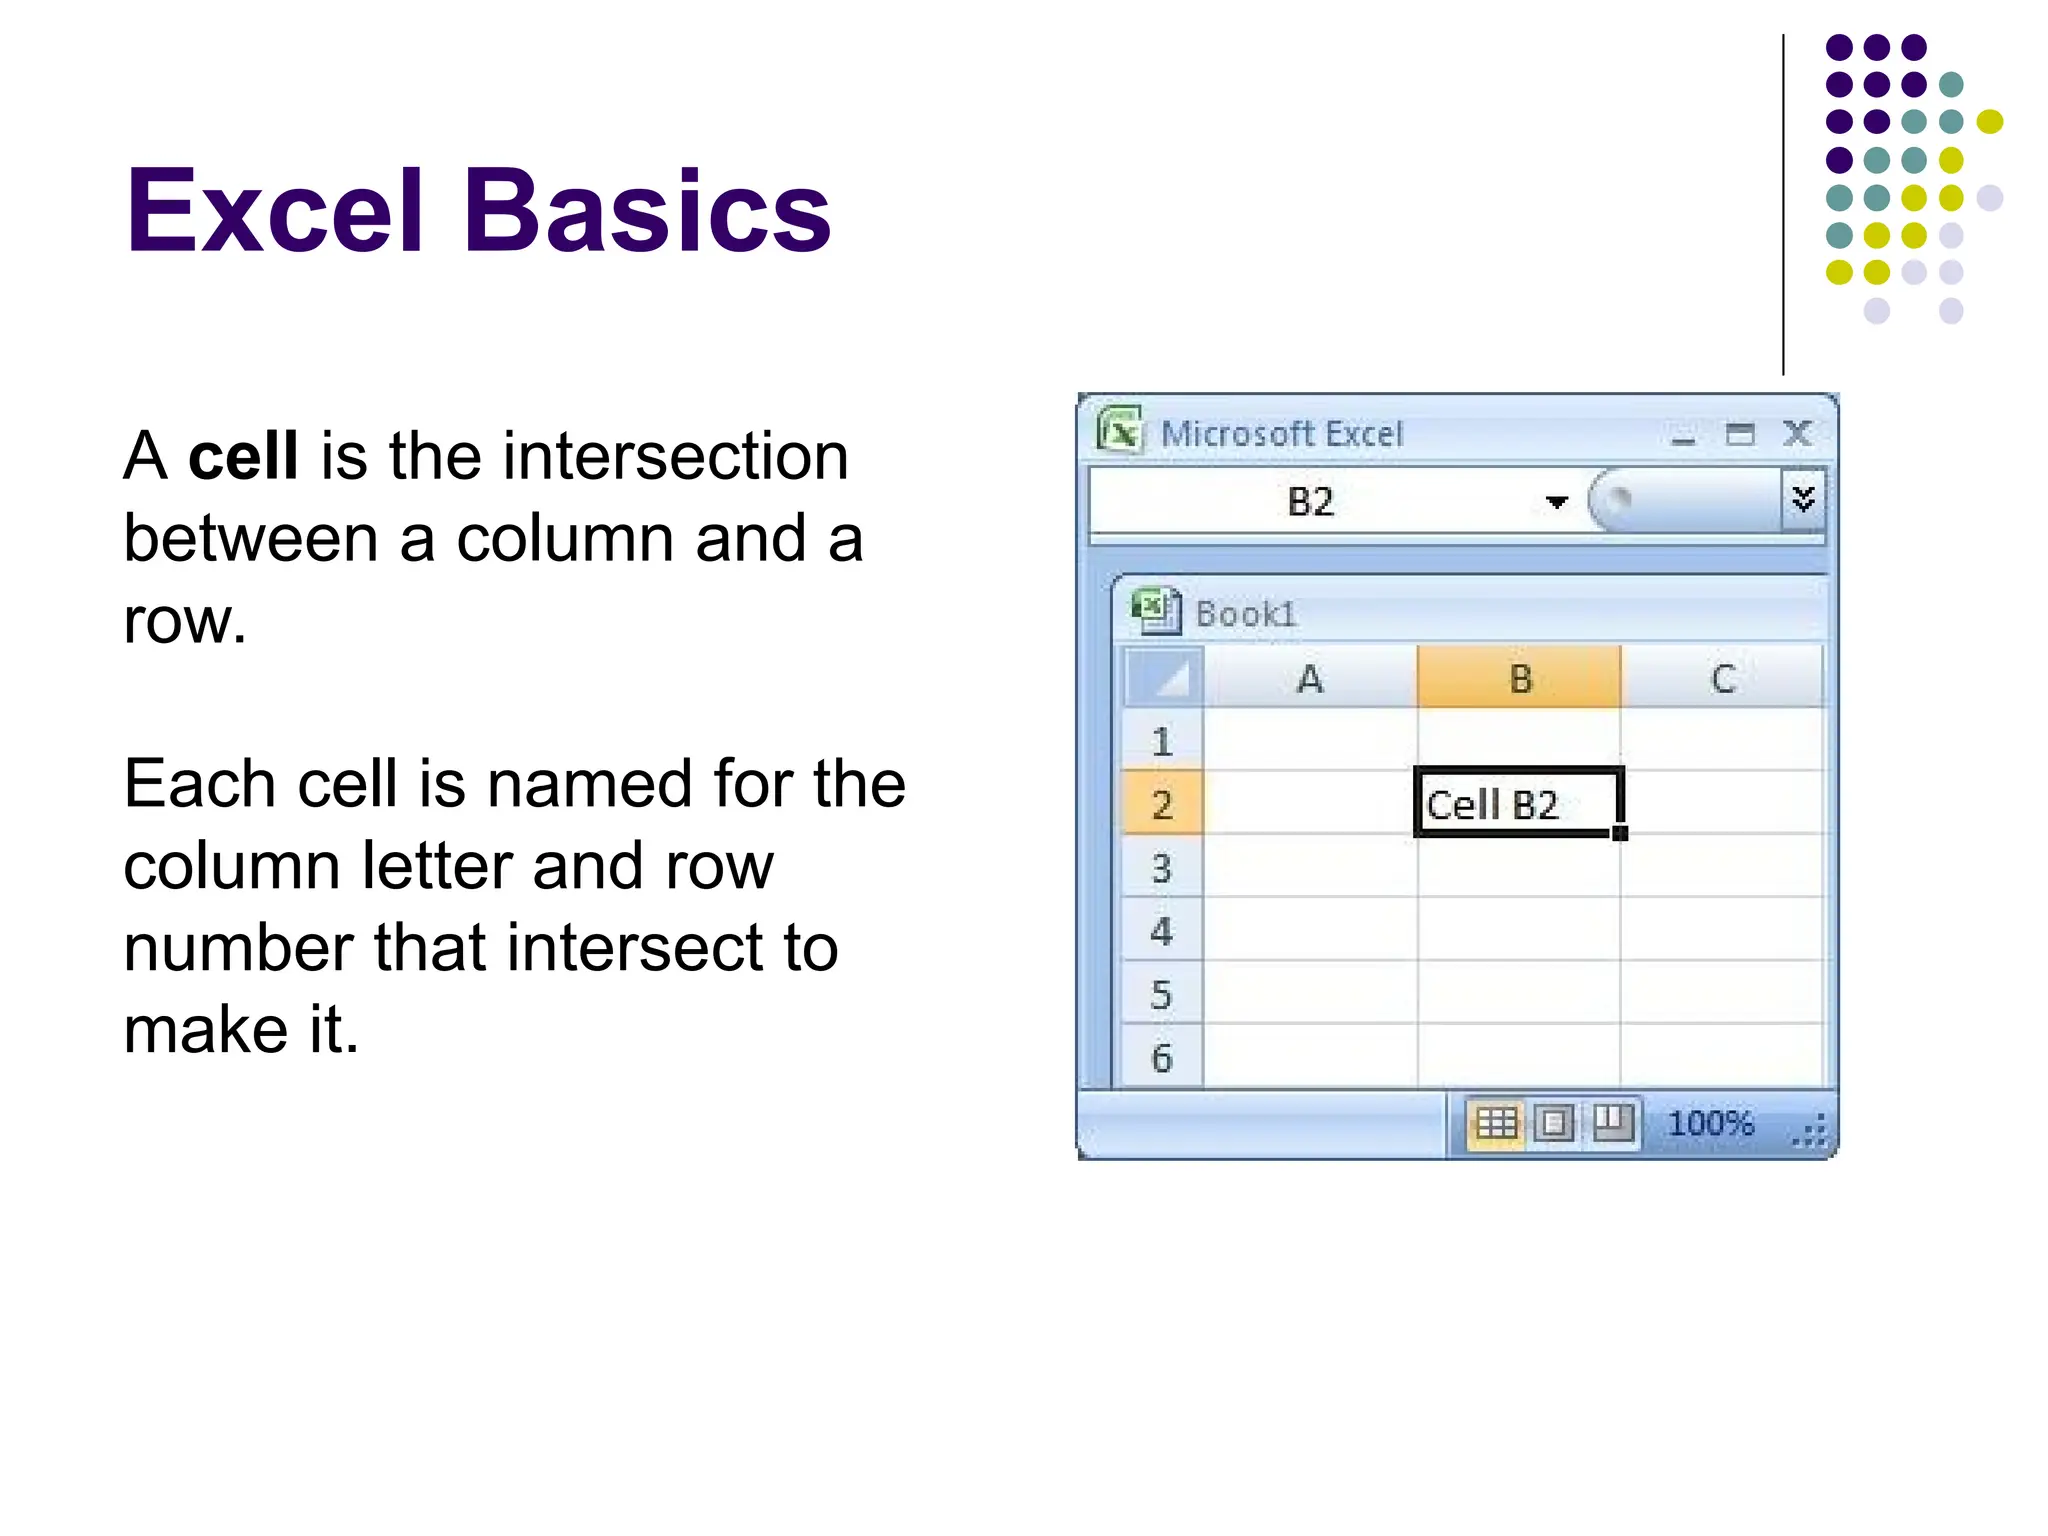
A cellis the intersection
between a column and a
row.
Each cell is named for the
column letter and row
number that intersect to
make it.
6.
Excel Basics
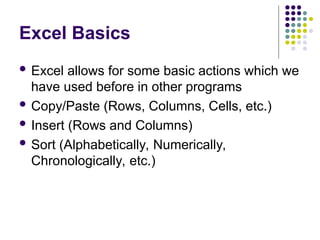
Excelallows for some basic actions which we
have used before in other programs
Copy/Paste (Rows, Columns, Cells, etc.)
Insert (Rows and Columns)
Sort (Alphabetically, Numerically,
Chronologically, etc.)
7.
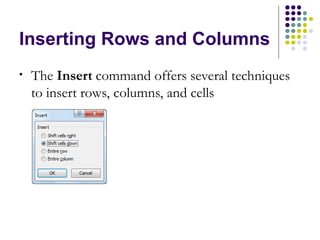
Inserting Rows andColumns
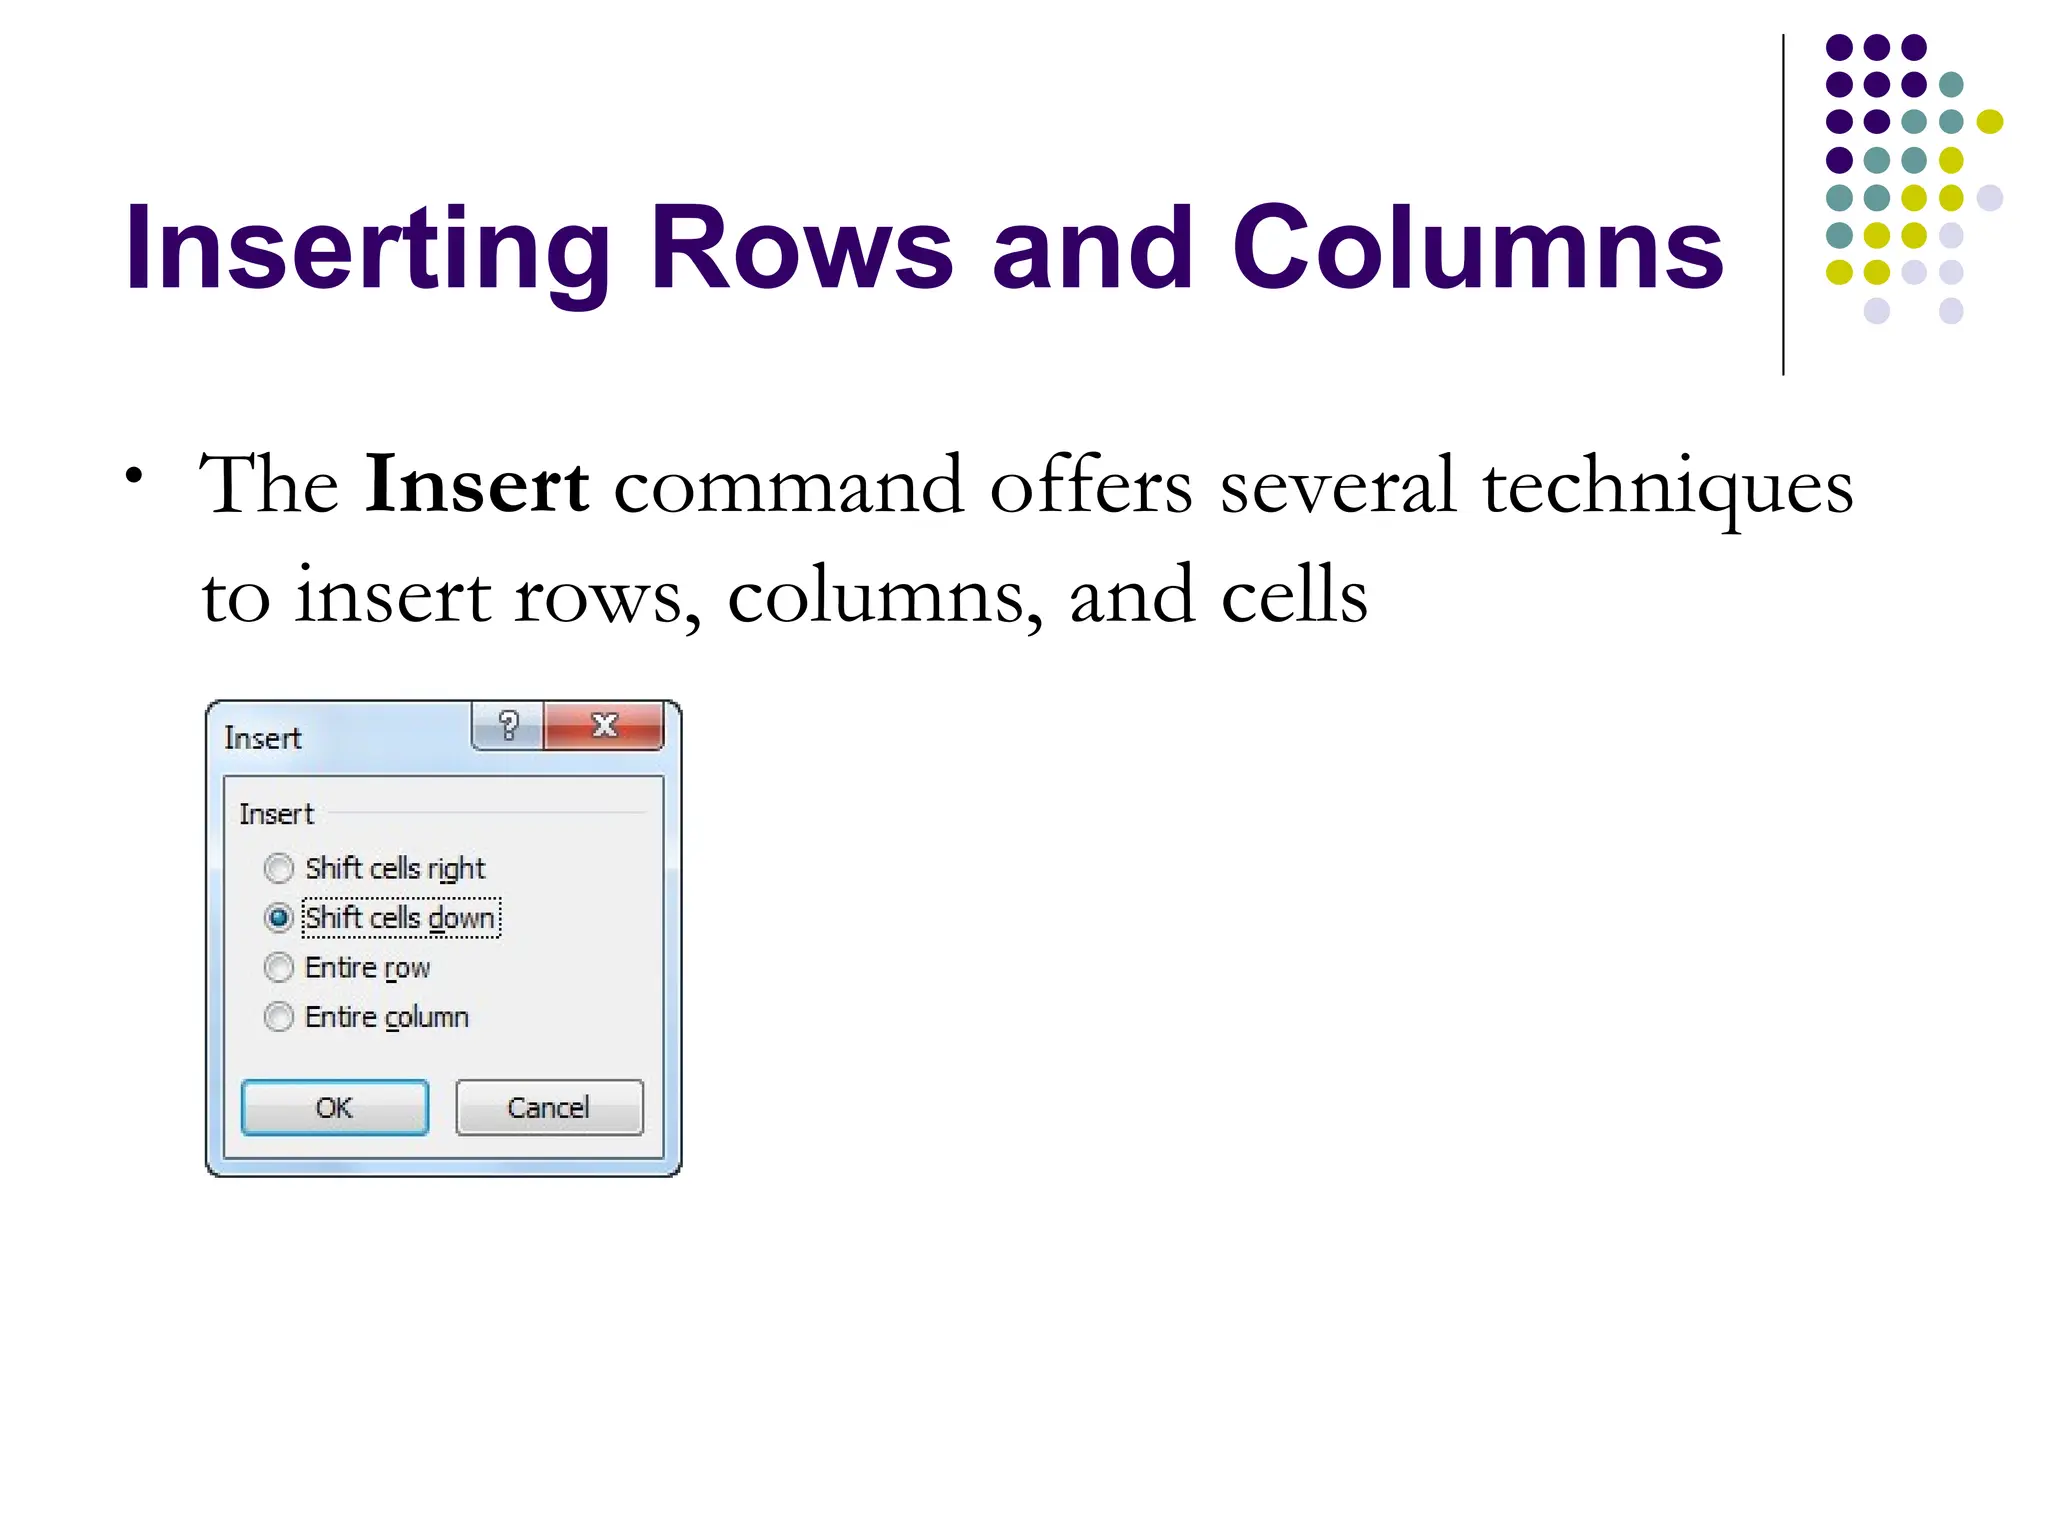
• The Insert command offers several techniques
to insert rows, columns, and cells
8.
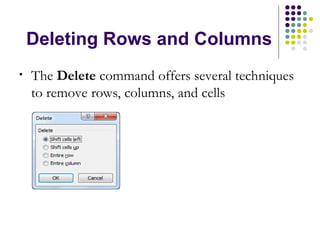
Deleting Rows andColumns
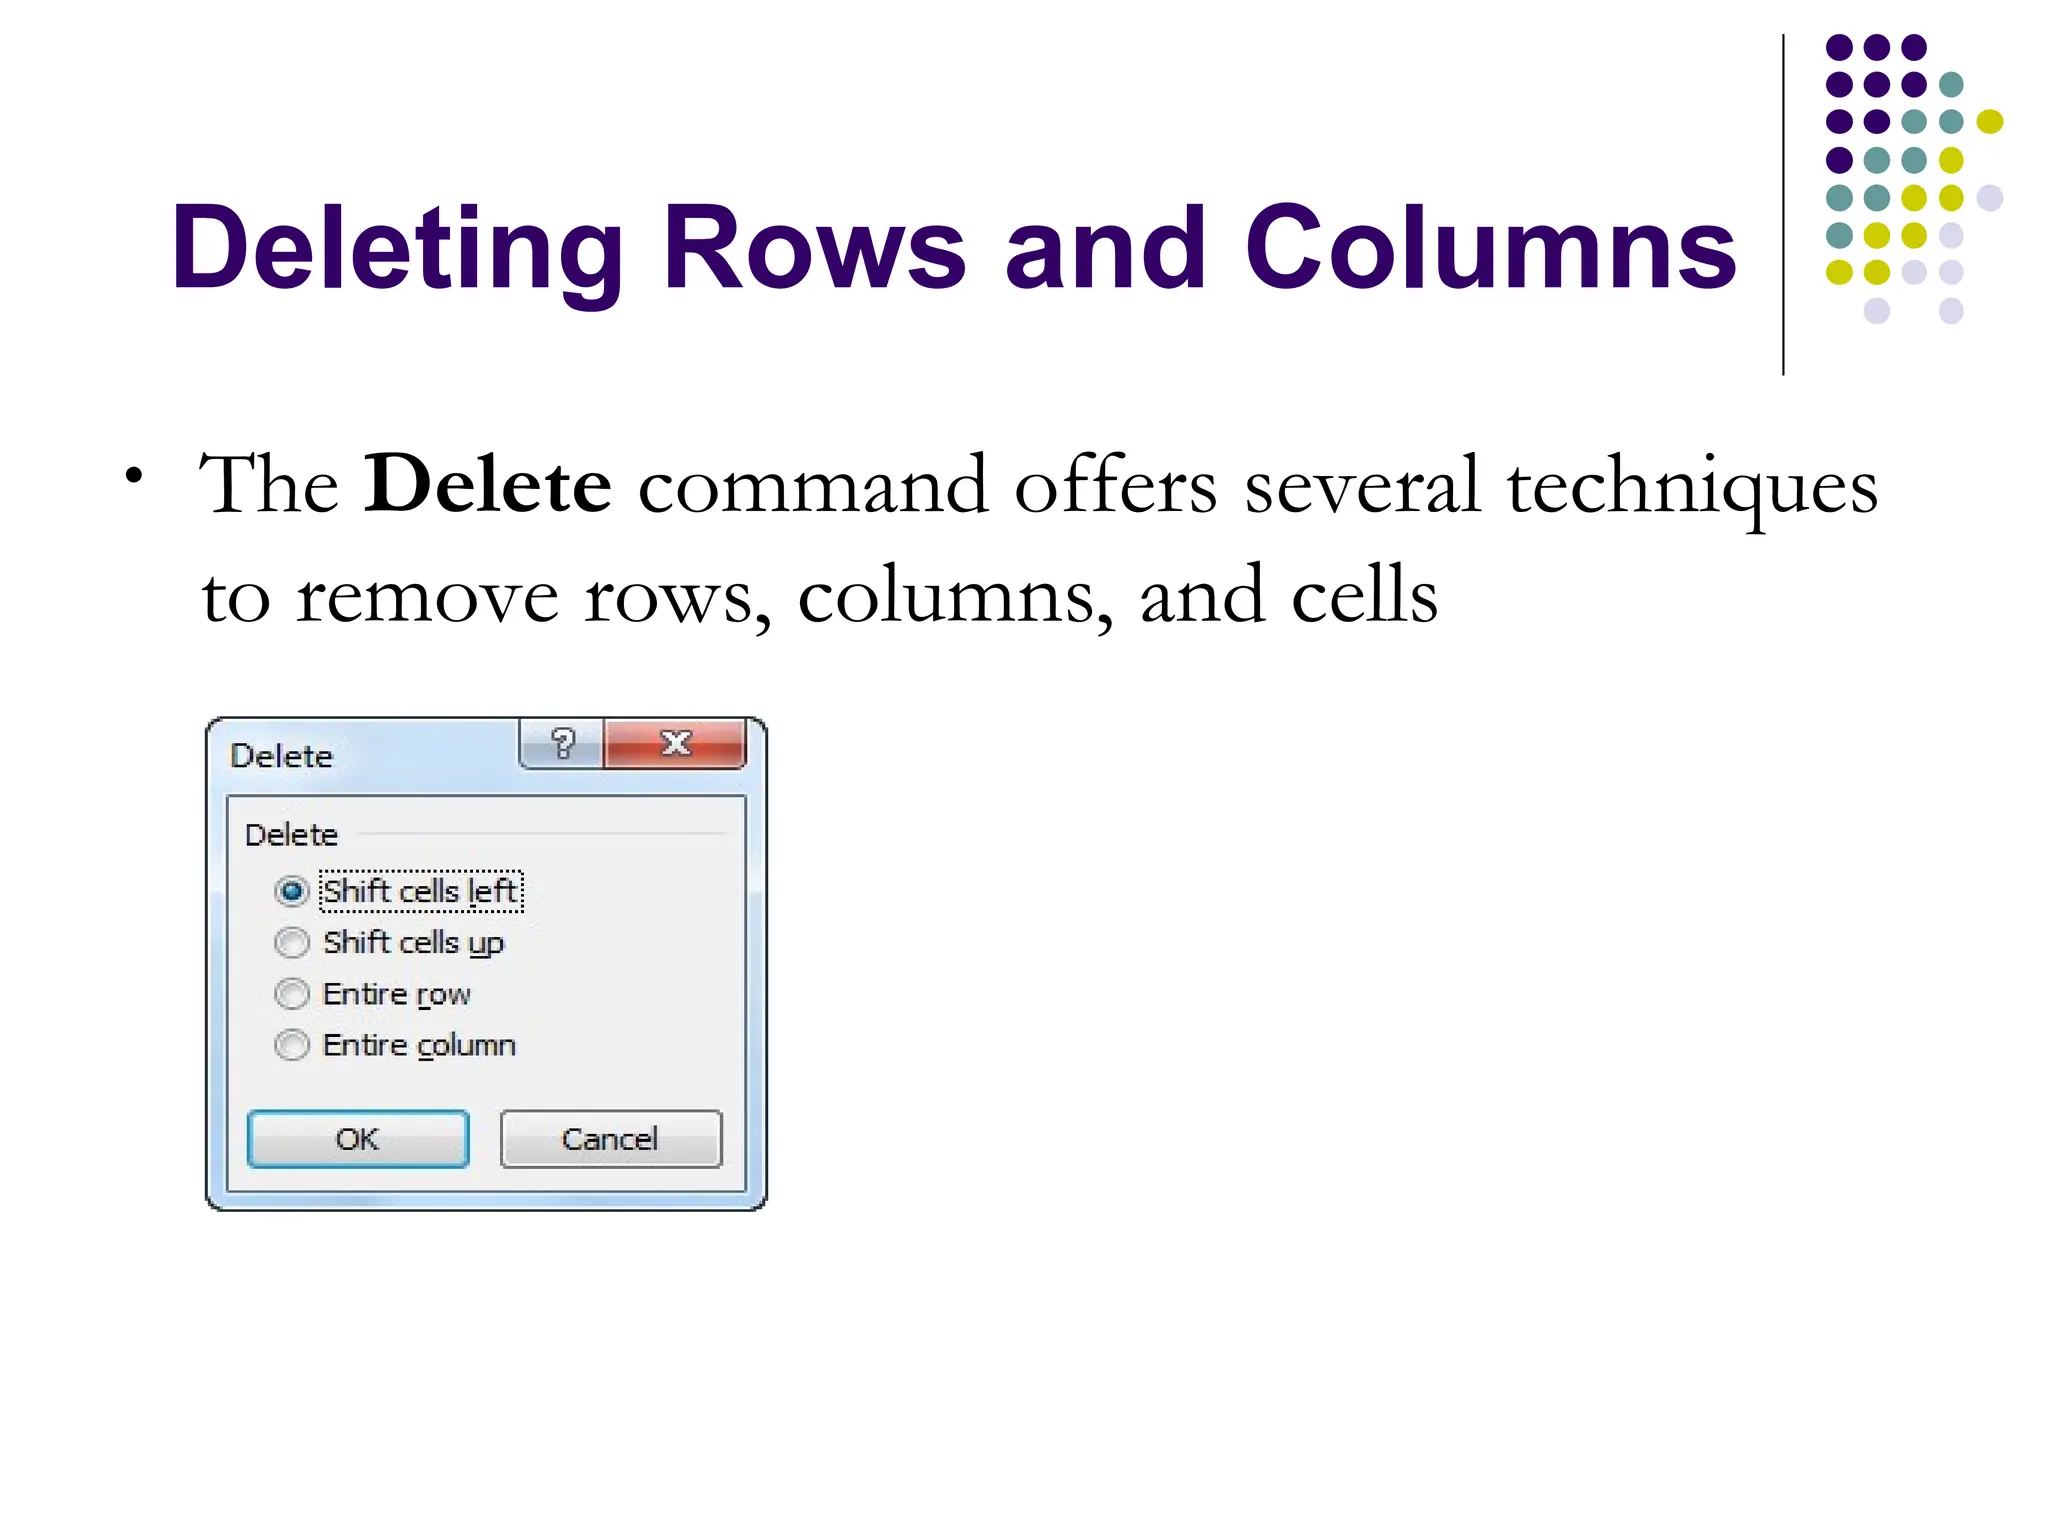
• The Delete command offers several techniques
to remove rows, columns, and cells
9.
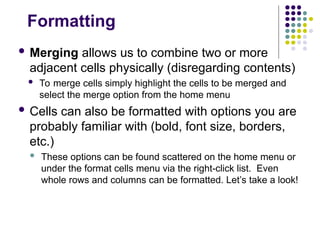
Formatting
Merging allowsus to combine two or more
adjacent cells physically (disregarding contents)
To merge cells simply highlight the cells to be merged and
select the merge option from the home menu
Cells can also be formatted with options you are
probably familiar with (bold, font size, borders,
etc.)
These options can be found scattered on the home menu or
under the format cells menu via the right-click list. Even
whole rows and columns can be formatted. Let’s take a look!
10.
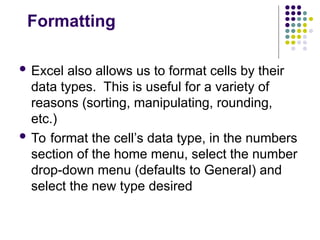
Formatting
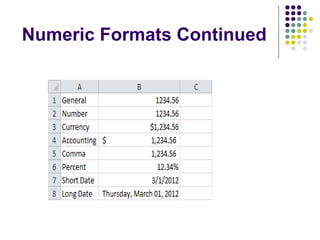
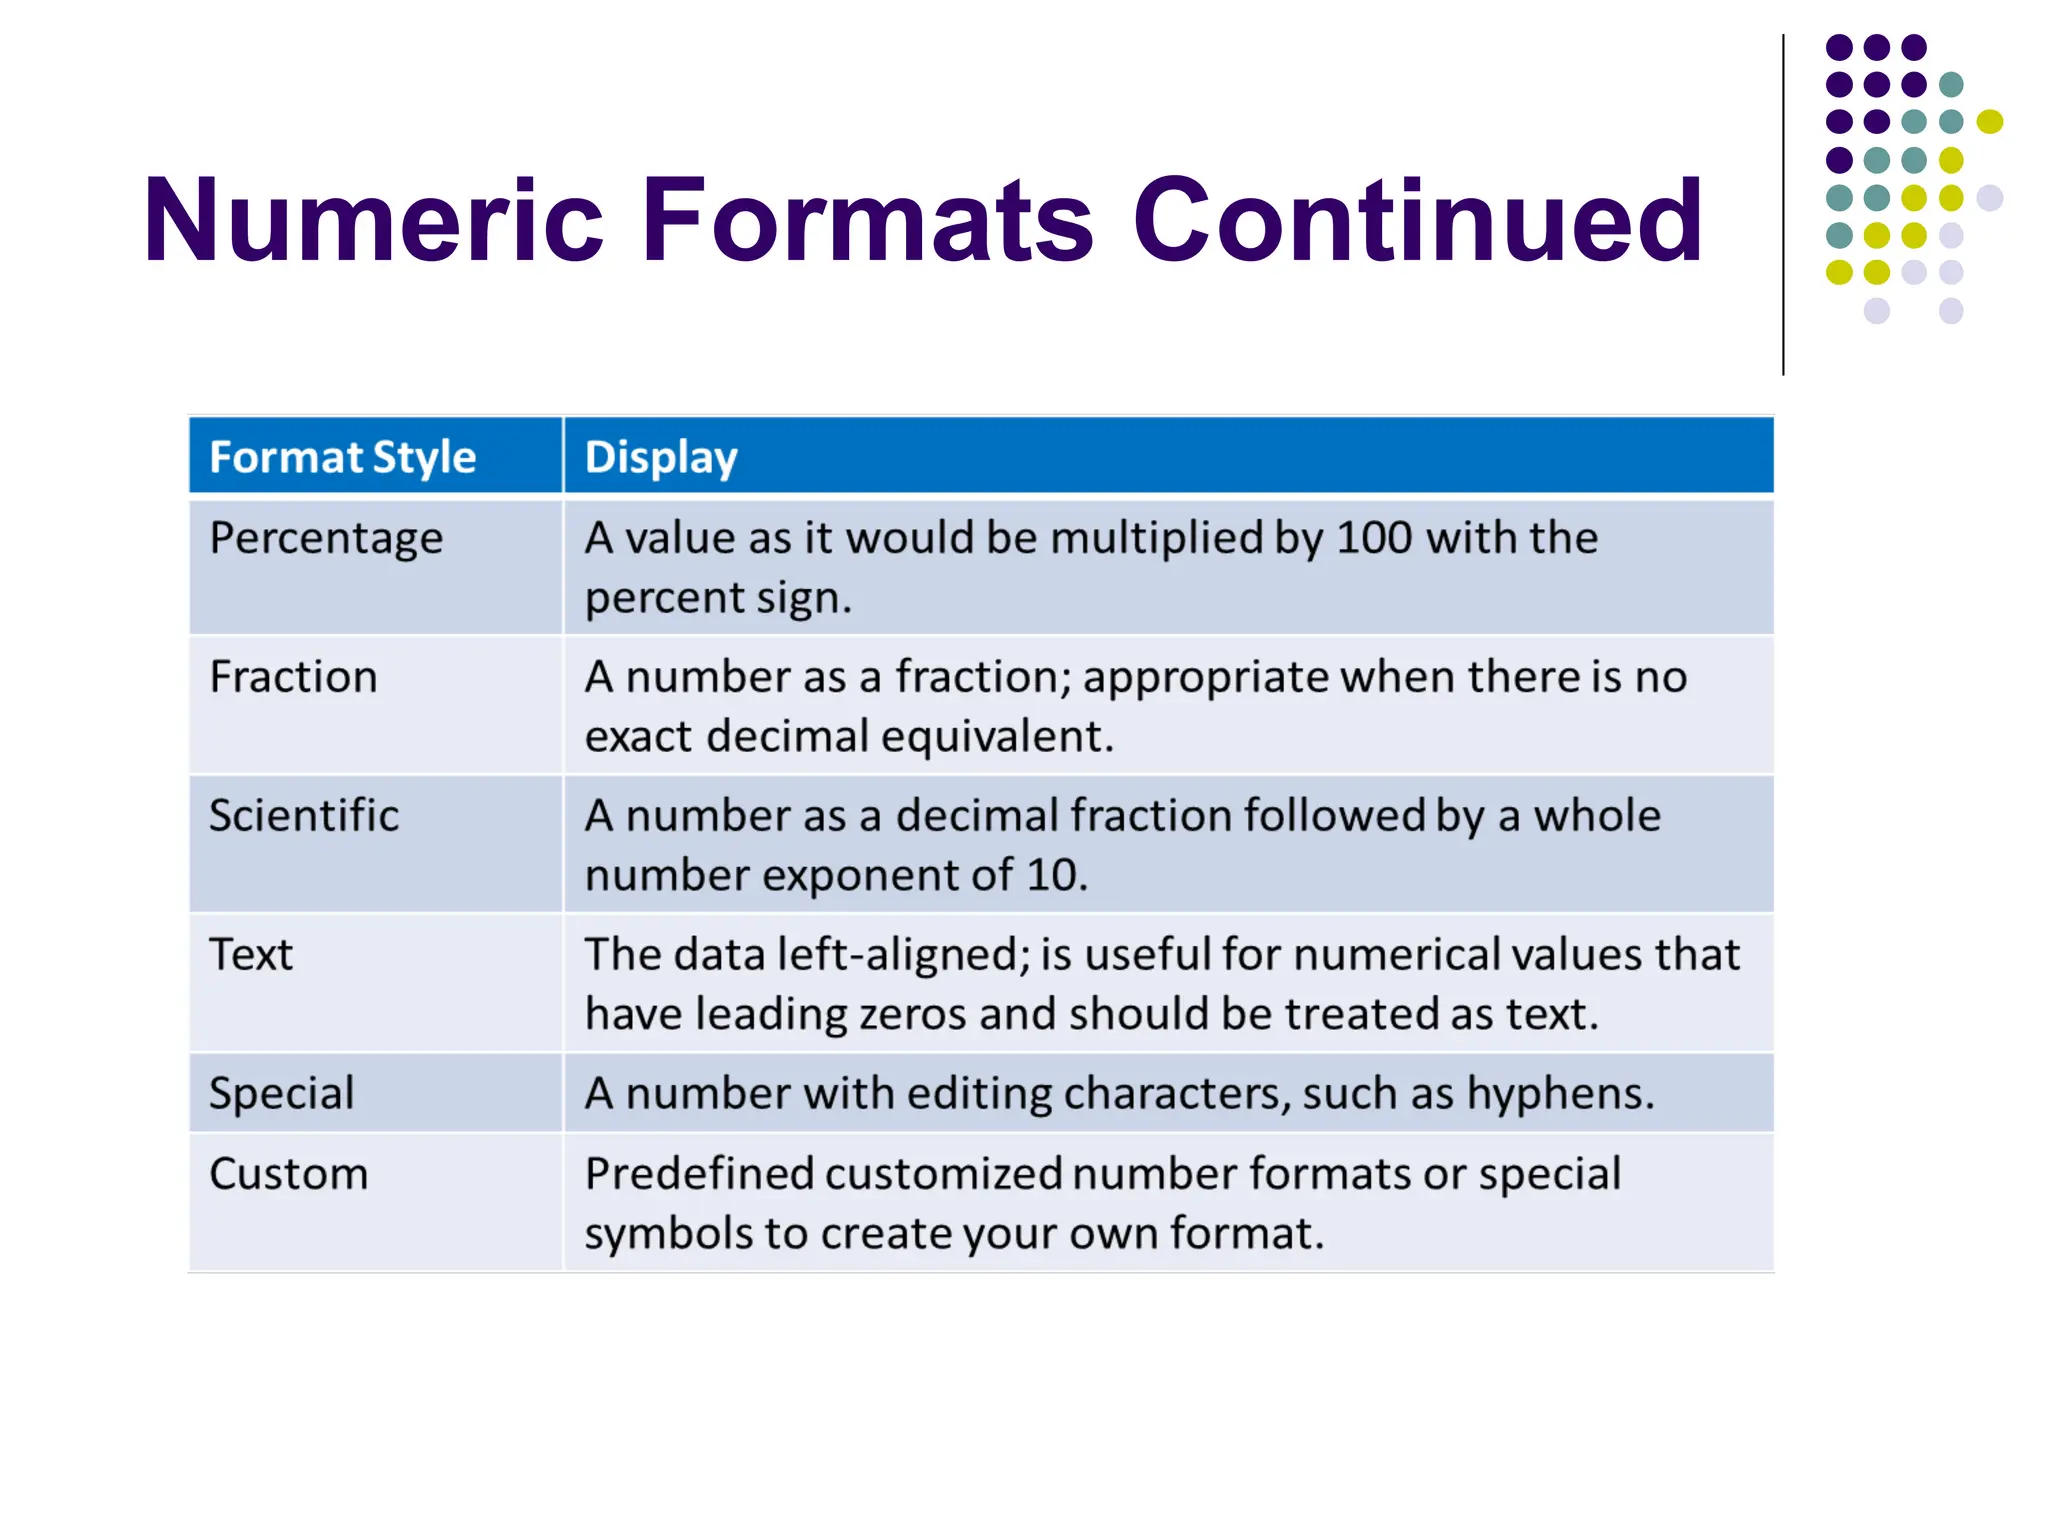
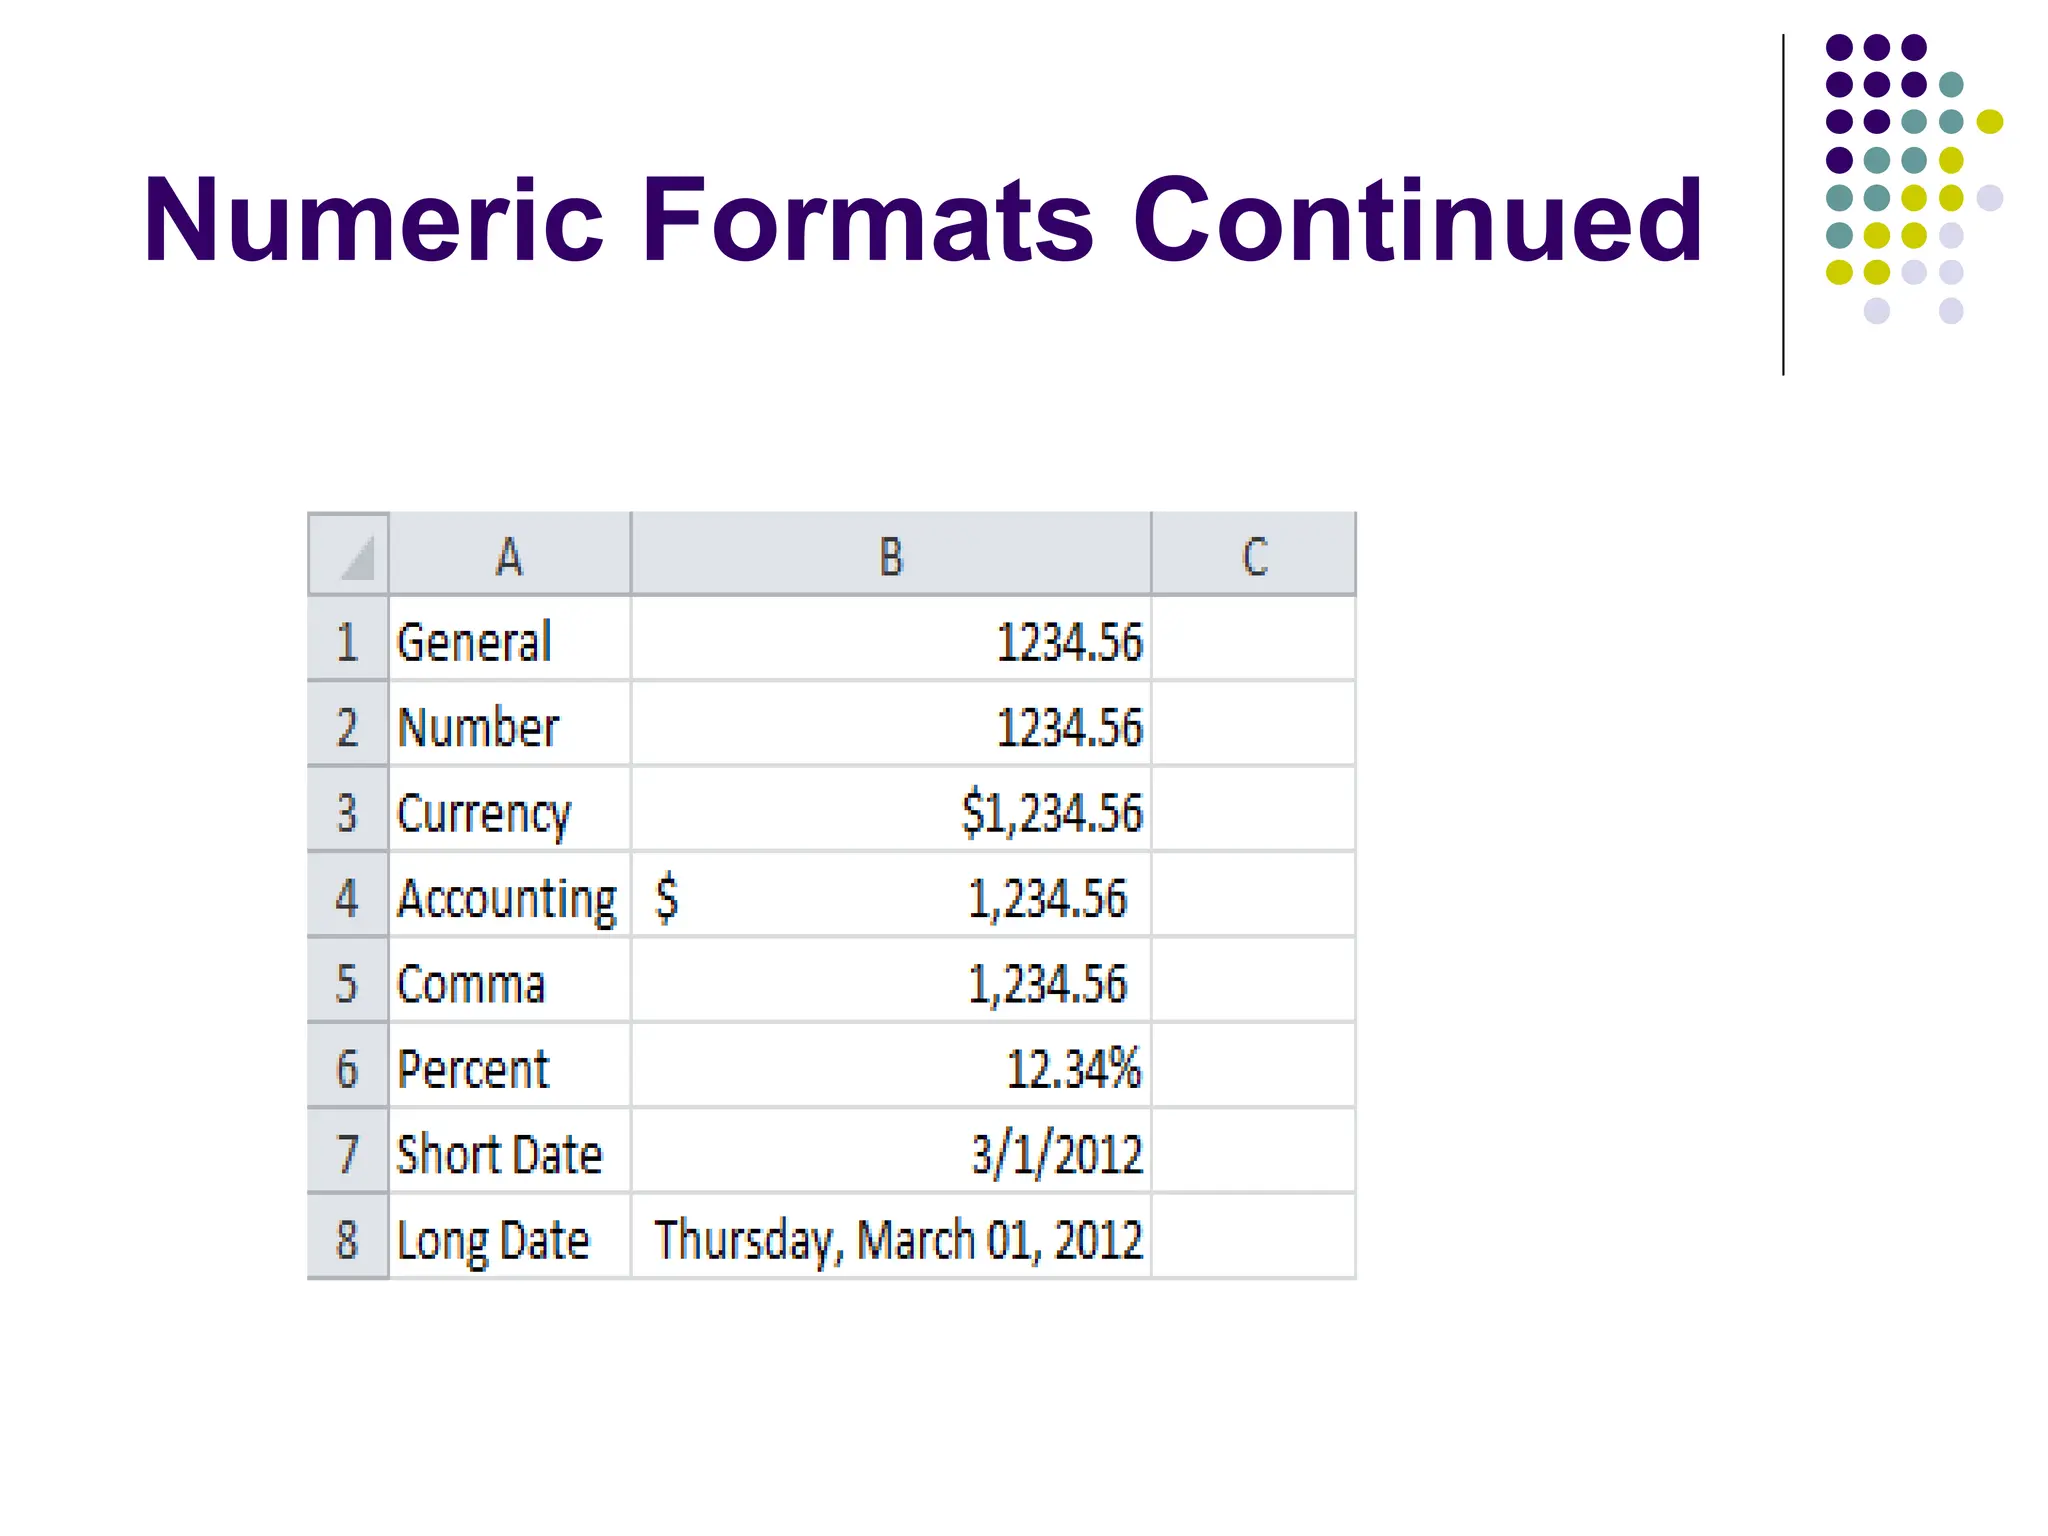
Excel alsoallows us to format cells by their
data types. This is useful for a variety of
reasons (sorting, manipulating, rounding,
etc.)
To format the cell’s data type, in the numbers
section of the home menu, select the number
drop-down menu (defaults to General) and
select the new type desired
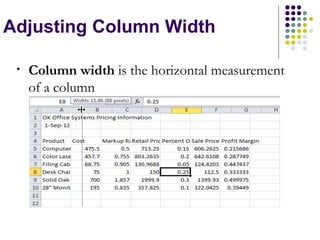
Adjusting Row Height
•Row height is the vertical measurement of a
row
– The row height is automatically adjusted with a font
size increase
– Using ALT+Enter to create multiple lines may
require a row height adjustment
– Select Row Height from the Format menu
13.
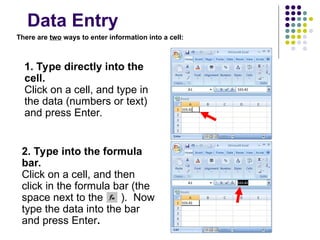
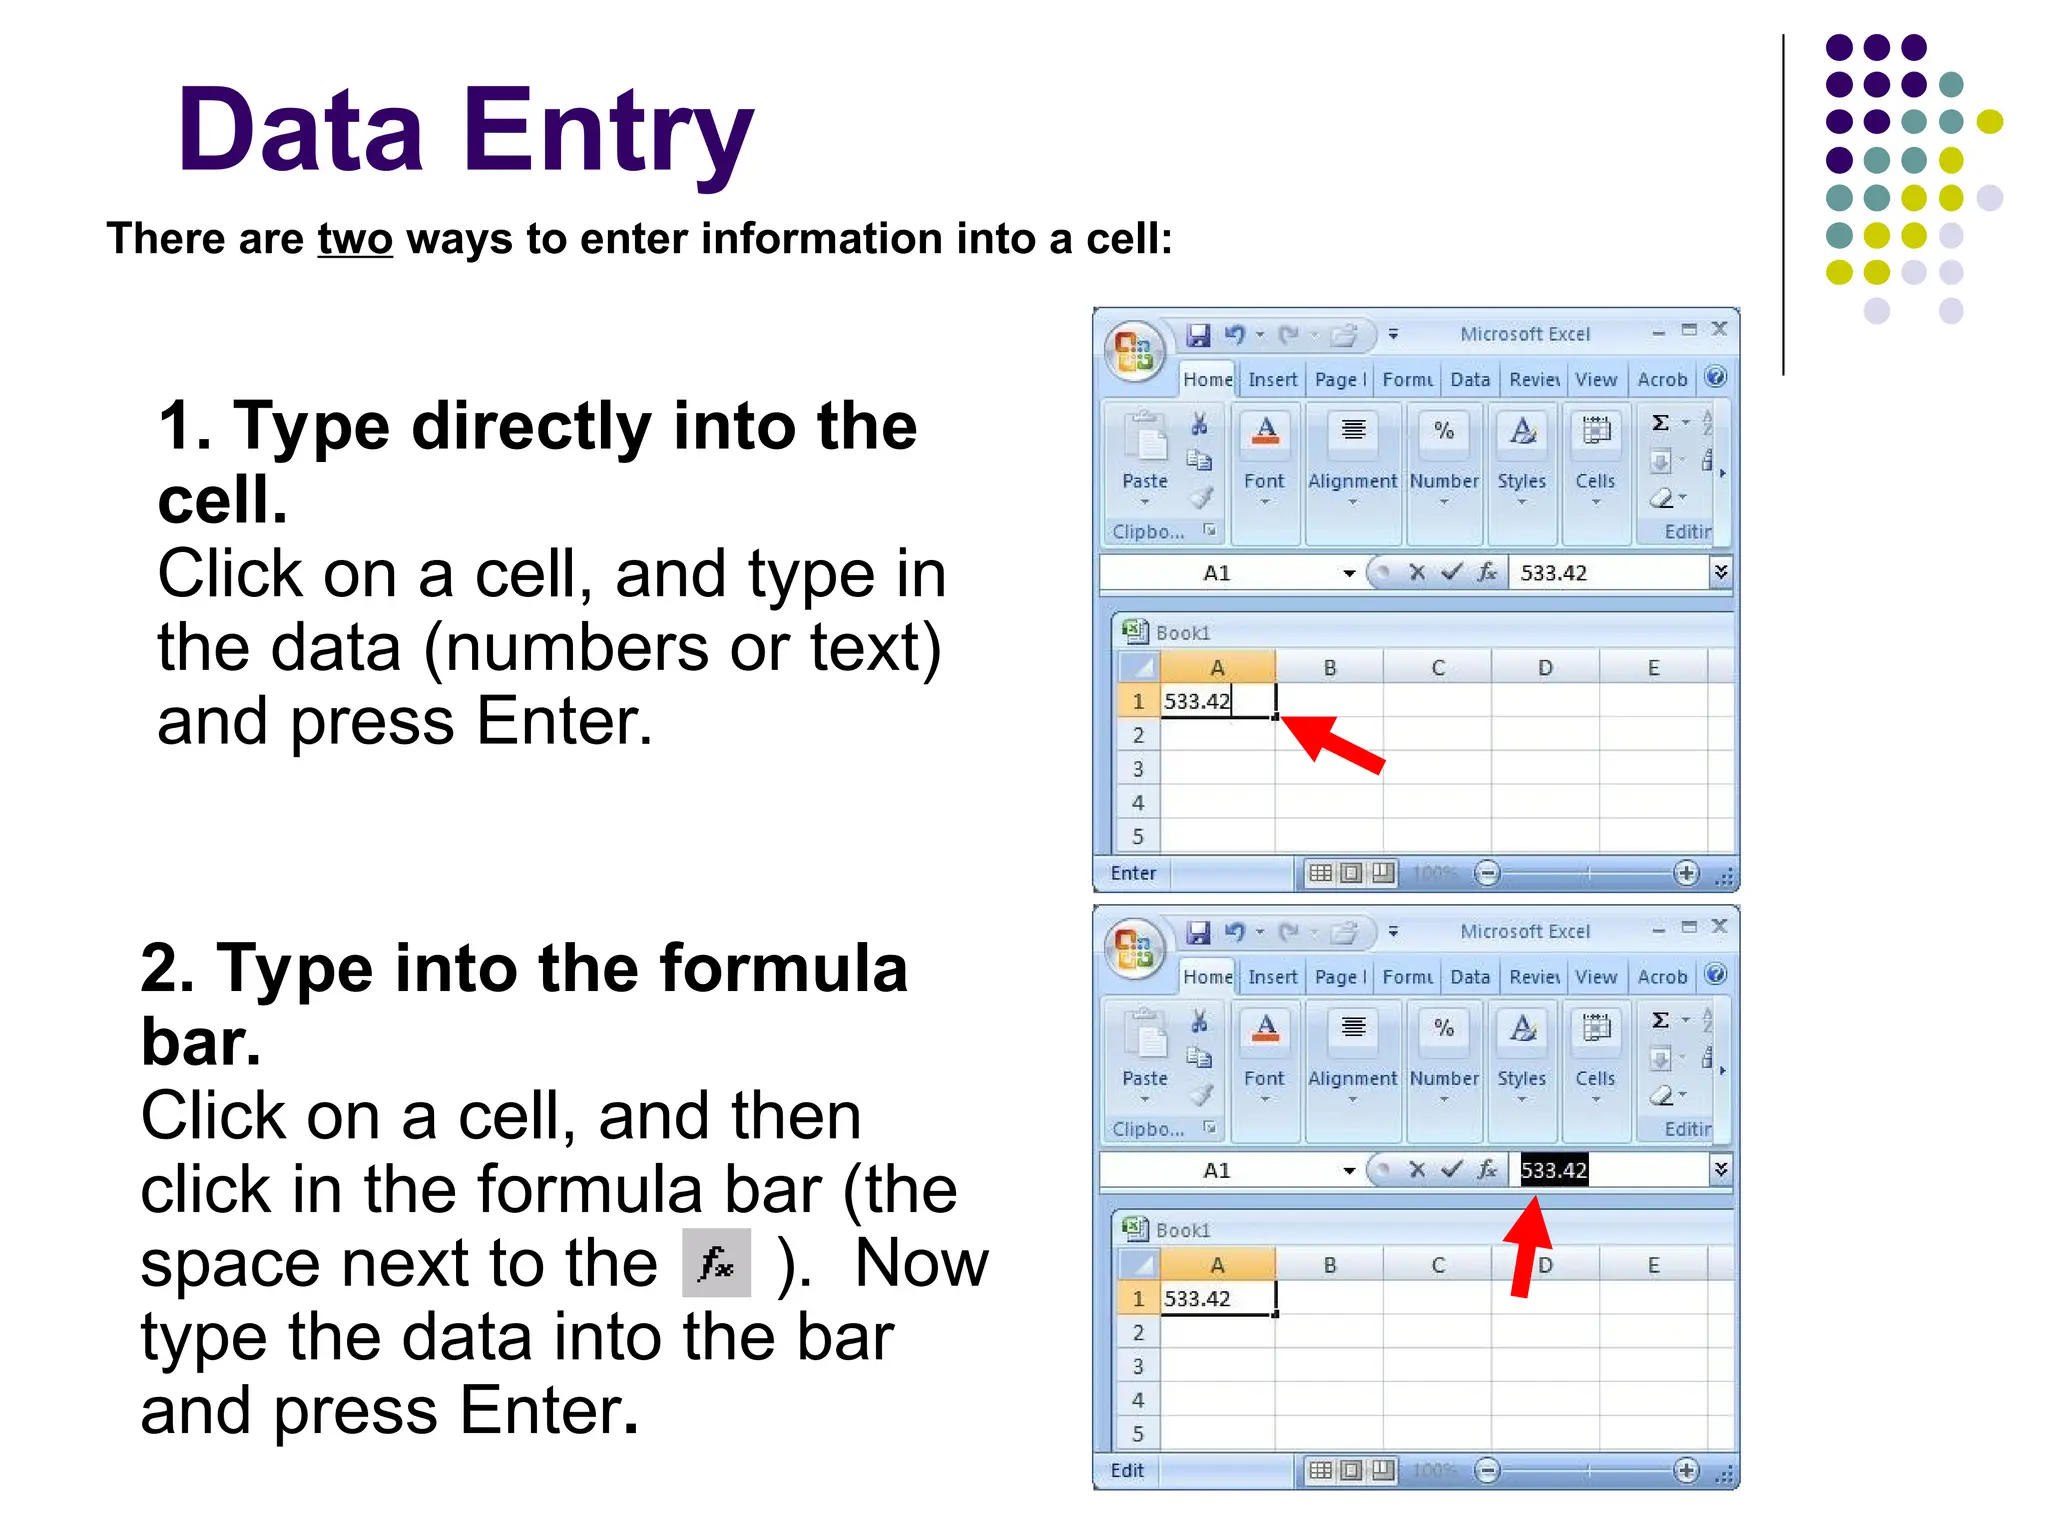
Data Entry
There aretwo ways to enter information into a cell:
1. Type directly into the
cell.
Click on a cell, and type in
the data (numbers or text)
and press Enter.
2. Type into the formula
bar.
Click on a cell, and then
click in the formula bar (the
space next to the ). Now
type the data into the bar
and press Enter.
14.
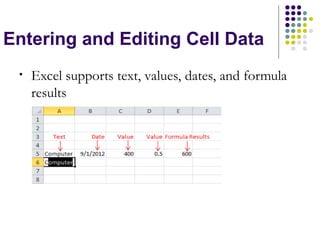
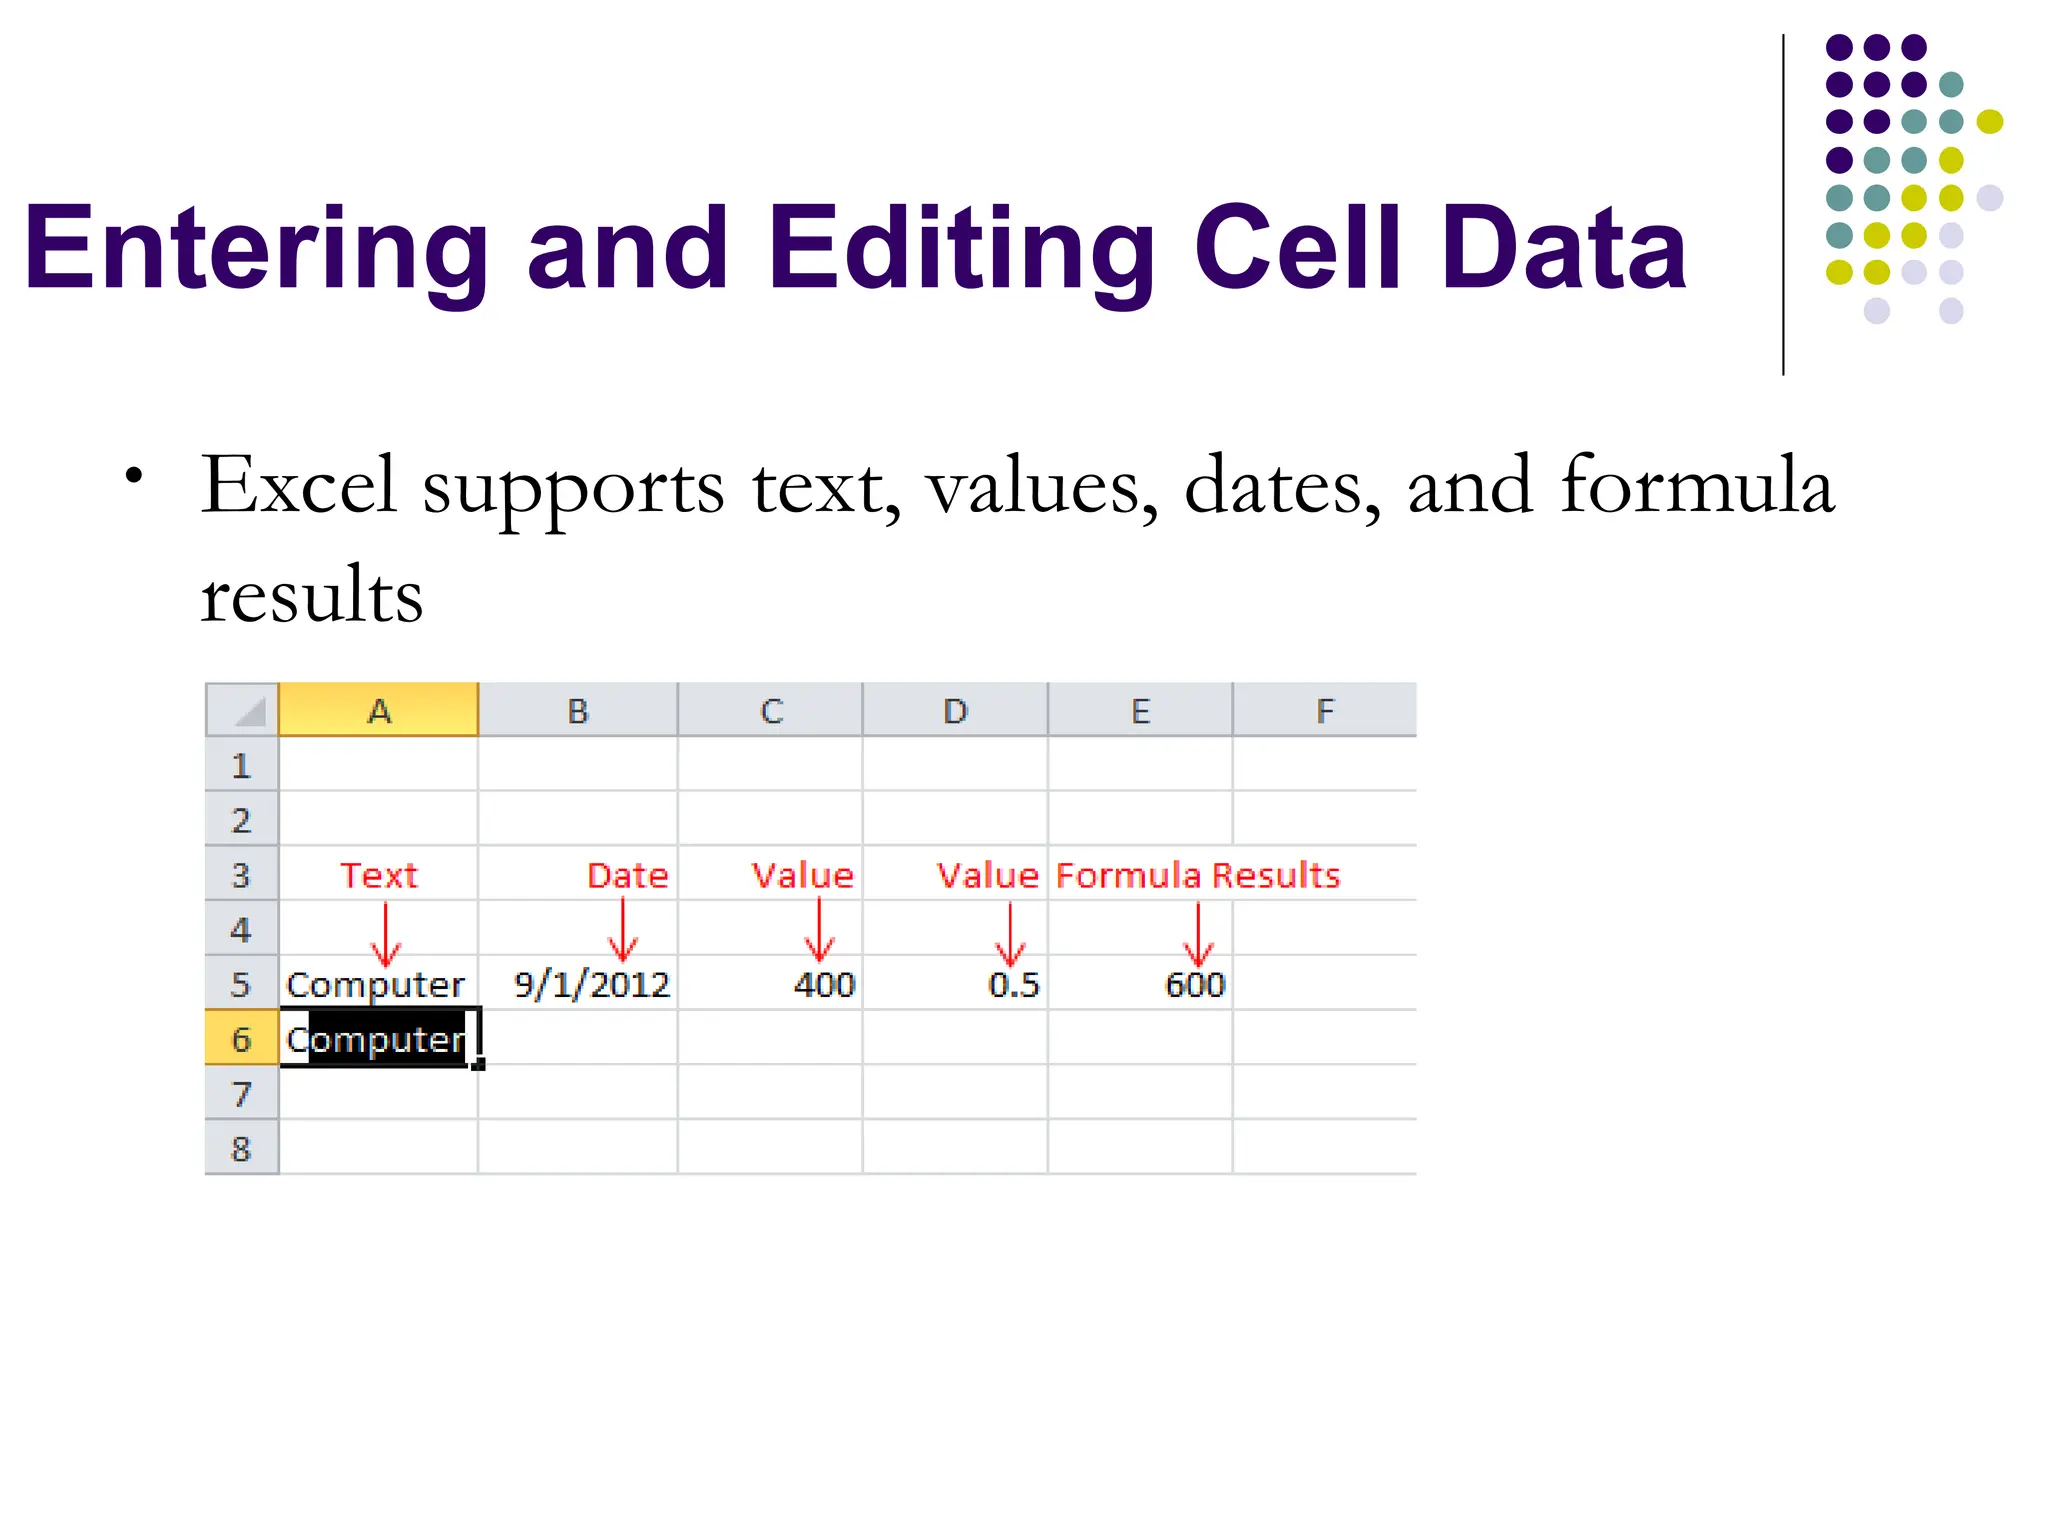
Entering and EditingCell Data
• Excel supports text, values, dates, and formula
results
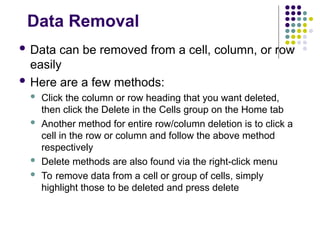
Data Removal
Datacan be removed from a cell, column, or row
easily
Here are a few methods:
Click the column or row heading that you want deleted,
then click the Delete in the Cells group on the Home tab
Another method for entire row/column deletion is to click a
cell in the row or column and follow the above method
respectively
Delete methods are also found via the right-click menu
To remove data from a cell or group of cells, simply
highlight those to be deleted and press delete
19.
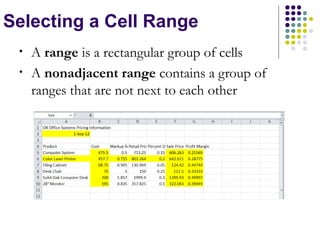
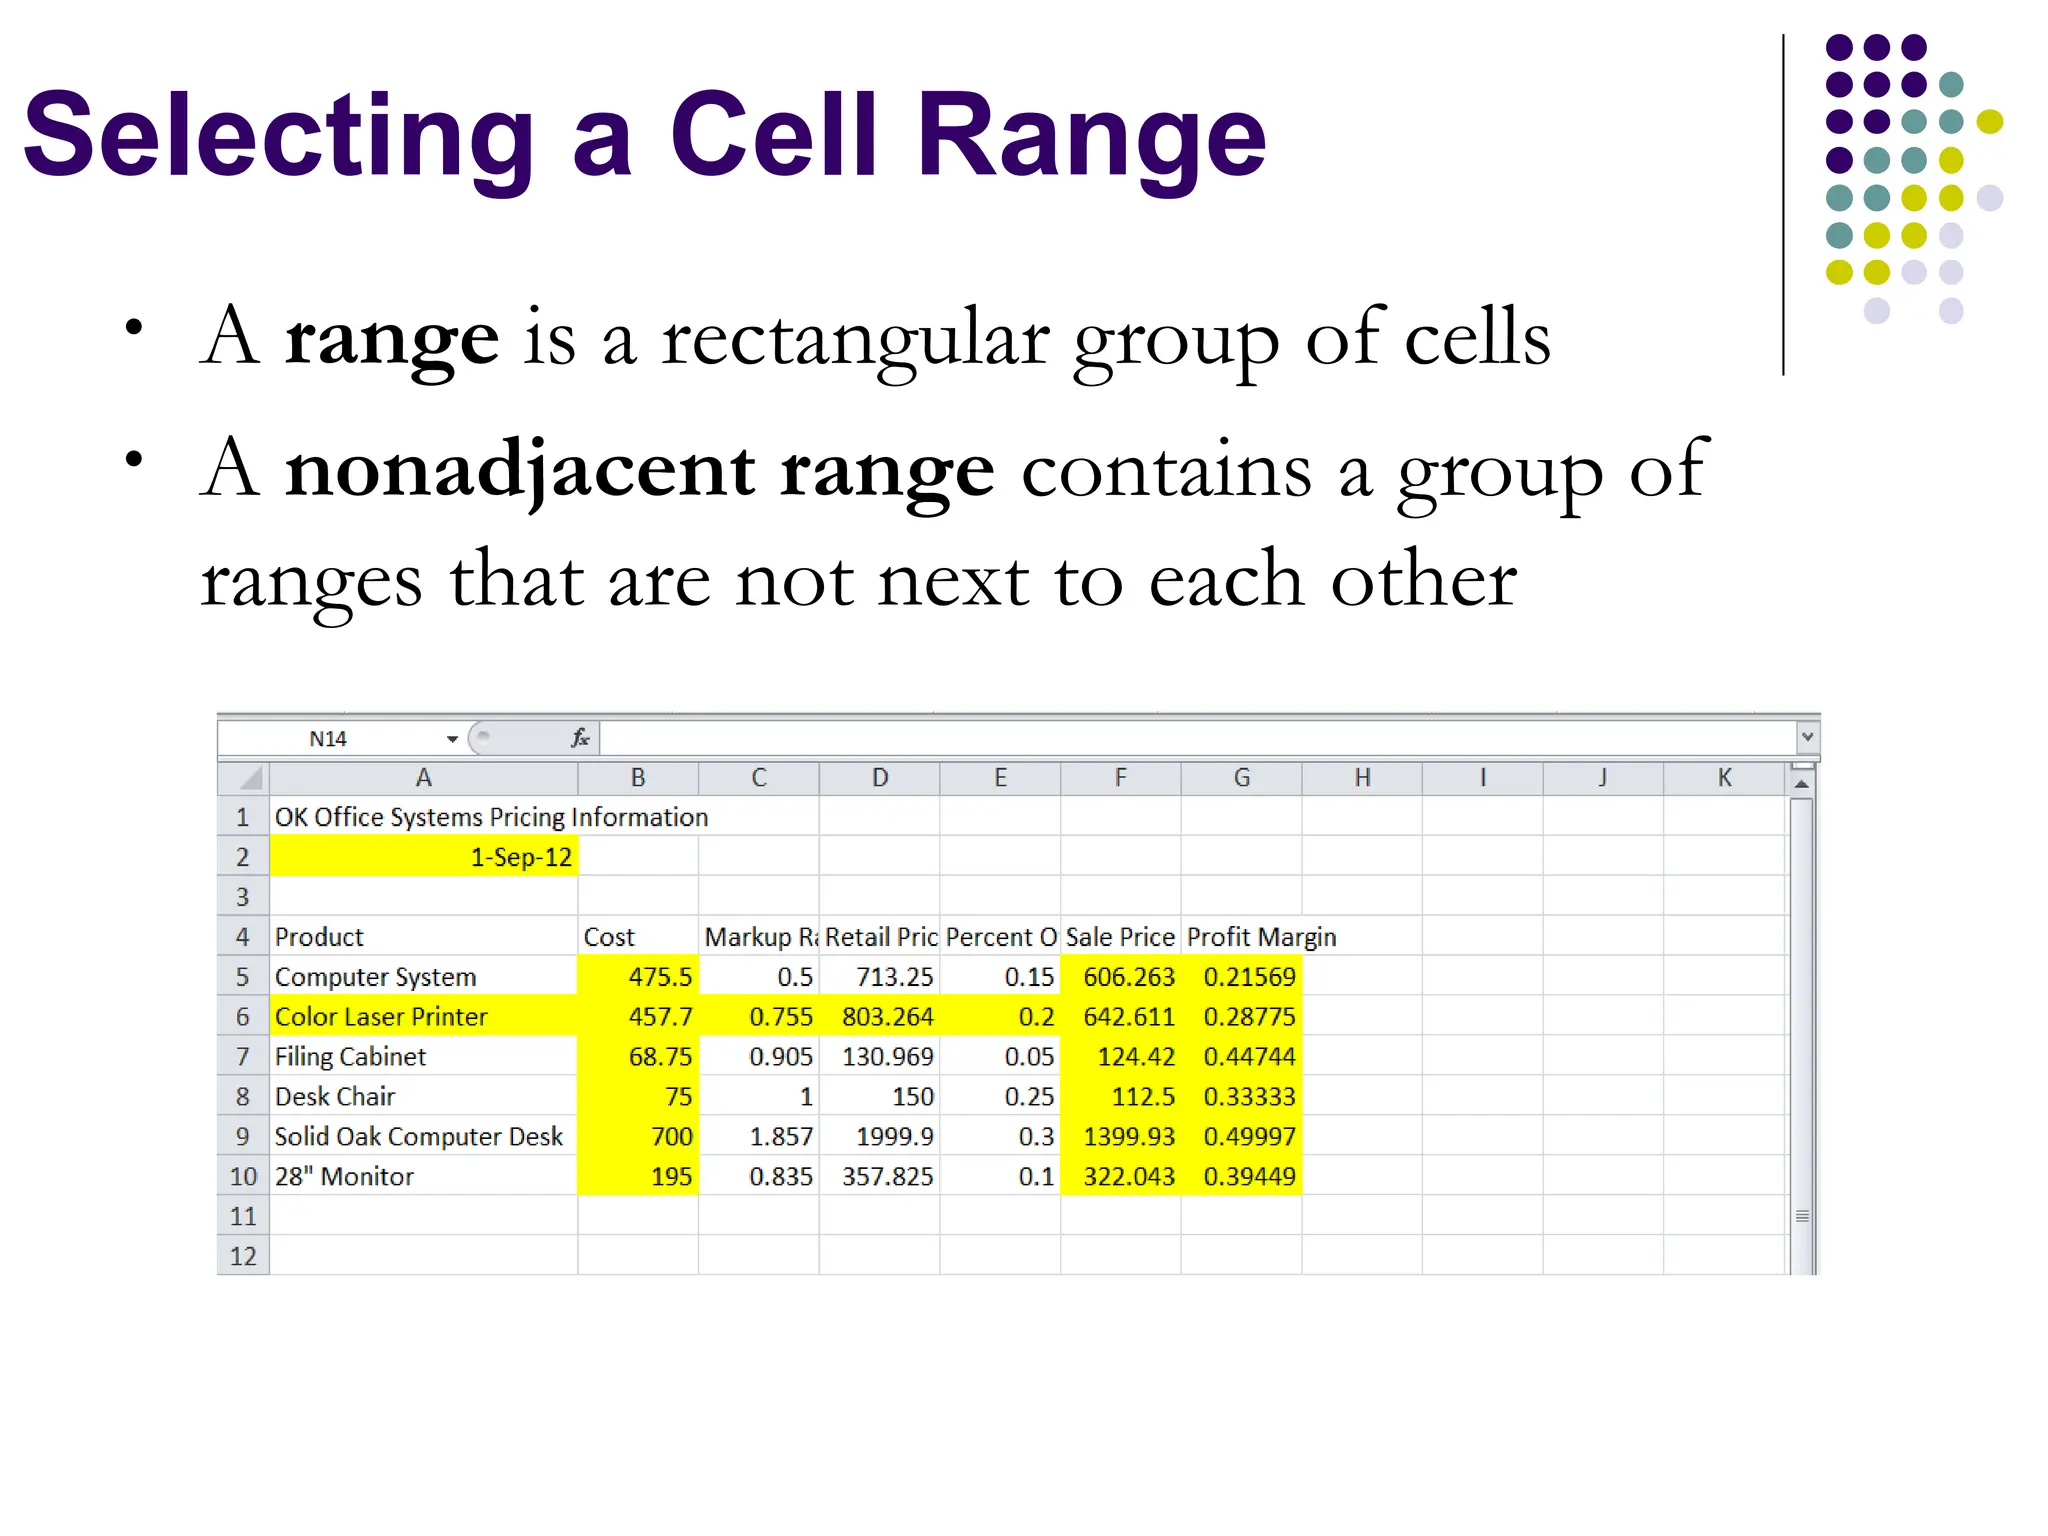
• A rangeis a rectangular group of cells
• A nonadjacent range contains a group of
ranges that are not next to each other
Selecting a Cell Range
20.
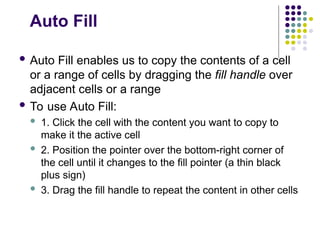
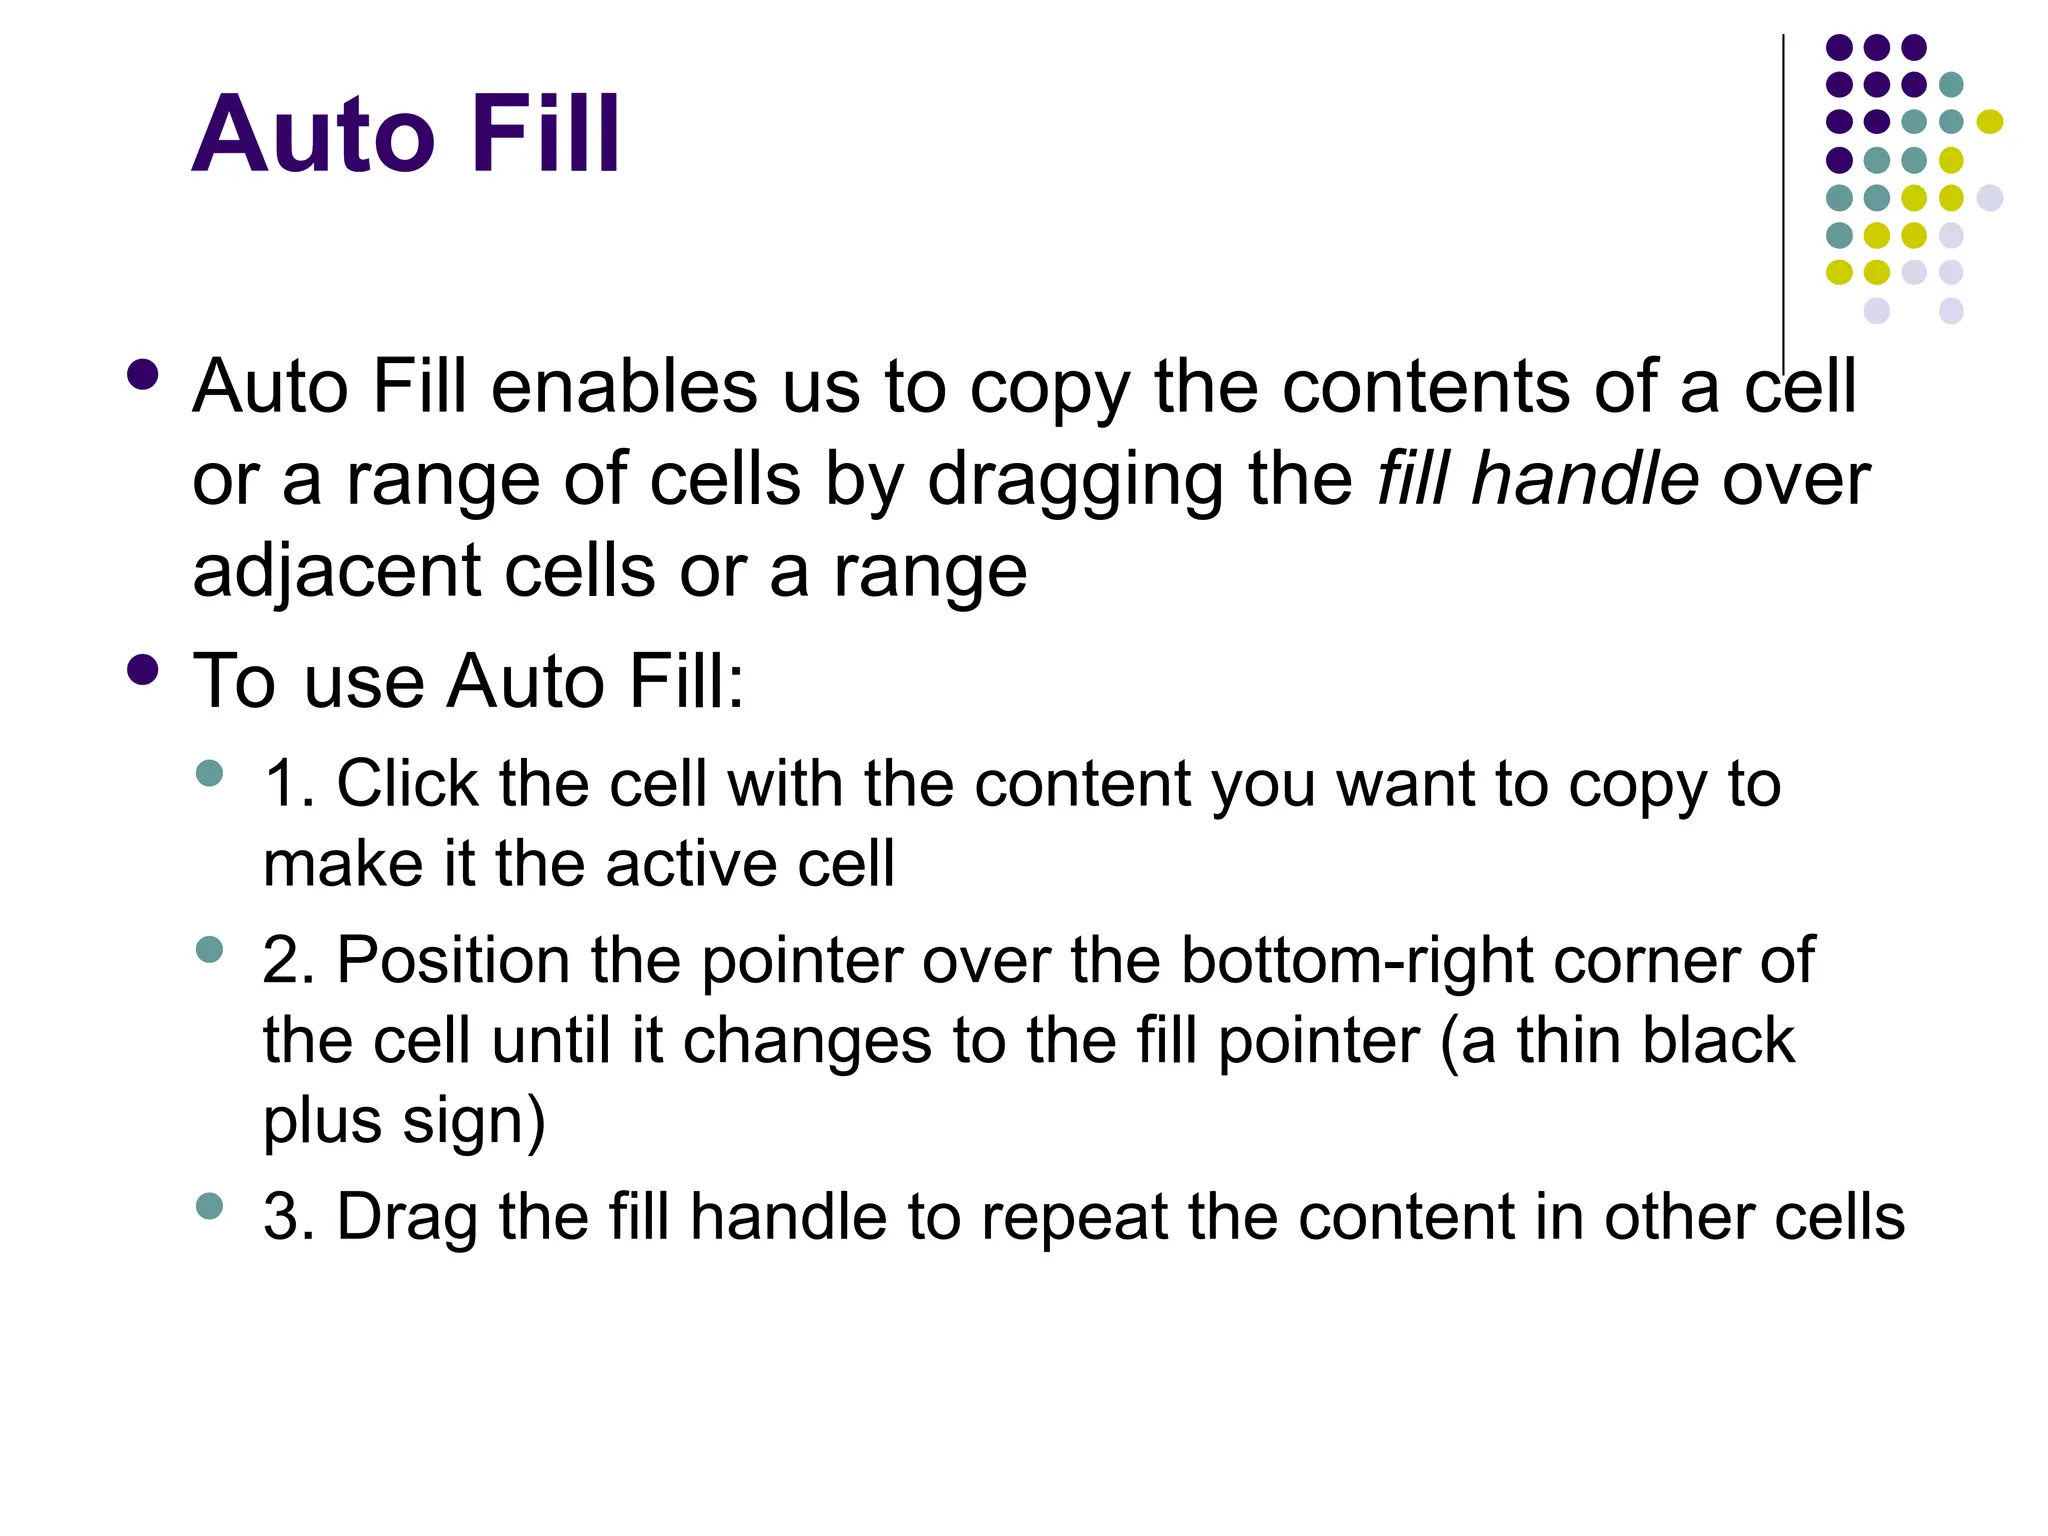
Auto Fill
AutoFill enables us to copy the contents of a cell
or a range of cells by dragging the fill handle over
adjacent cells or a range
To use Auto Fill:
1. Click the cell with the content you want to copy to
make it the active cell
2. Position the pointer over the bottom-right corner of
the cell until it changes to the fill pointer (a thin black
plus sign)
3. Drag the fill handle to repeat the content in other cells
21.
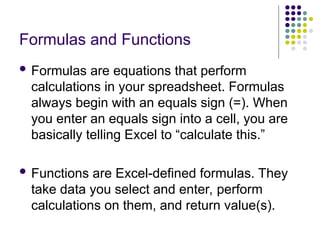
Formulas and Functions
Formulas are equations that perform
calculations in your spreadsheet. Formulas
always begin with an equals sign (=). When
you enter an equals sign into a cell, you are
basically telling Excel to “calculate this.”
Functions are Excel-defined formulas. They
take data you select and enter, perform
calculations on them, and return value(s).
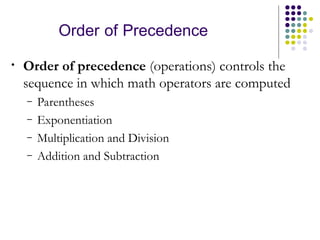
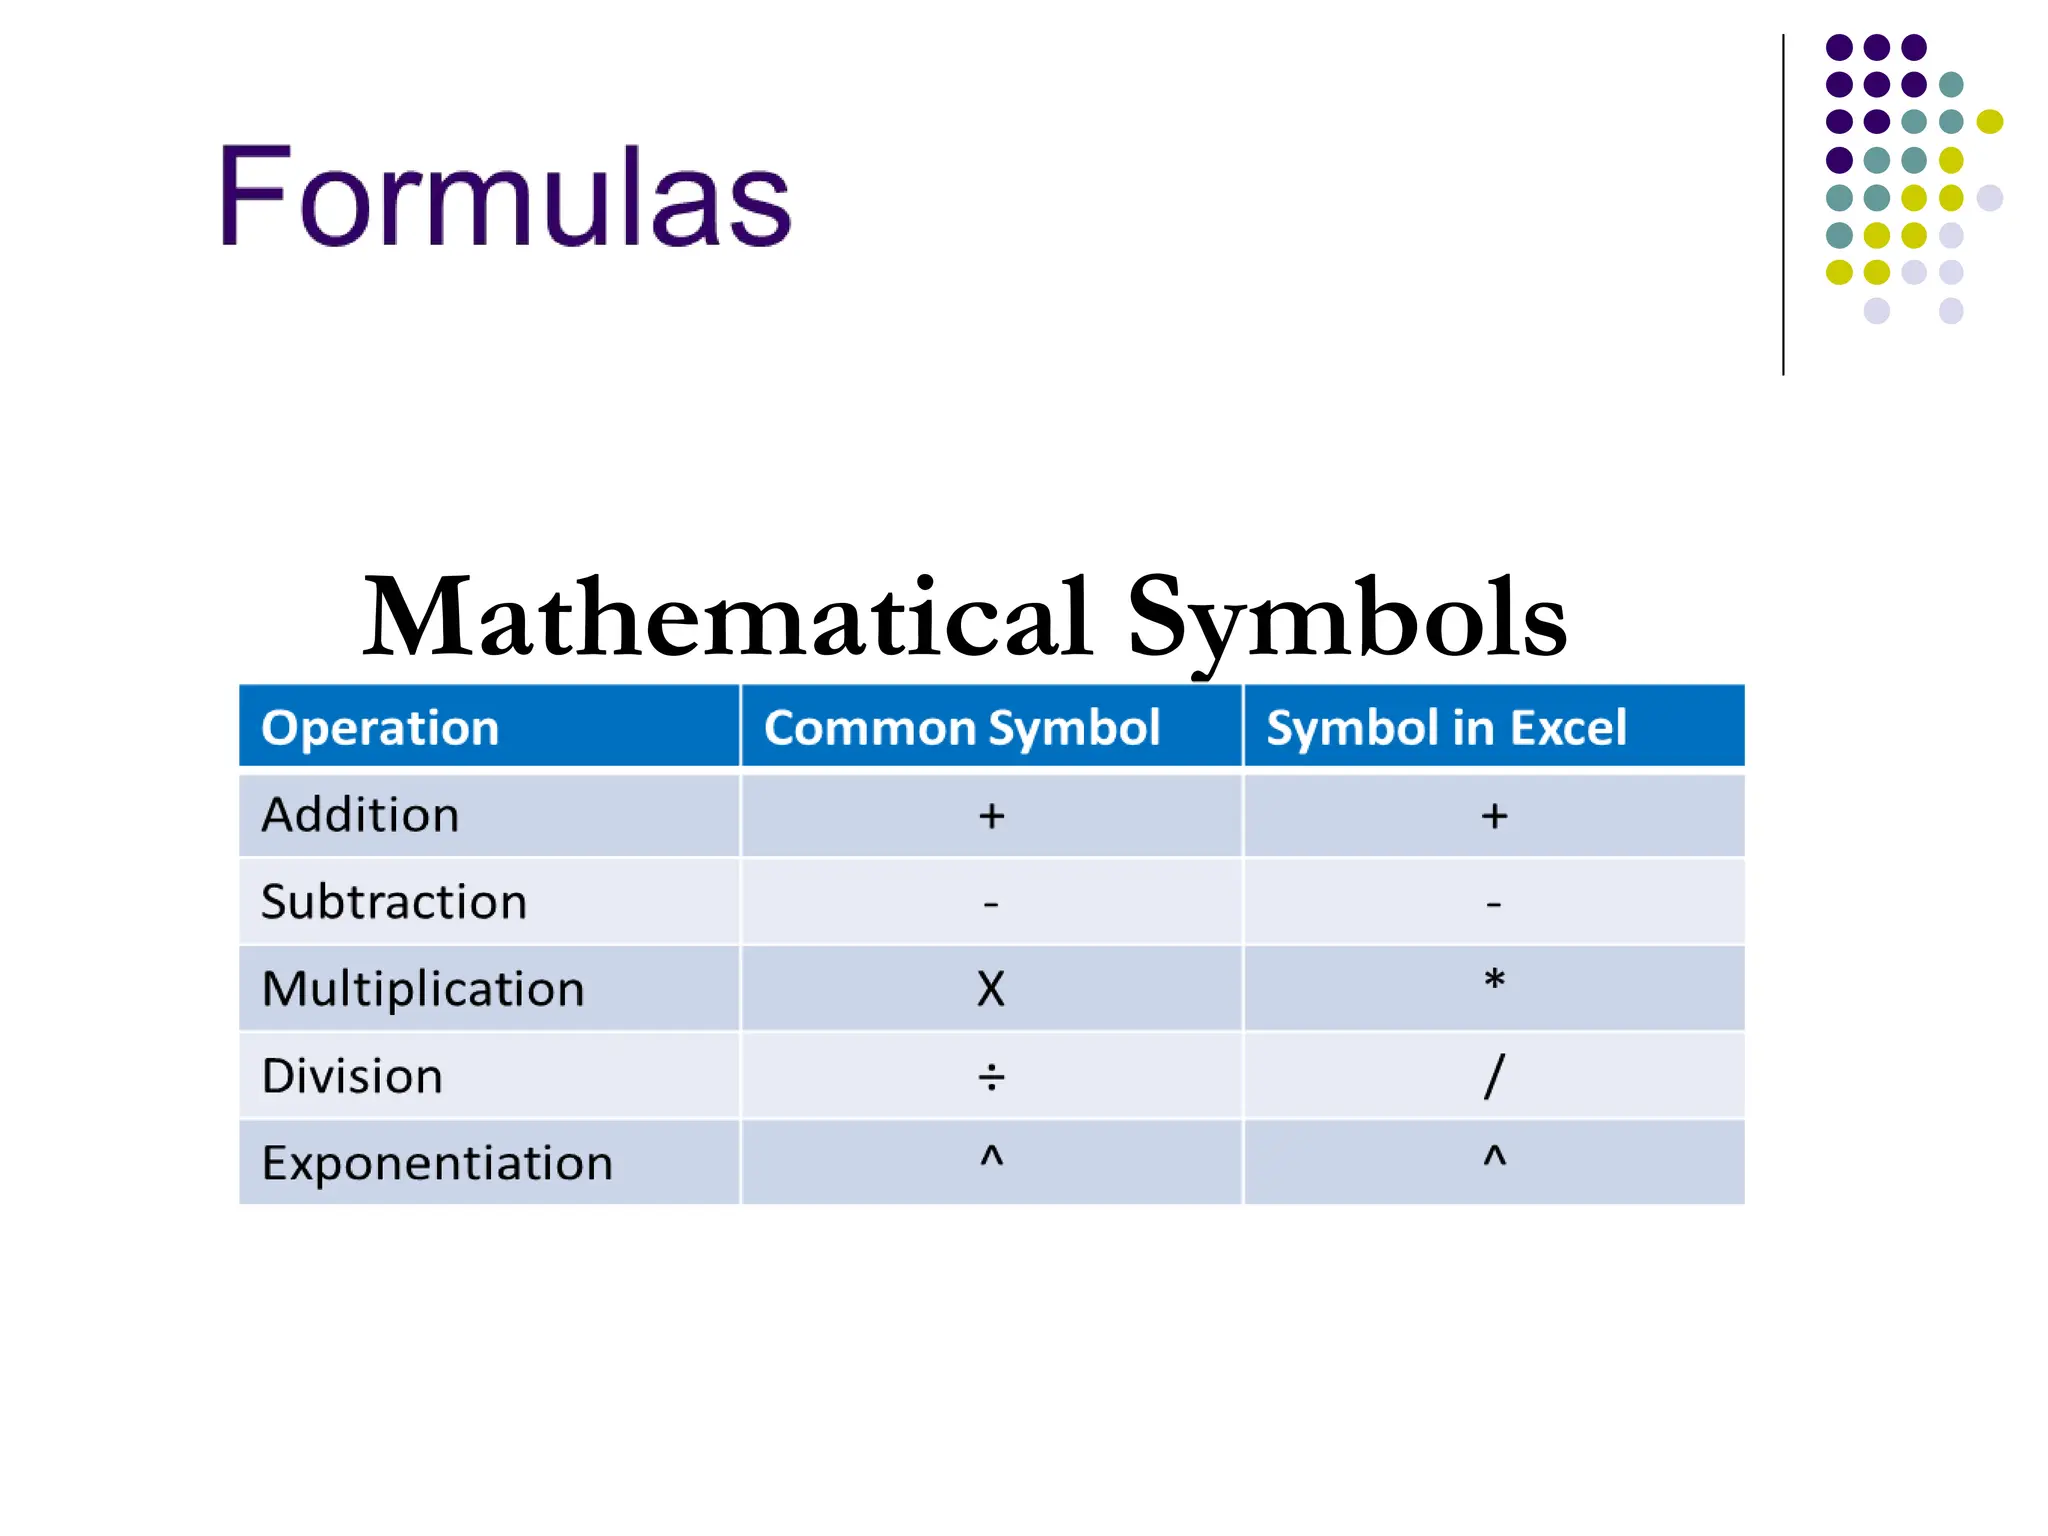
Order of Precedence
•Order of precedence (operations) controls the
sequence in which math operators are computed
– Parentheses
– Exponentiation
– Multiplication and Division
– Addition and Subtraction
24.
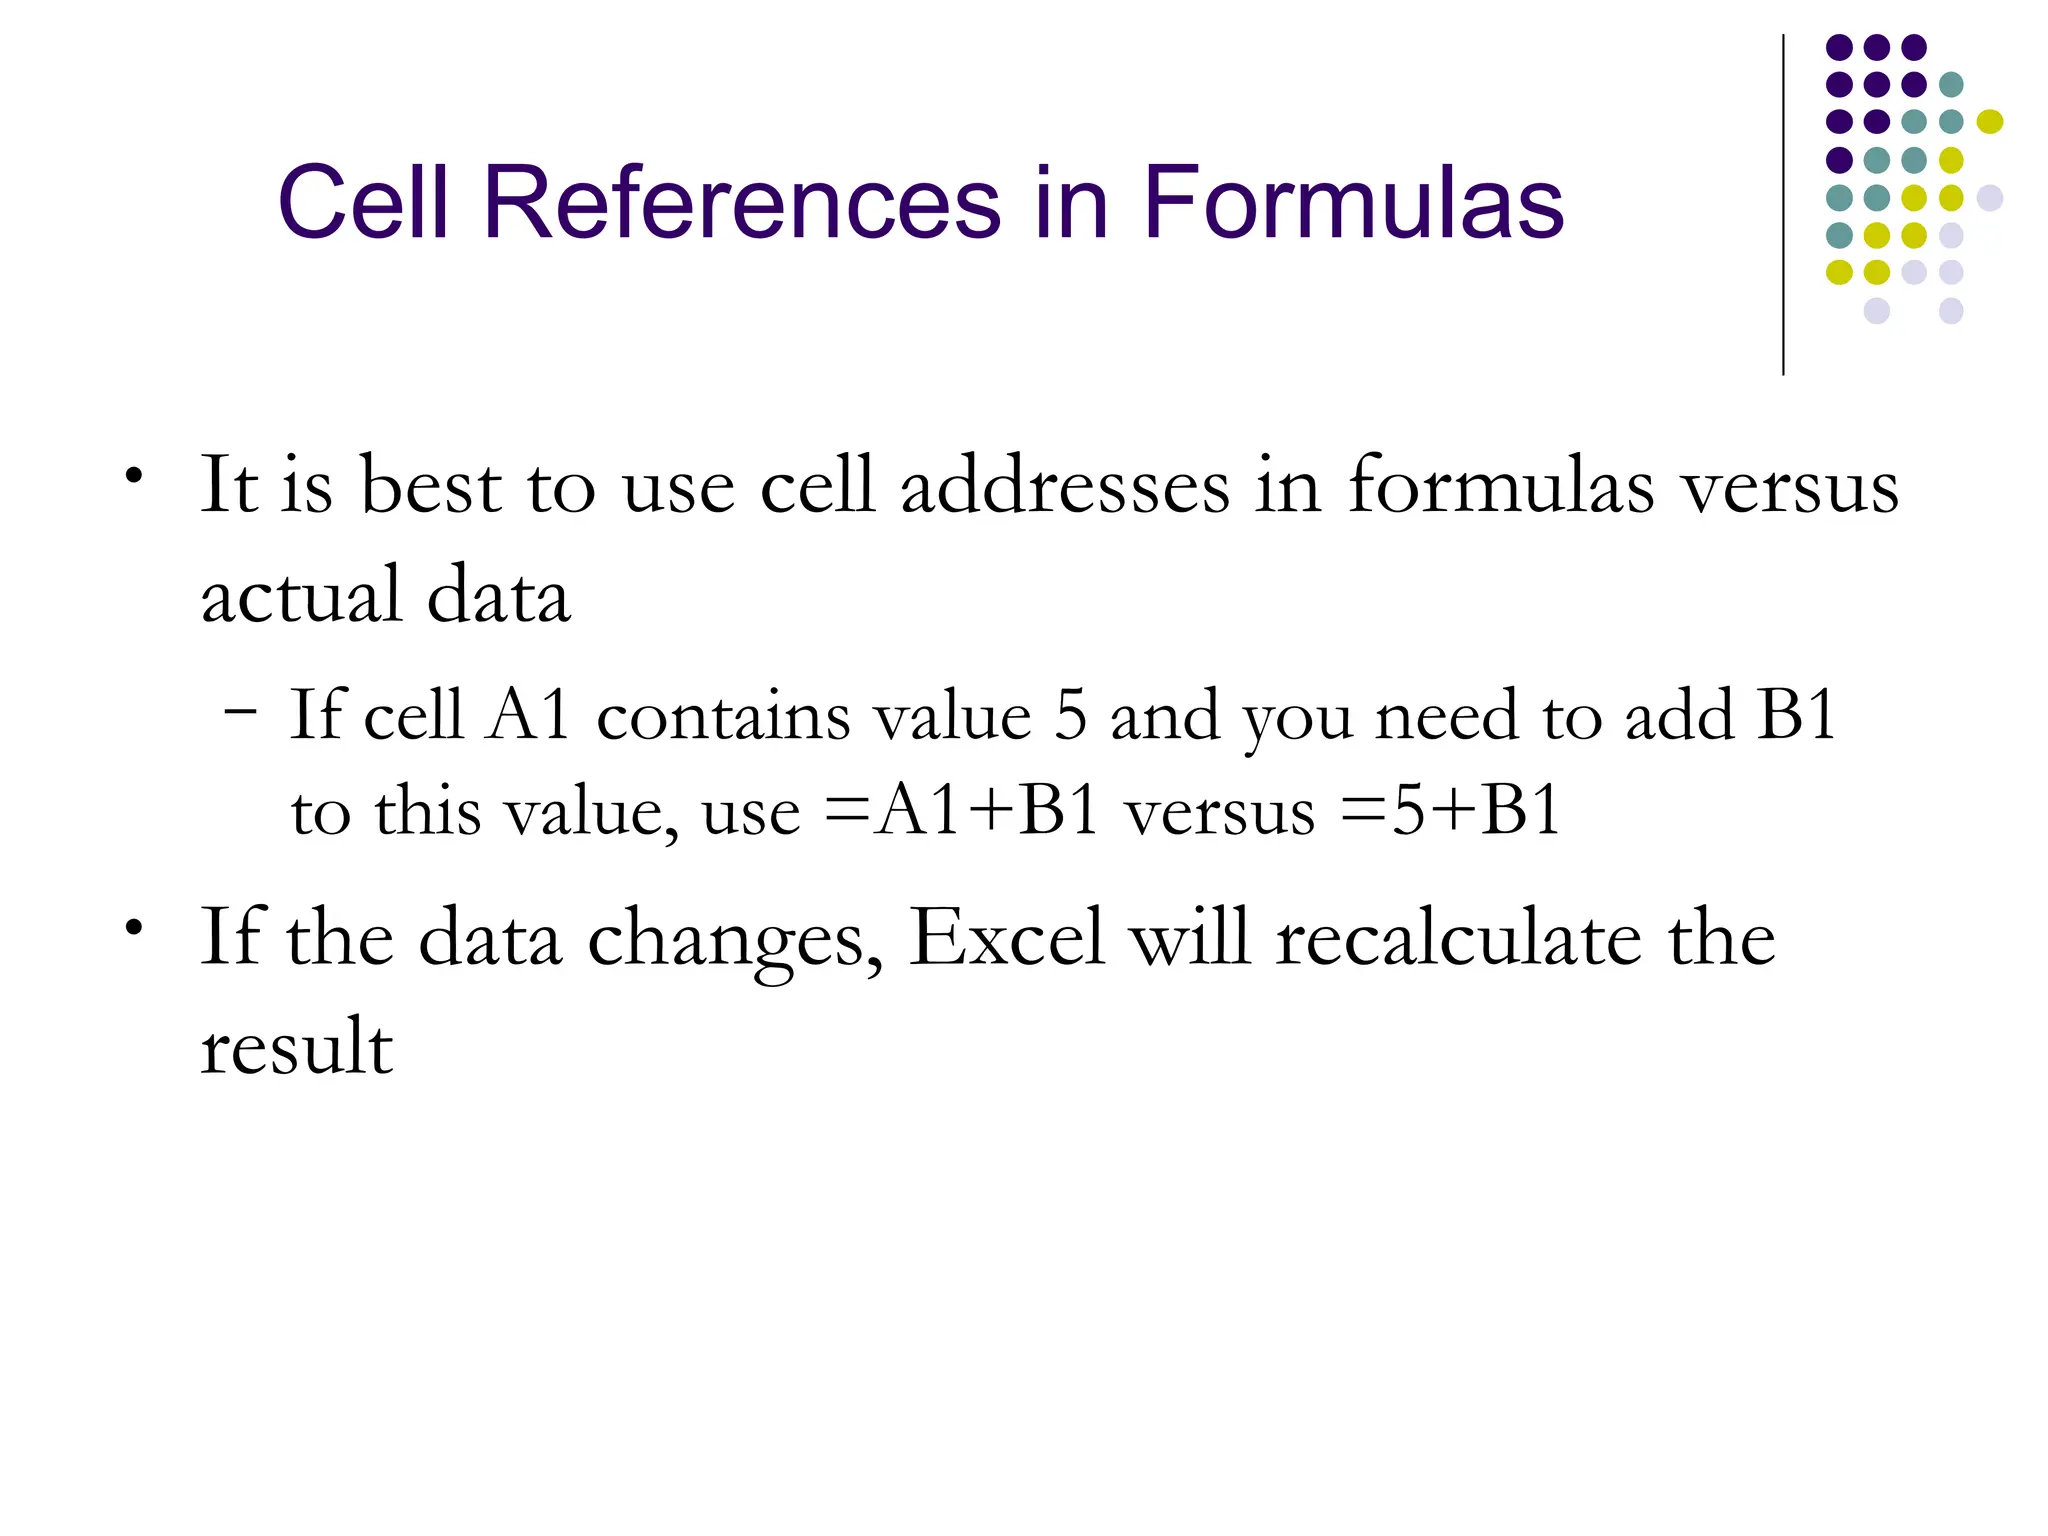
Cell References inFormulas
• It is best to use cell addresses in formulas versus
actual data
– If cell A1 contains value 5 and you need to add B1
to this value, use =A1+B1 versus =5+B1
• If the data changes, Excel will recalculate the
result
25.
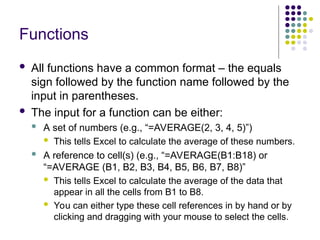
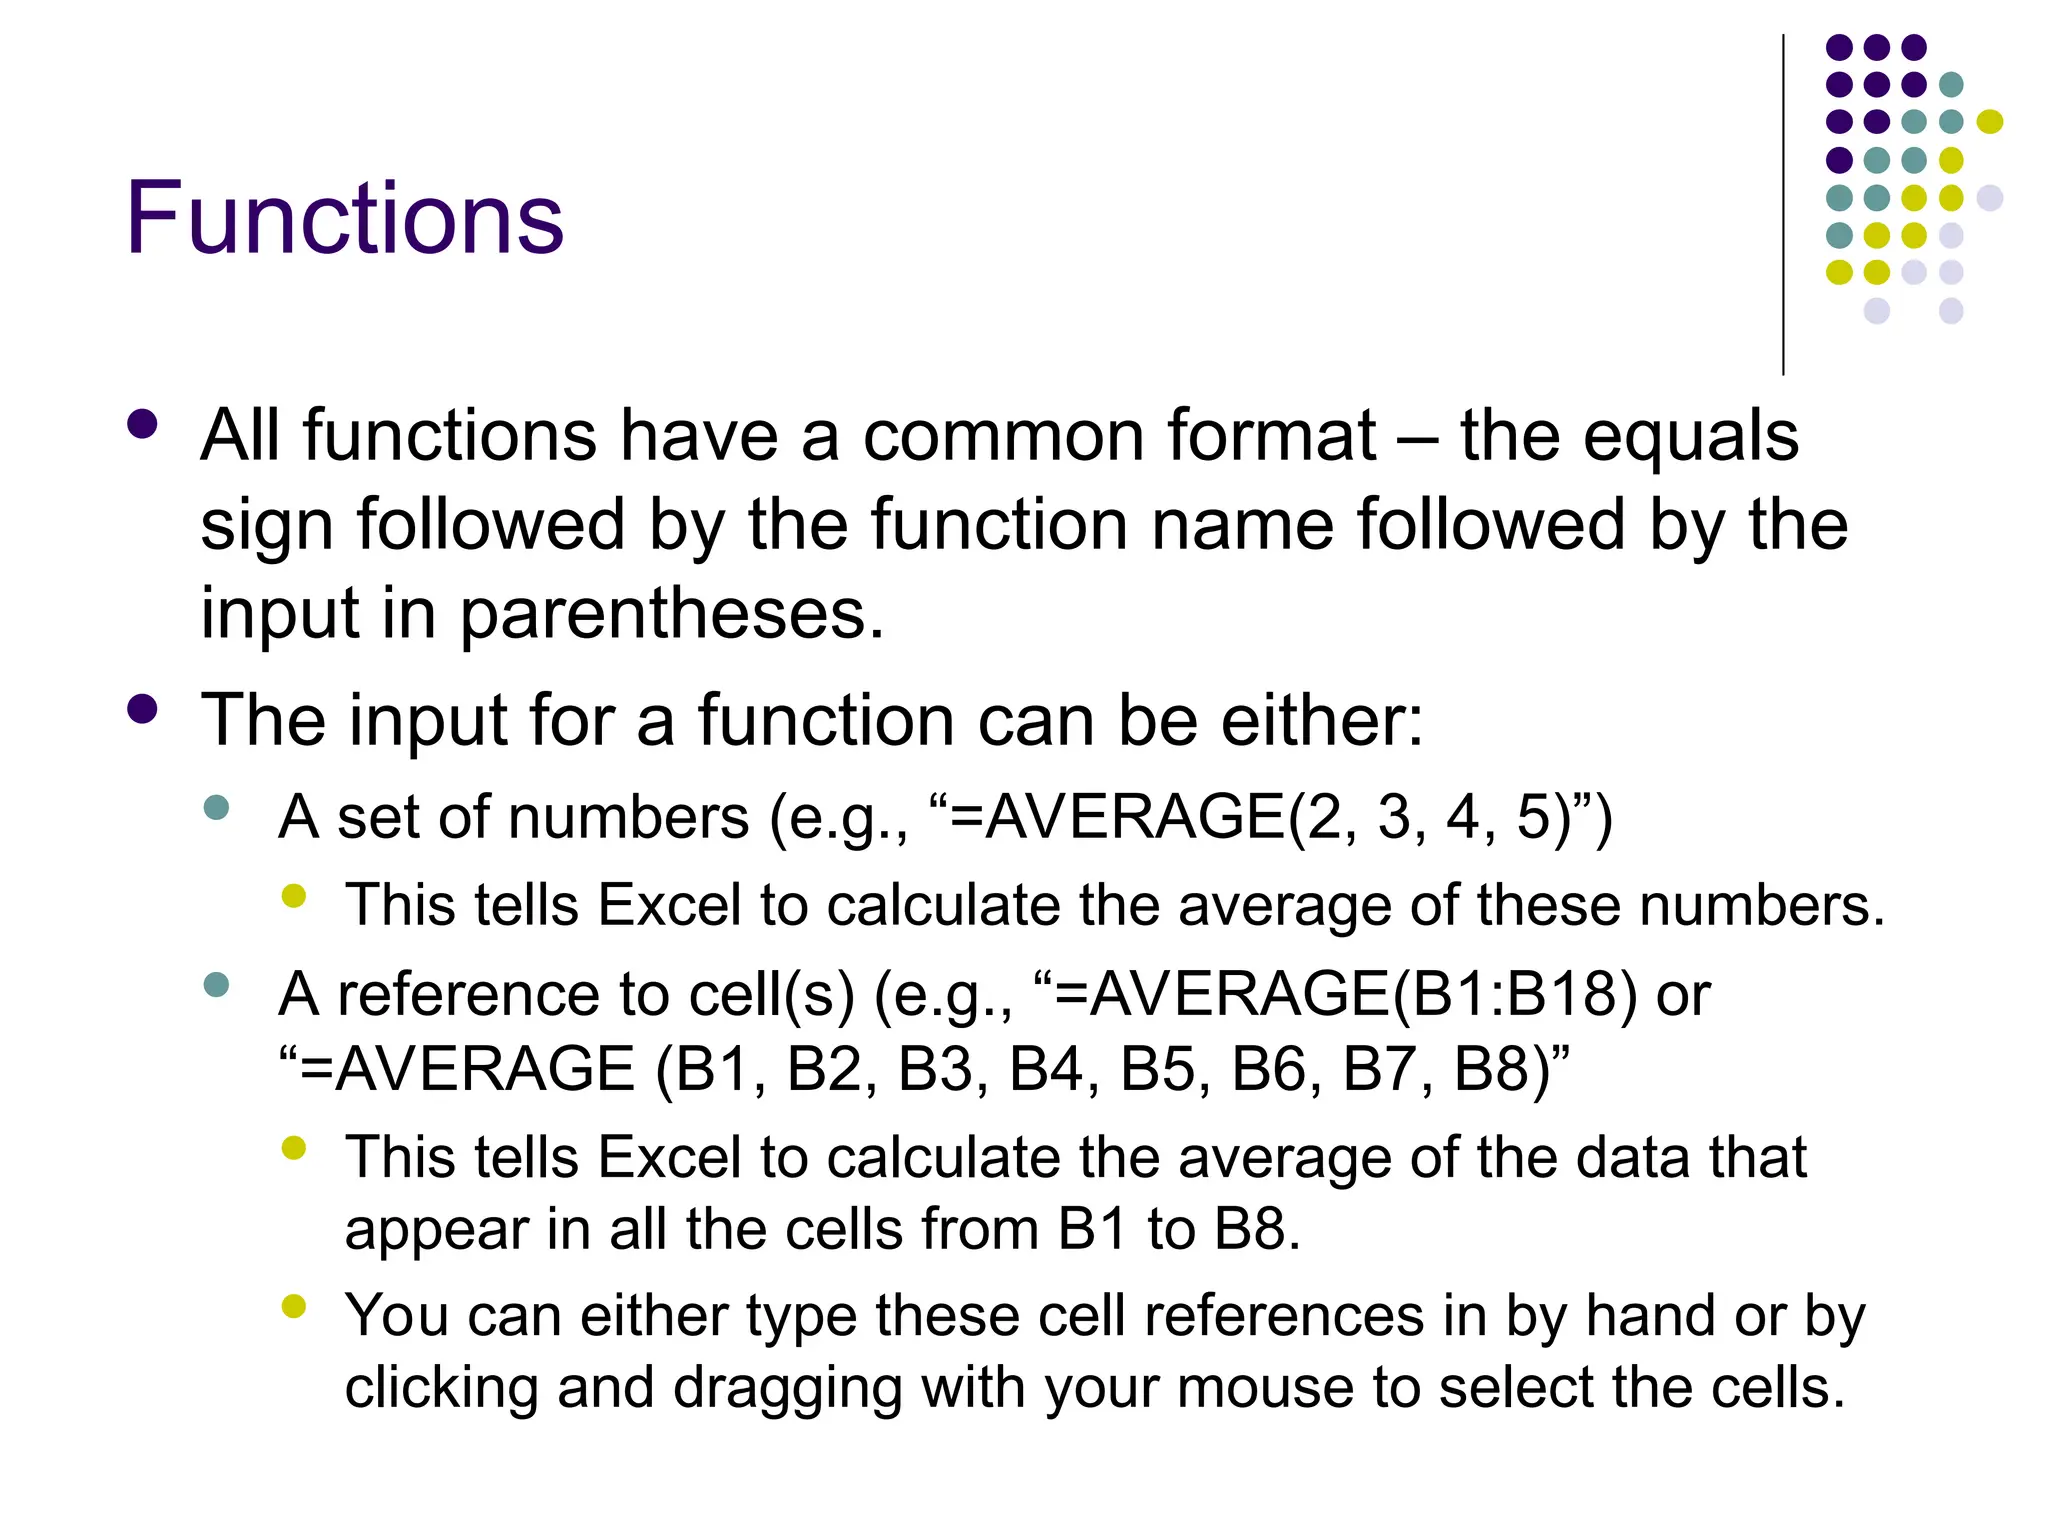
Functions
All functionshave a common format – the equals
sign followed by the function name followed by the
input in parentheses.
The input for a function can be either:
A set of numbers (e.g., “=AVERAGE(2, 3, 4, 5)”)
This tells Excel to calculate the average of these numbers.
A reference to cell(s) (e.g., “=AVERAGE(B1:B18) or
“=AVERAGE (B1, B2, B3, B4, B5, B6, B7, B8)”
This tells Excel to calculate the average of the data that
appear in all the cells from B1 to B8.
You can either type these cell references in by hand or by
clicking and dragging with your mouse to select the cells.
26.
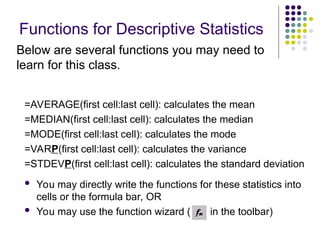
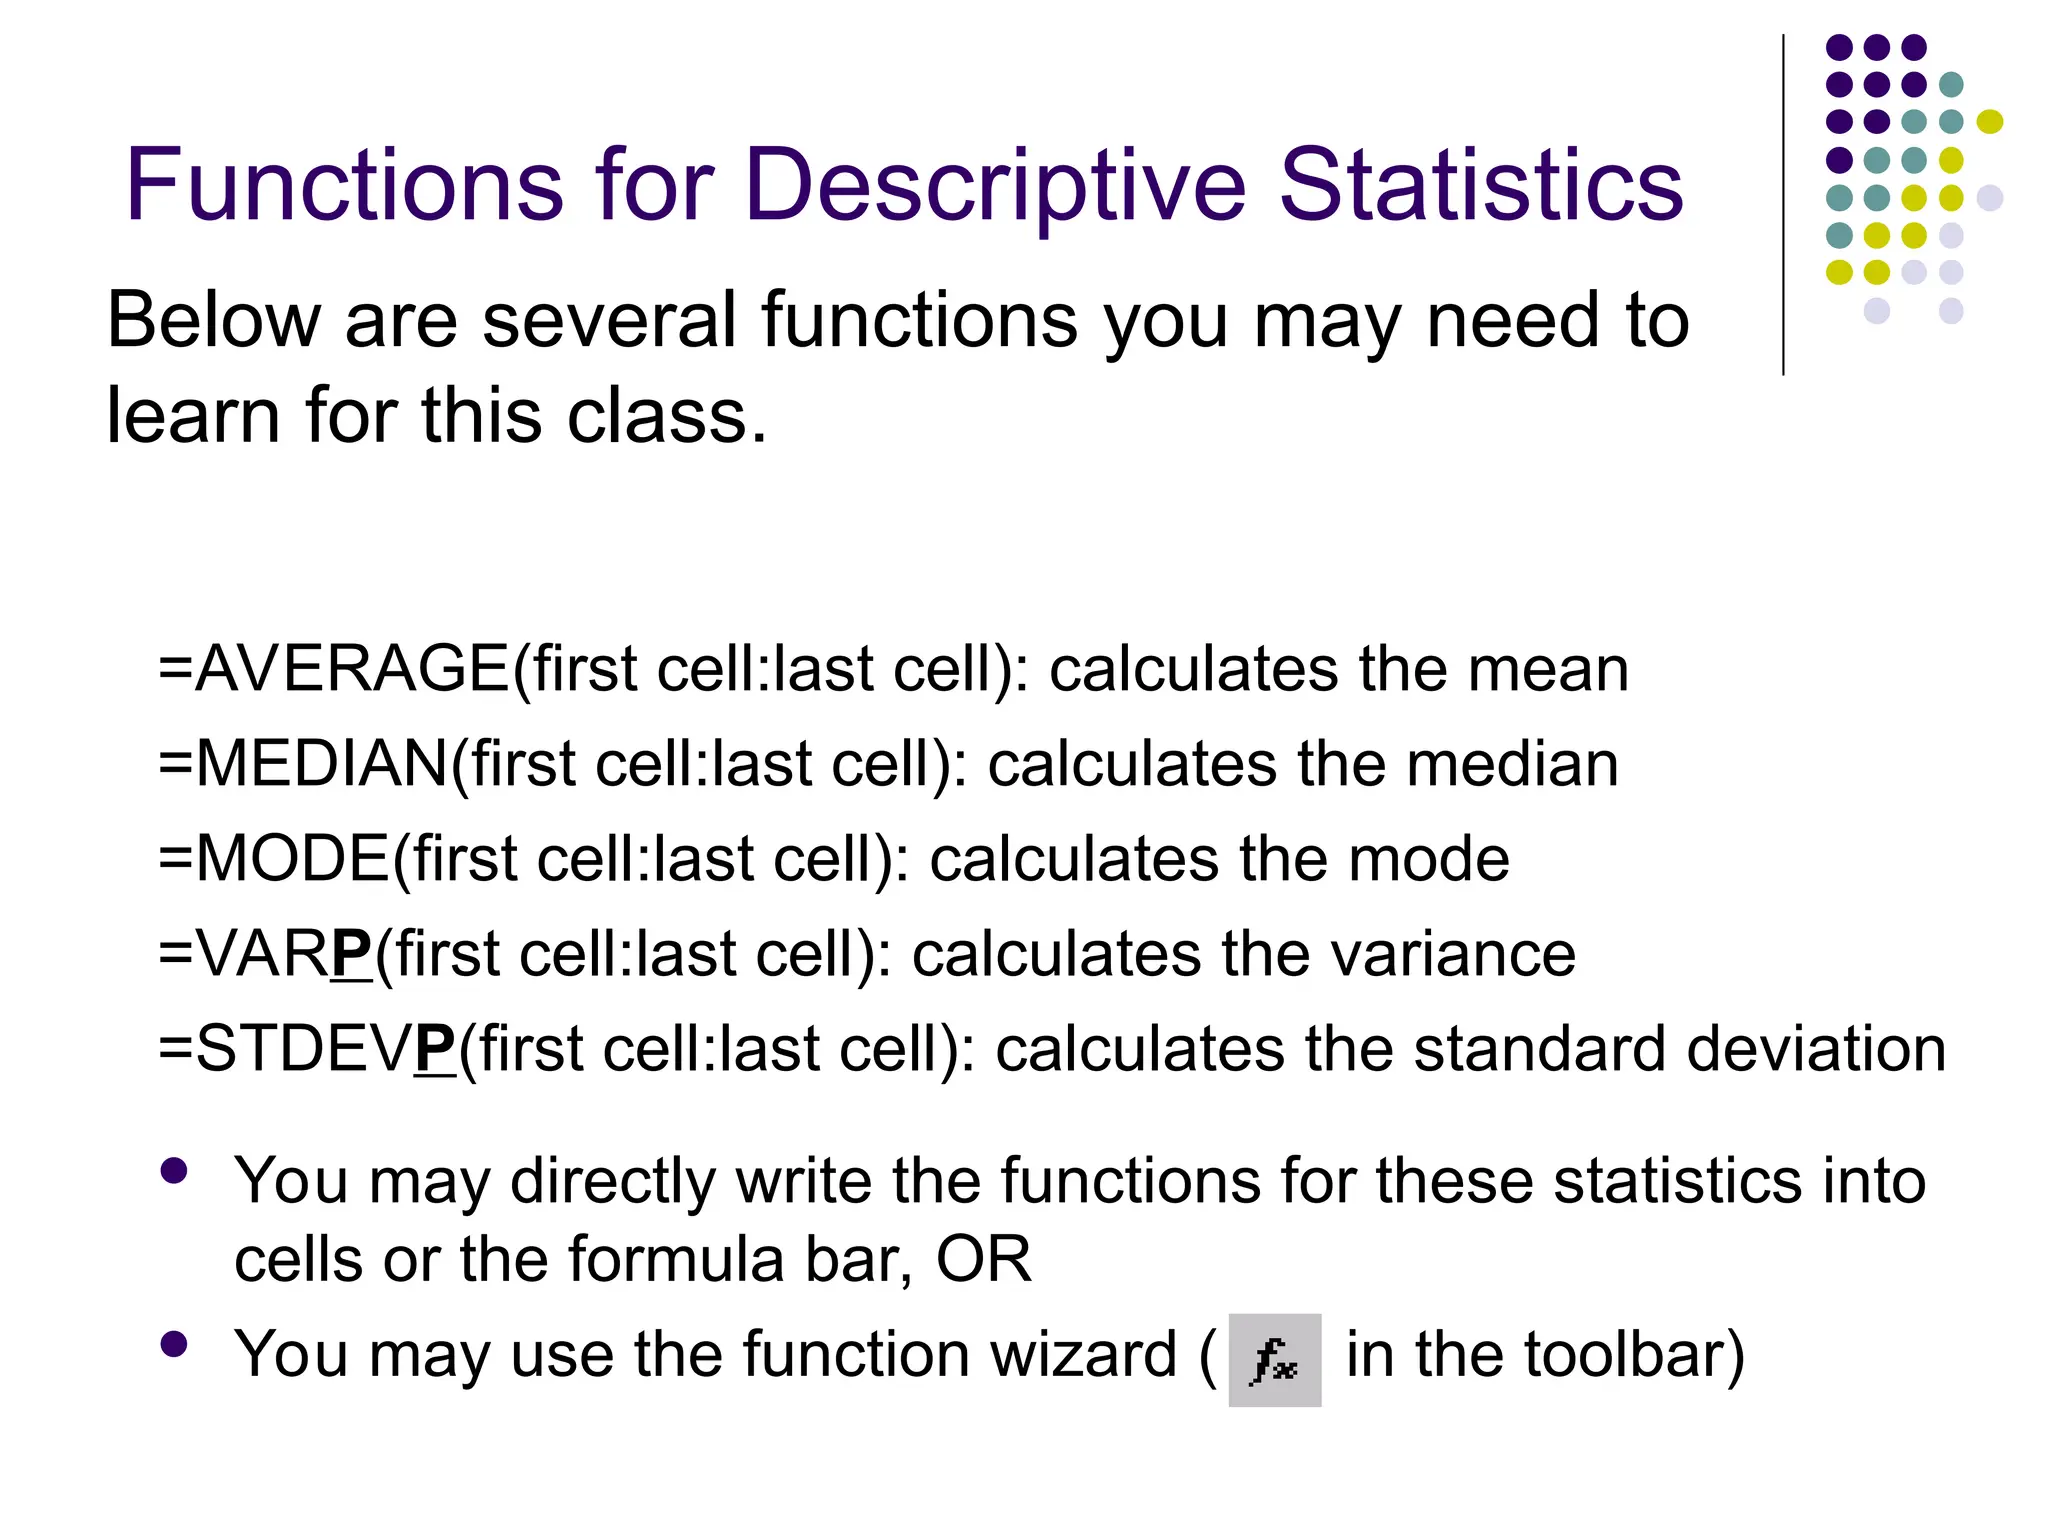
Functions for DescriptiveStatistics
=AVERAGE(first cell:last cell): calculates the mean
=MEDIAN(first cell:last cell): calculates the median
=MODE(first cell:last cell): calculates the mode
=VARP(first cell:last cell): calculates the variance
=STDEVP(first cell:last cell): calculates the standard deviation
You may directly write the functions for these statistics into
cells or the formula bar, OR
You may use the function wizard ( in the toolbar)
Below are several functions you may need to
learn for this class.
27.
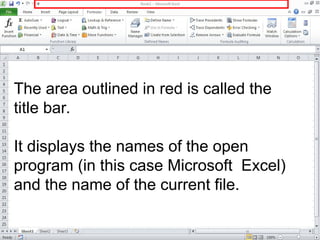
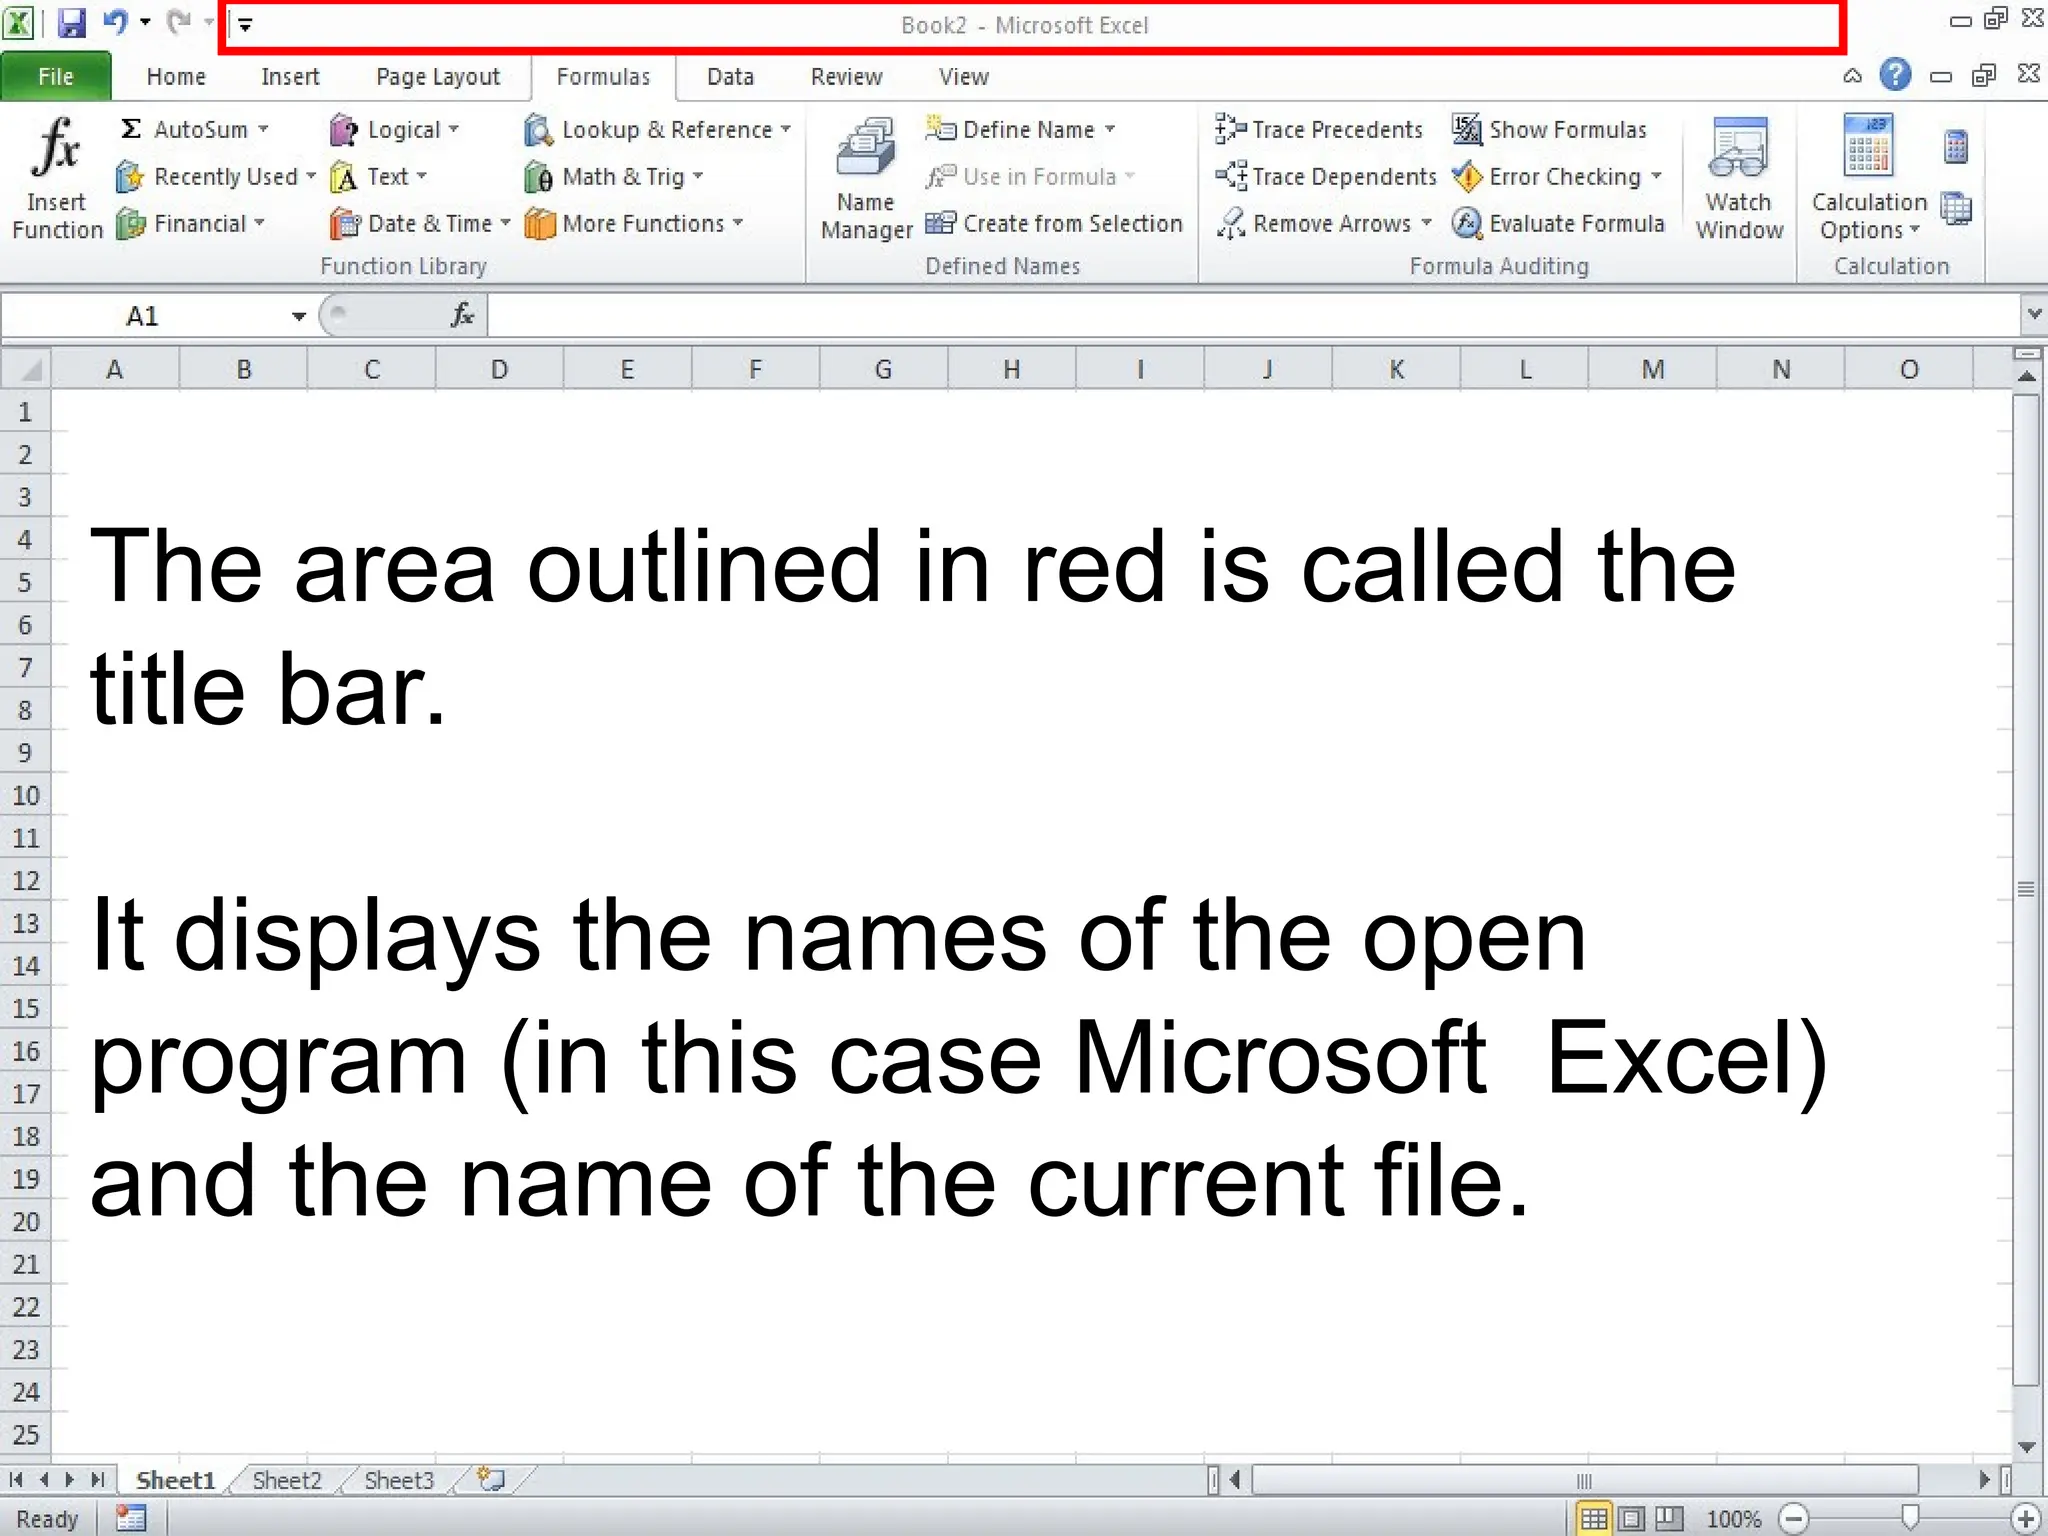
The area outlinedin red is called the
title bar.
It displays the names of the open
program (in this case Microsoft Excel)
and the name of the current file.
28.
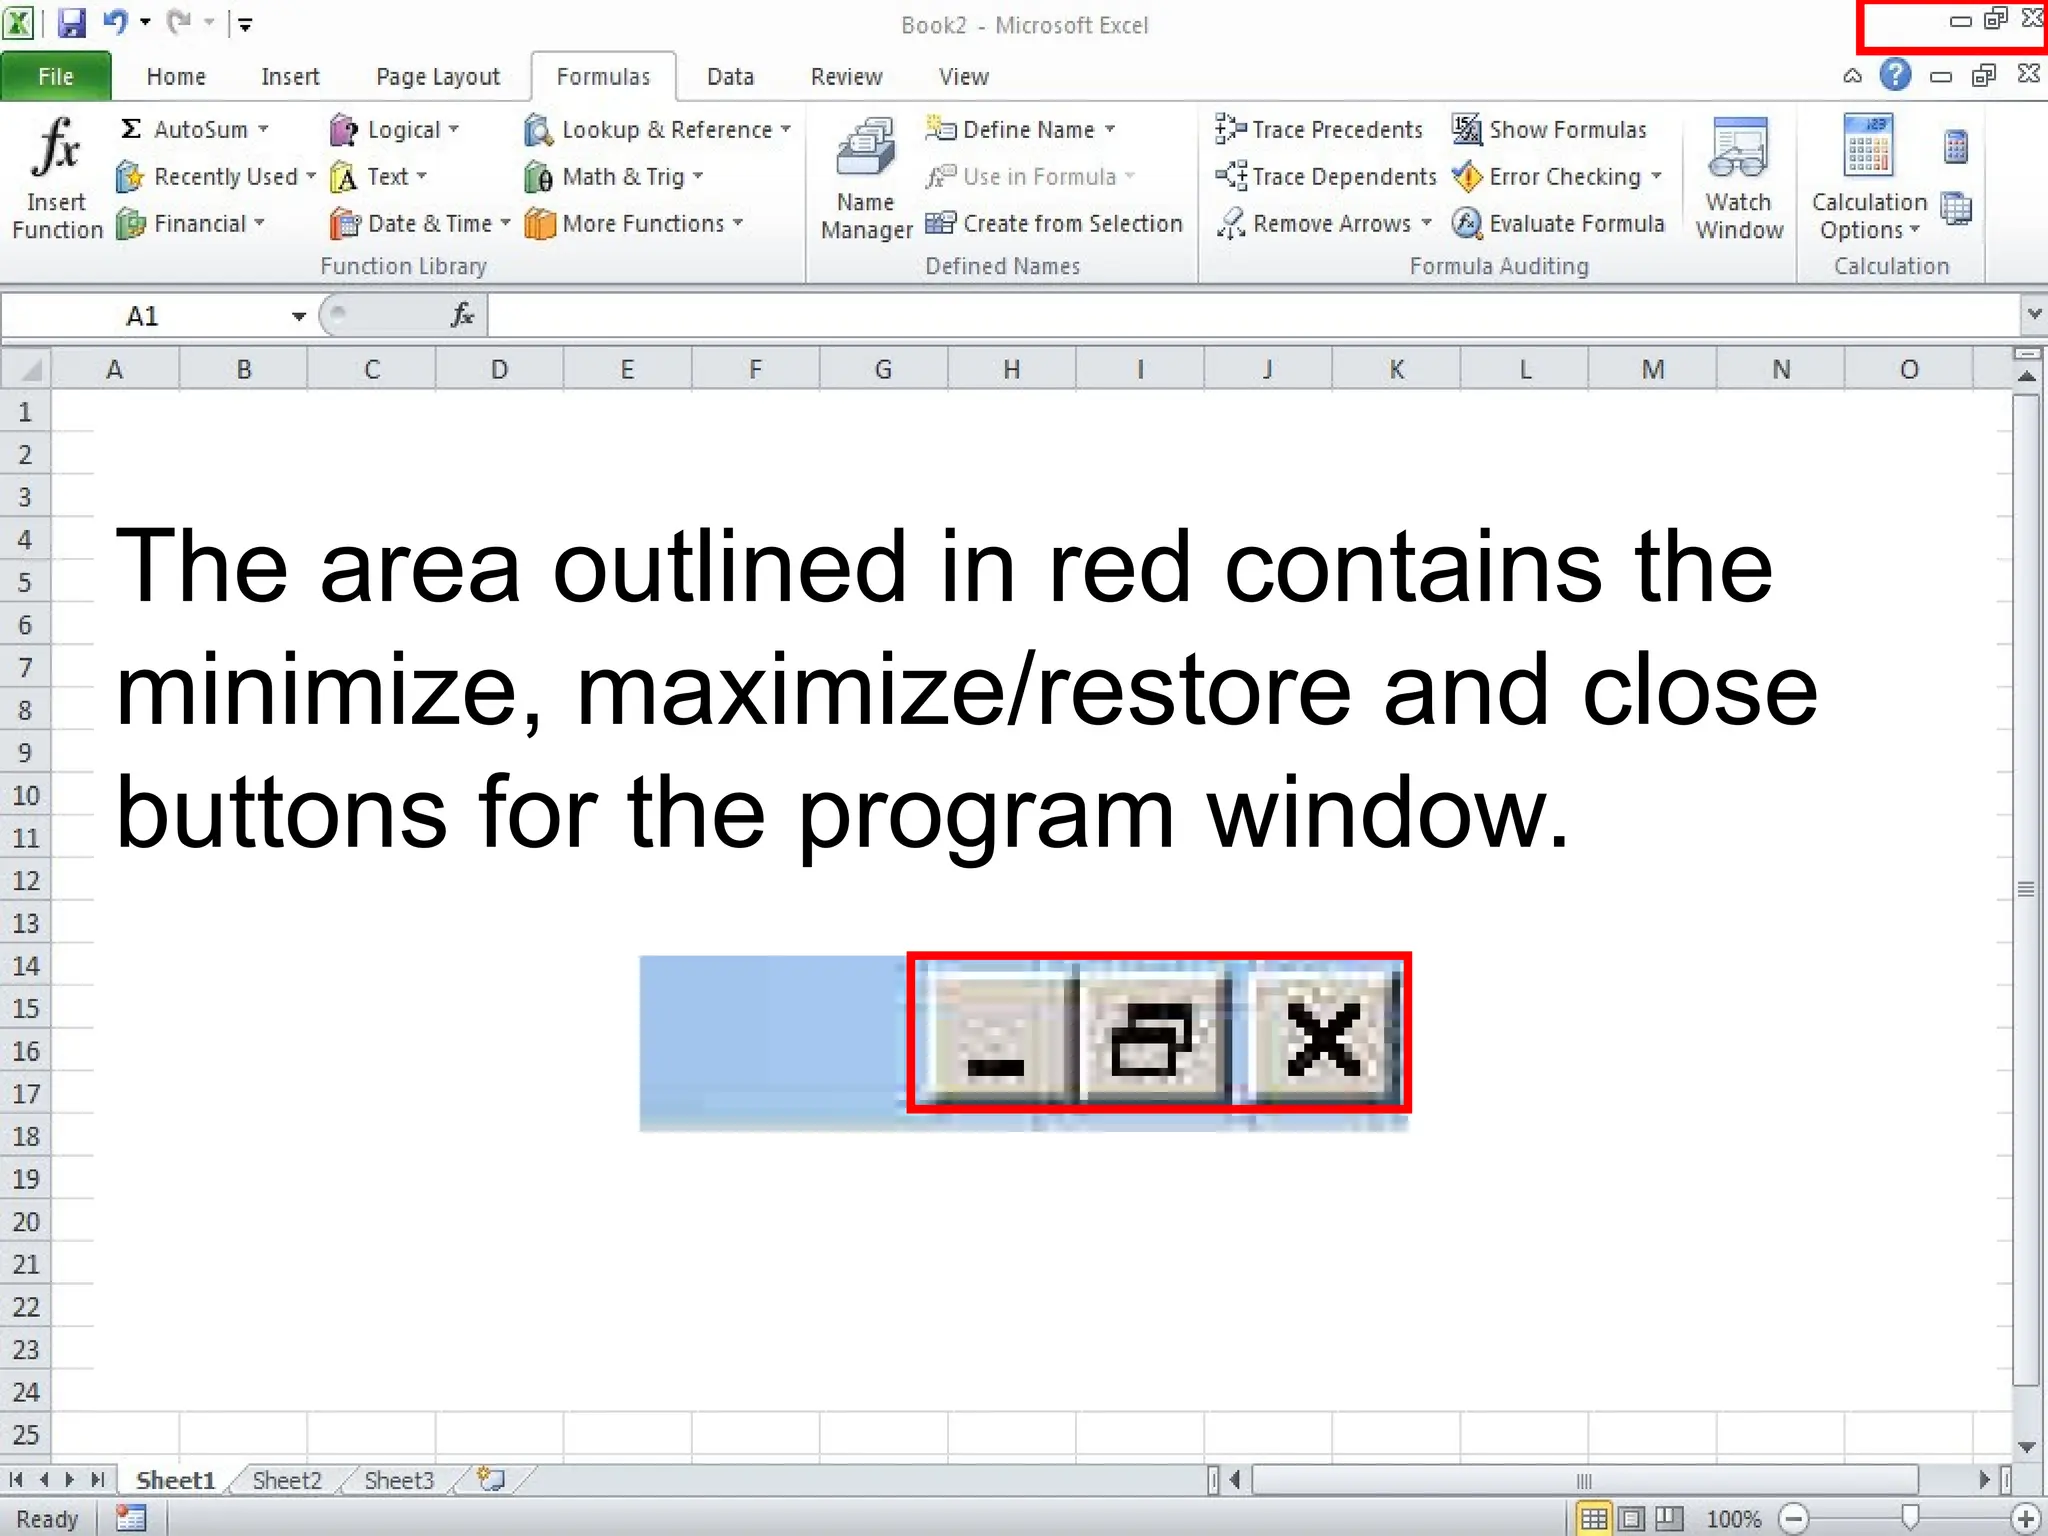
The area outlinedin red contains the
minimize, maximize/restore and close
buttons for the program window.
29.
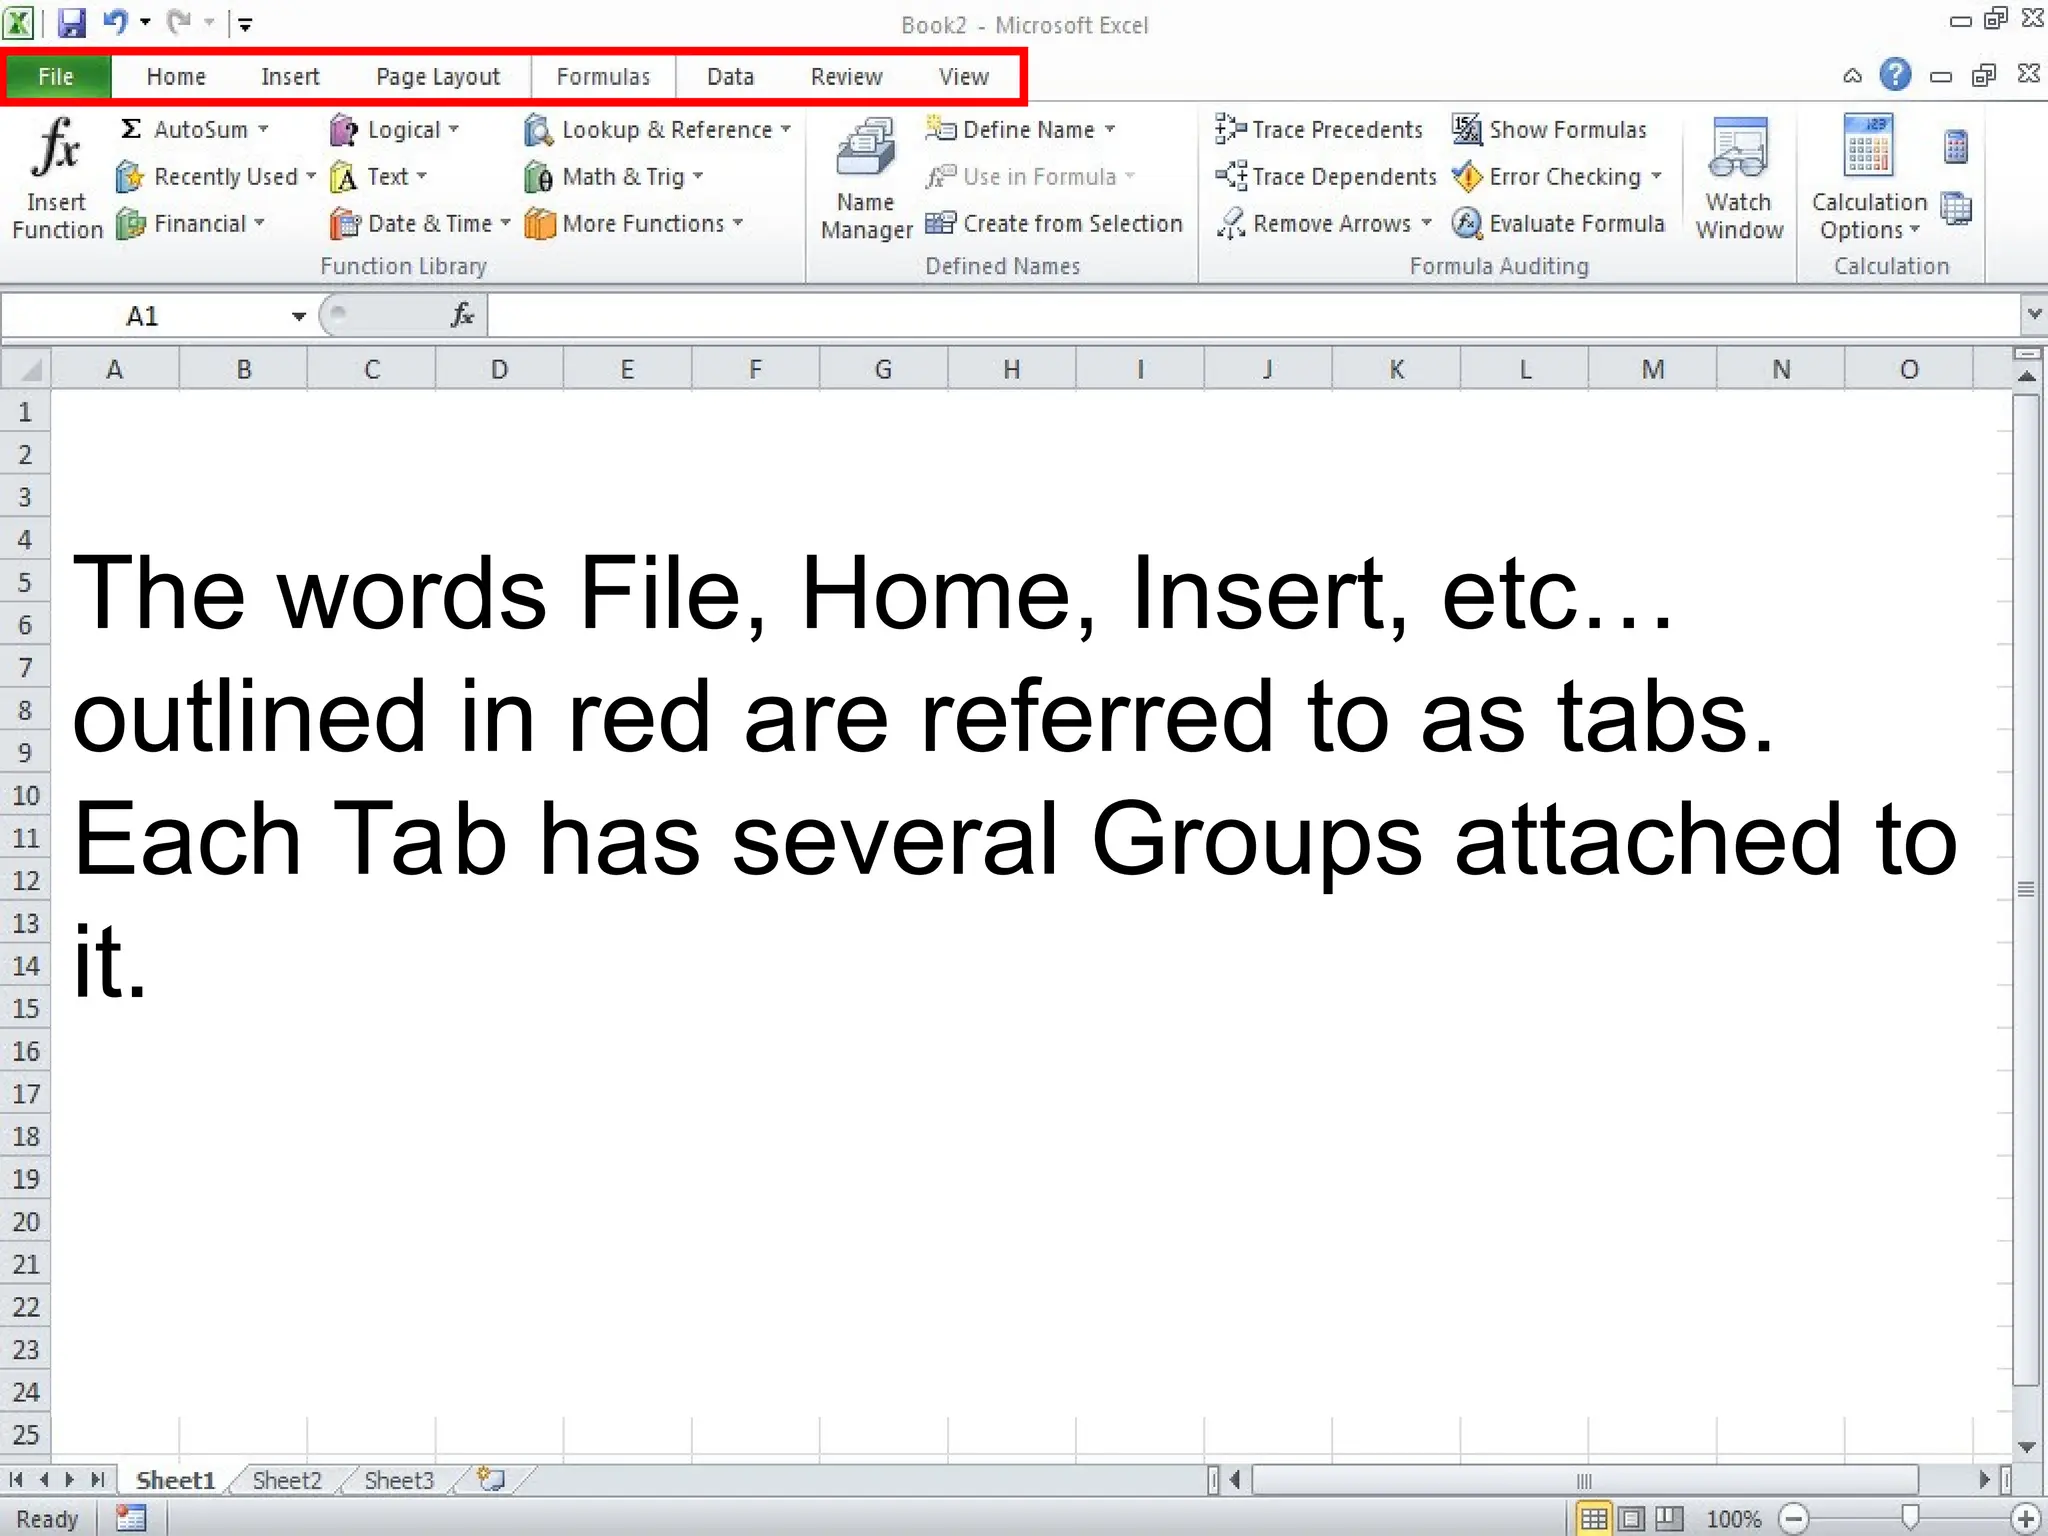
The words File,Home, Insert, etc…
outlined in red are referred to as tabs.
Each Tab has several Groups attached to
it.
30.
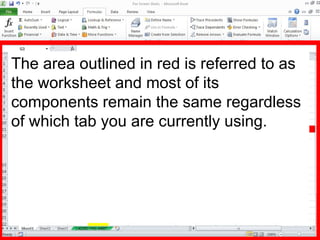
The area outlinedin red is referred to as
the worksheet and most of its
components remain the same regardless
of which tab you are currently using.
31.
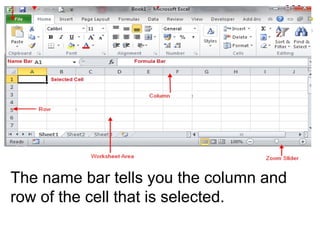
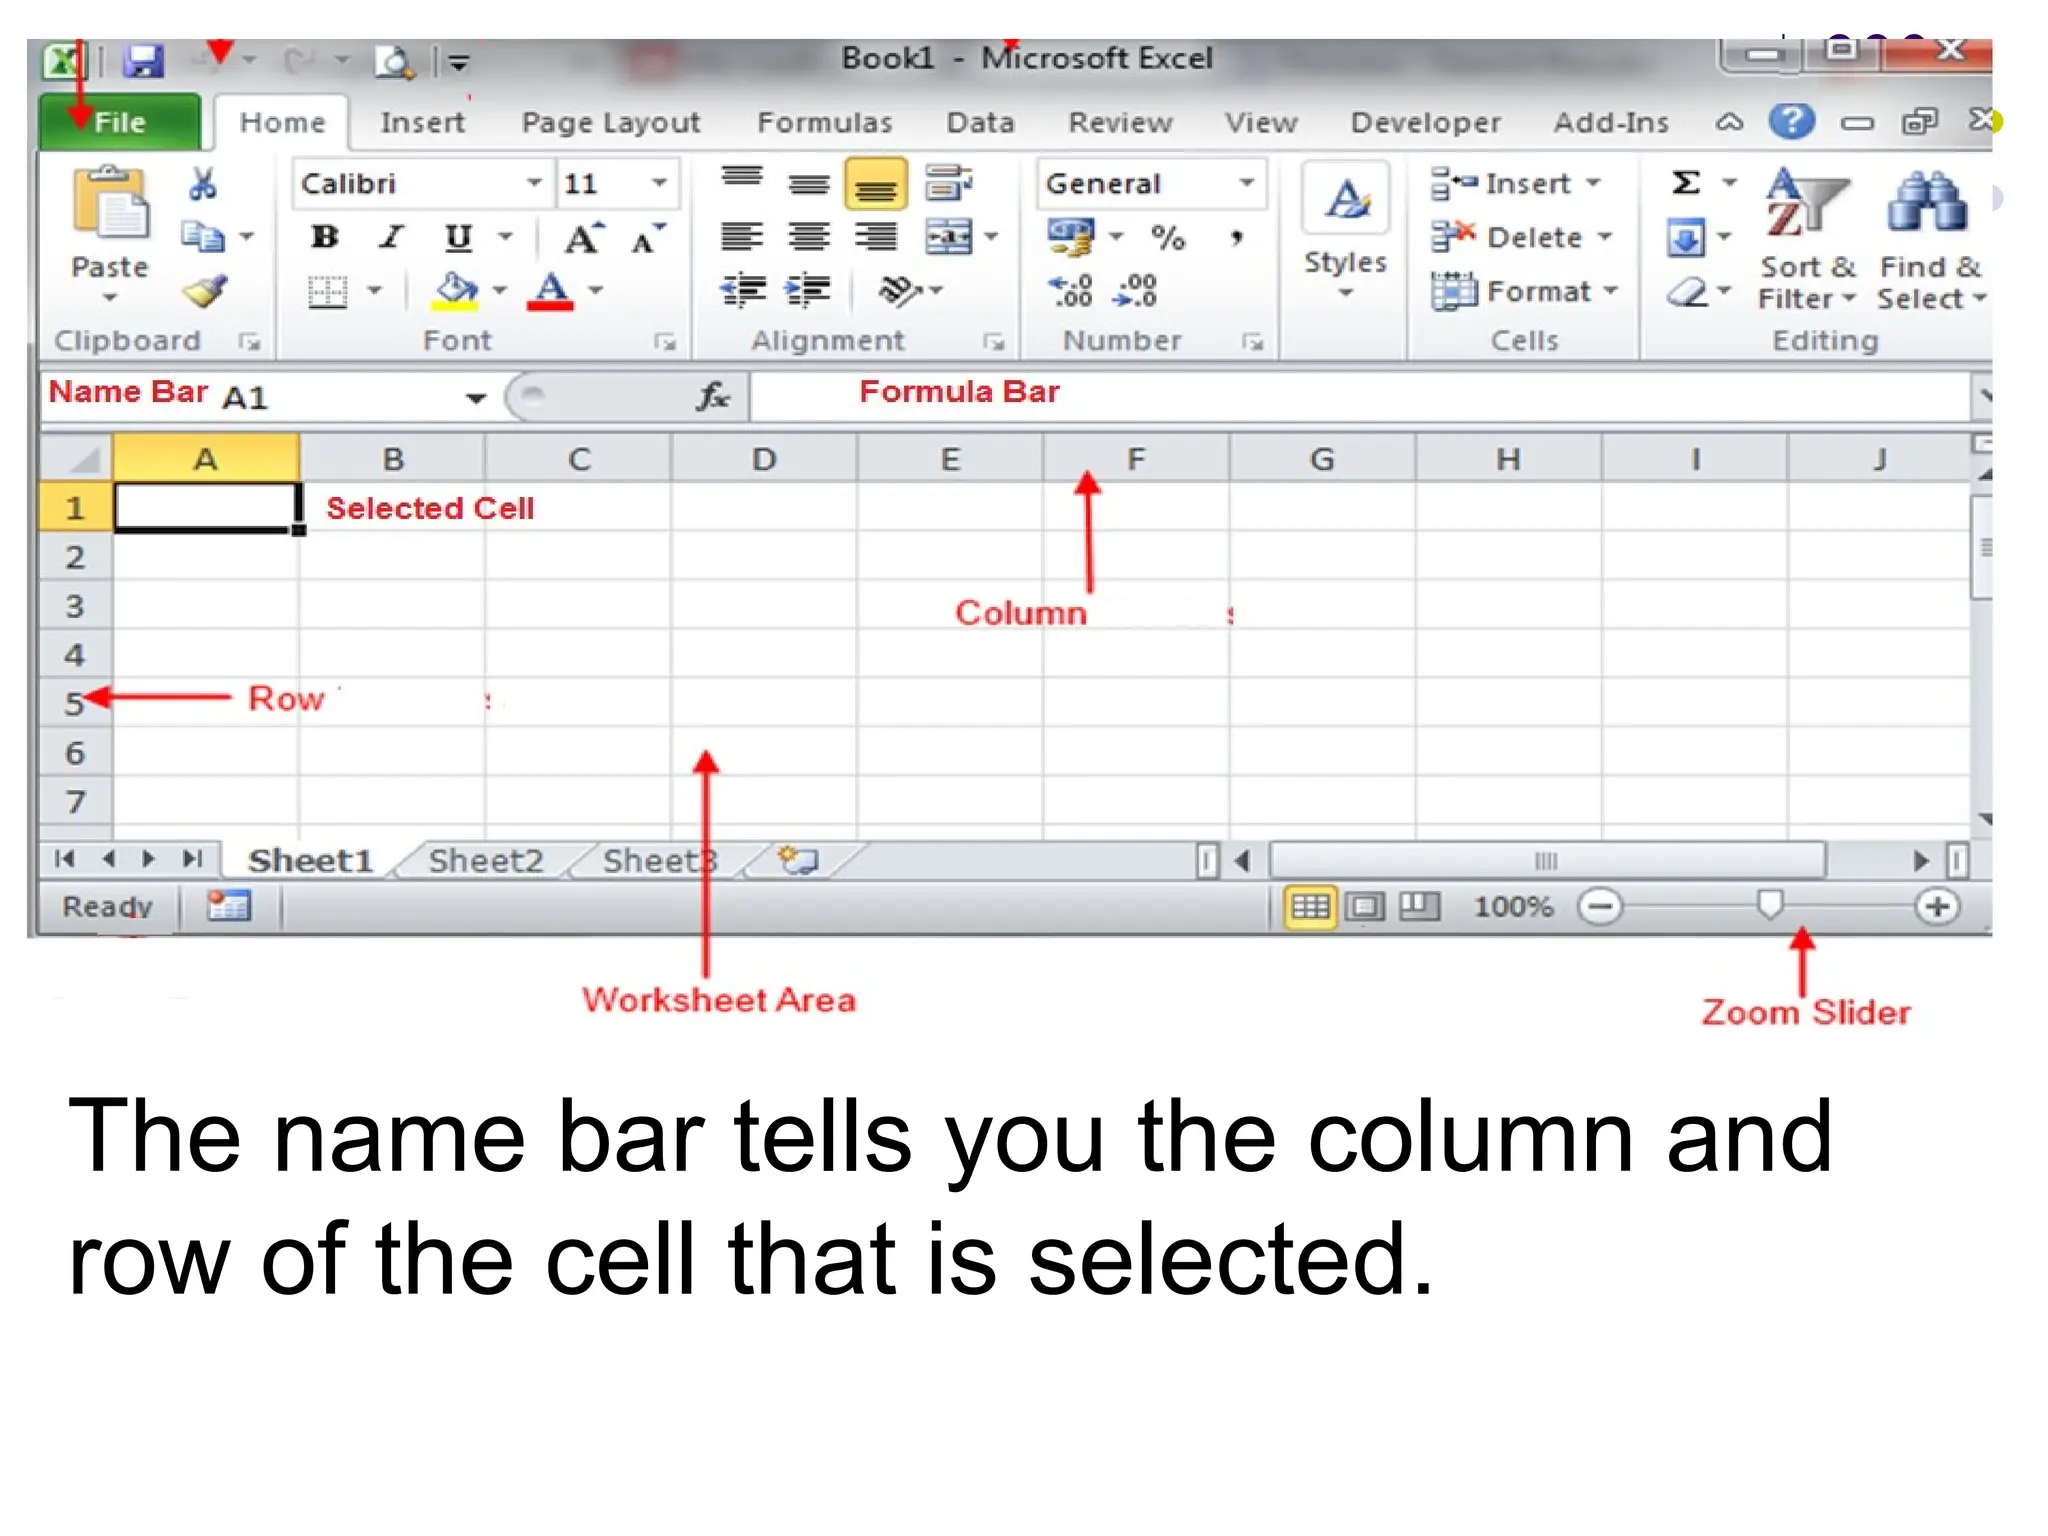
The name bartells you the column and
row of the cell that is selected.
32.
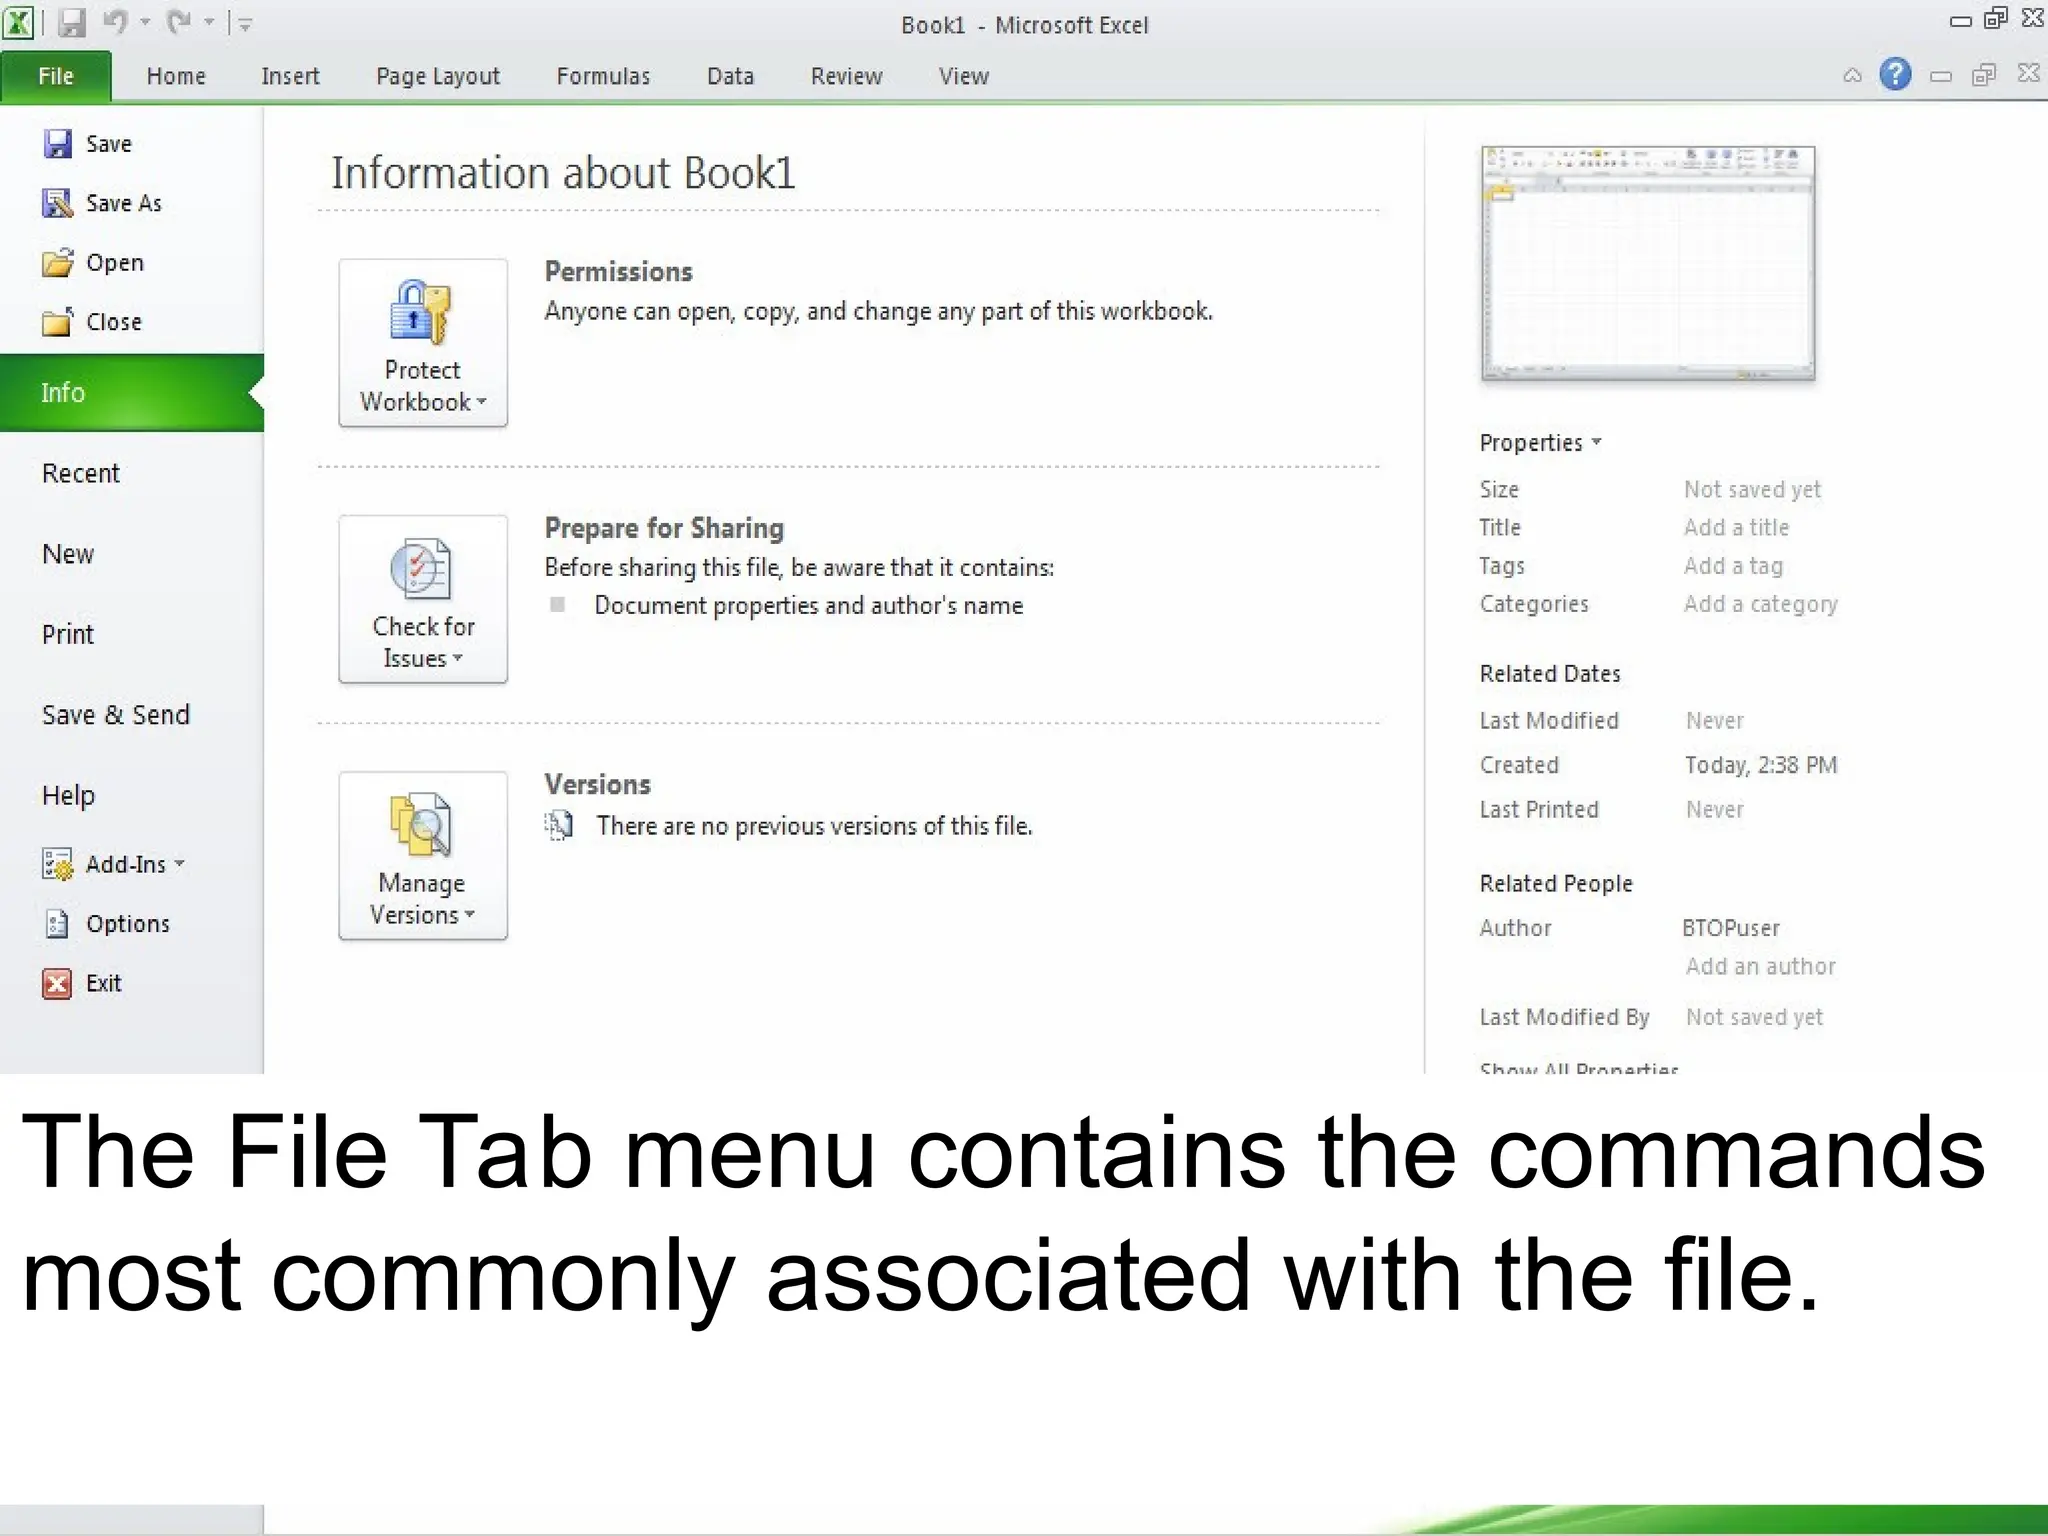
The File Tabmenu contains the commands
most commonly associated with the file.
33.
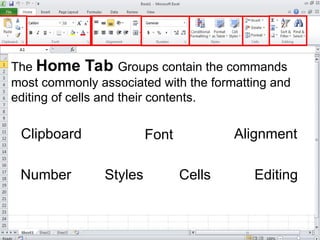
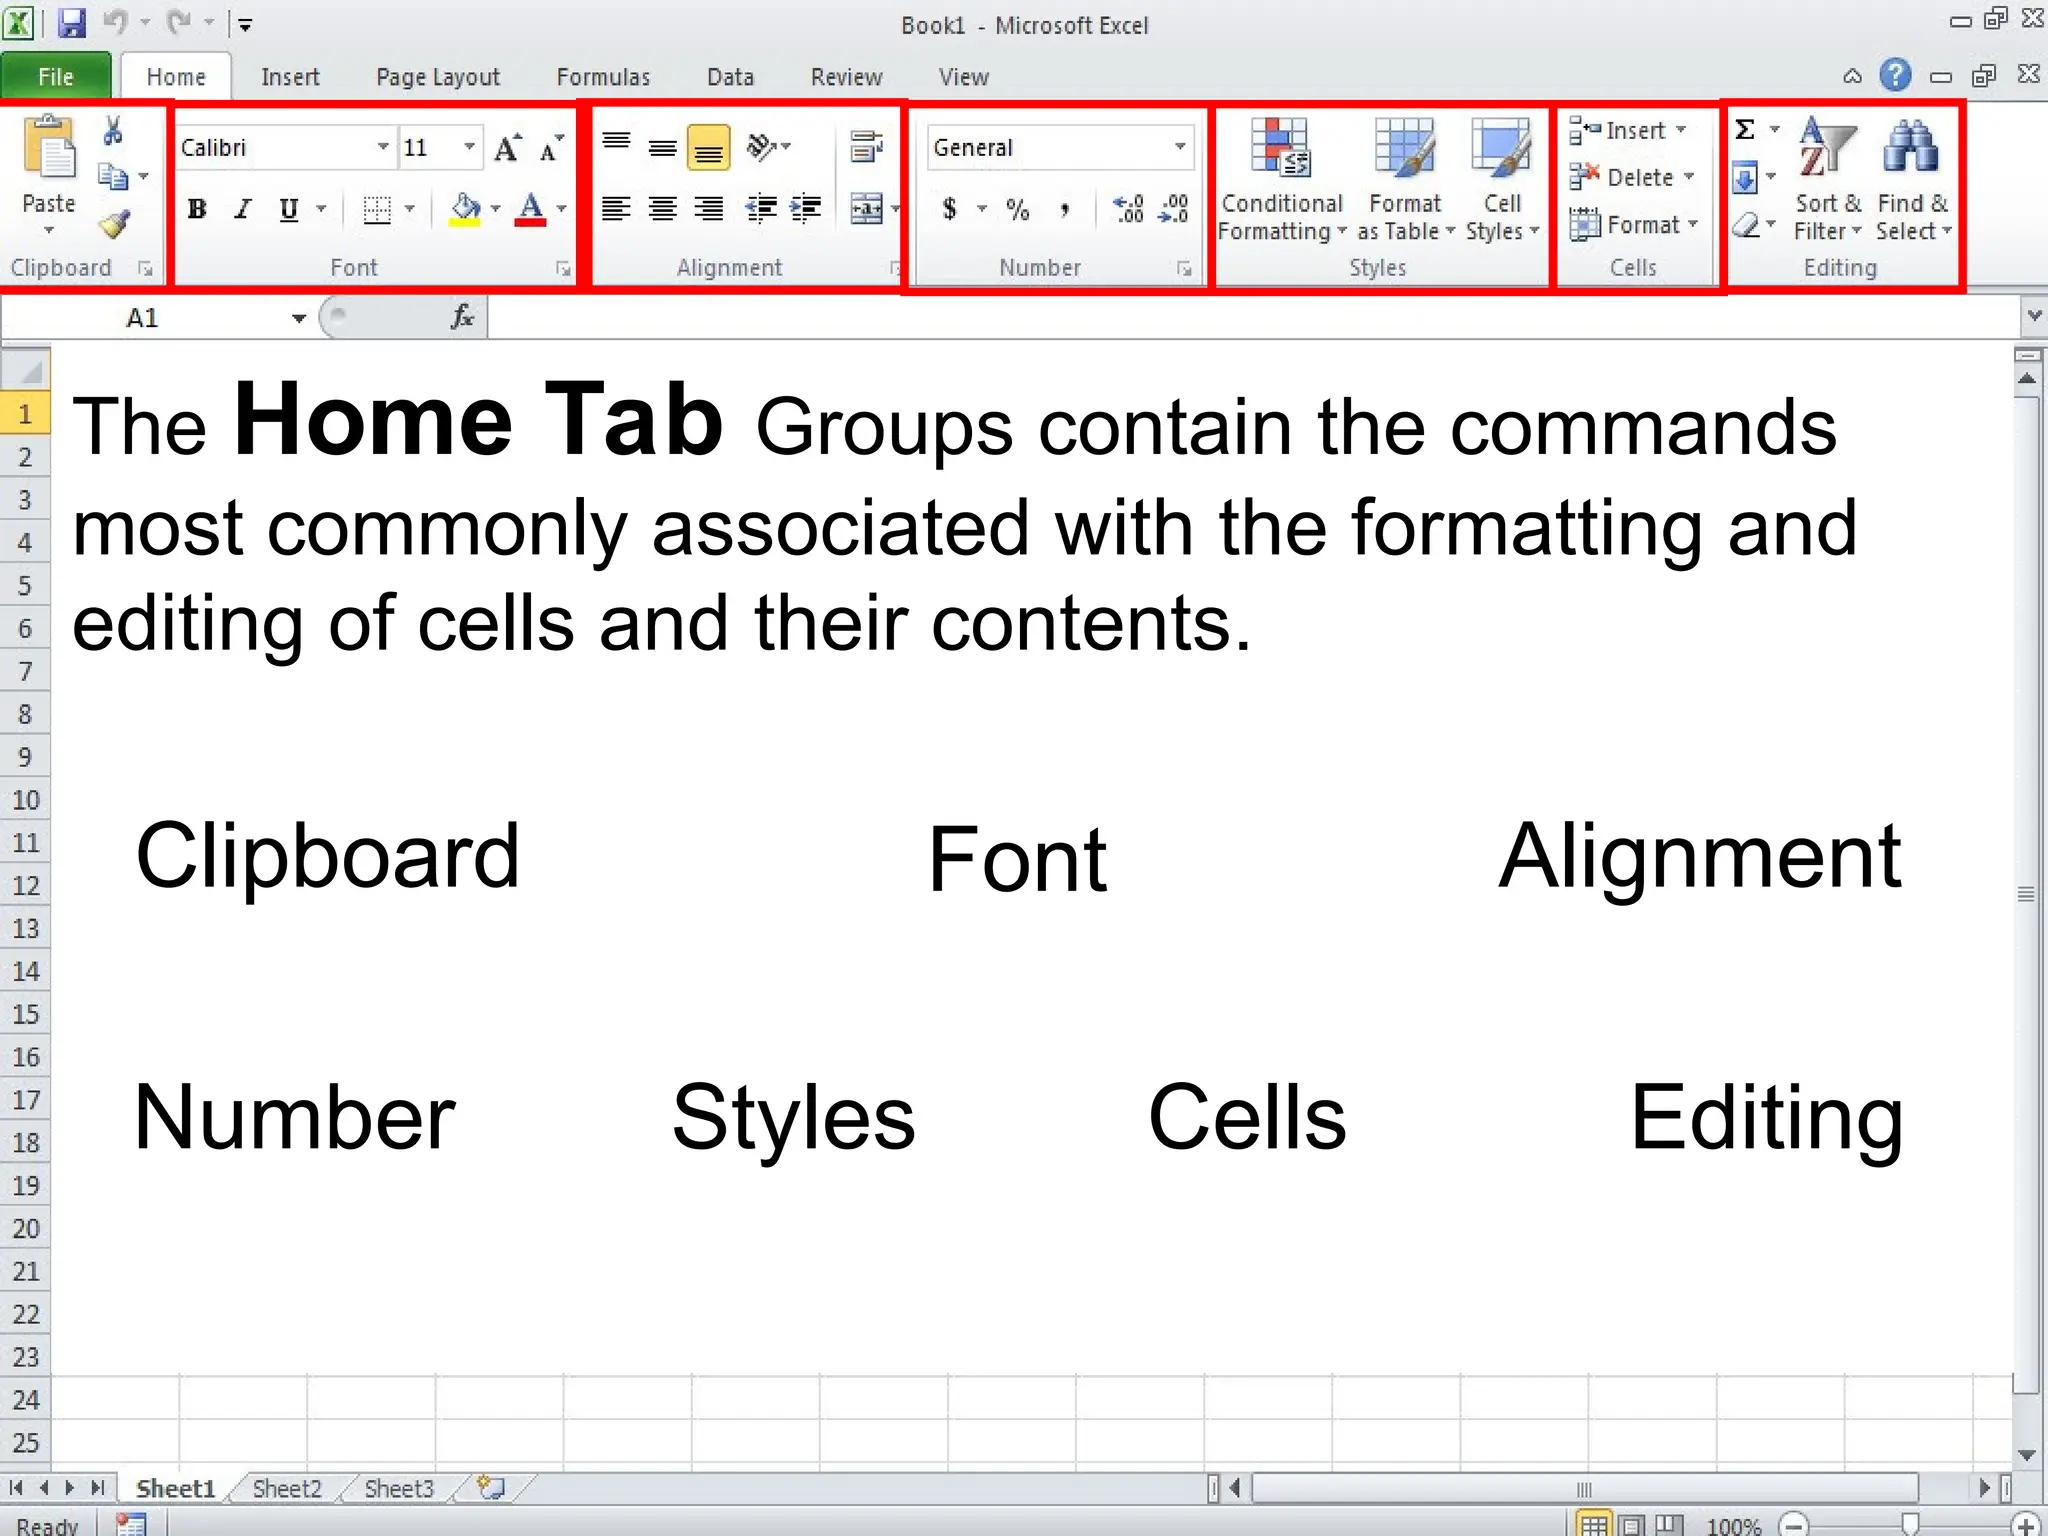
The Home TabGroups contain the commands
most commonly associated with the formatting and
editing of cells and their contents.
Clipboard Font Alignment
Number Styles Cells Editing
34.
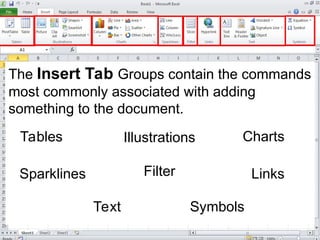
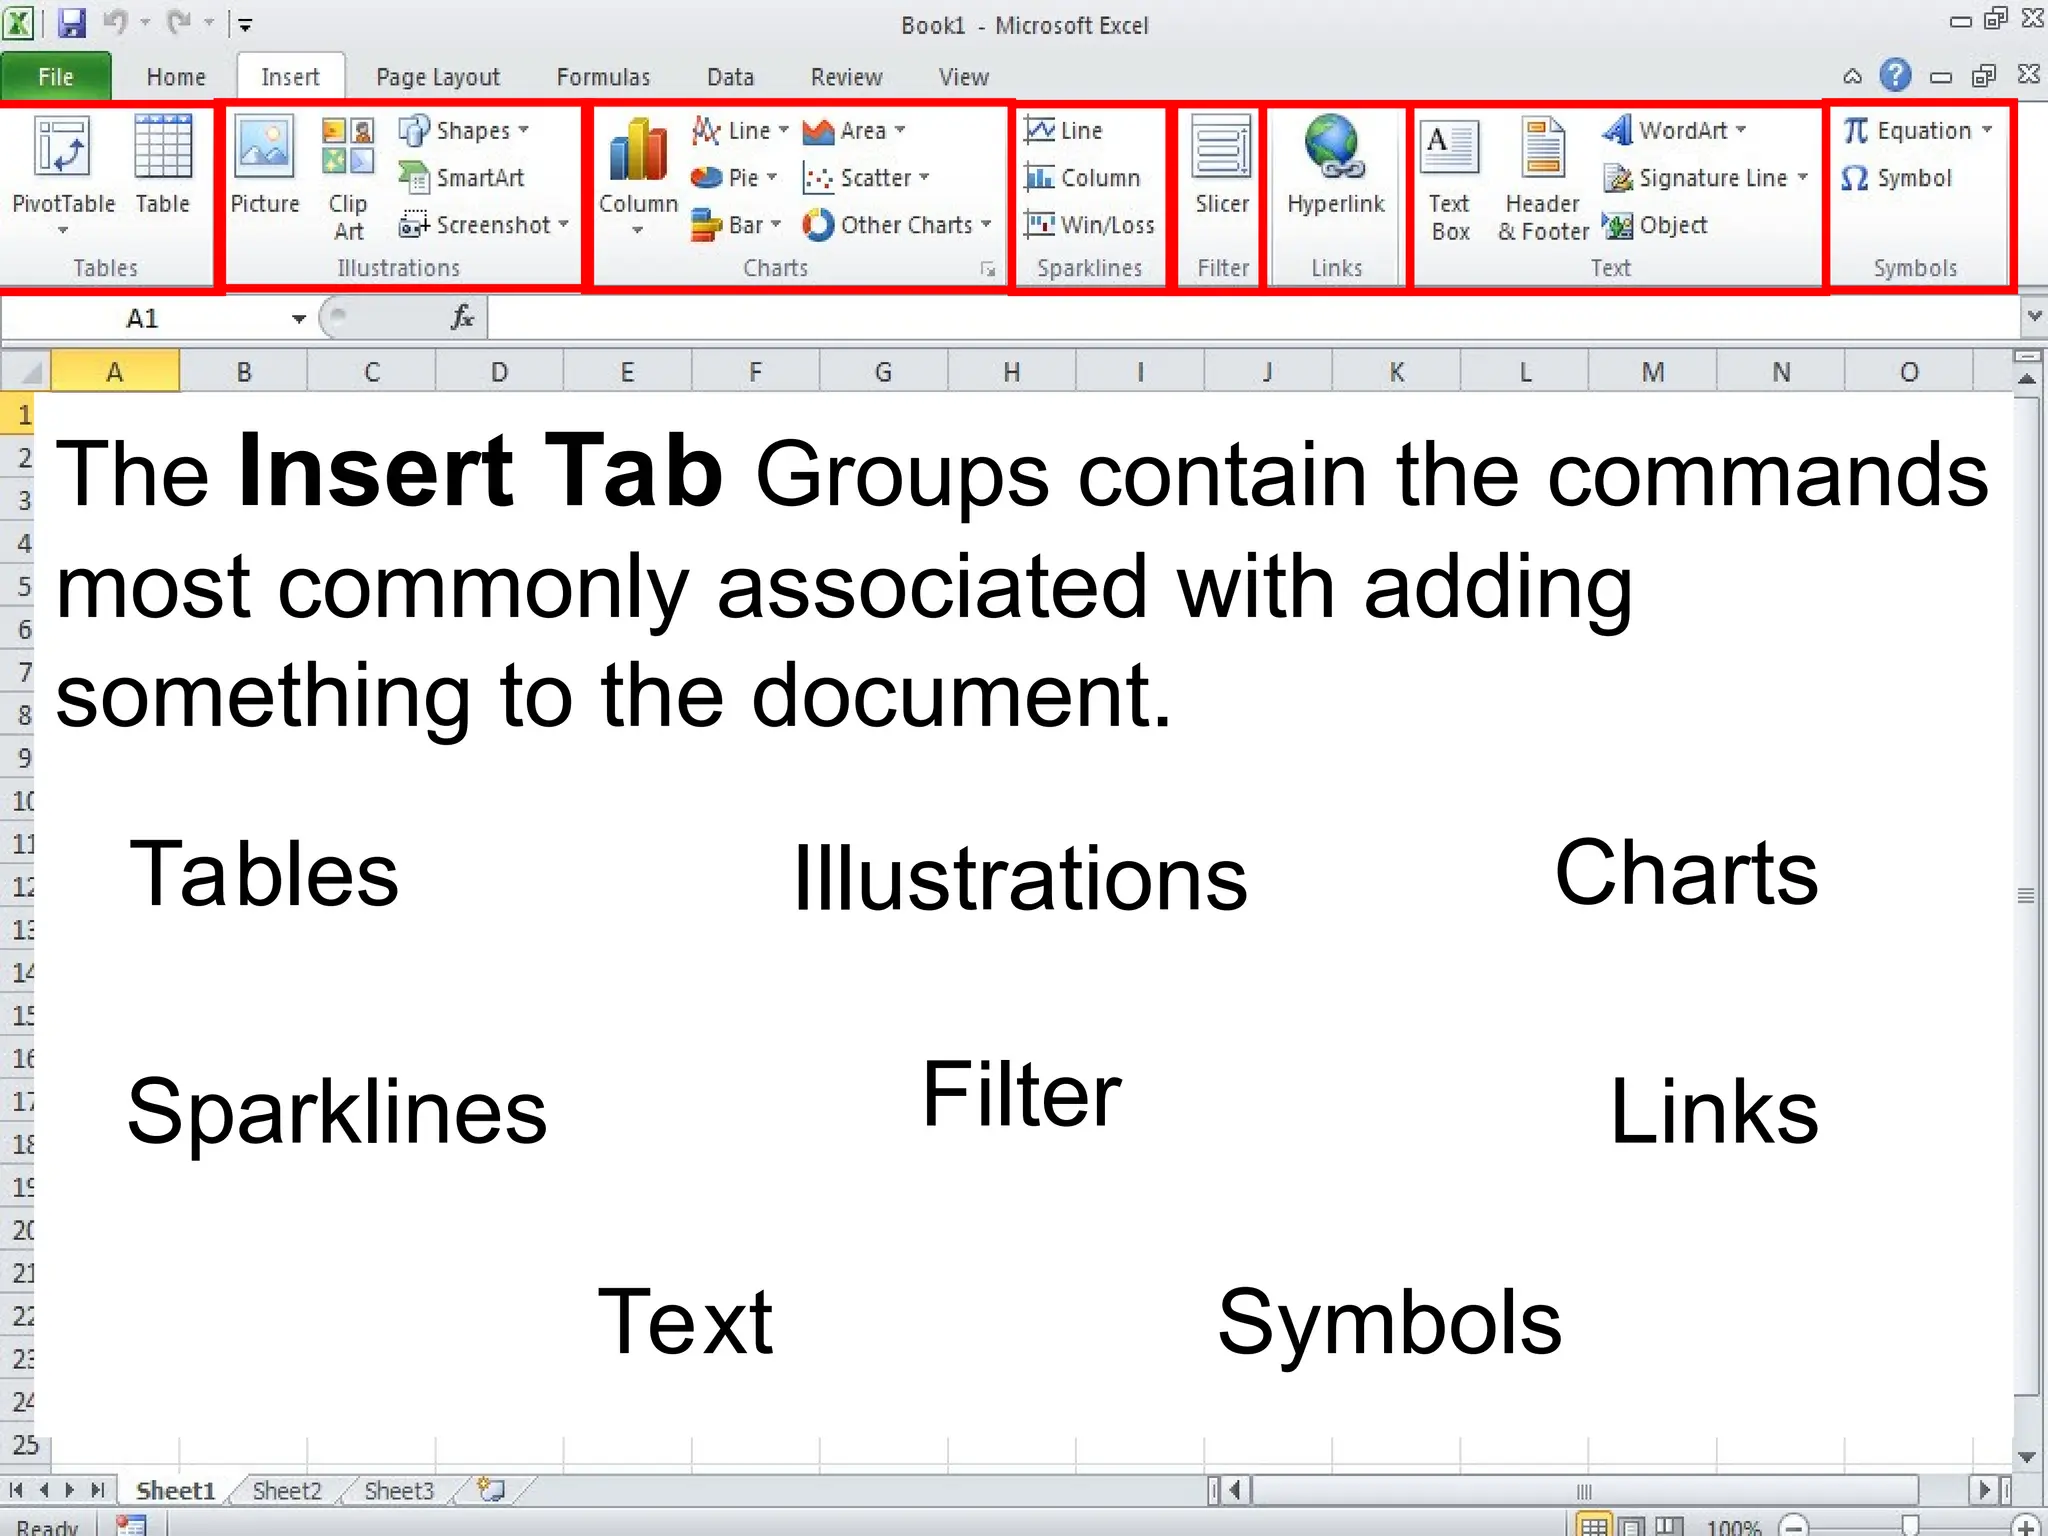
The Insert TabGroups contain the commands
most commonly associated with adding
something to the document.
Tables Illustrations Charts
Sparklines Filter Links
Text Symbols
35.
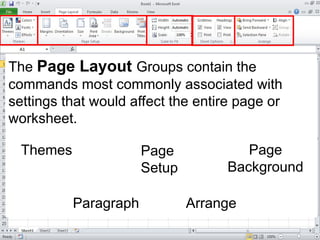
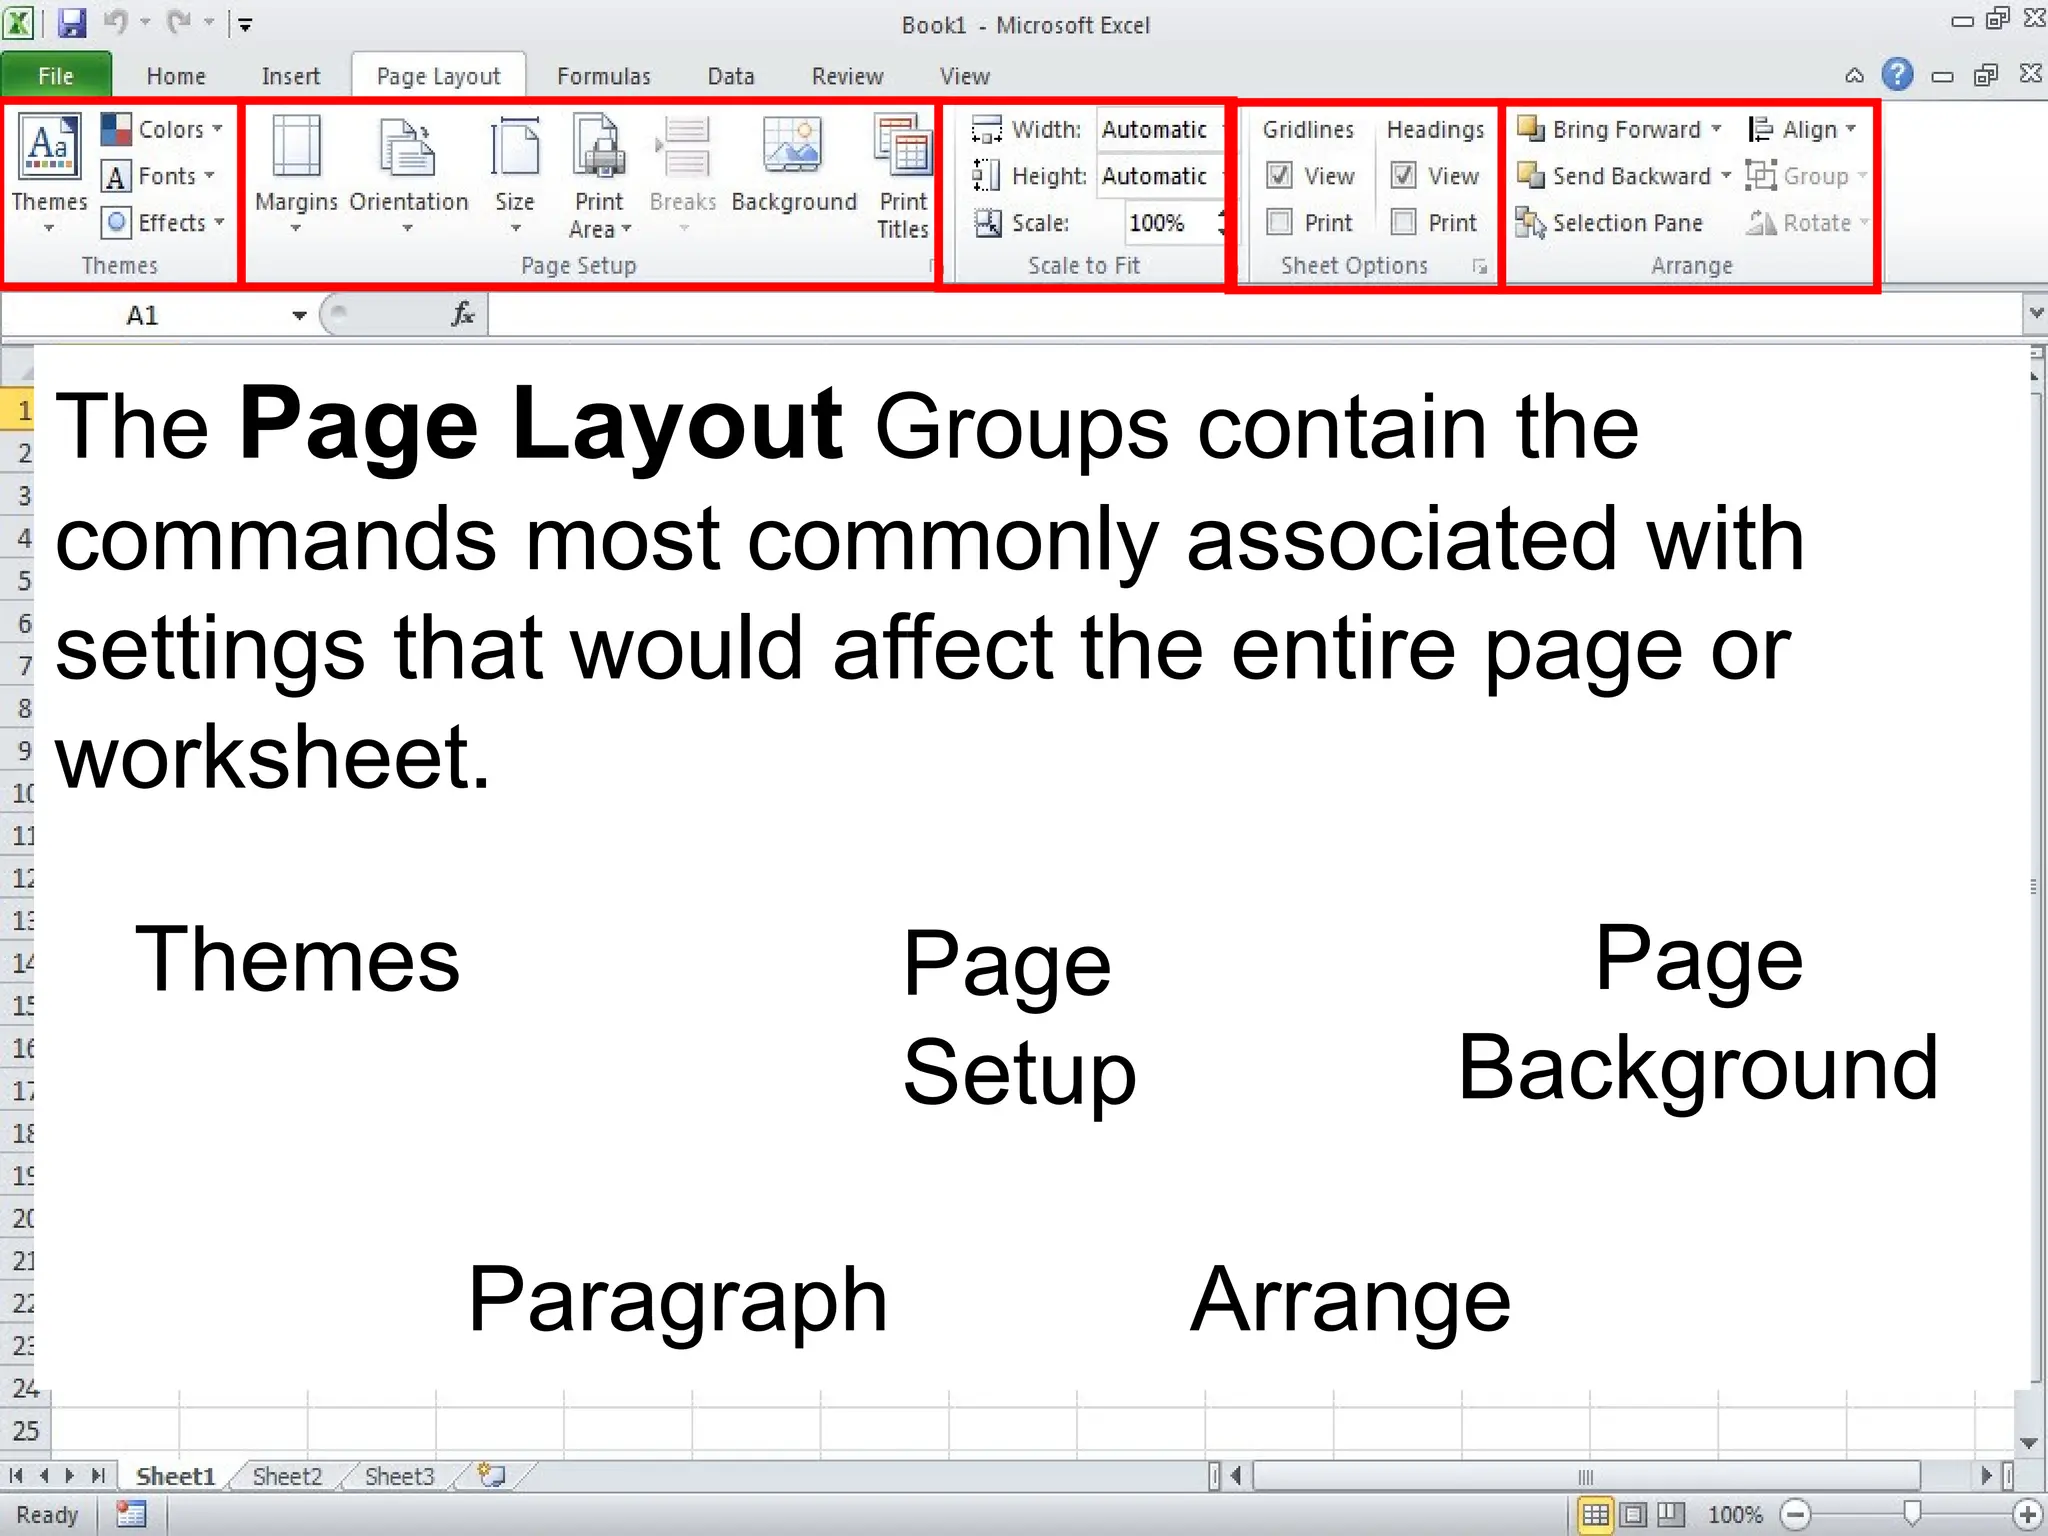
The Page LayoutGroups contain the
commands most commonly associated with
settings that would affect the entire page or
worksheet.
Themes Page
Setup
Page
Background
Paragraph Arrange
36.
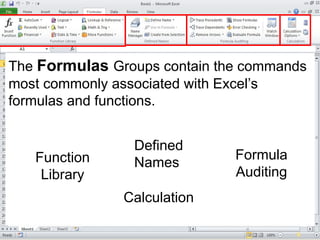
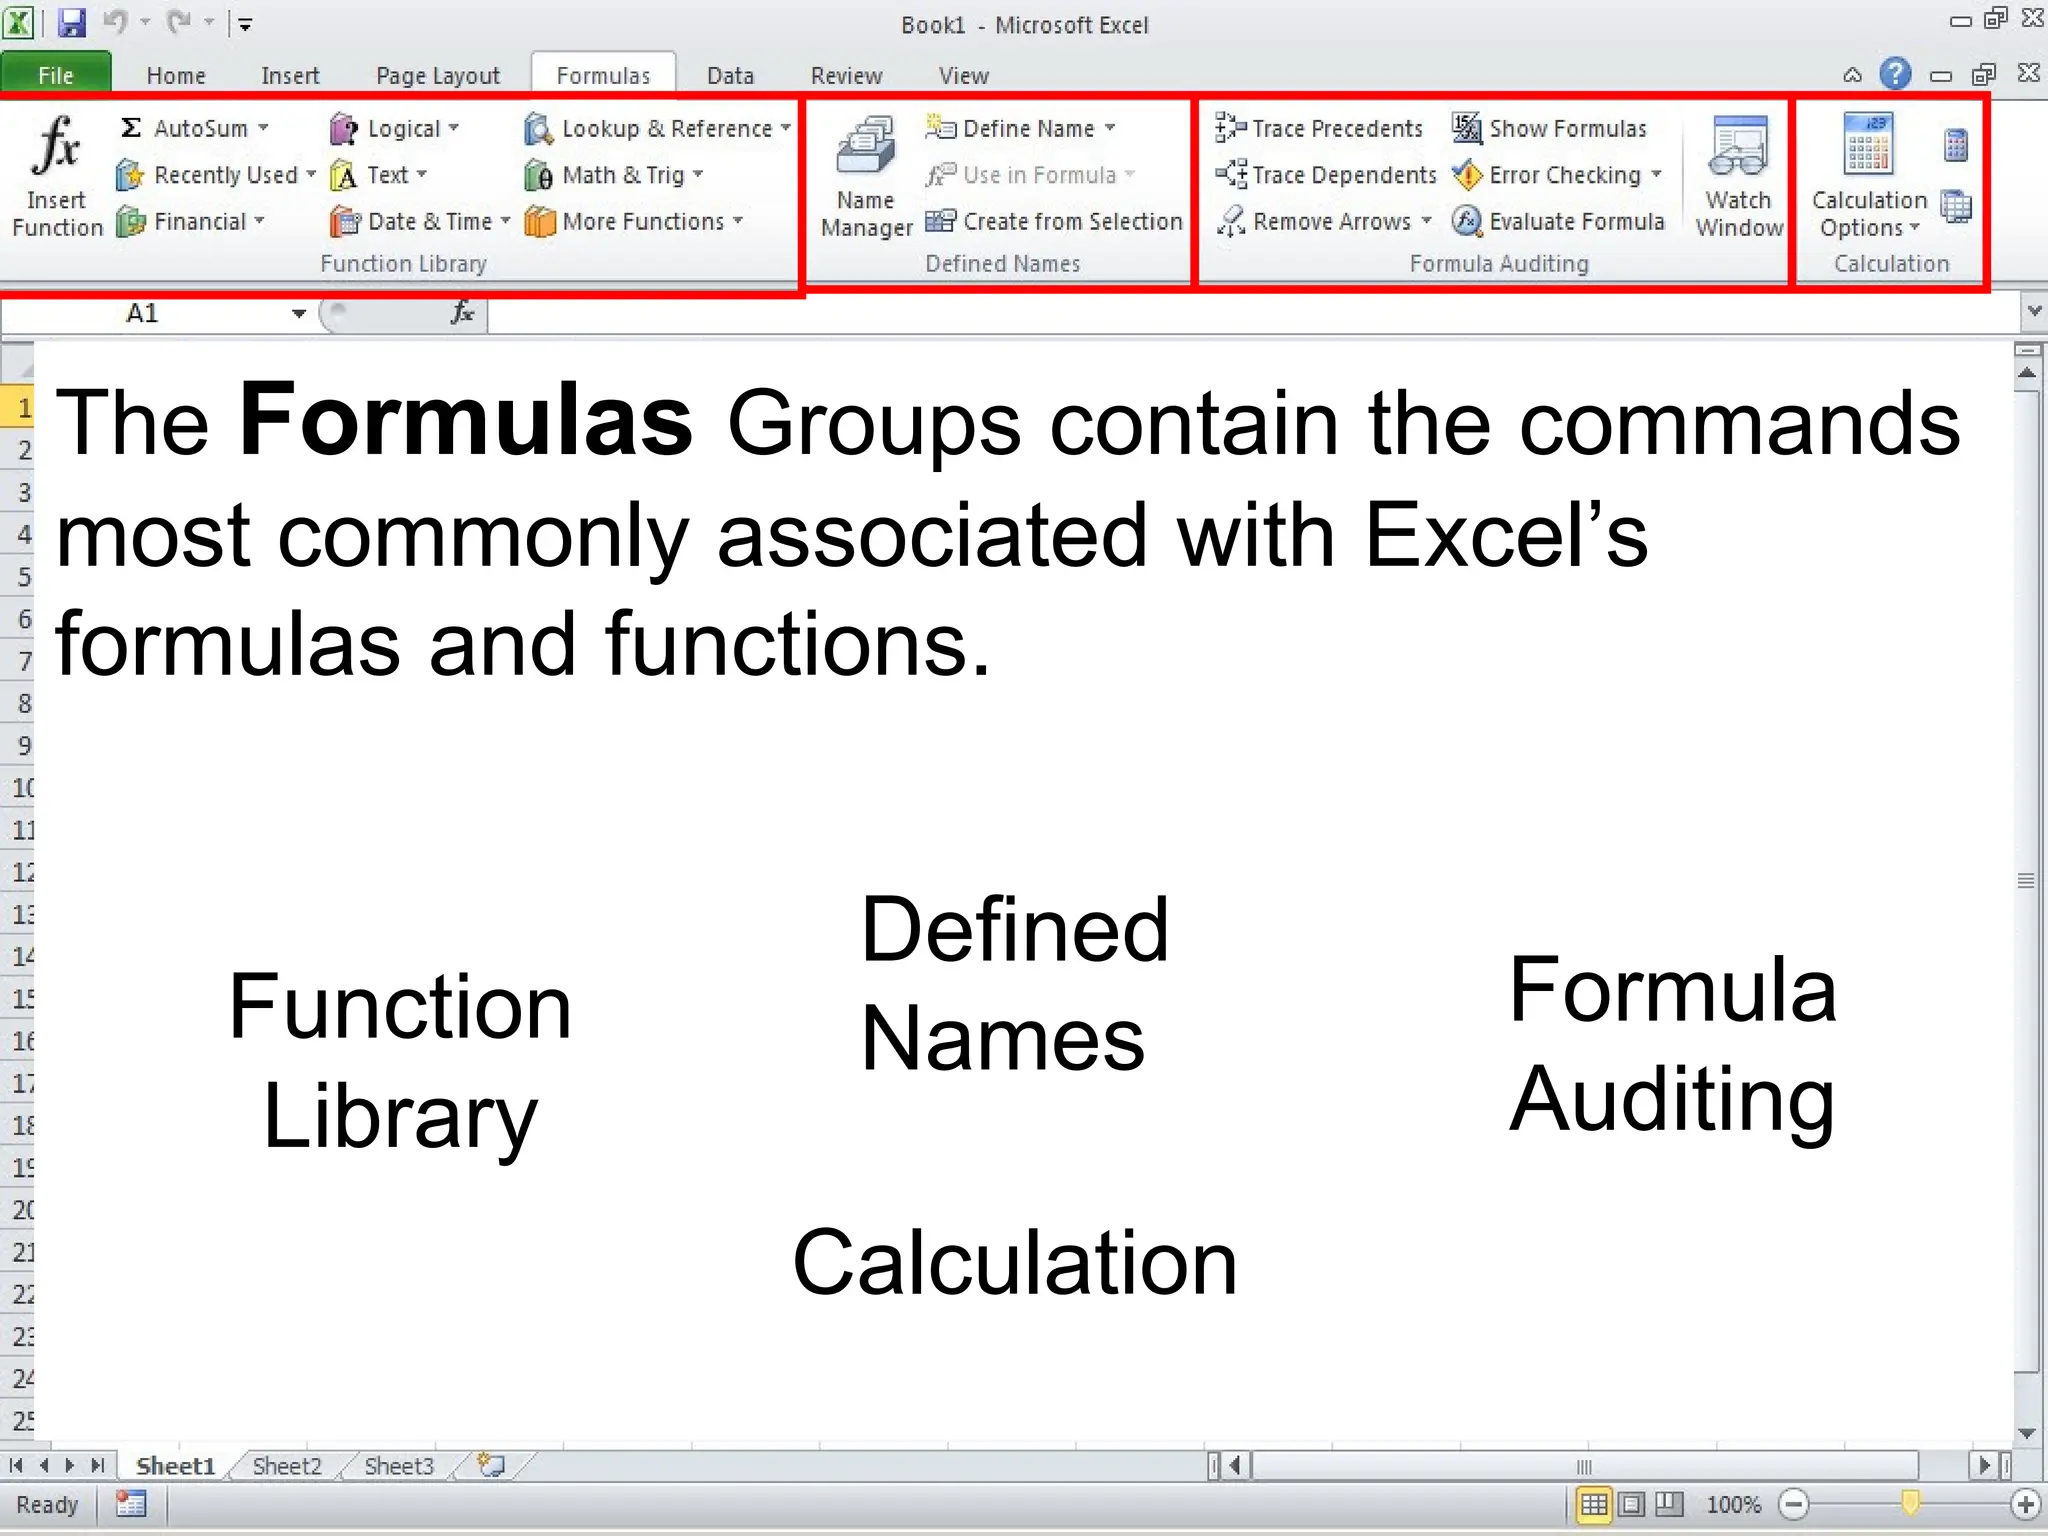
The Formulas Groupscontain the commands
most commonly associated with Excel’s
formulas and functions.
Function
Library
Defined
Names
Formula
Auditing
Calculation
37.
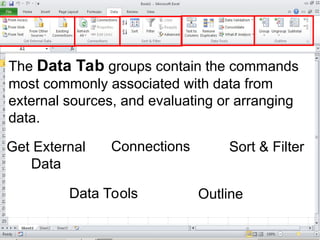
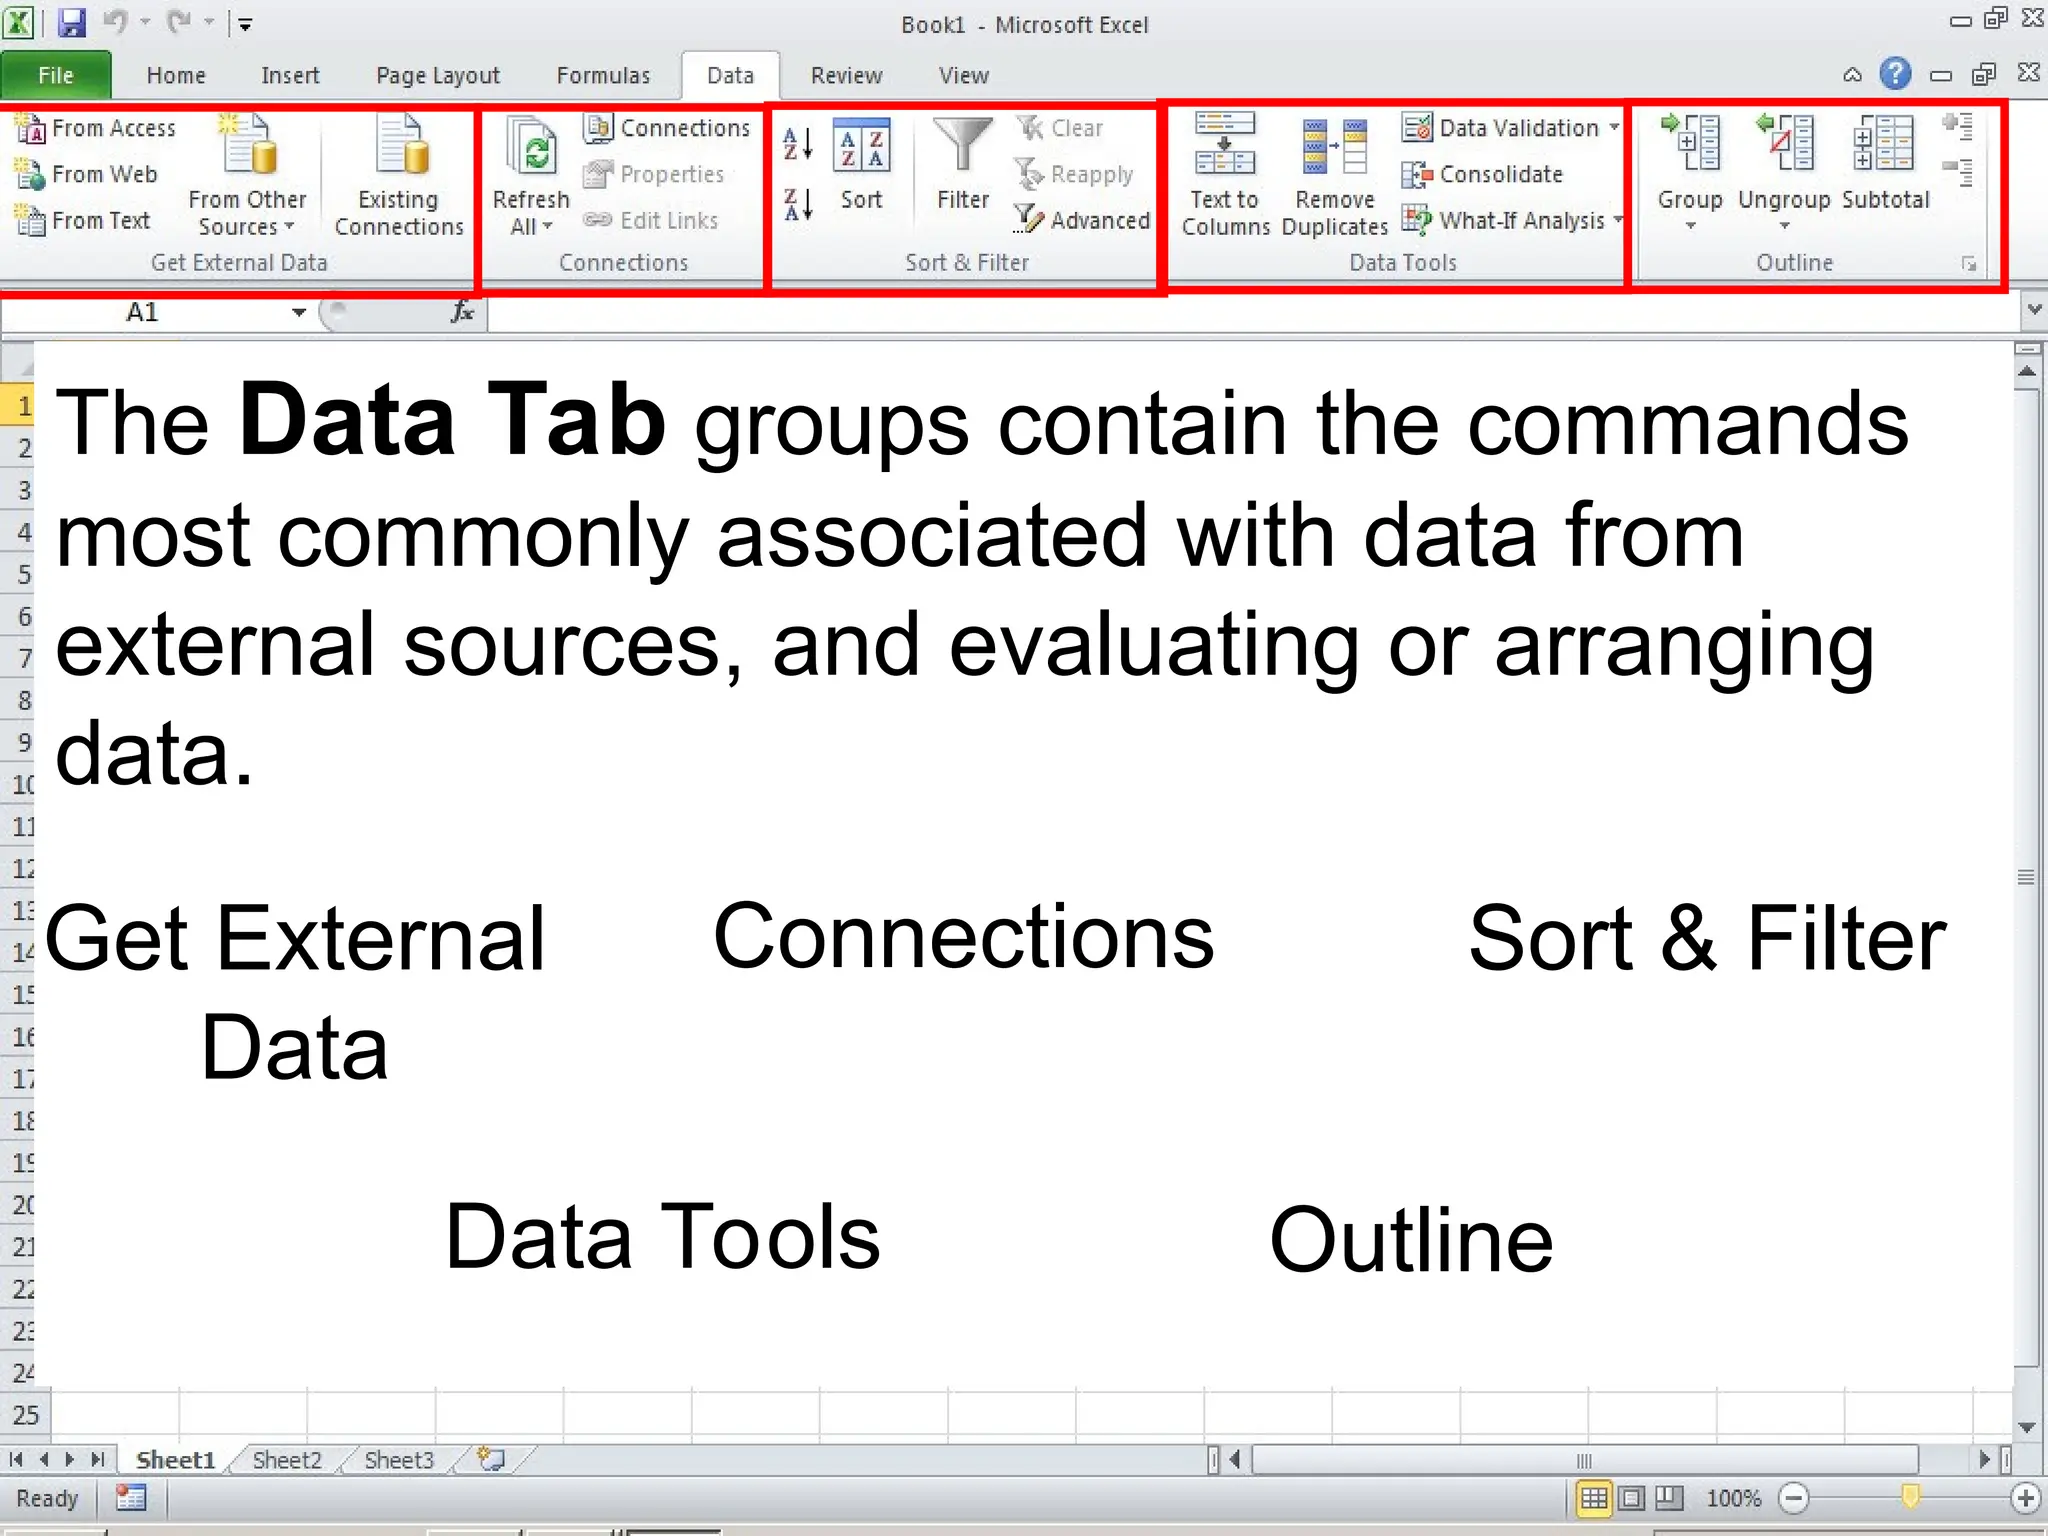
The Data Tabgroups contain the commands
most commonly associated with data from
external sources, and evaluating or arranging
data.
Get External
Data
Connections Sort & Filter
Data Tools Outline
38.
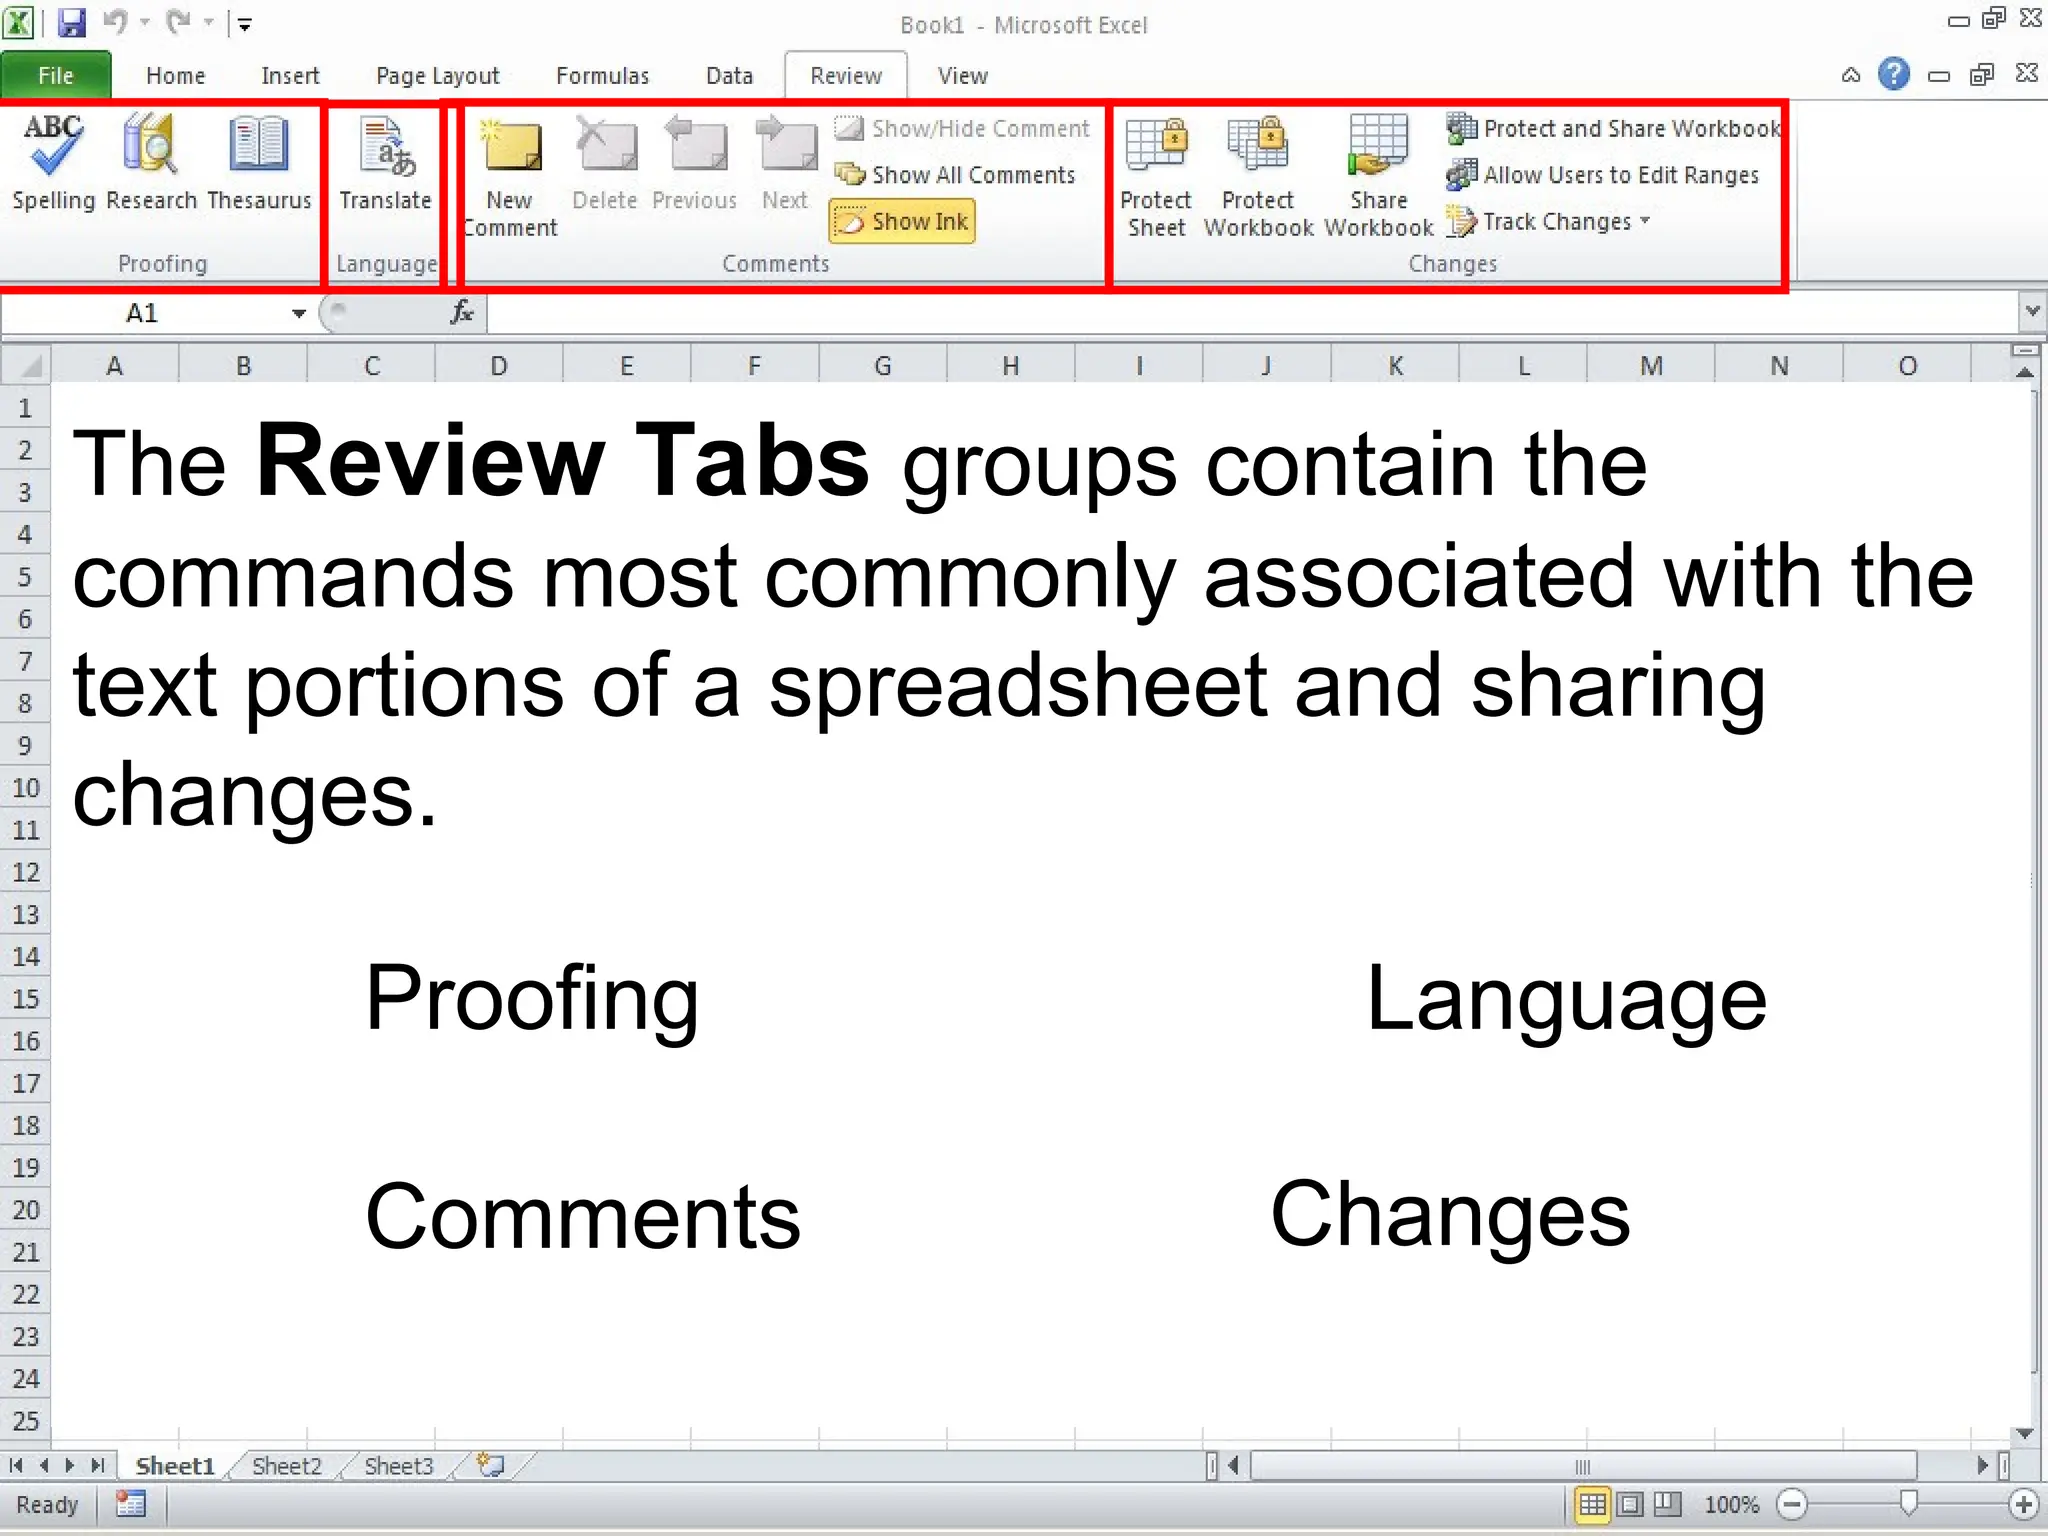
The Review Tabsgroups contain the
commands most commonly associated with the
text portions of a spreadsheet and sharing
changes.
Proofing Language
Comments Changes
39.
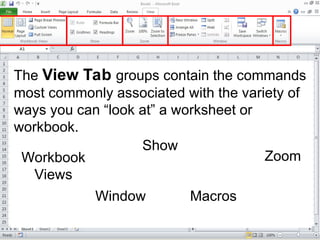
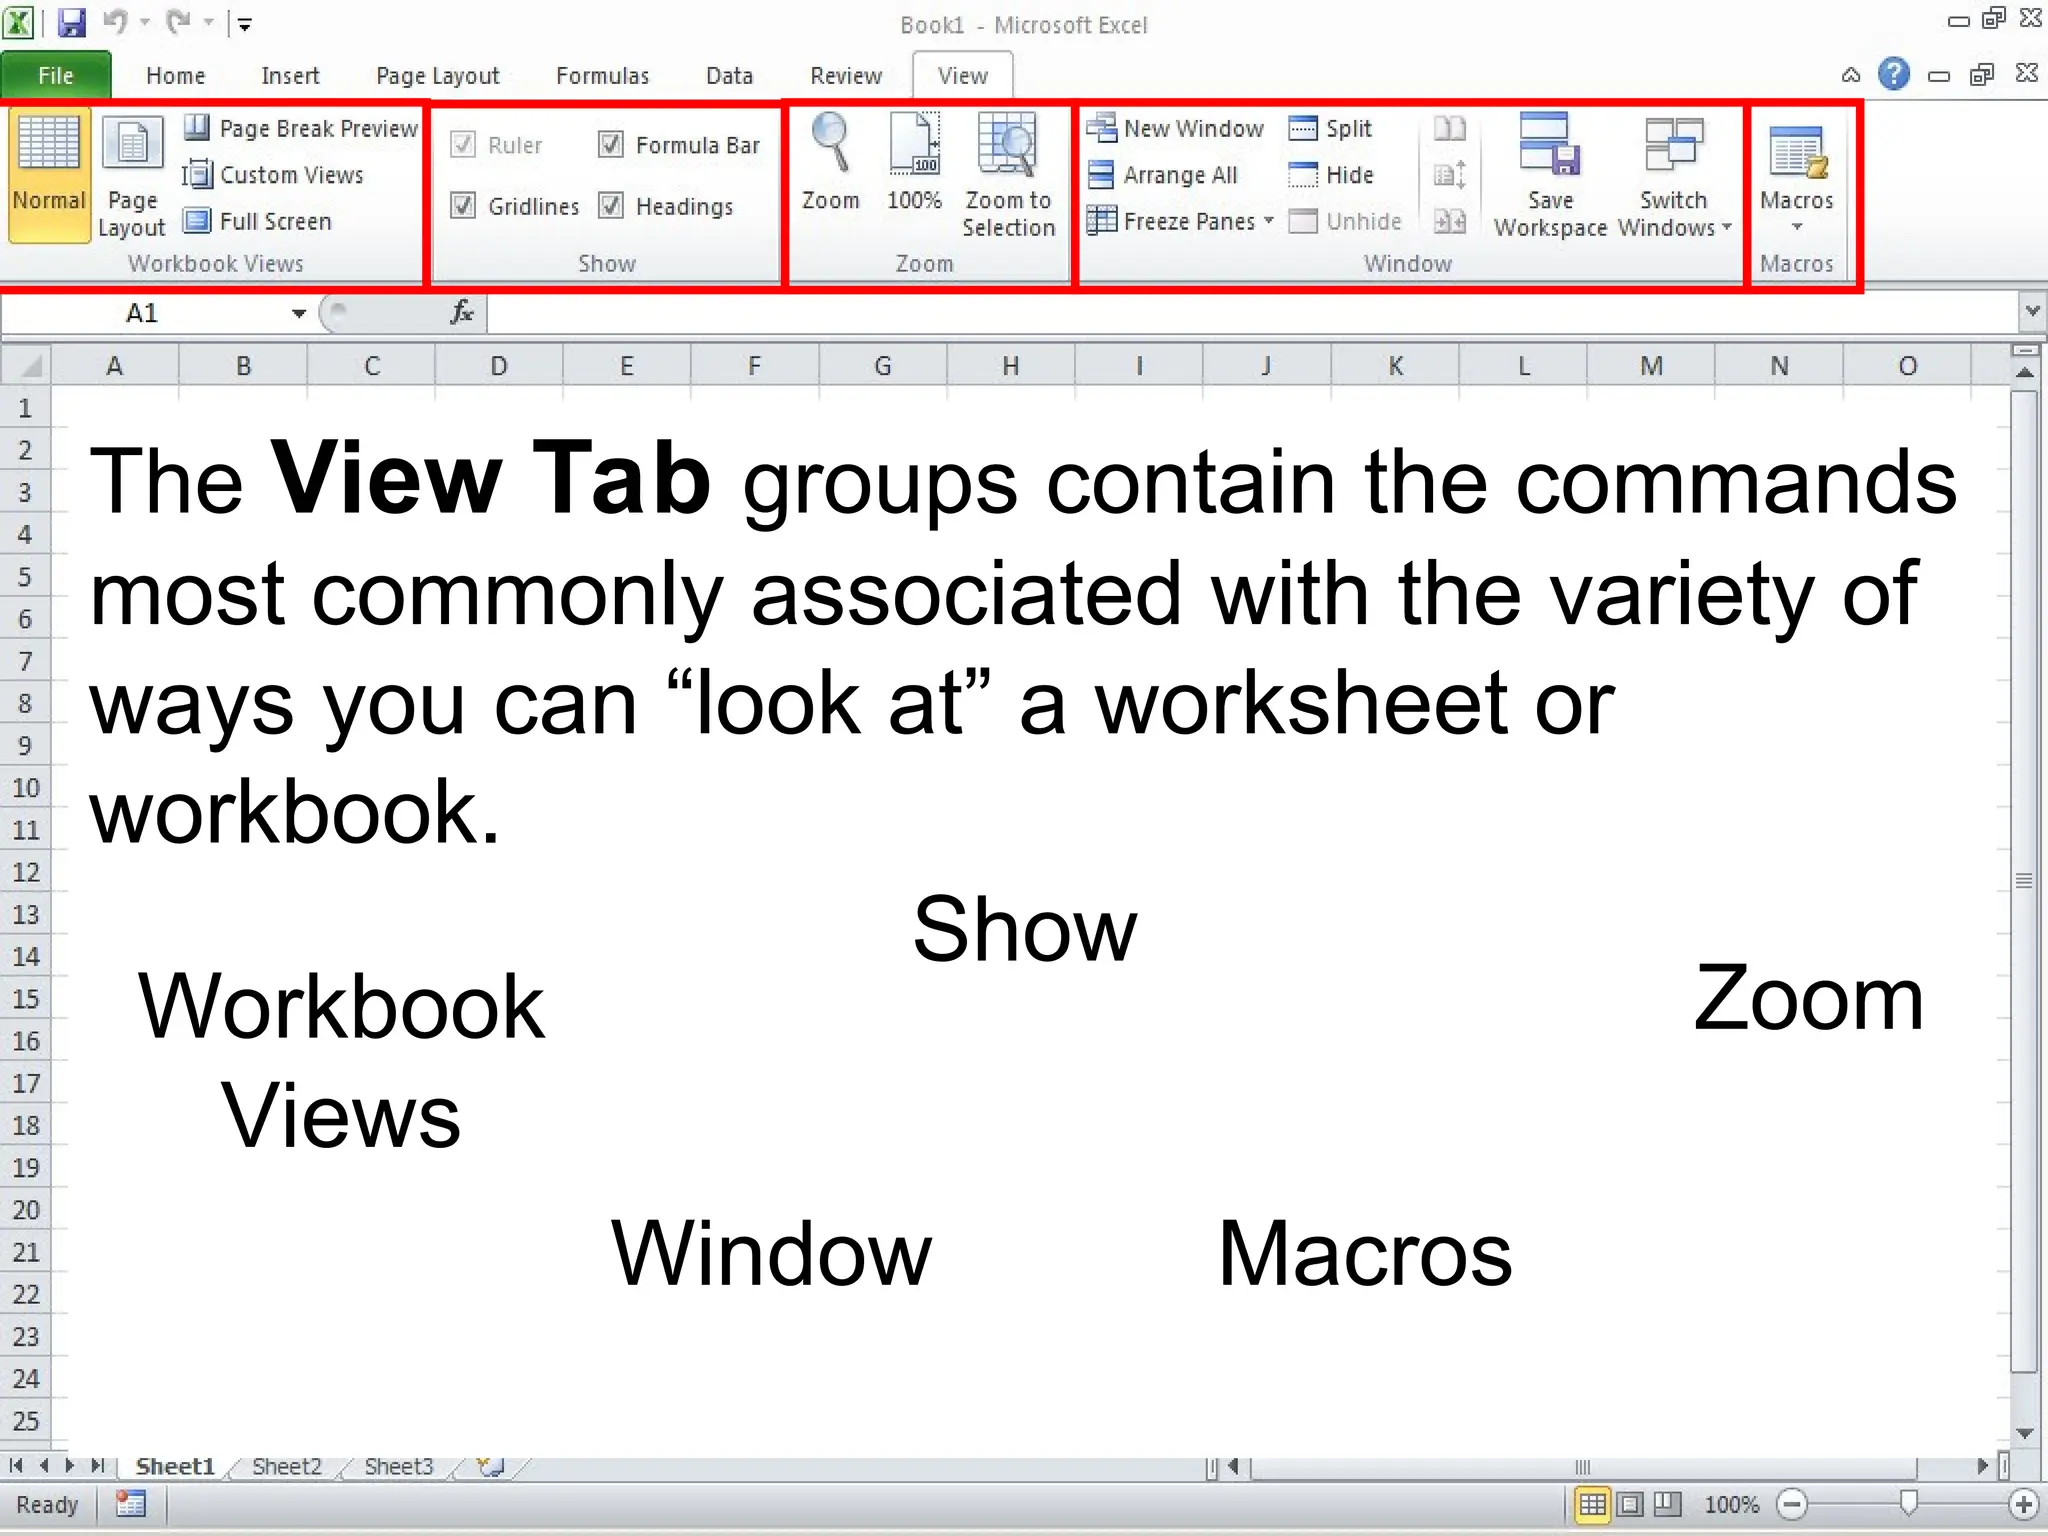
The View Tabgroups contain the commands
most commonly associated with the variety of
ways you can “look at” a worksheet or
workbook.
Workbook
Views
Show
Zoom
Window Macros