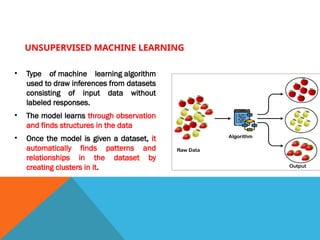
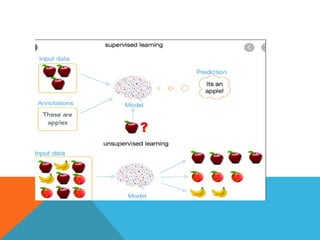
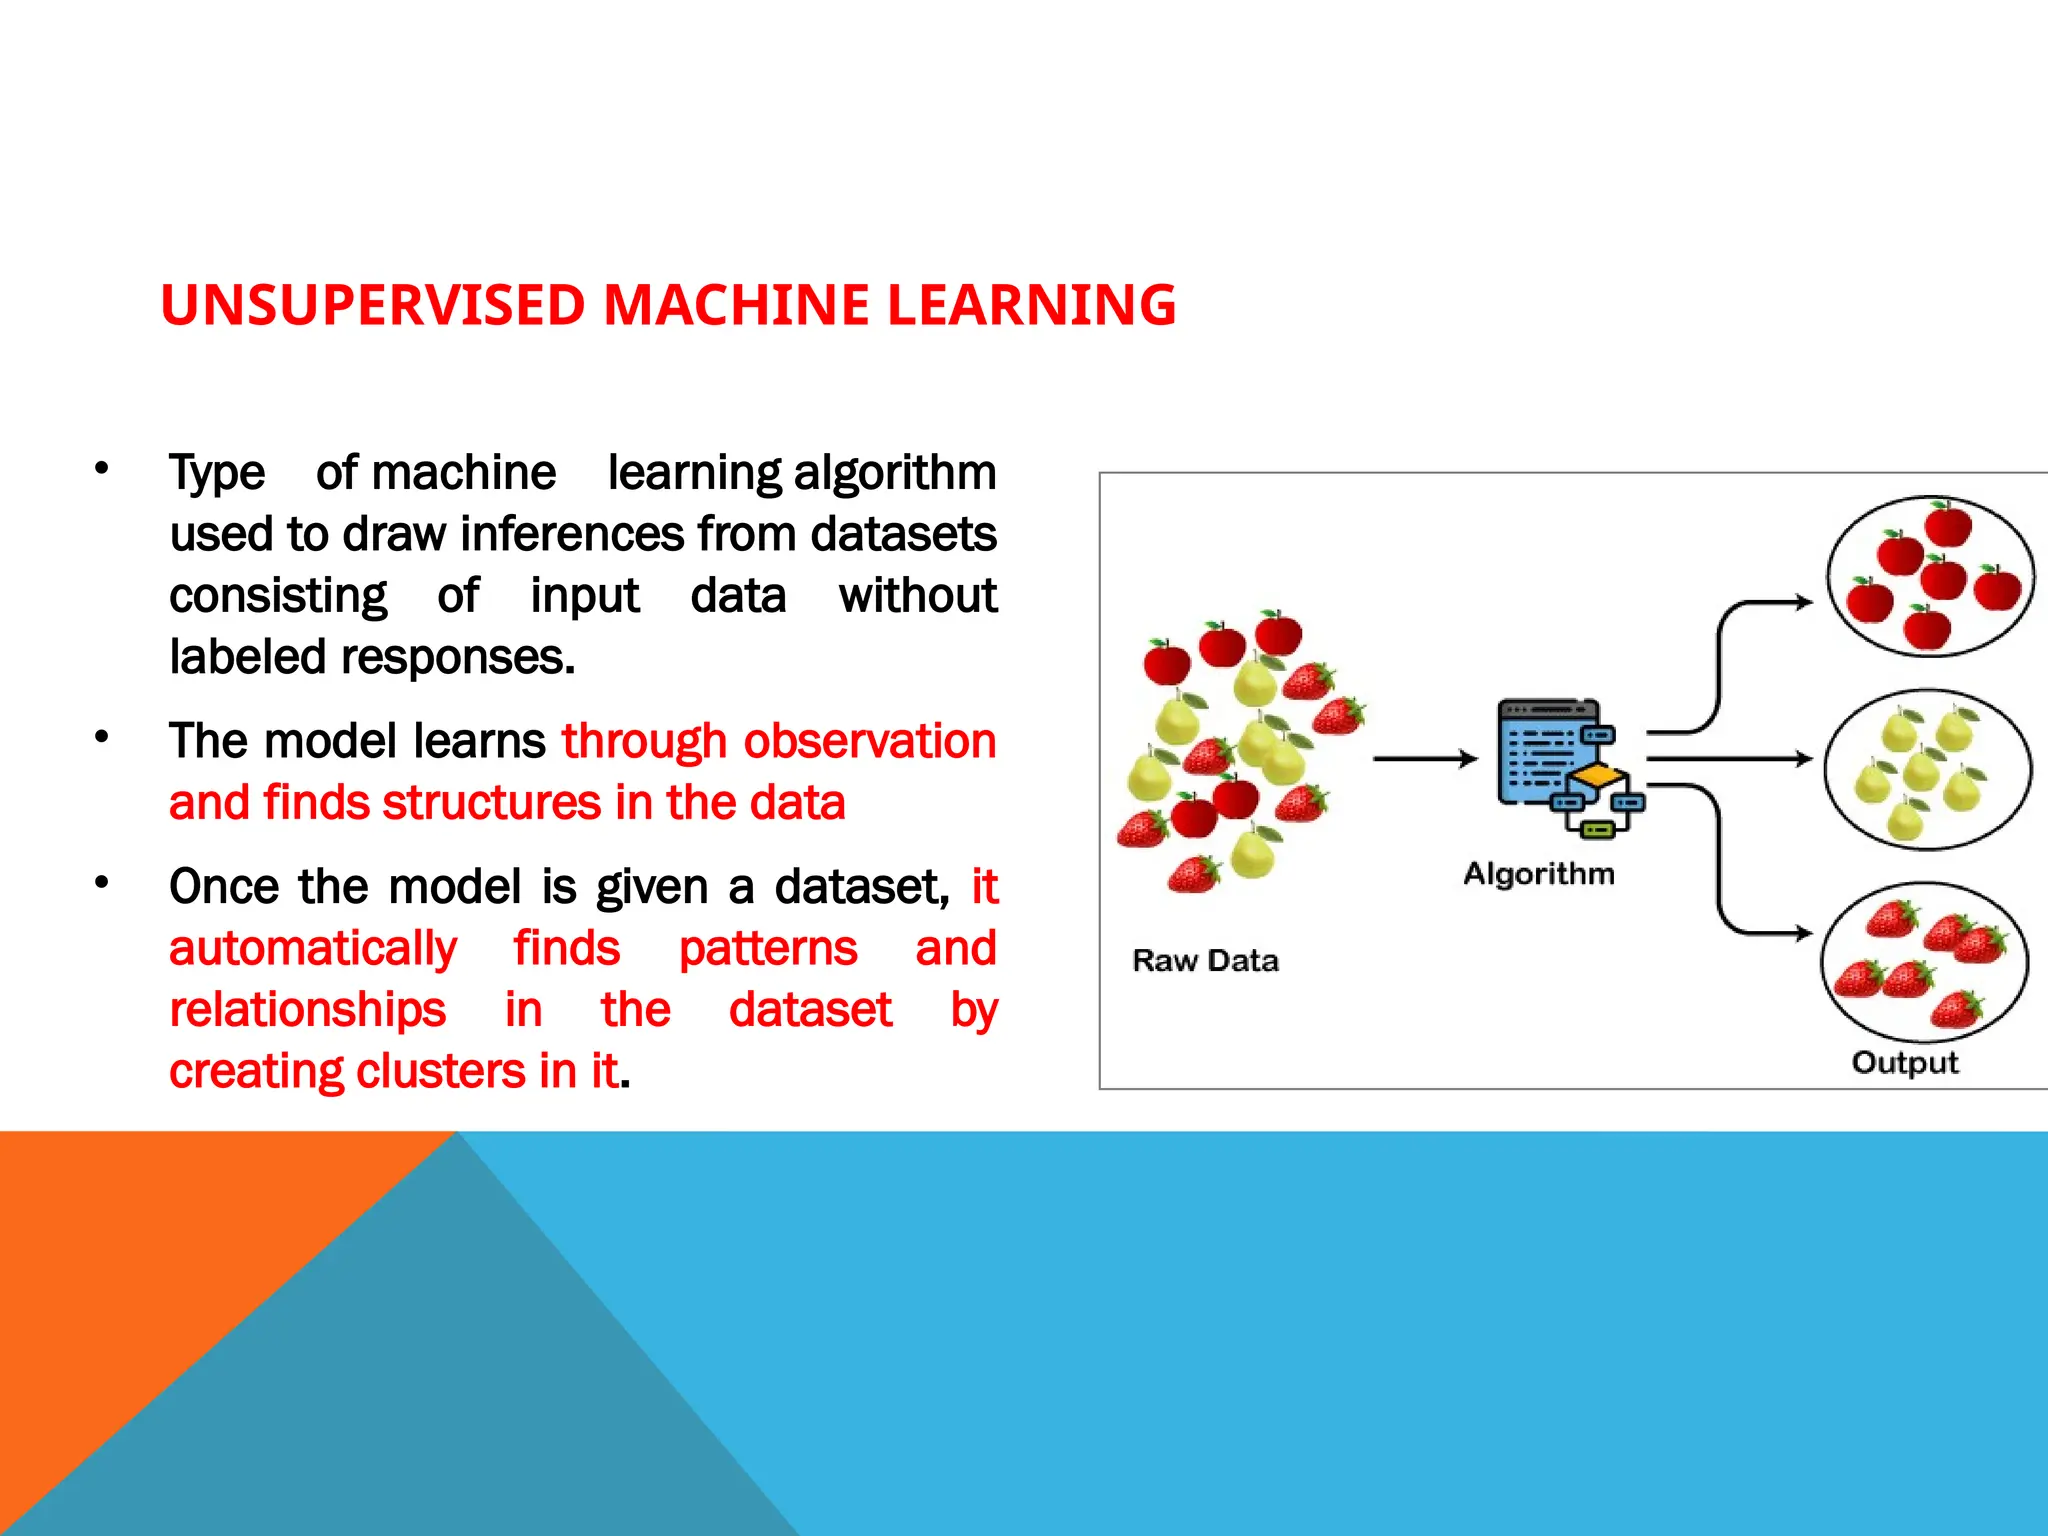
UNSUPERVISED MACHINE LEARNING
•Type of machine learning algorithm
used to draw inferences from datasets
consisting of input data without
labeled responses.
• The model learns through observation
and finds structures in the data
• Once the model is given a dataset, it
automatically finds patterns and
relationships in the dataset by
creating clusters in it.
4.
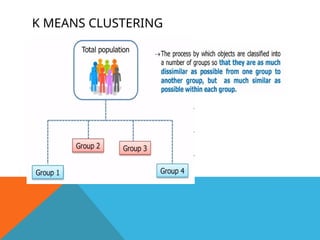
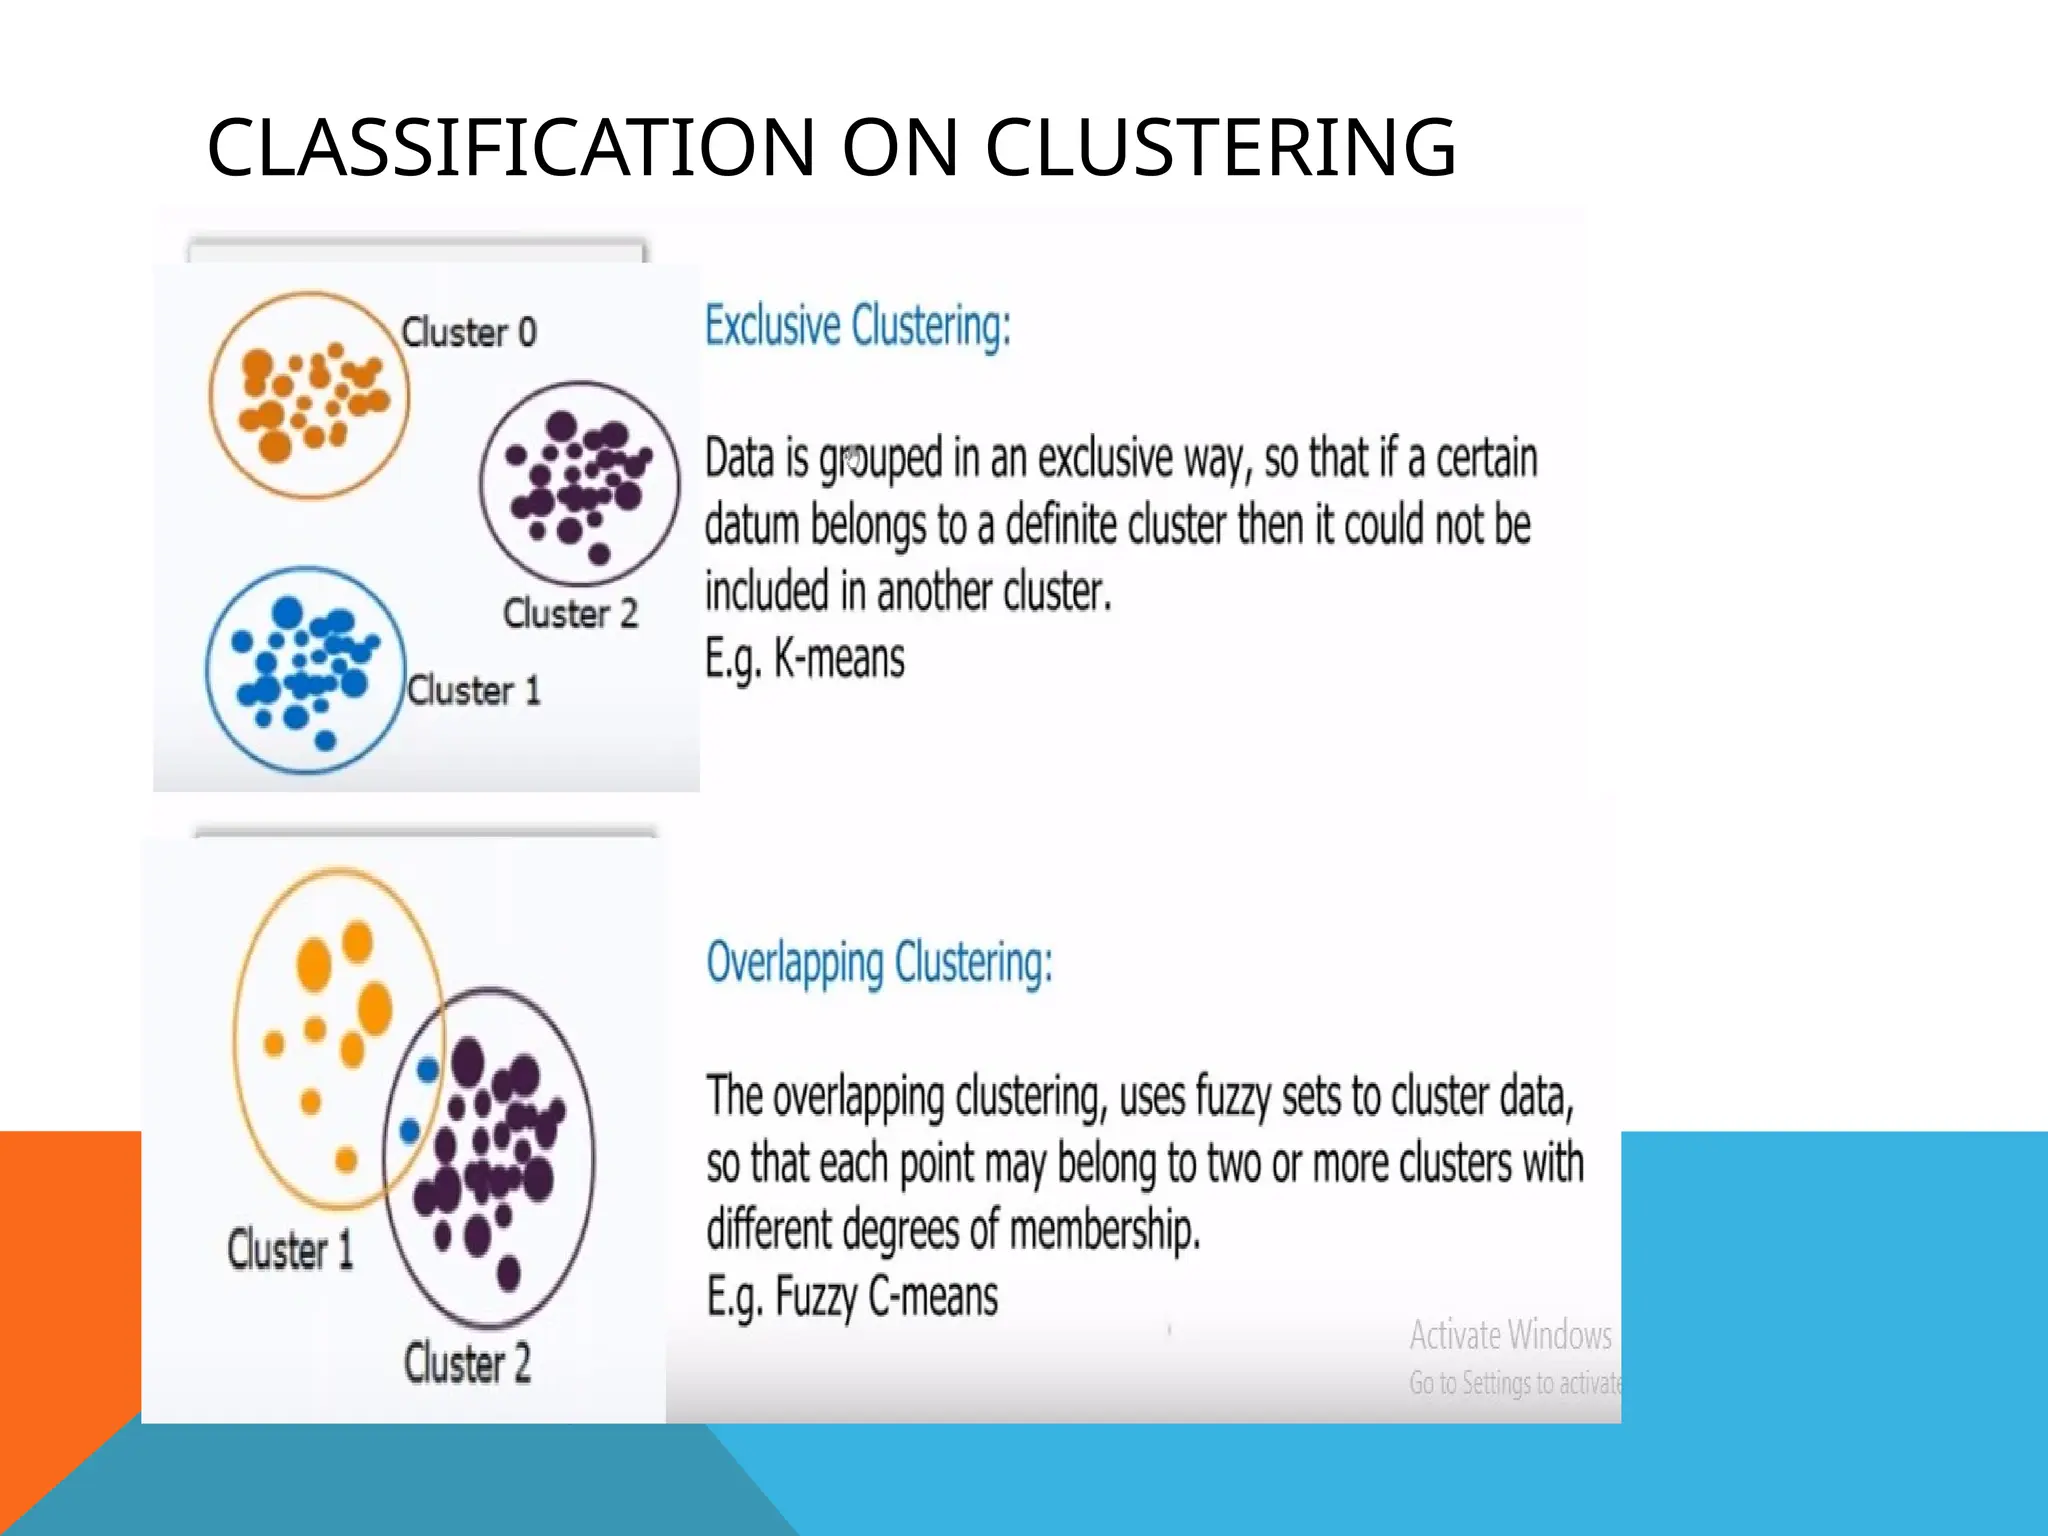
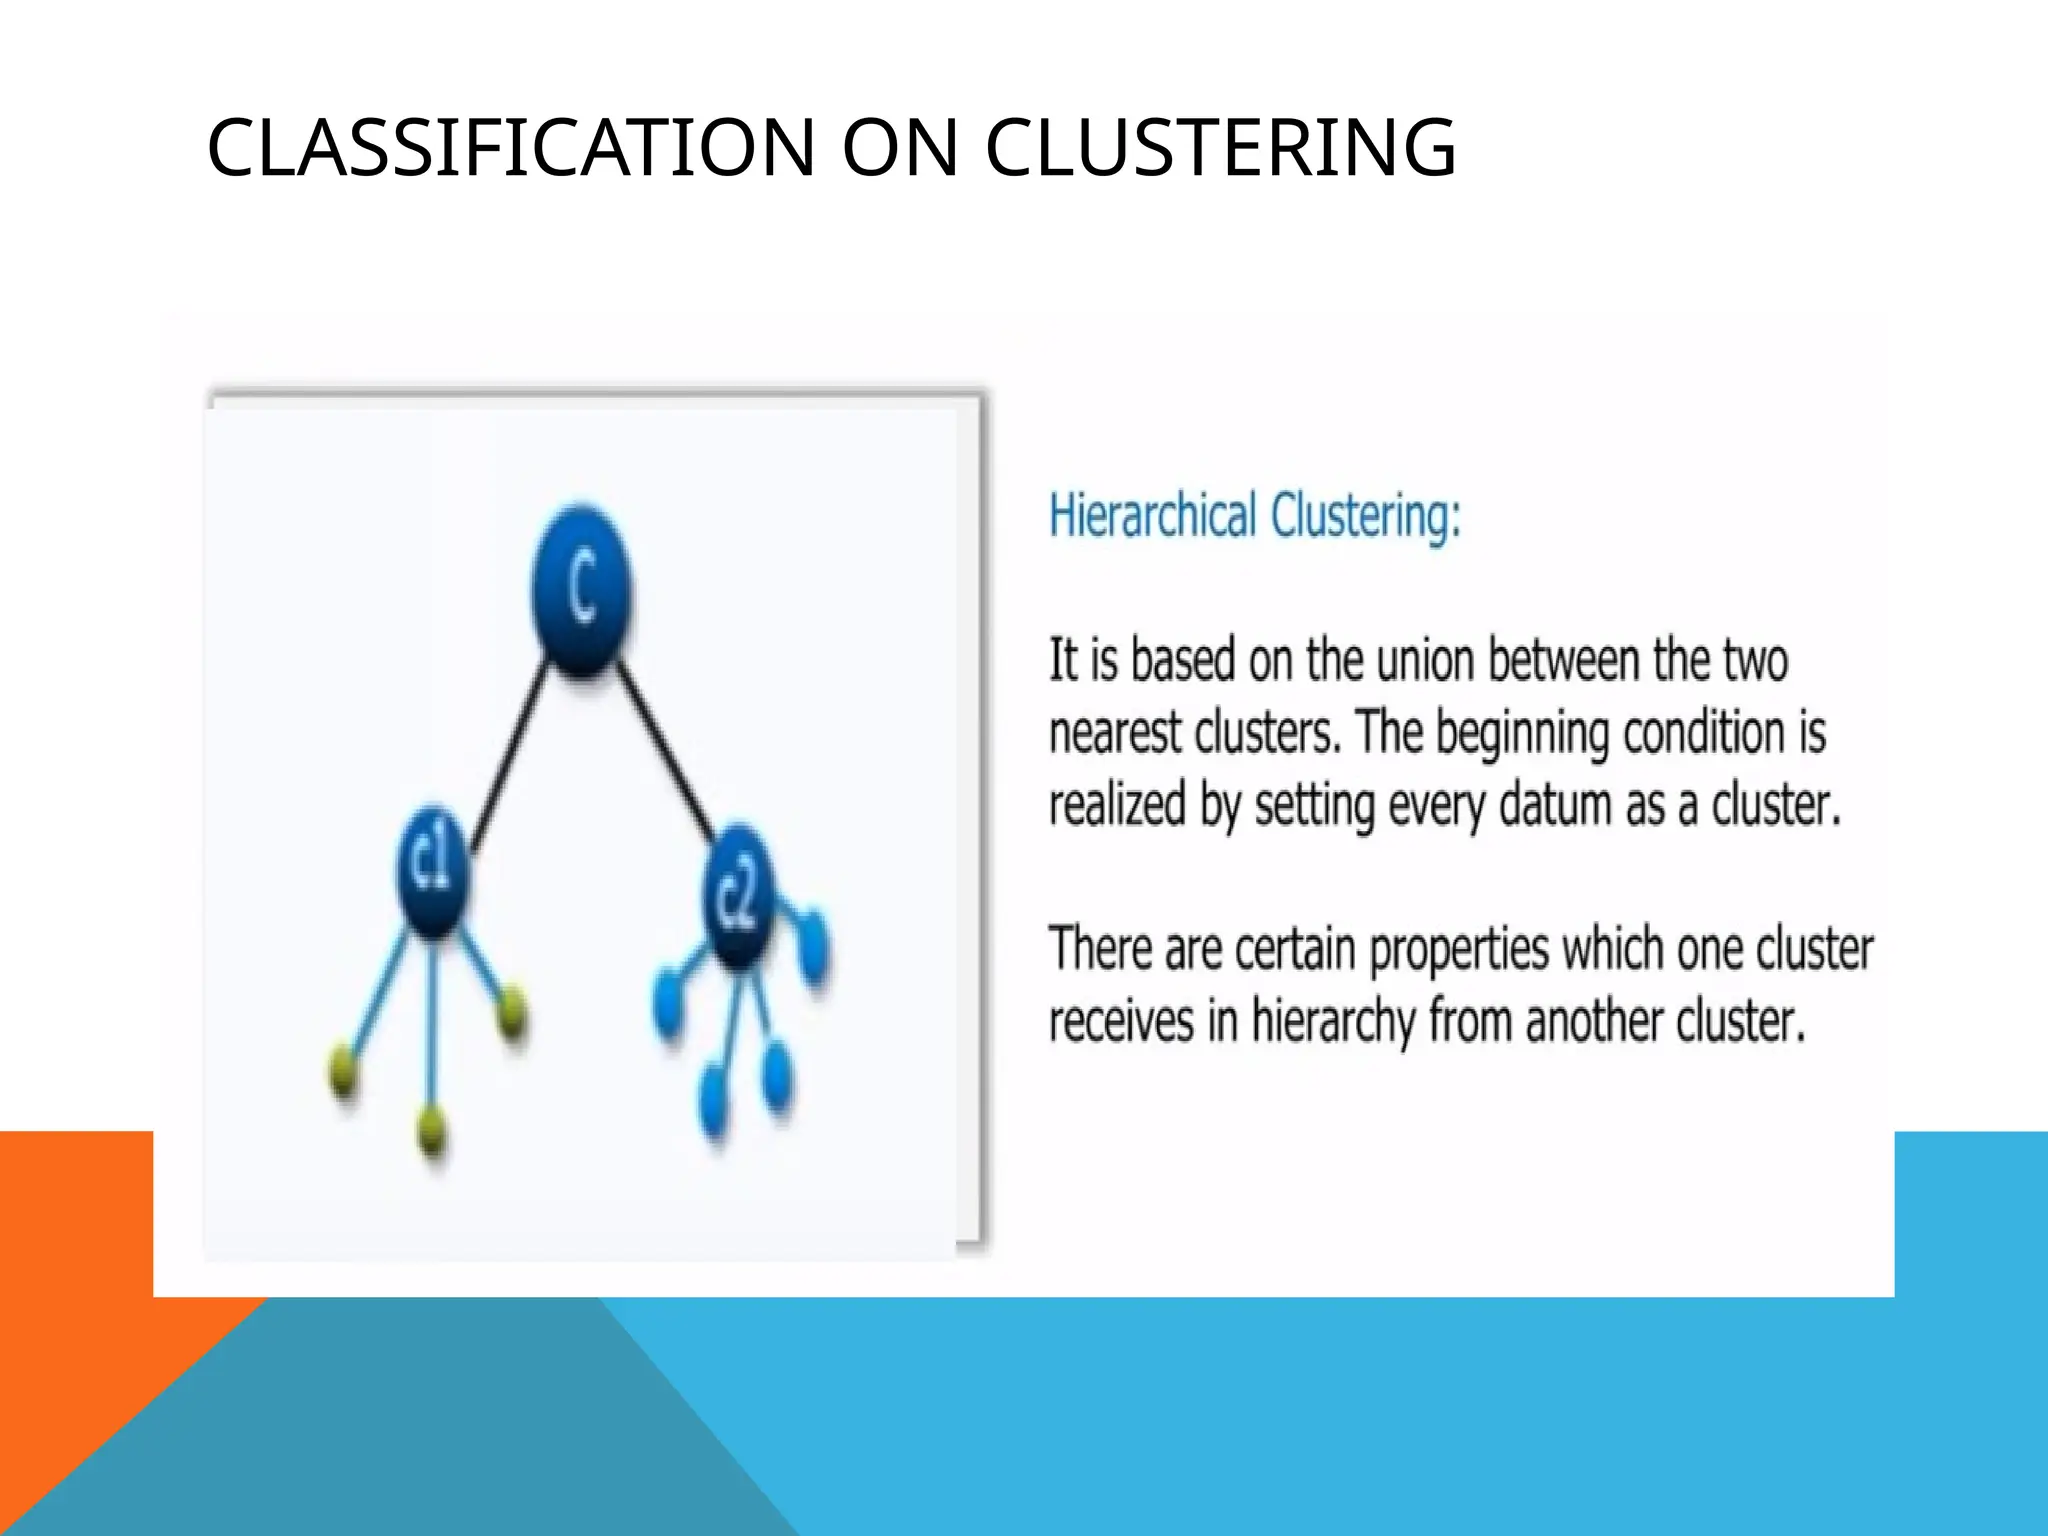
CLUSTERING
• Clustering meansgrouping the objects based
on the information found in the data describing
object.
• Objects in one group should be similar to each
other but different from objects in another
group.
• Finds a structure in a collection of unlabeled
data.
5.
Organizing data intoclusters such that there is
high intra class similarity.
Low inter class similarity.
Finding natural grouping among objects.
6.
APPLICATIONS
• Information retrieval:document clustering
• Land use: Identification of areas of similar land use in an
earth observation database
• Marketing: Help marketers discover distinct groups in their
customer bases, and then use this knowledge to develop
targeted marketing programs
• City-planning: Identifying groups of houses according
to their house type, value, and geographical location
• Climate: understanding earth climate, find patterns of
atmospheric and ocean
• Economic Science: market research
7.
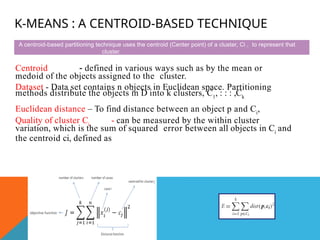
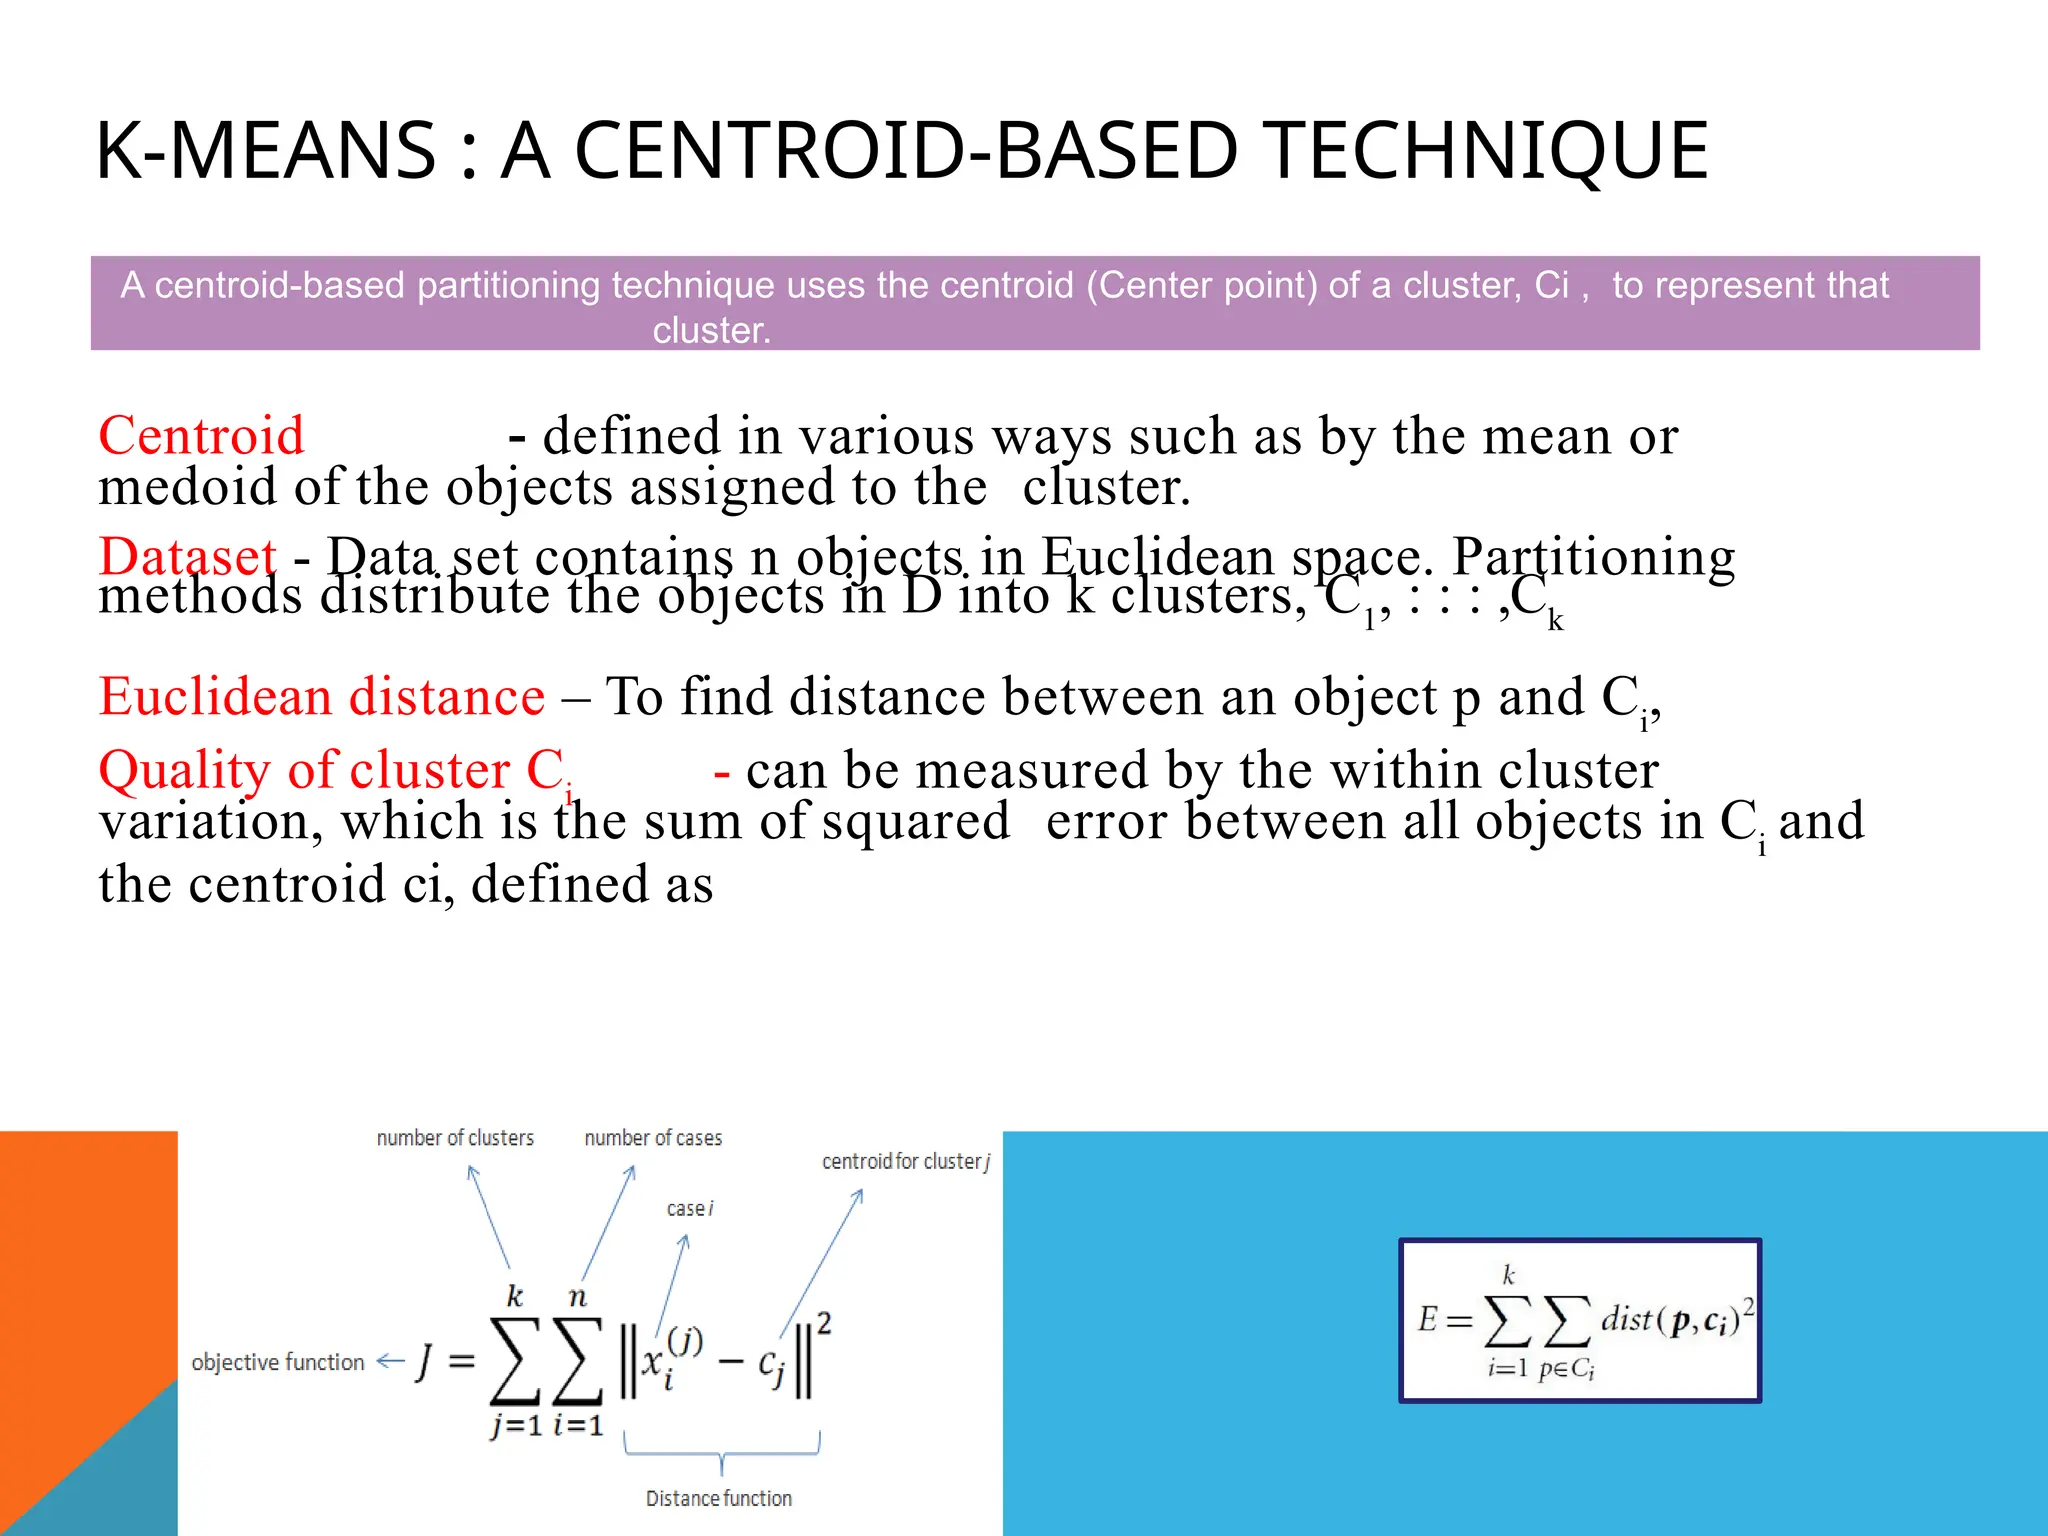
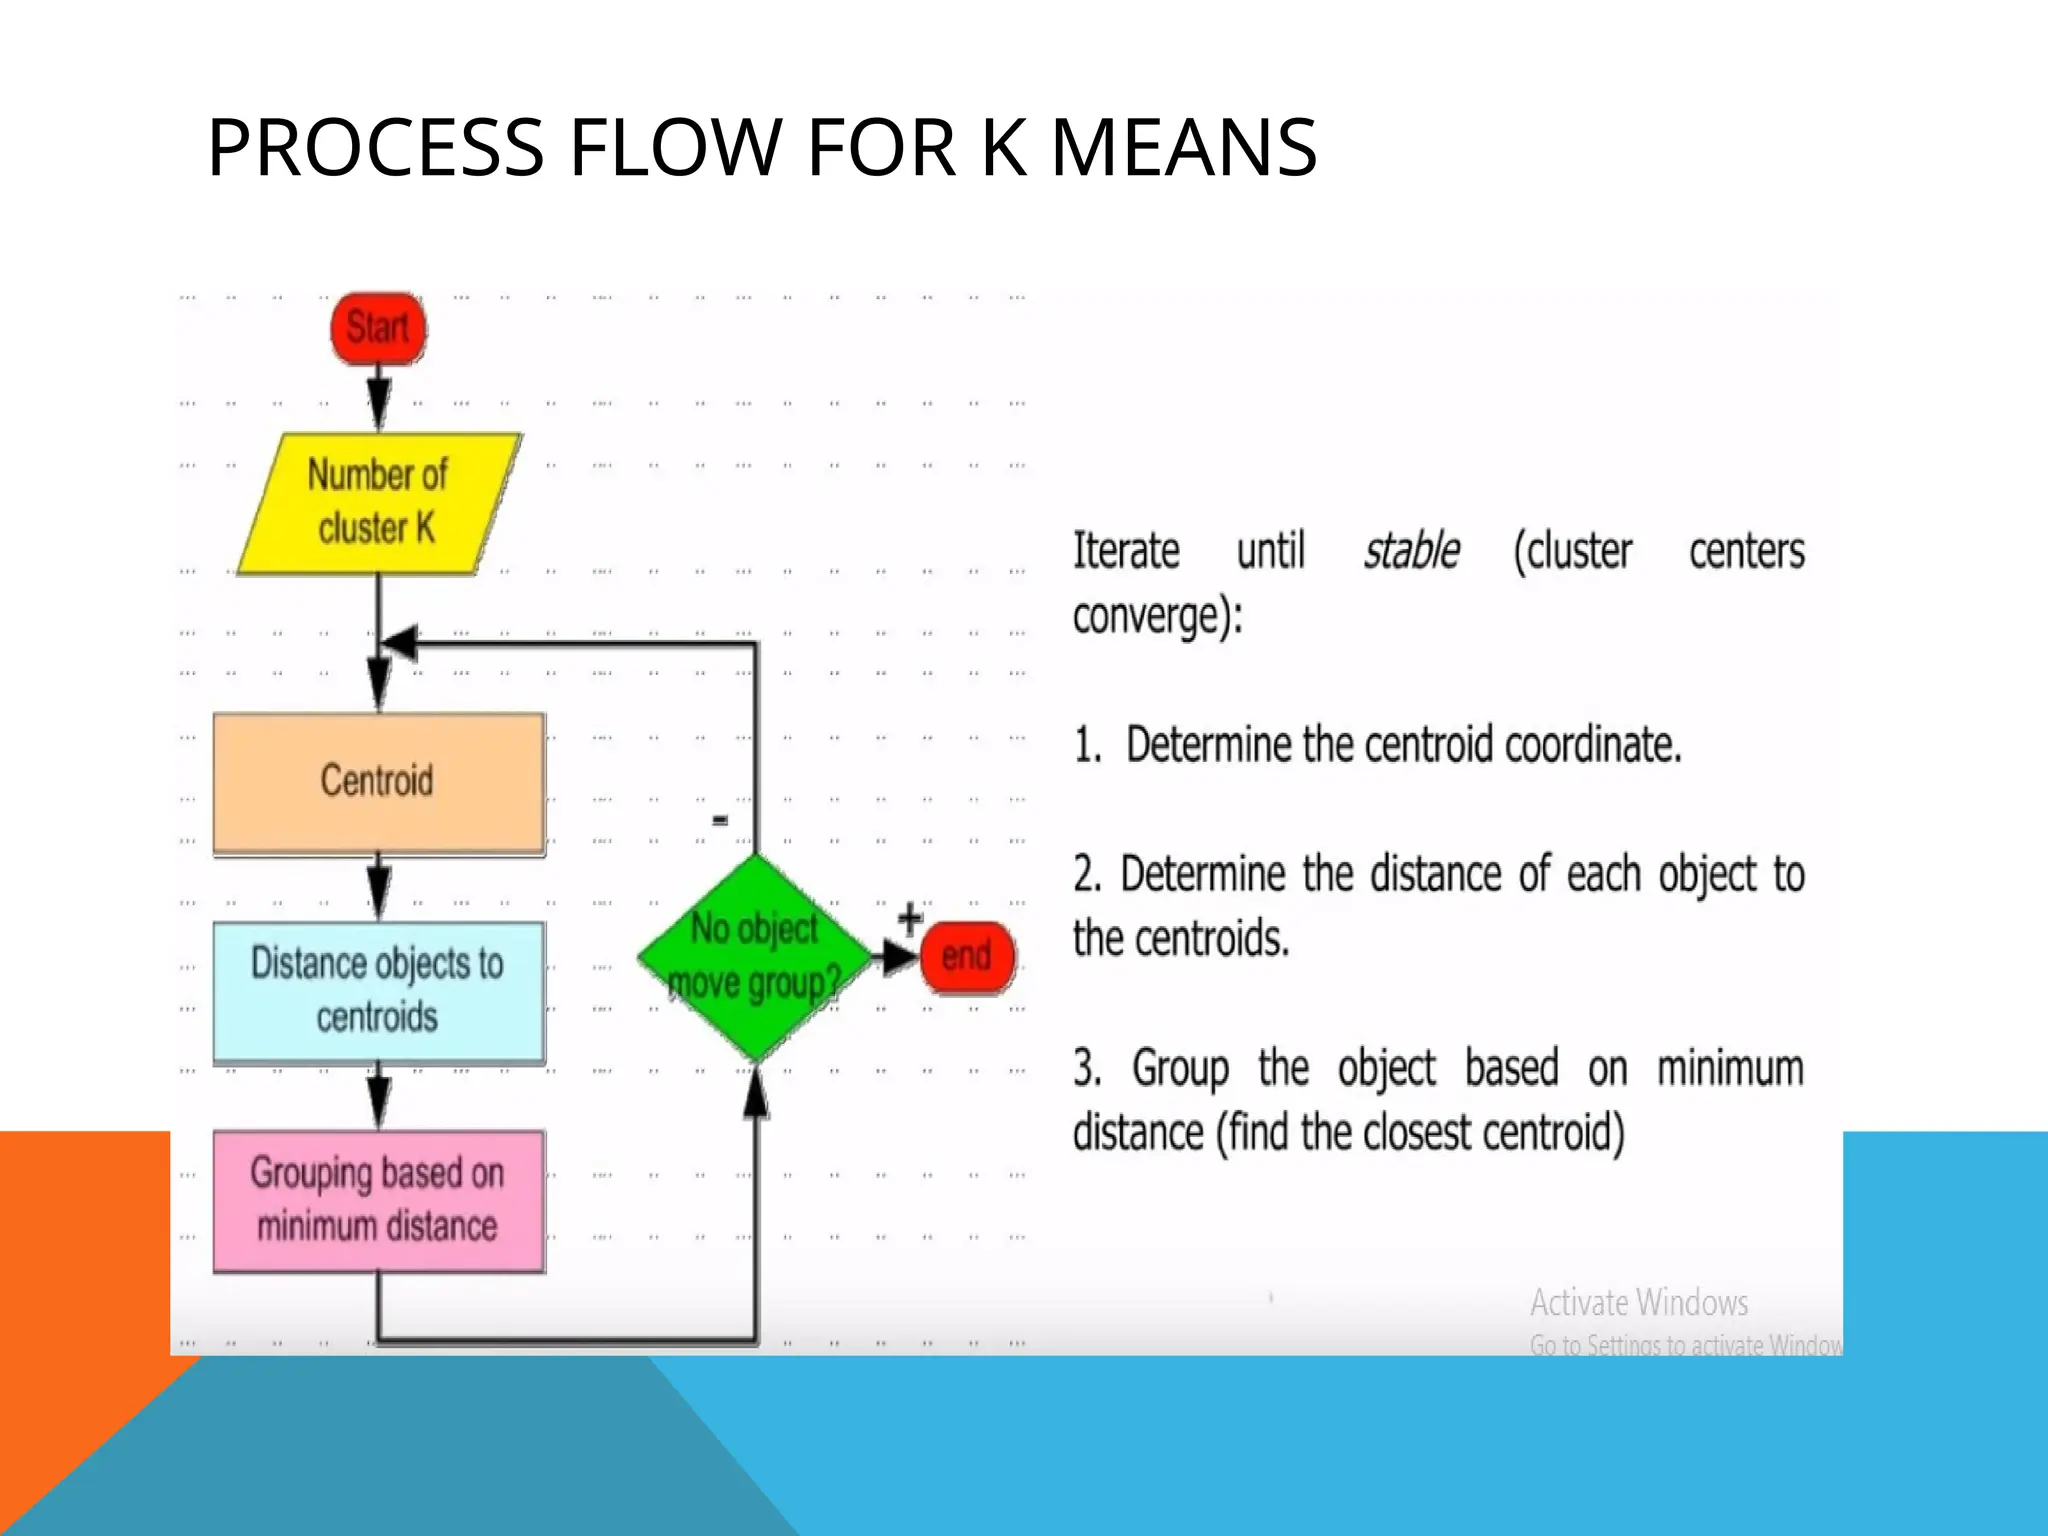
K-MEANS : ACENTROID-BASED TECHNIQUE
Centroid - defined in various ways such as by the mean or
medoid of the objects assigned to the cluster.
Dataset - Data set contains n objects in Euclidean space. Partitioning
methods distribute the objects in D into k clusters, C1
, : : : ,Ck
Euclidean distance – To find distance between an object p and Ci
,
Quality of cluster Ci
- can be measured by the within cluster
variation, which is the sum of squared error between all objects in Ci
and
the centroid ci, defined as
A centroid-based partitioning technique uses the centroid (Center point) of a cluster, Ci , to represent that
cluster.
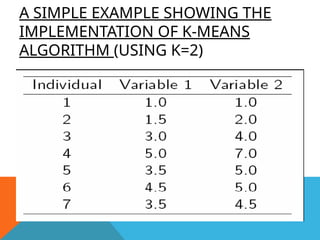
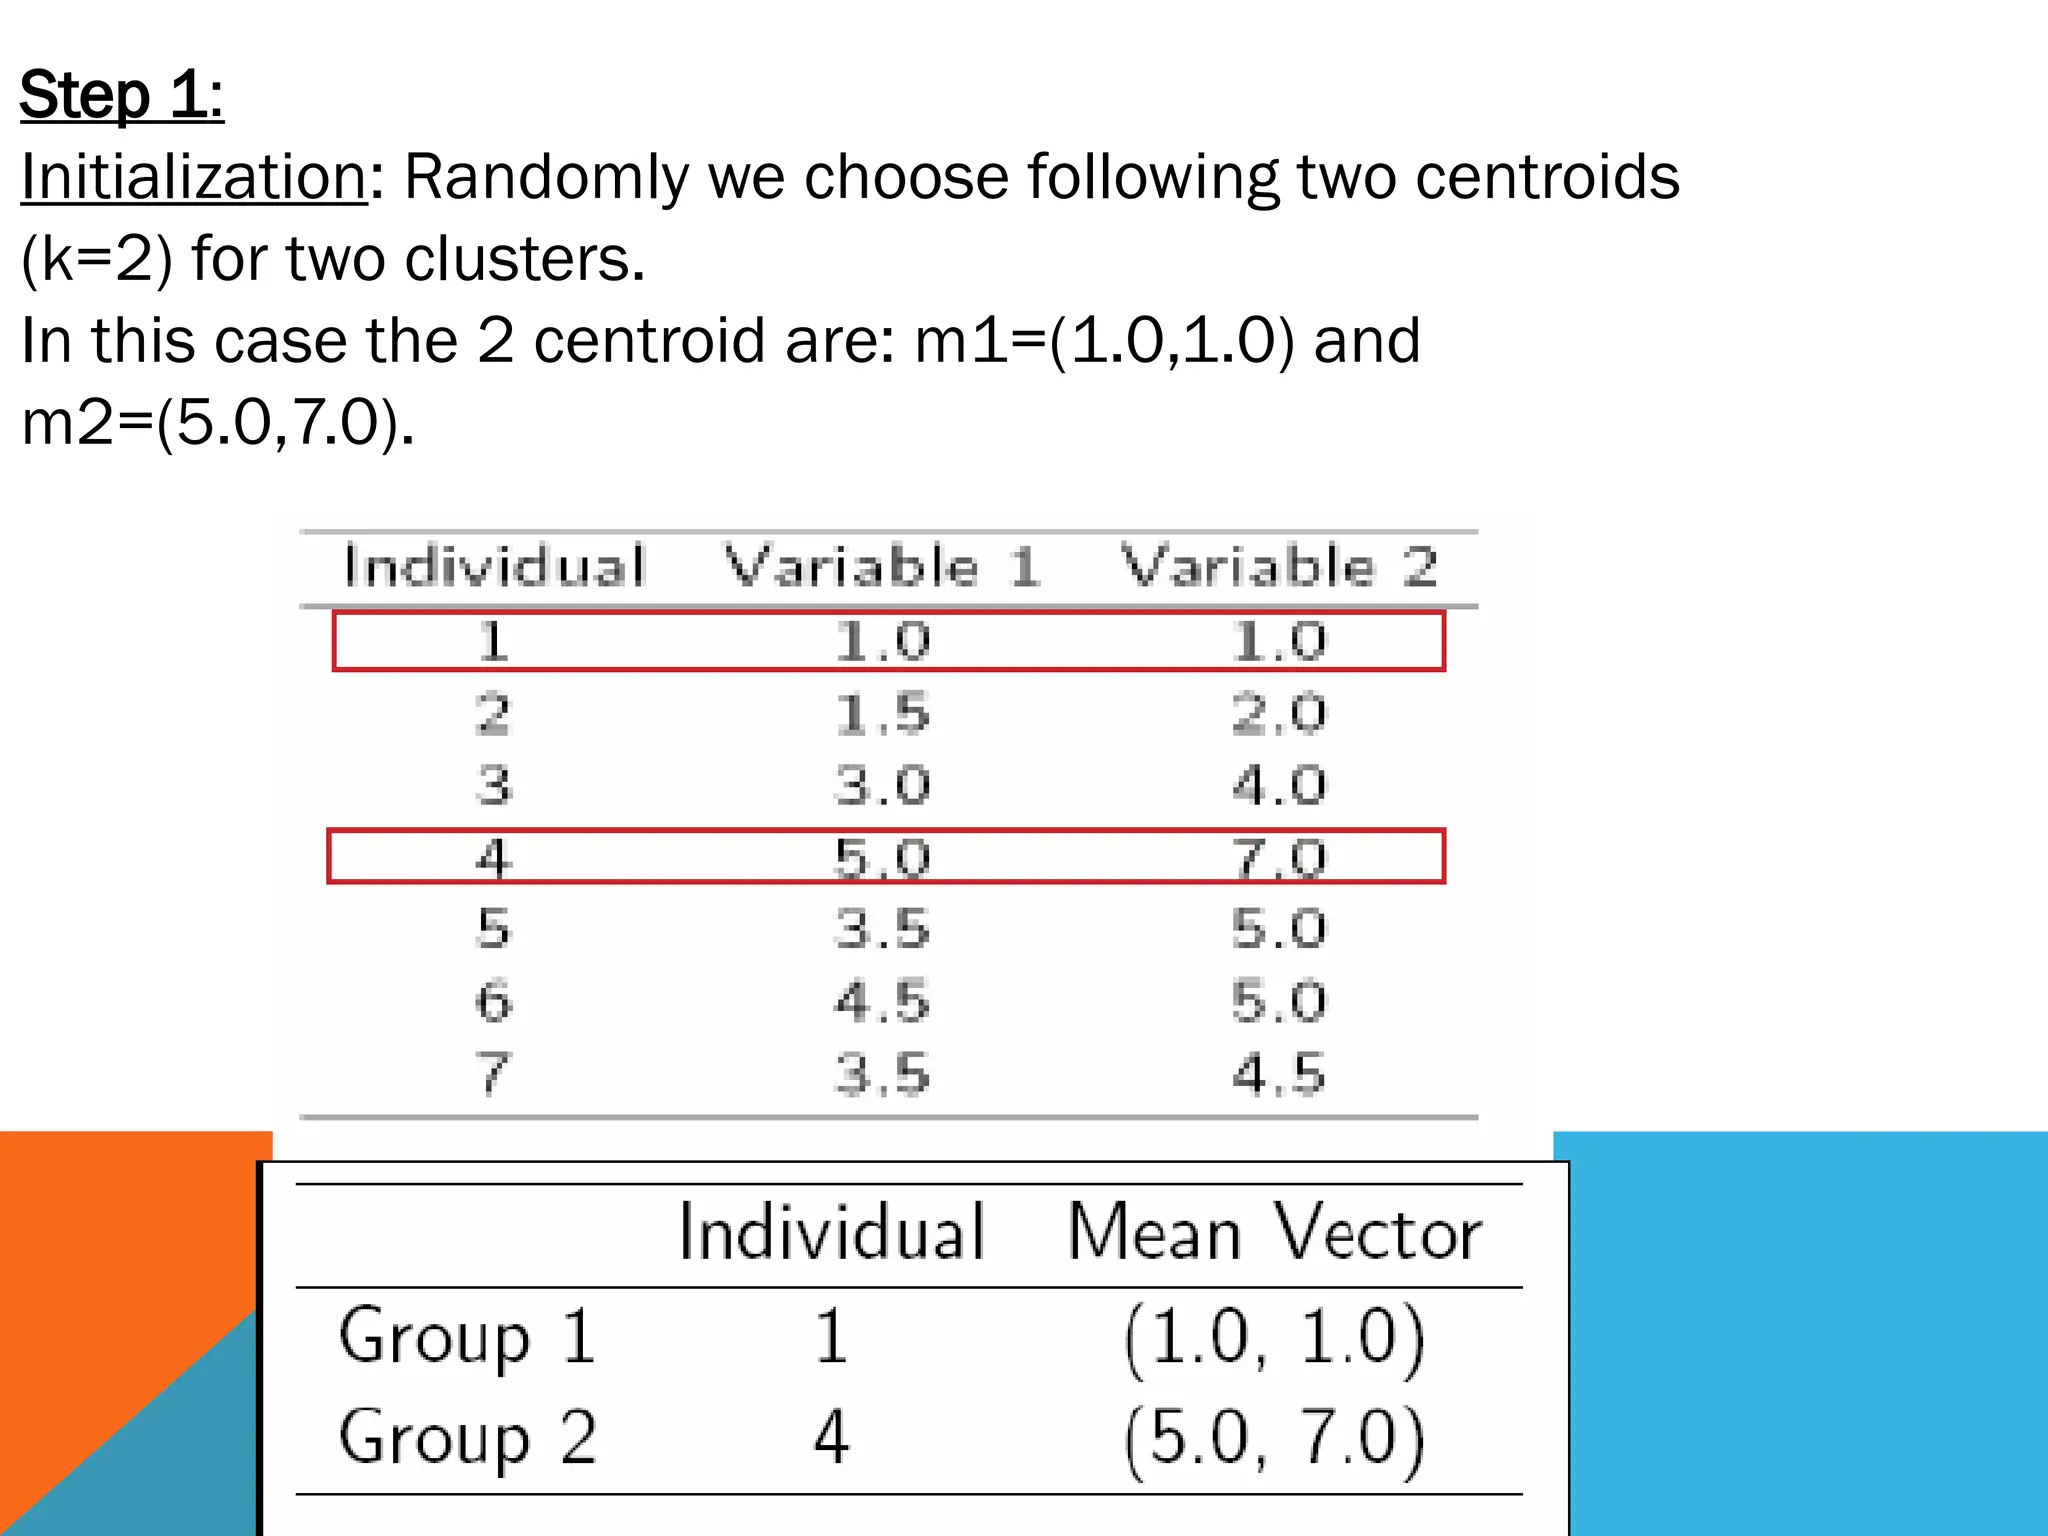
A SIMPLE EXAMPLESHOWING THE
IMPLEMENTATION OF K-MEANS
ALGORITHM (USING K=2)
15.
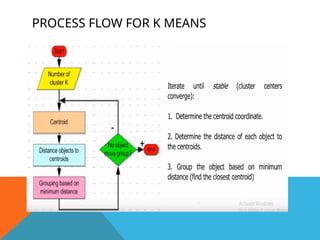
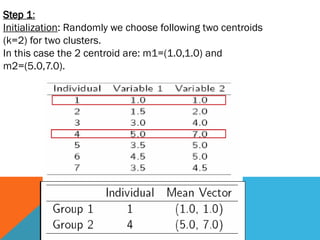
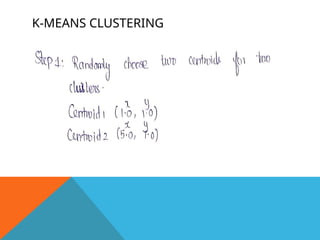
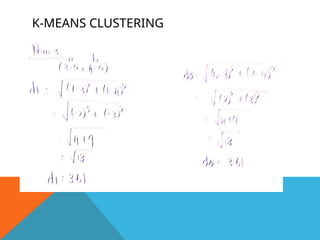
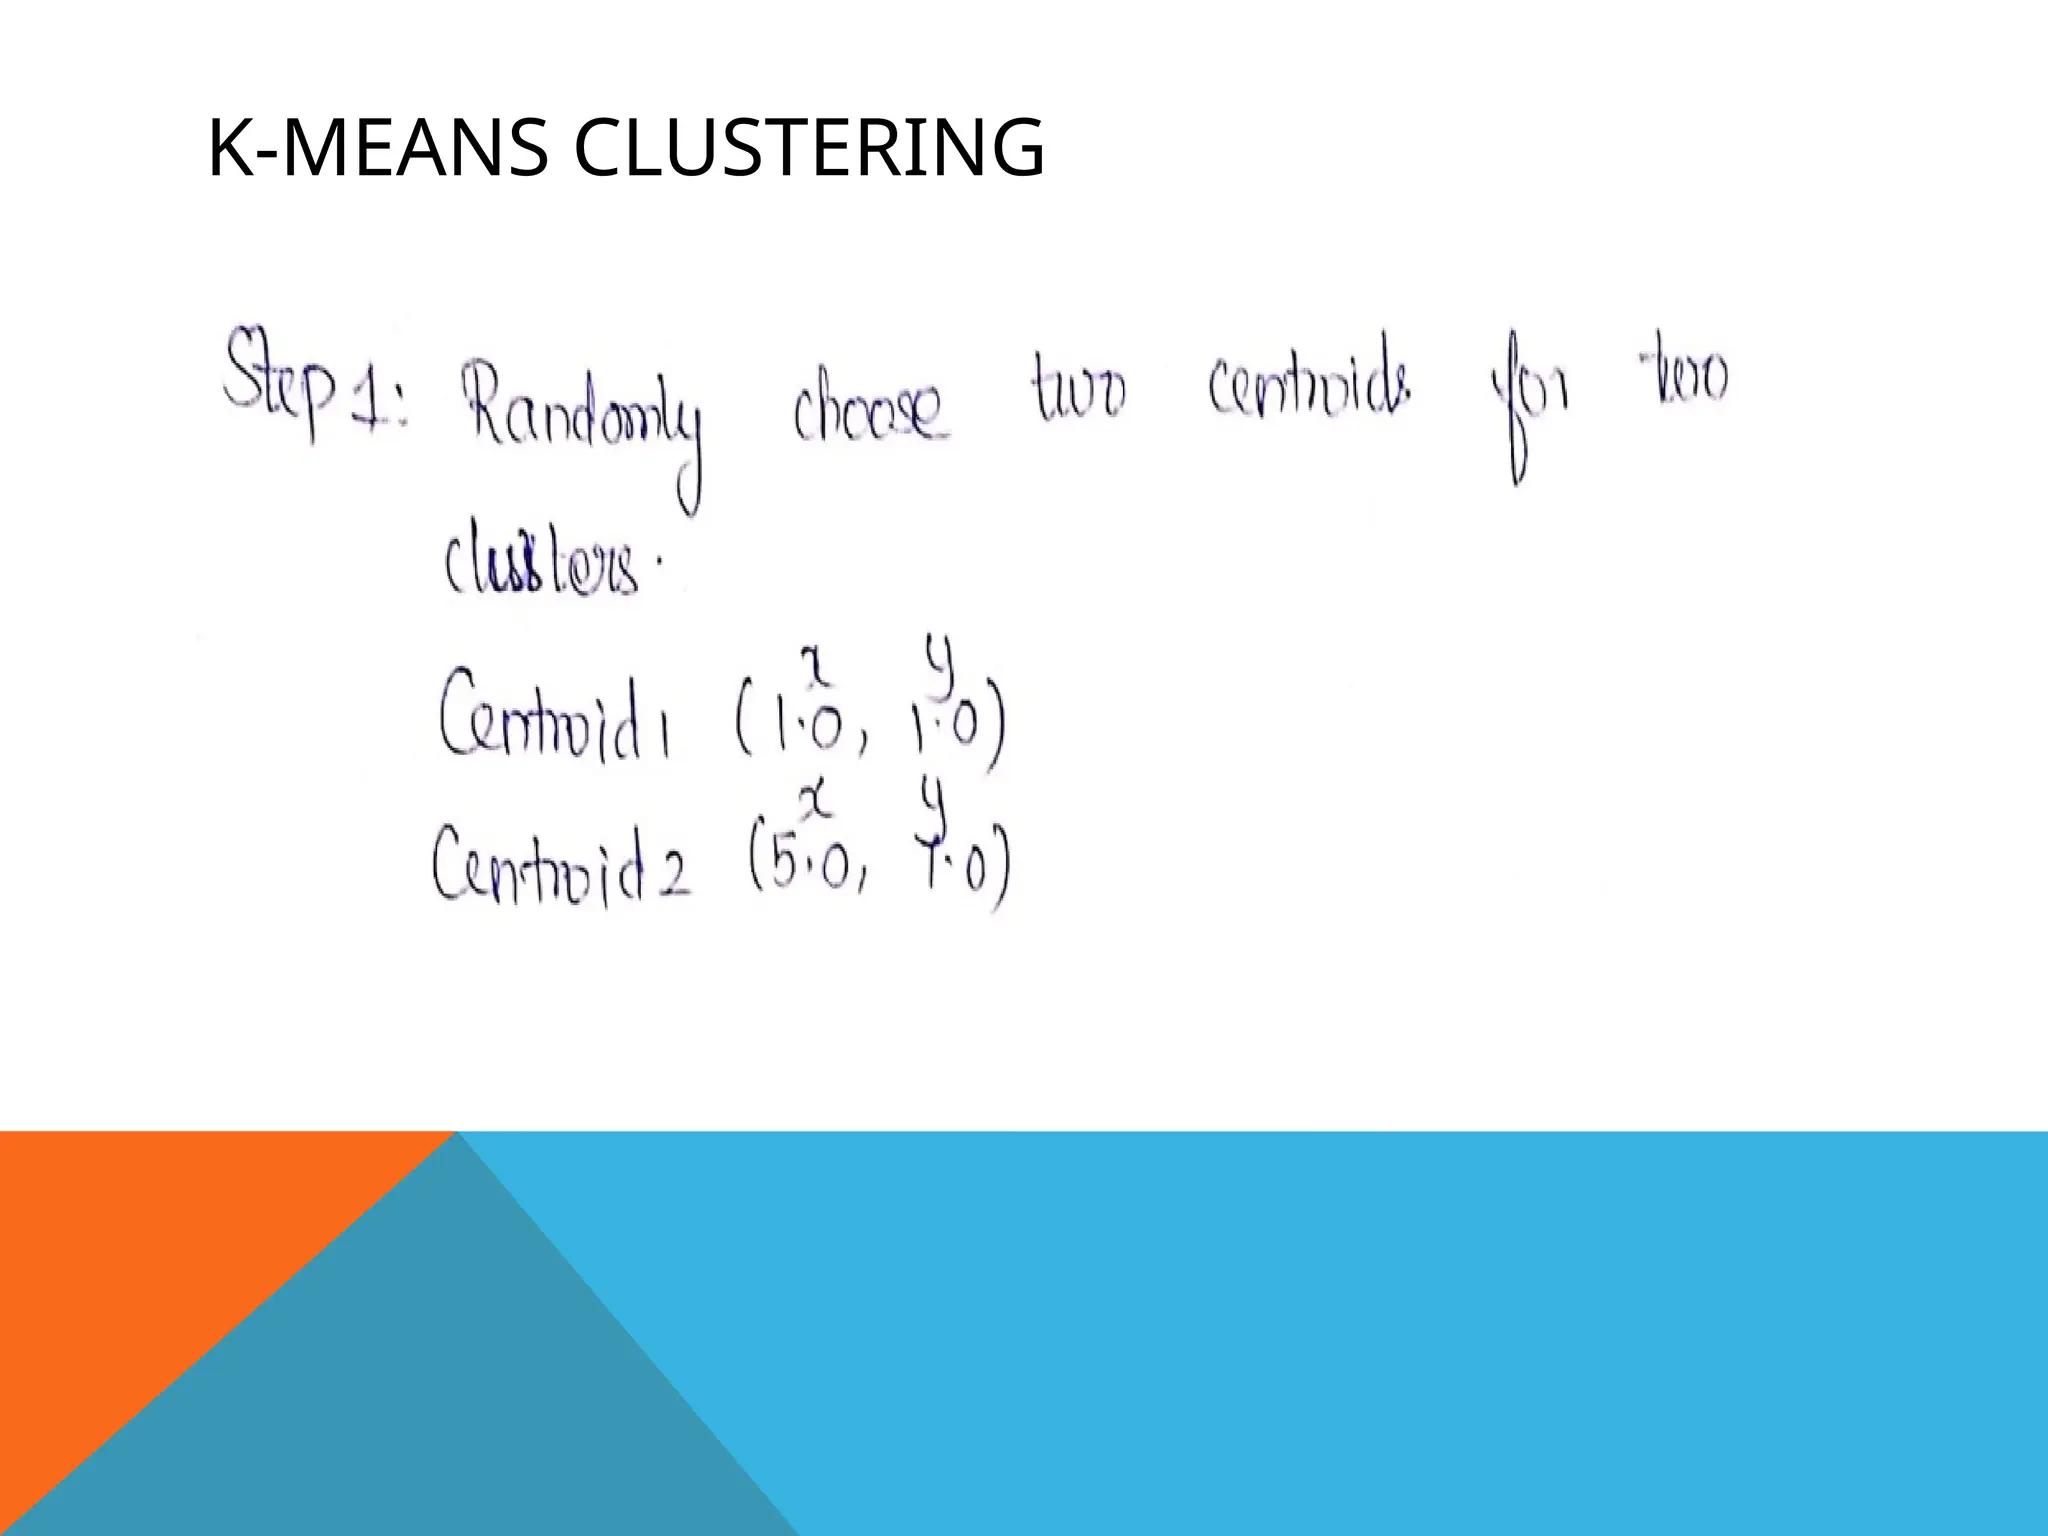
Step 1:
Initialization: Randomlywe choose following two centroids
(k=2) for two clusters.
In this case the 2 centroid are: m1=(1.0,1.0) and
m2=(5.0,7.0).
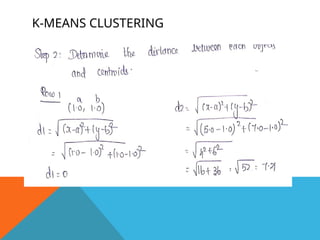
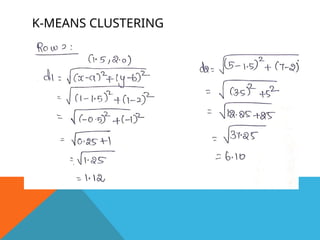
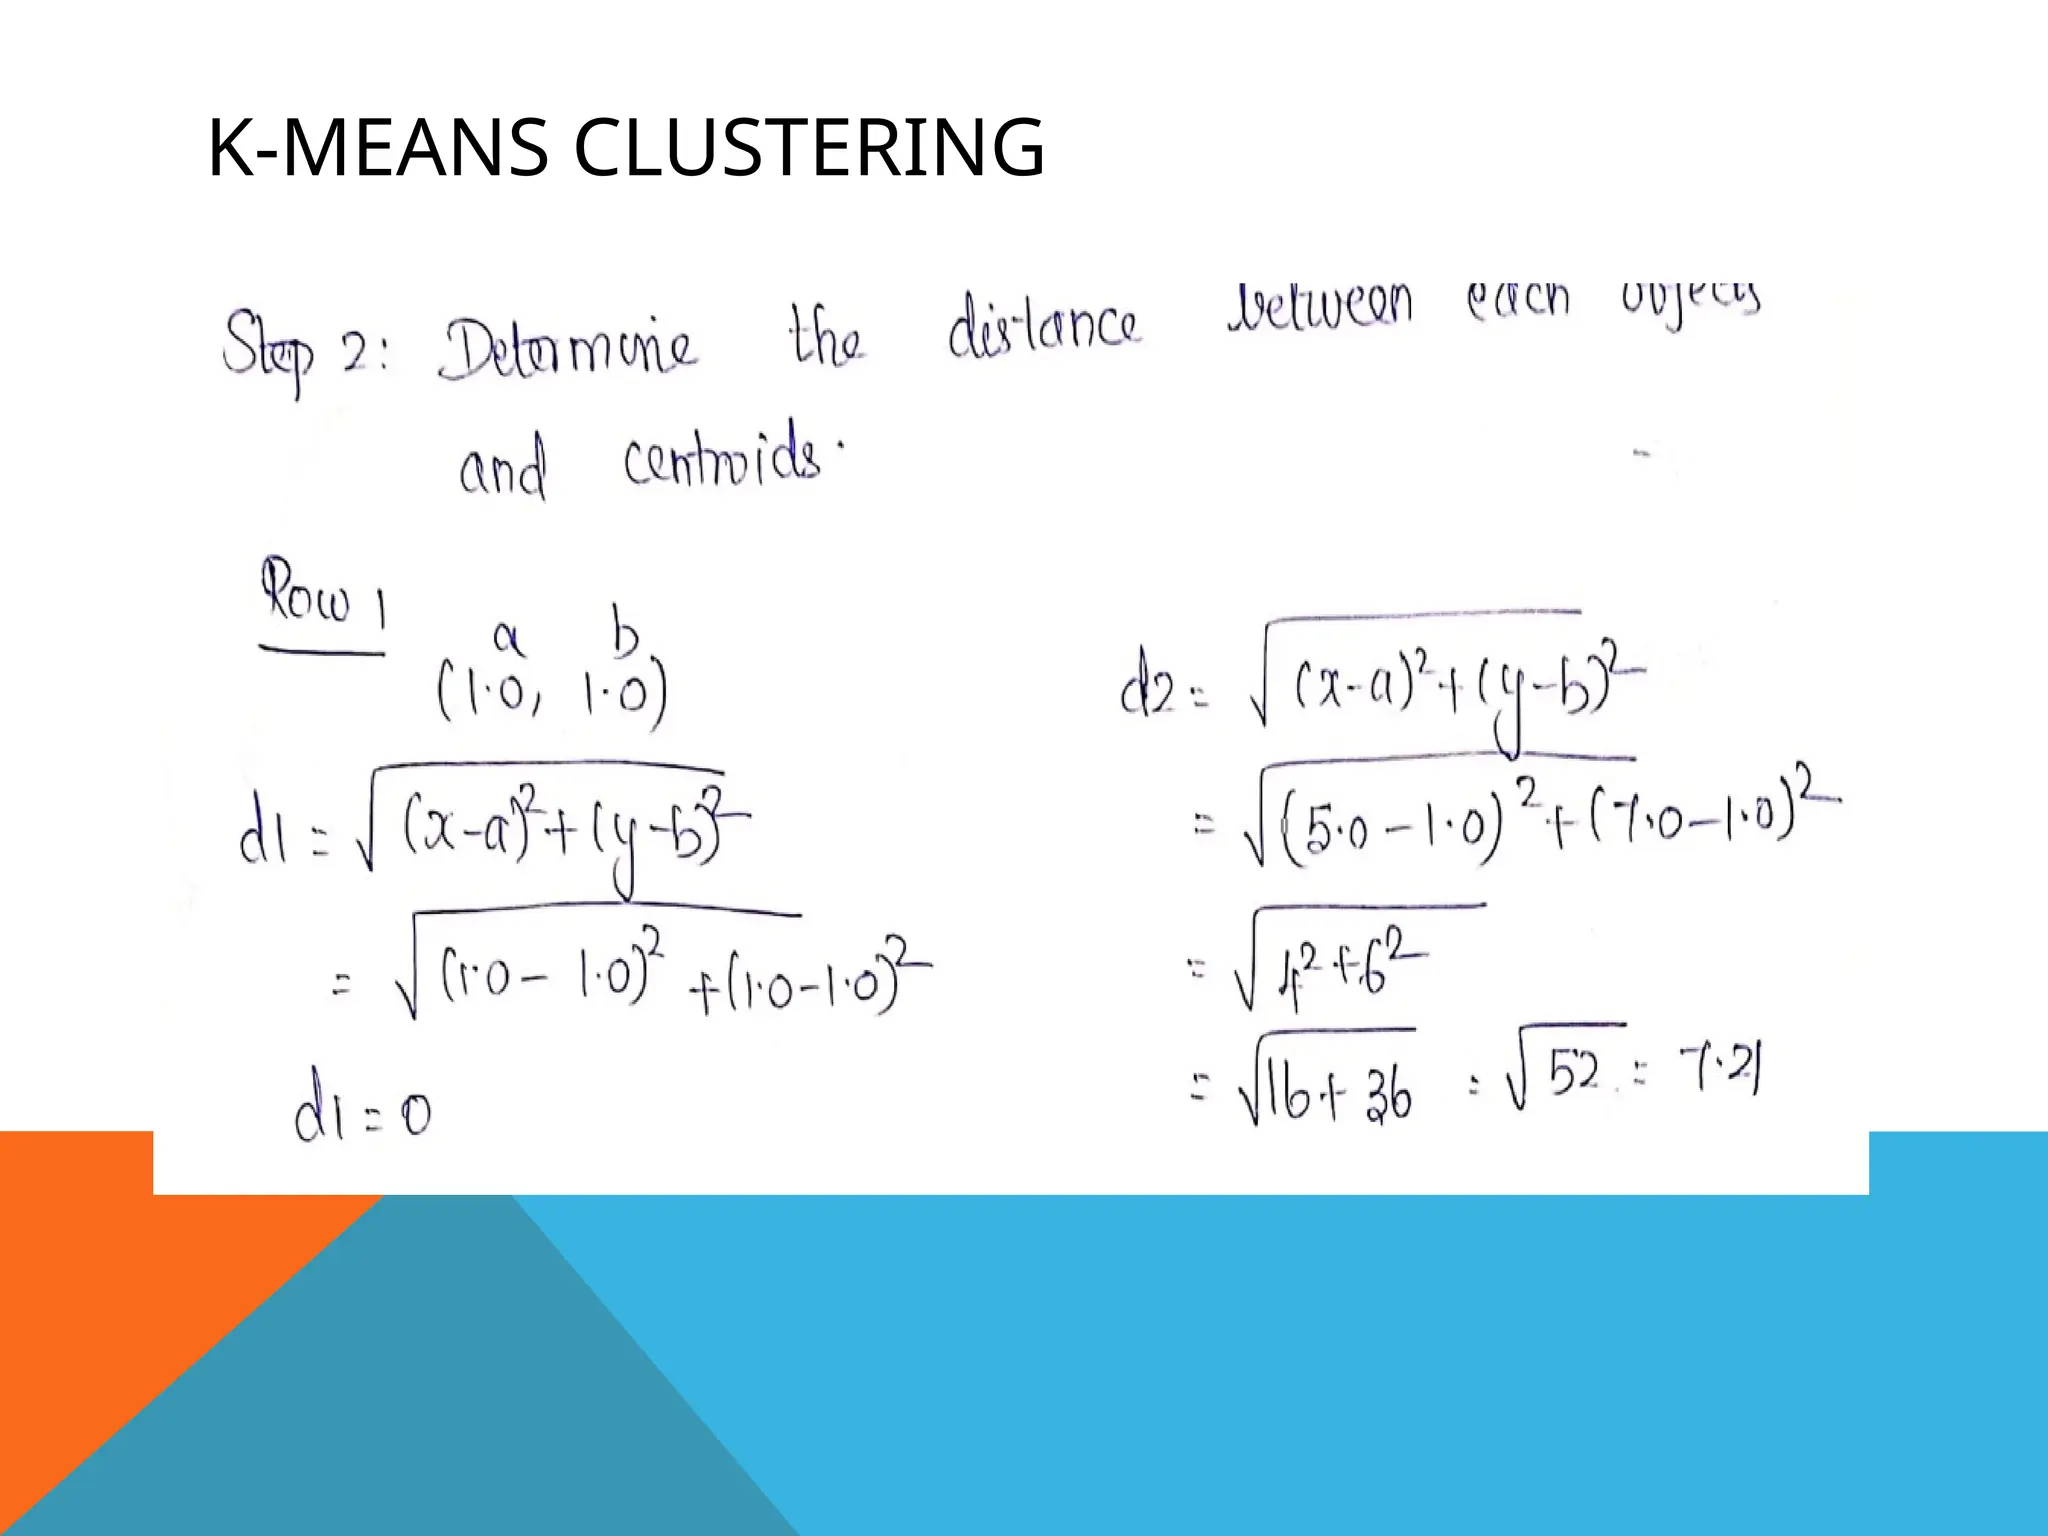
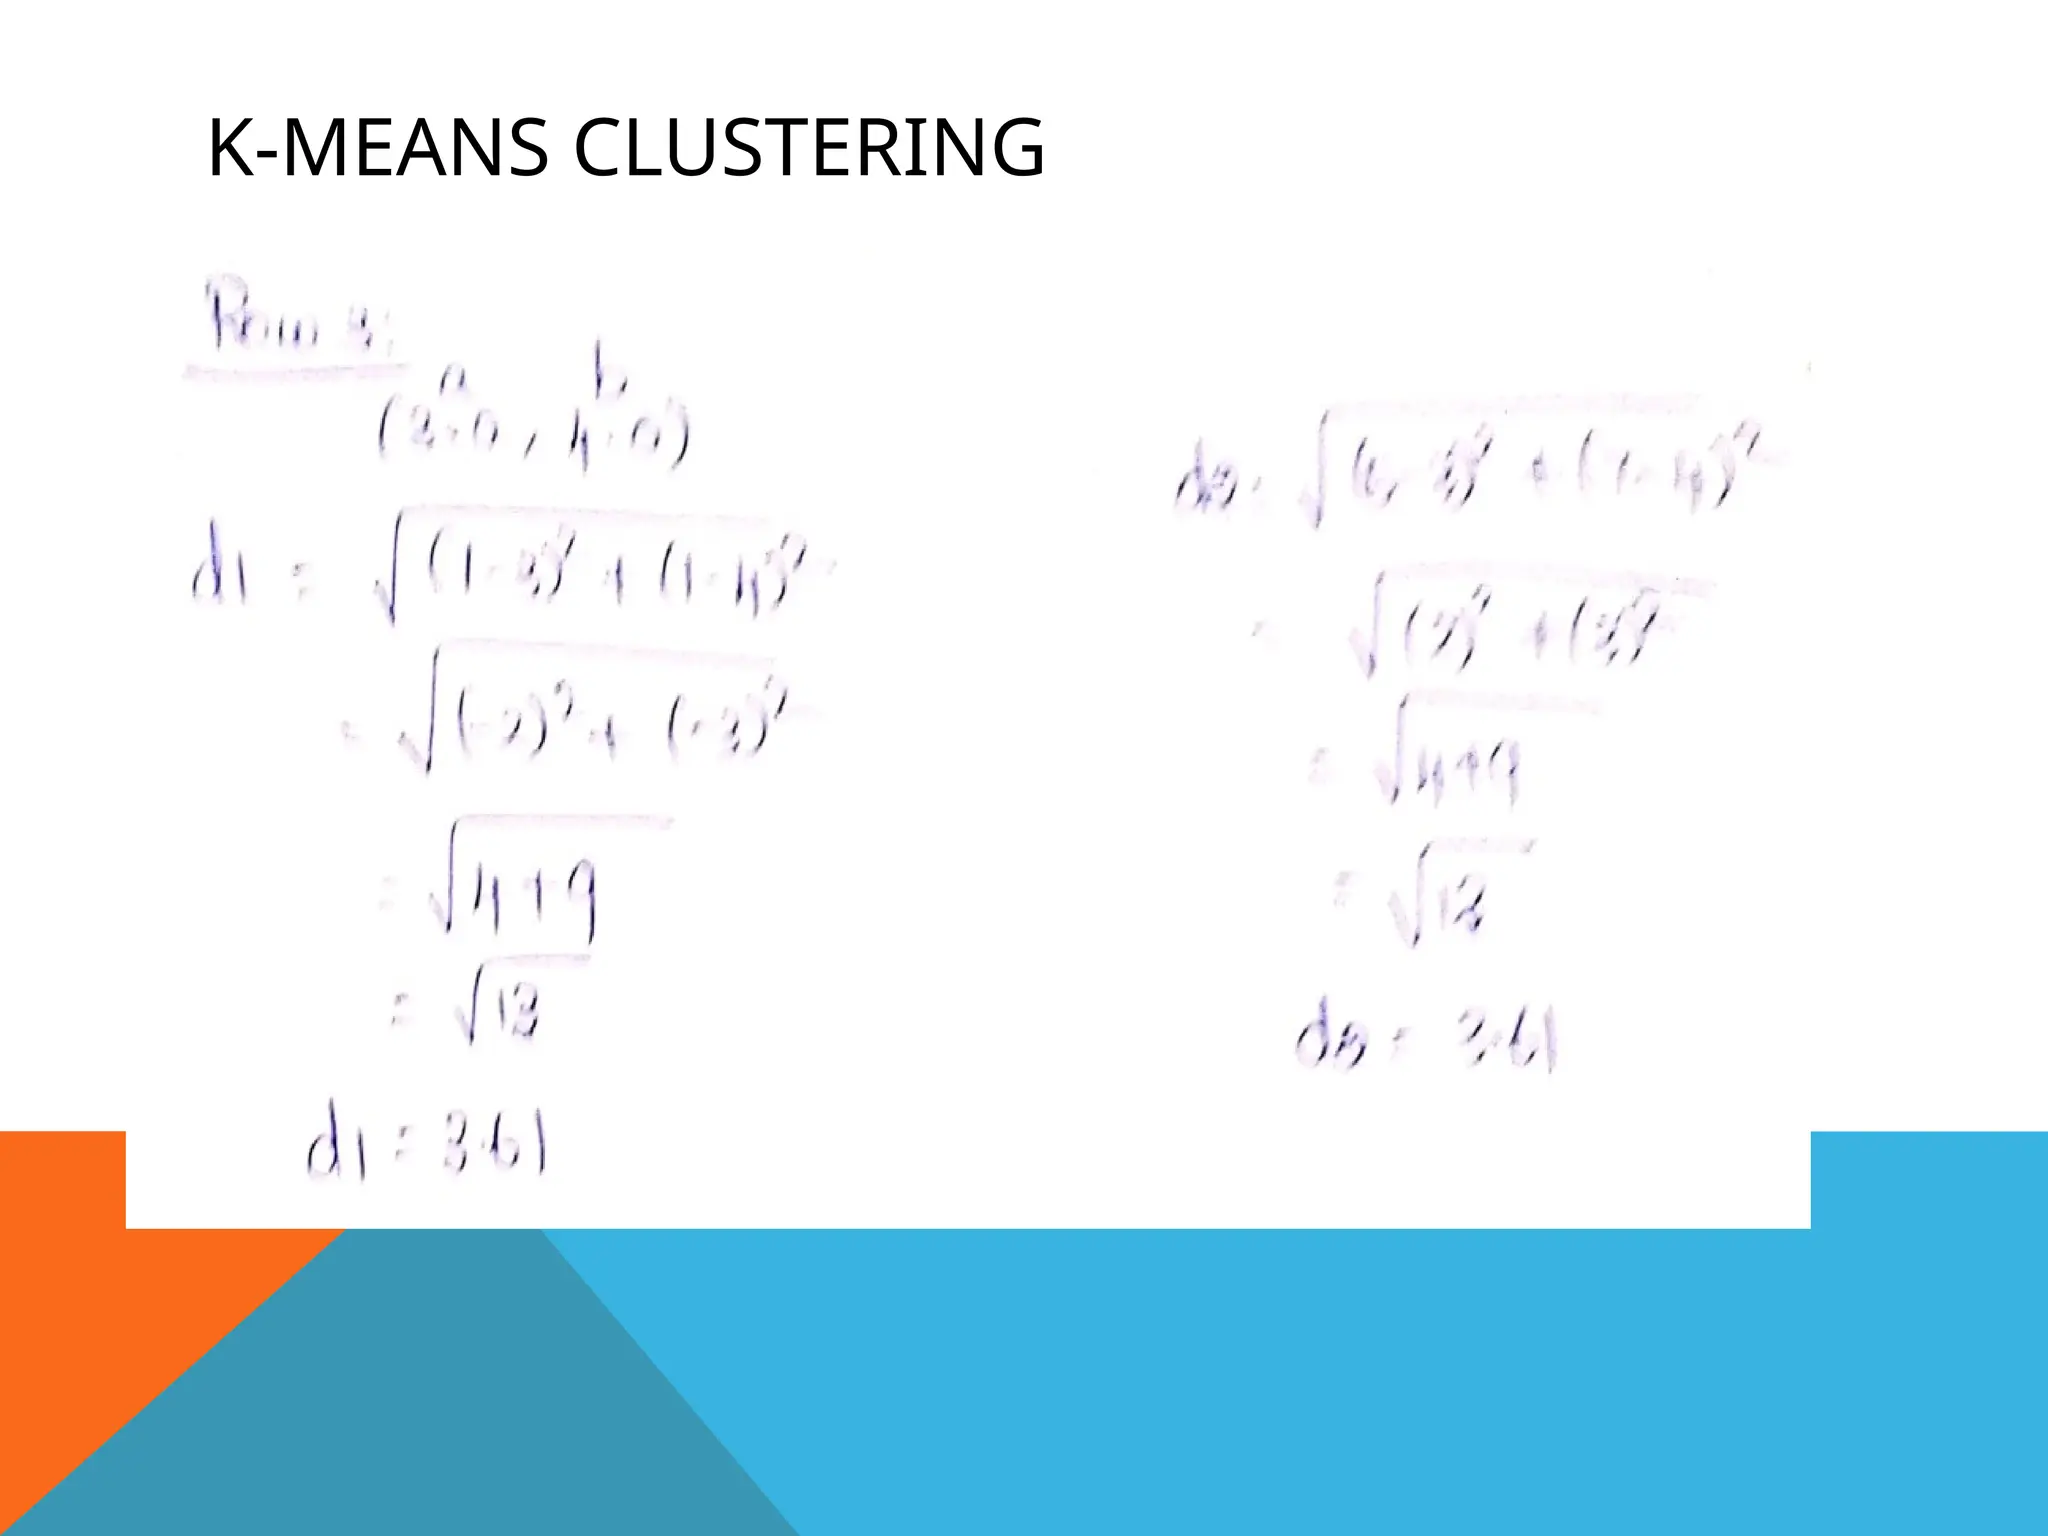
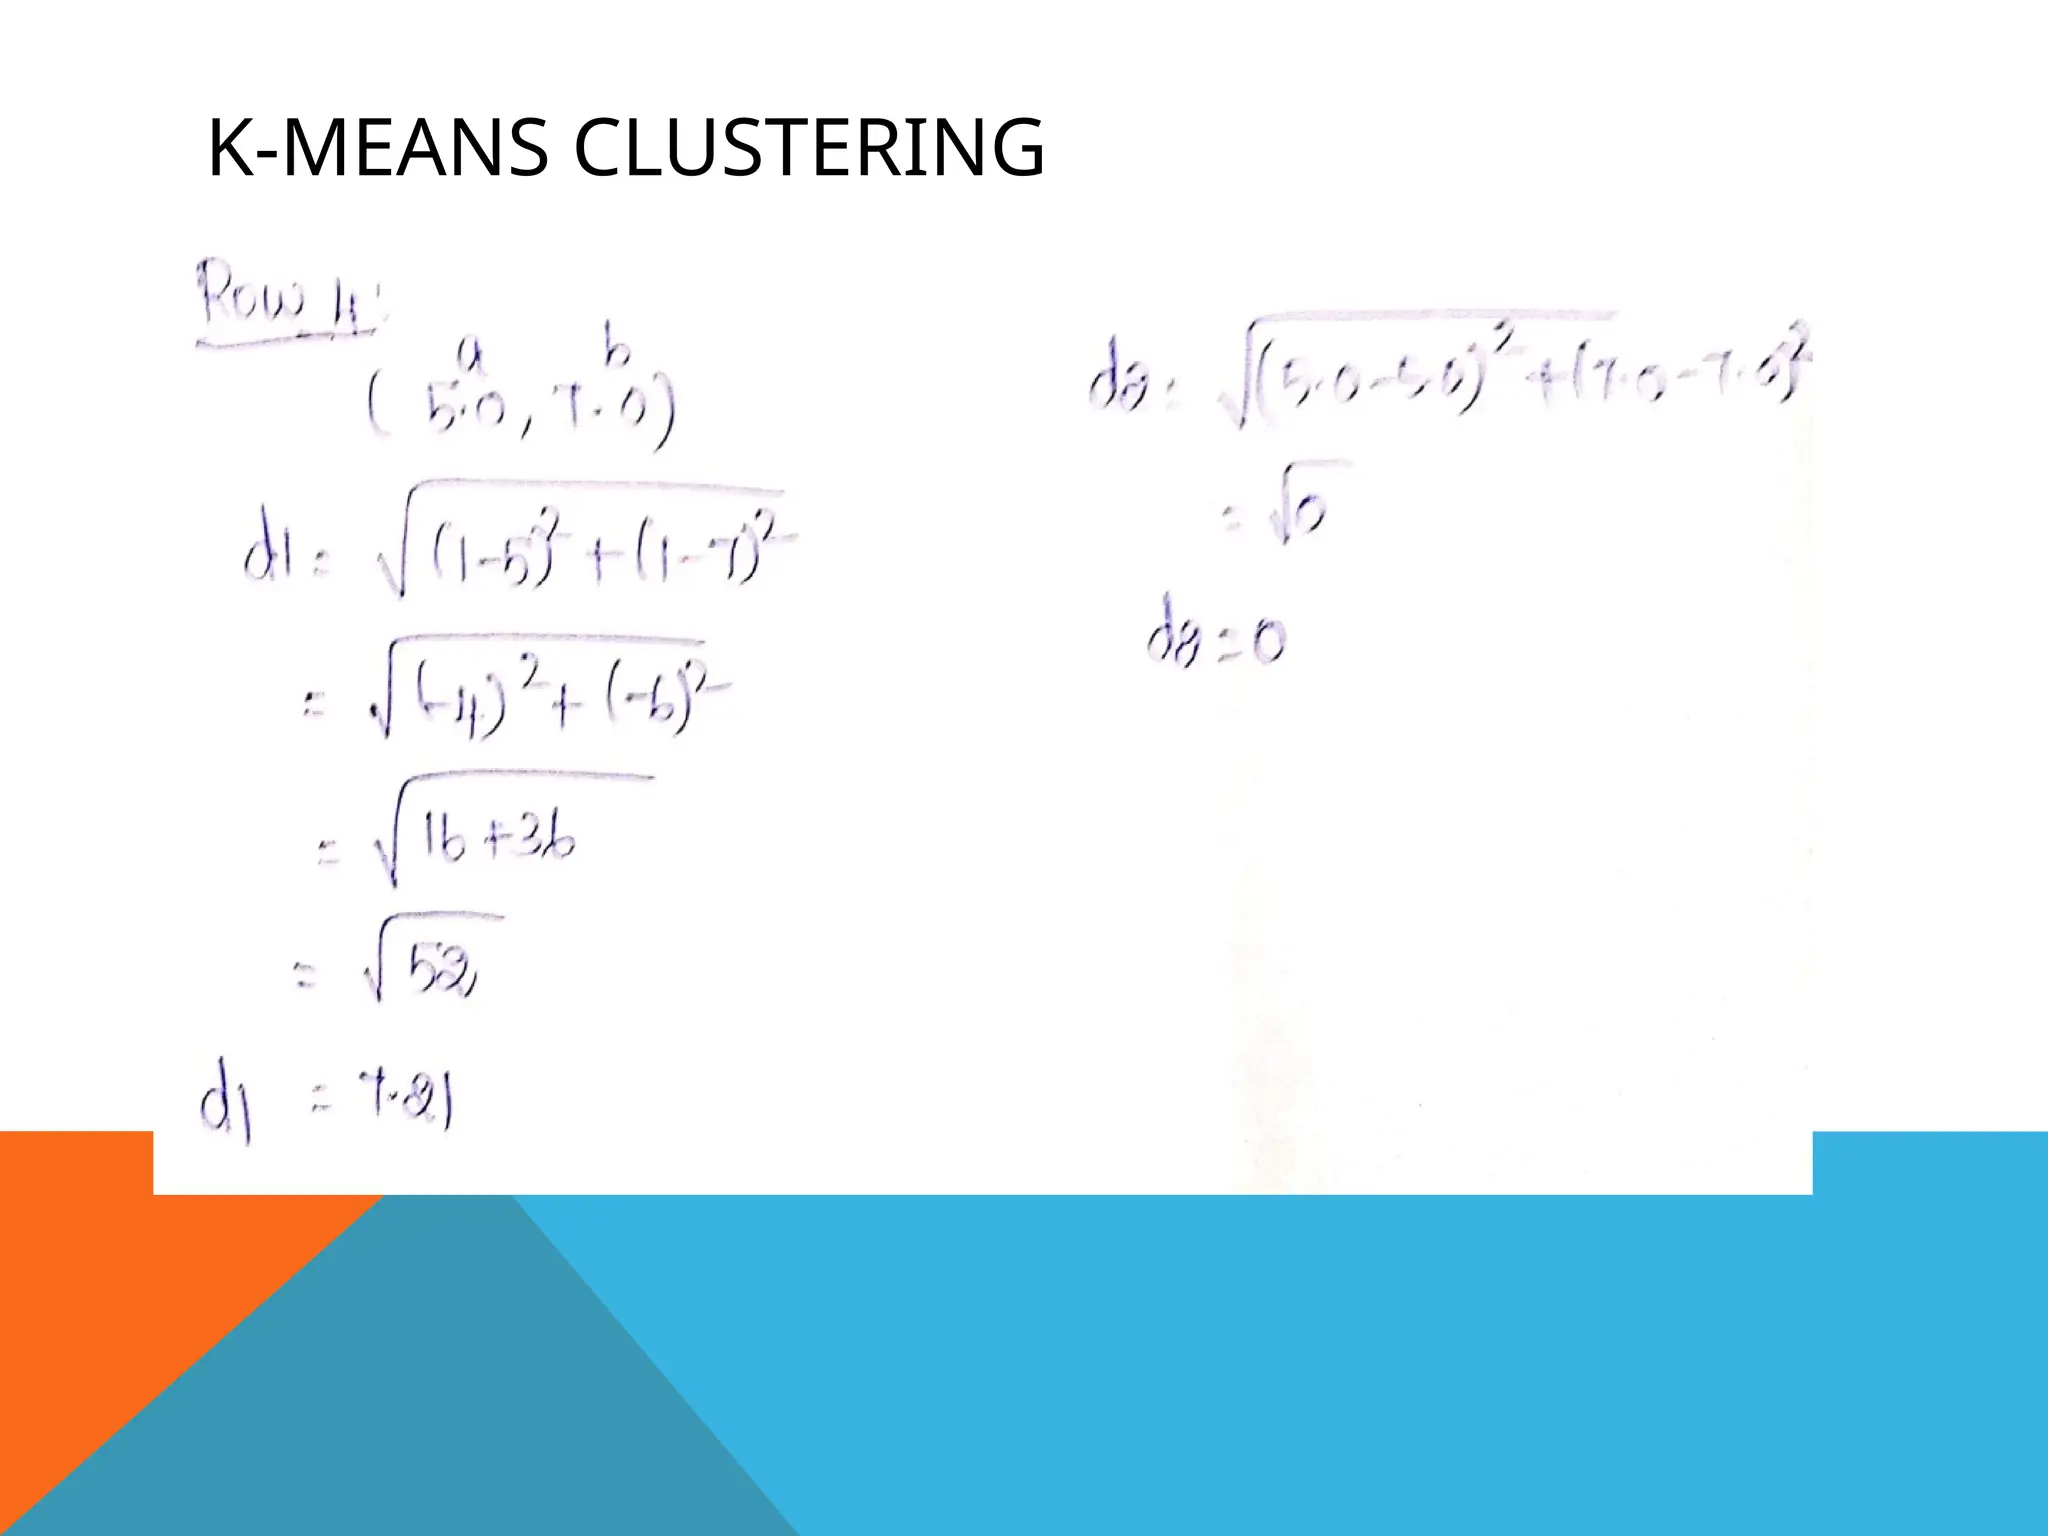
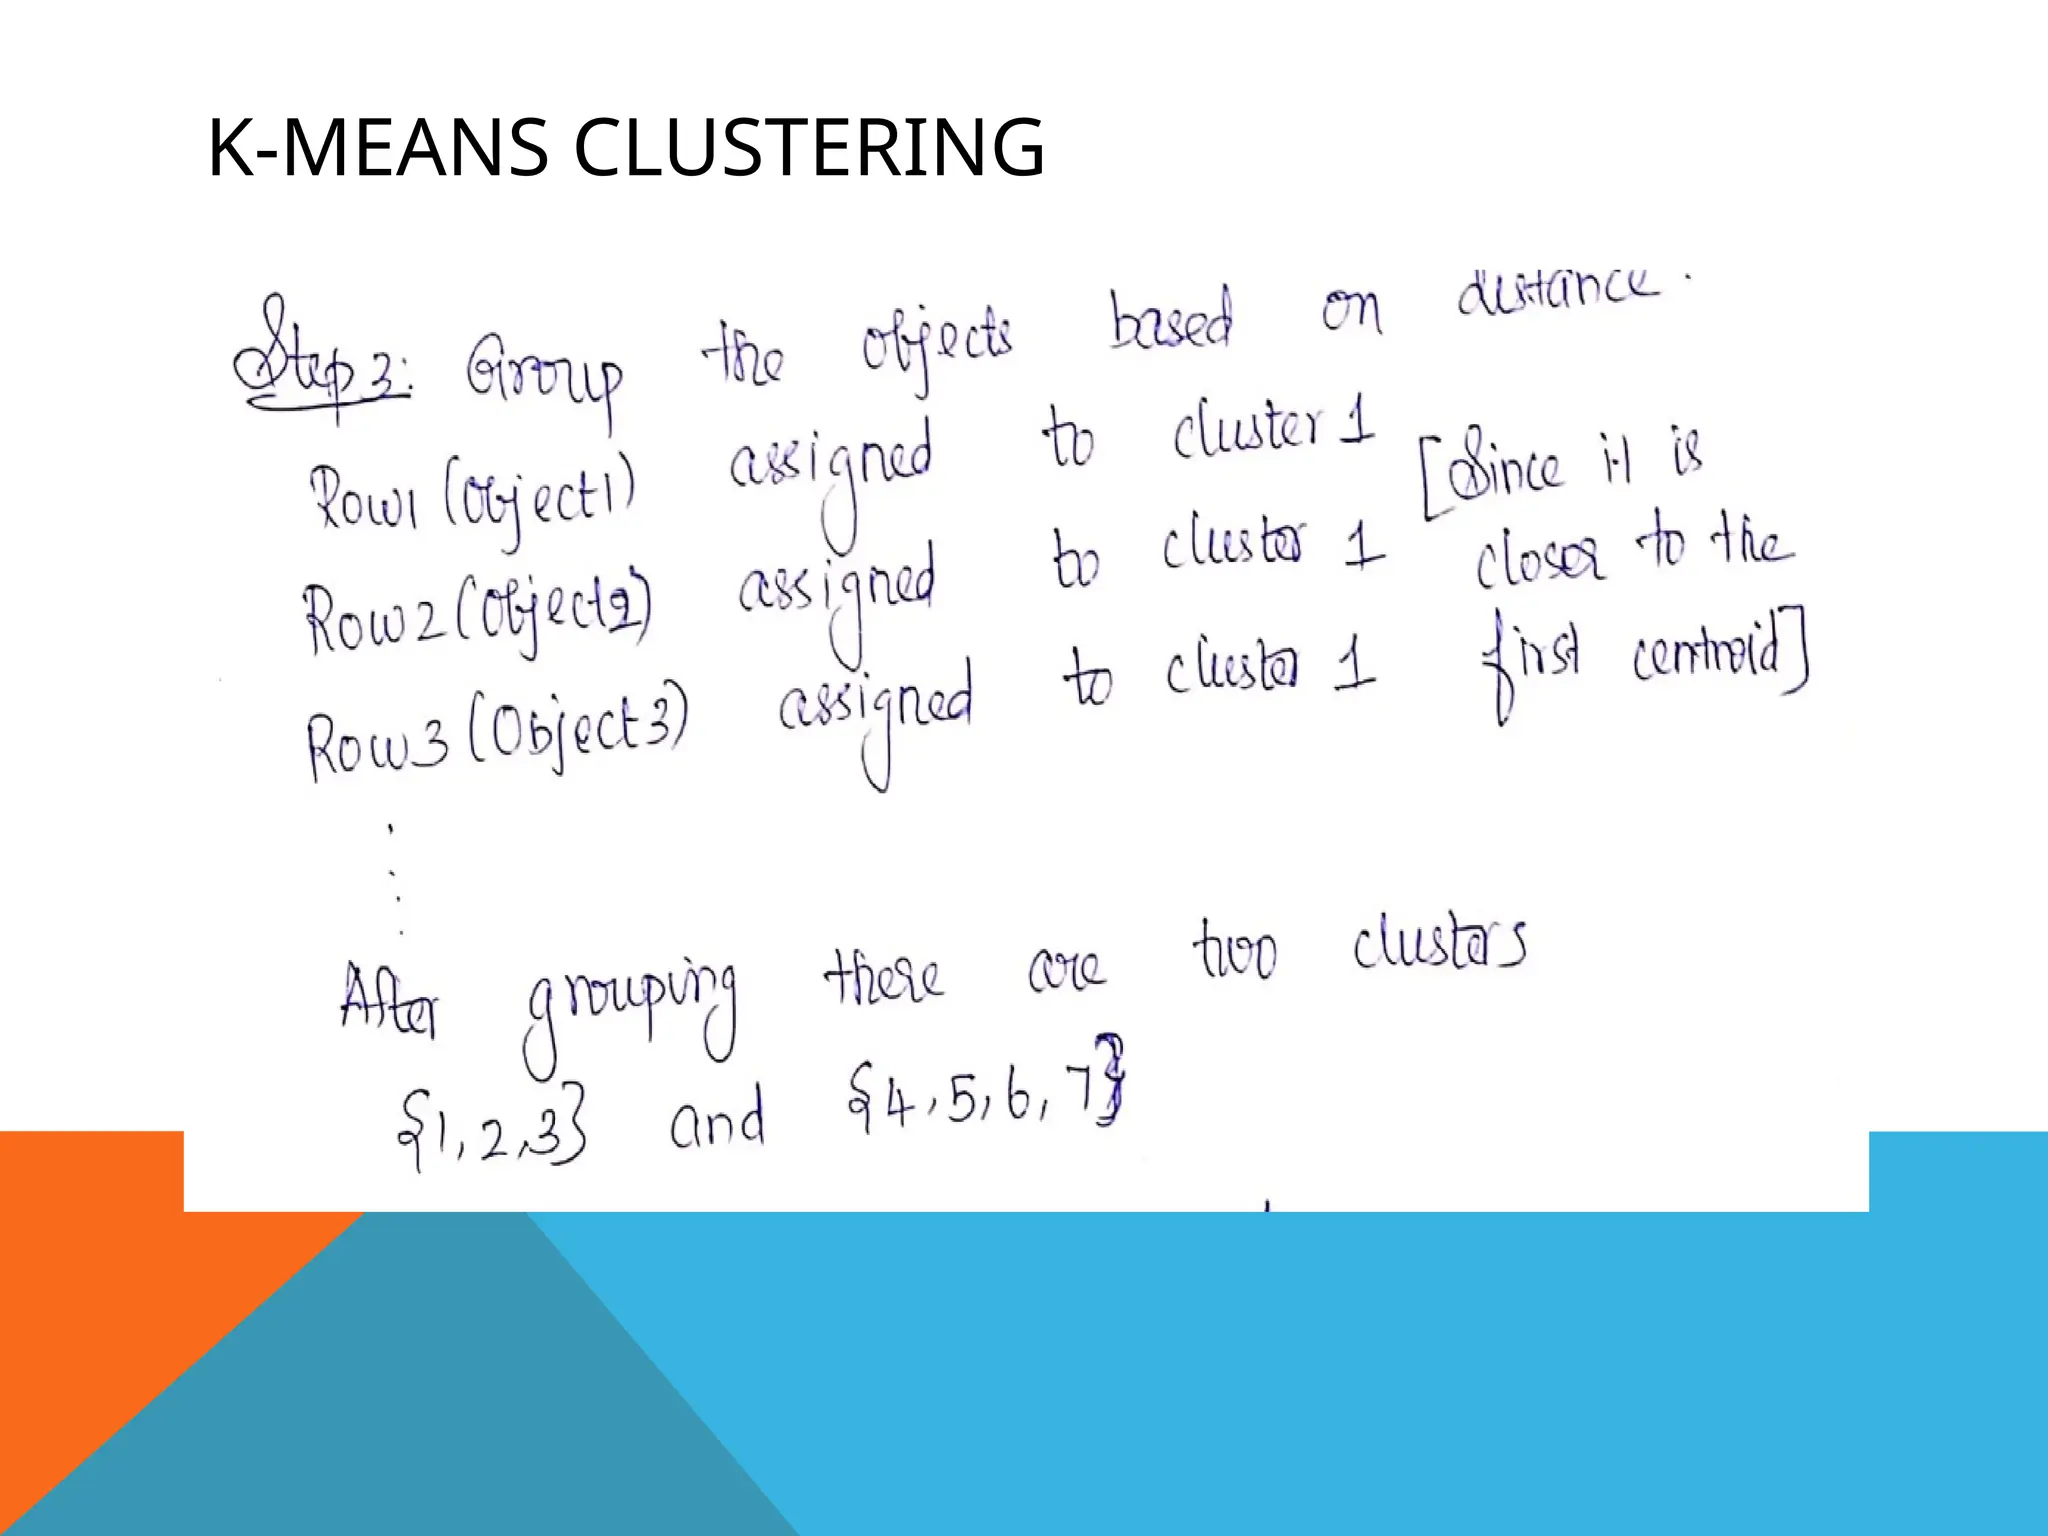
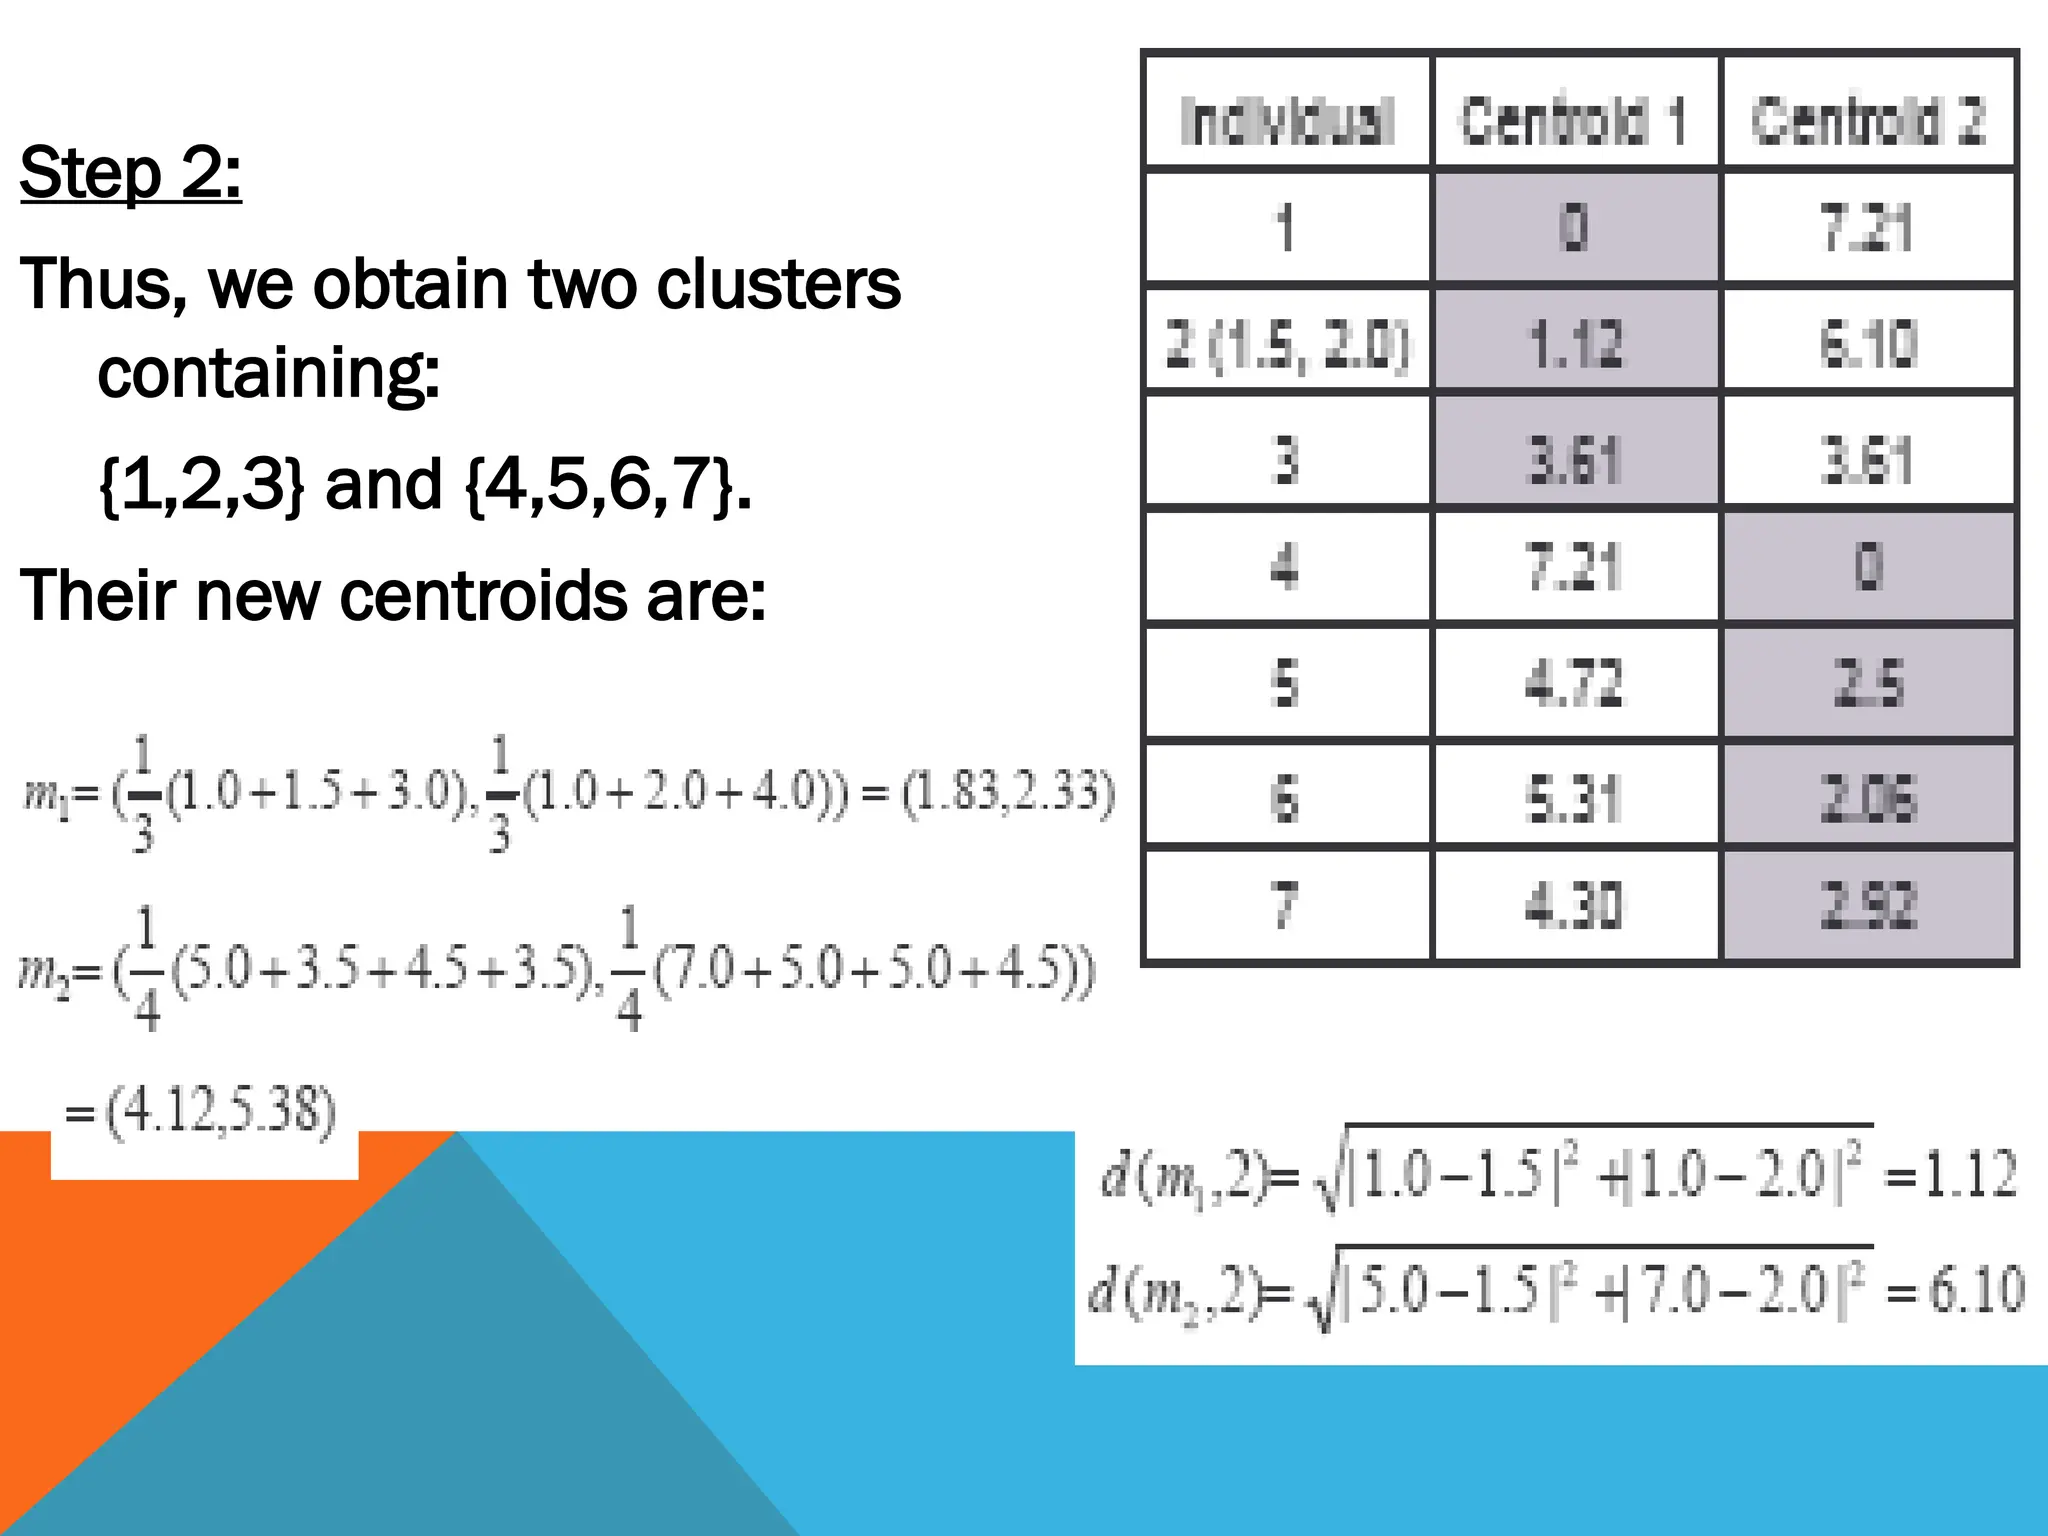
Step 2:
Thus, weobtain two clusters
containing:
{1,2,3} and {4,5,6,7}.
Their new centroids are:
27.
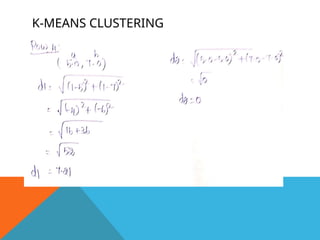
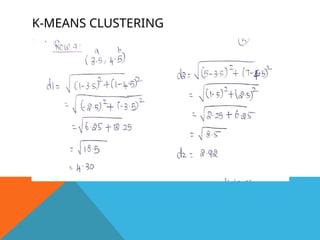
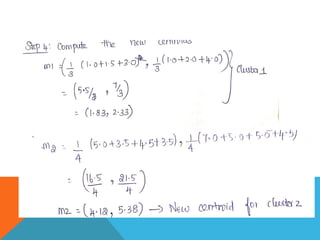
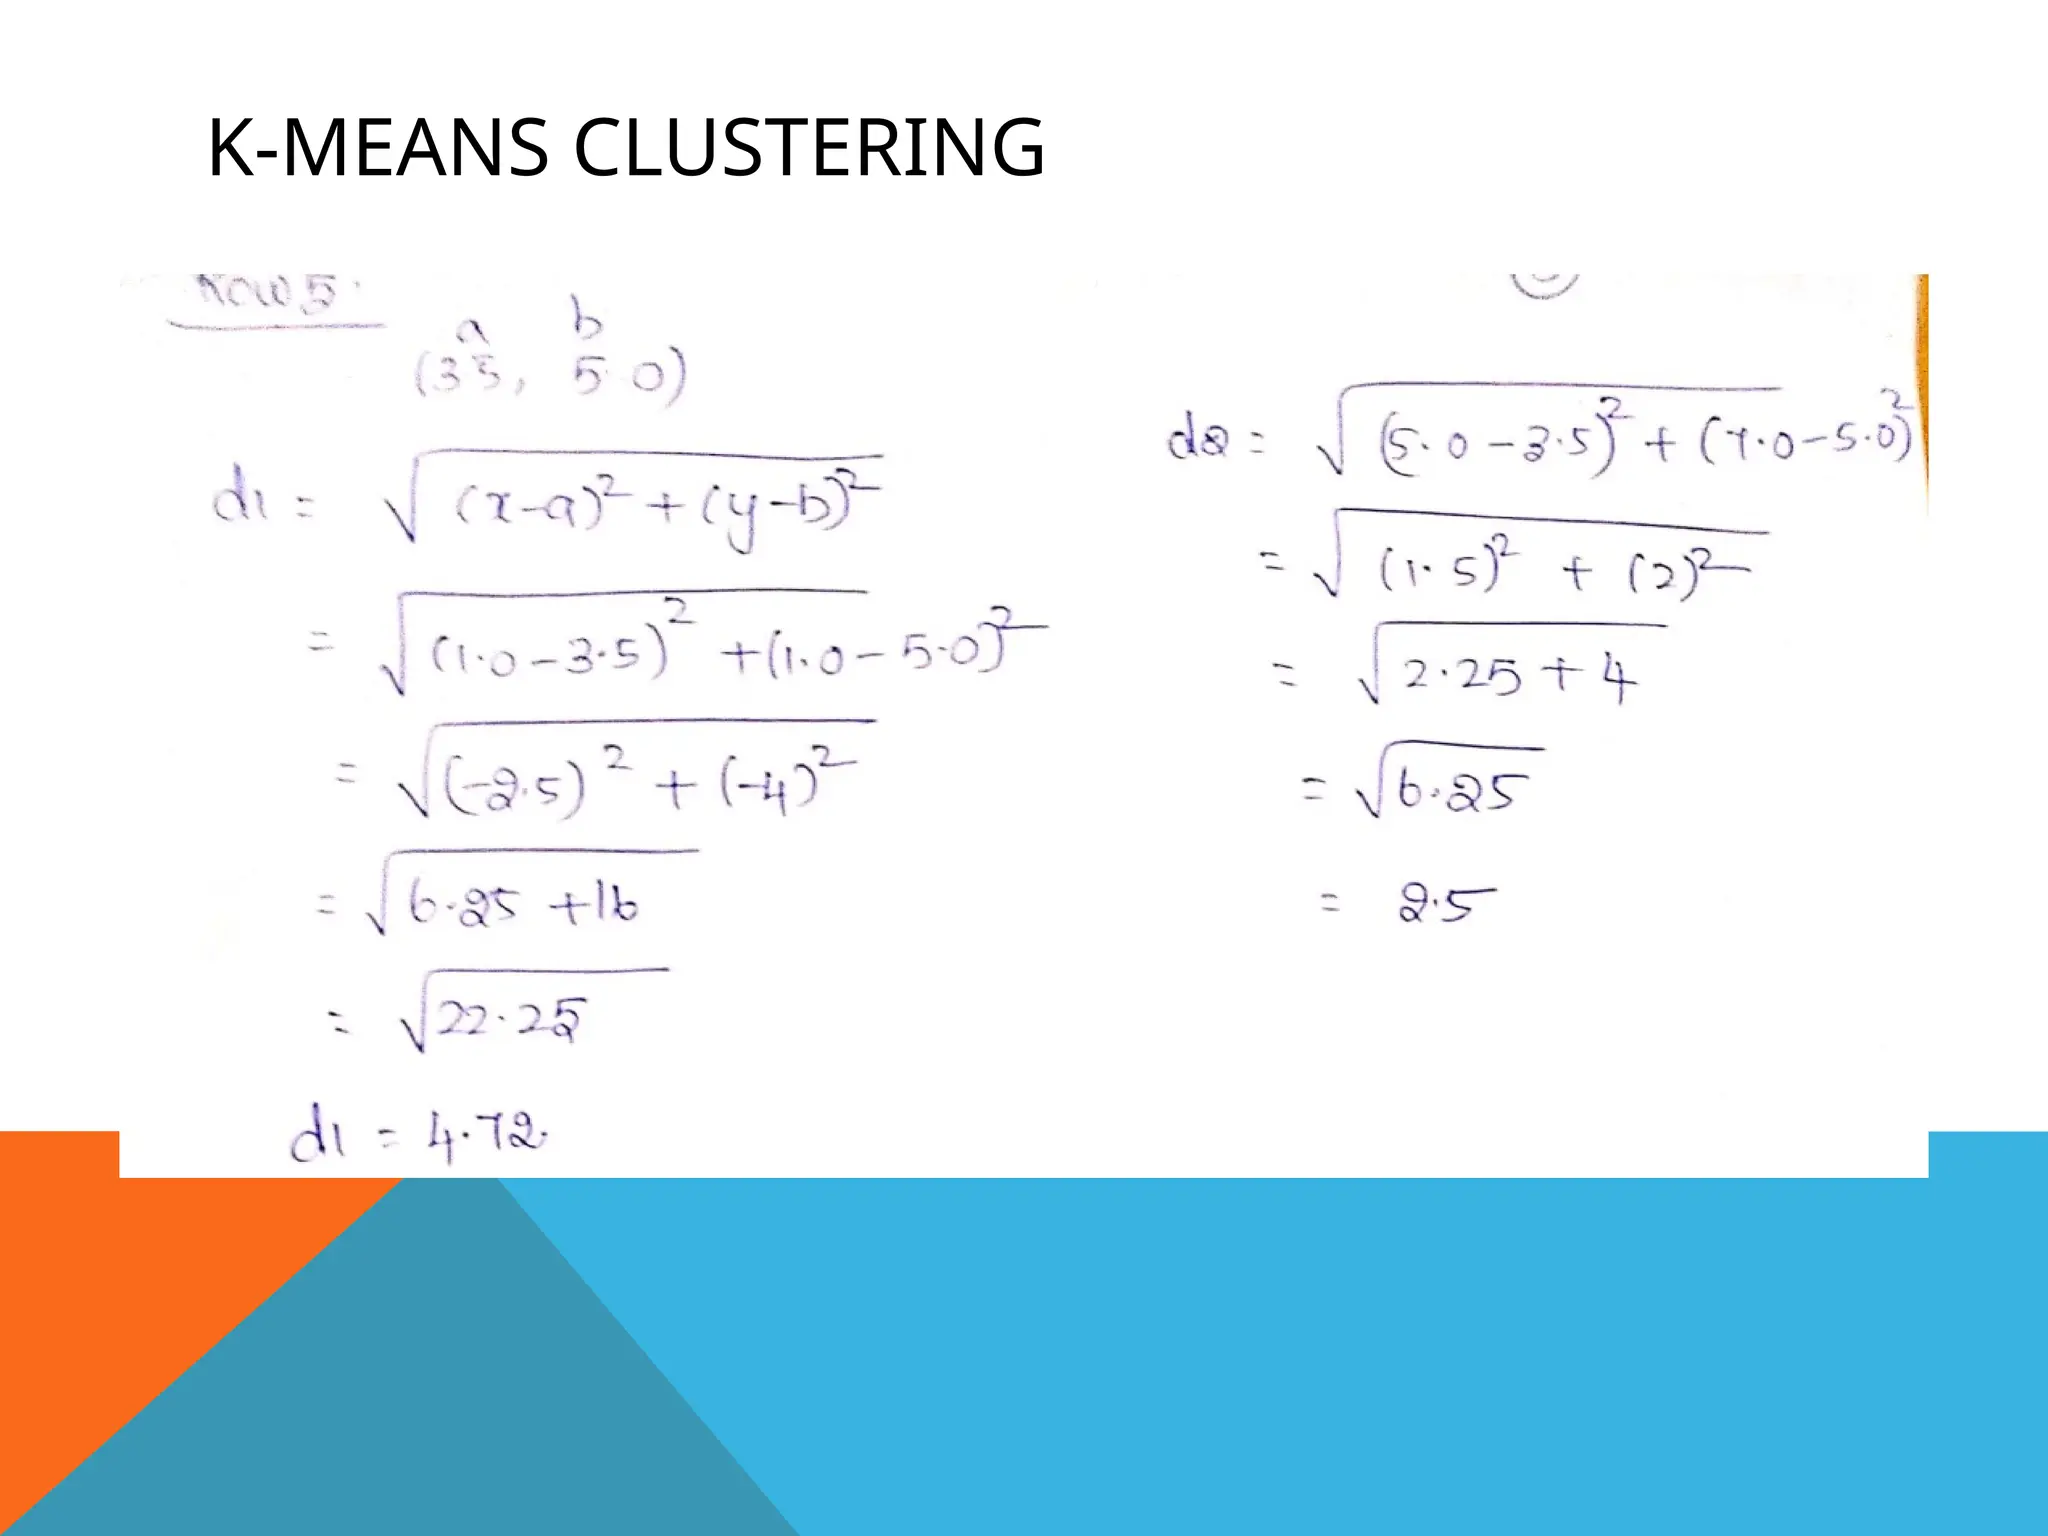
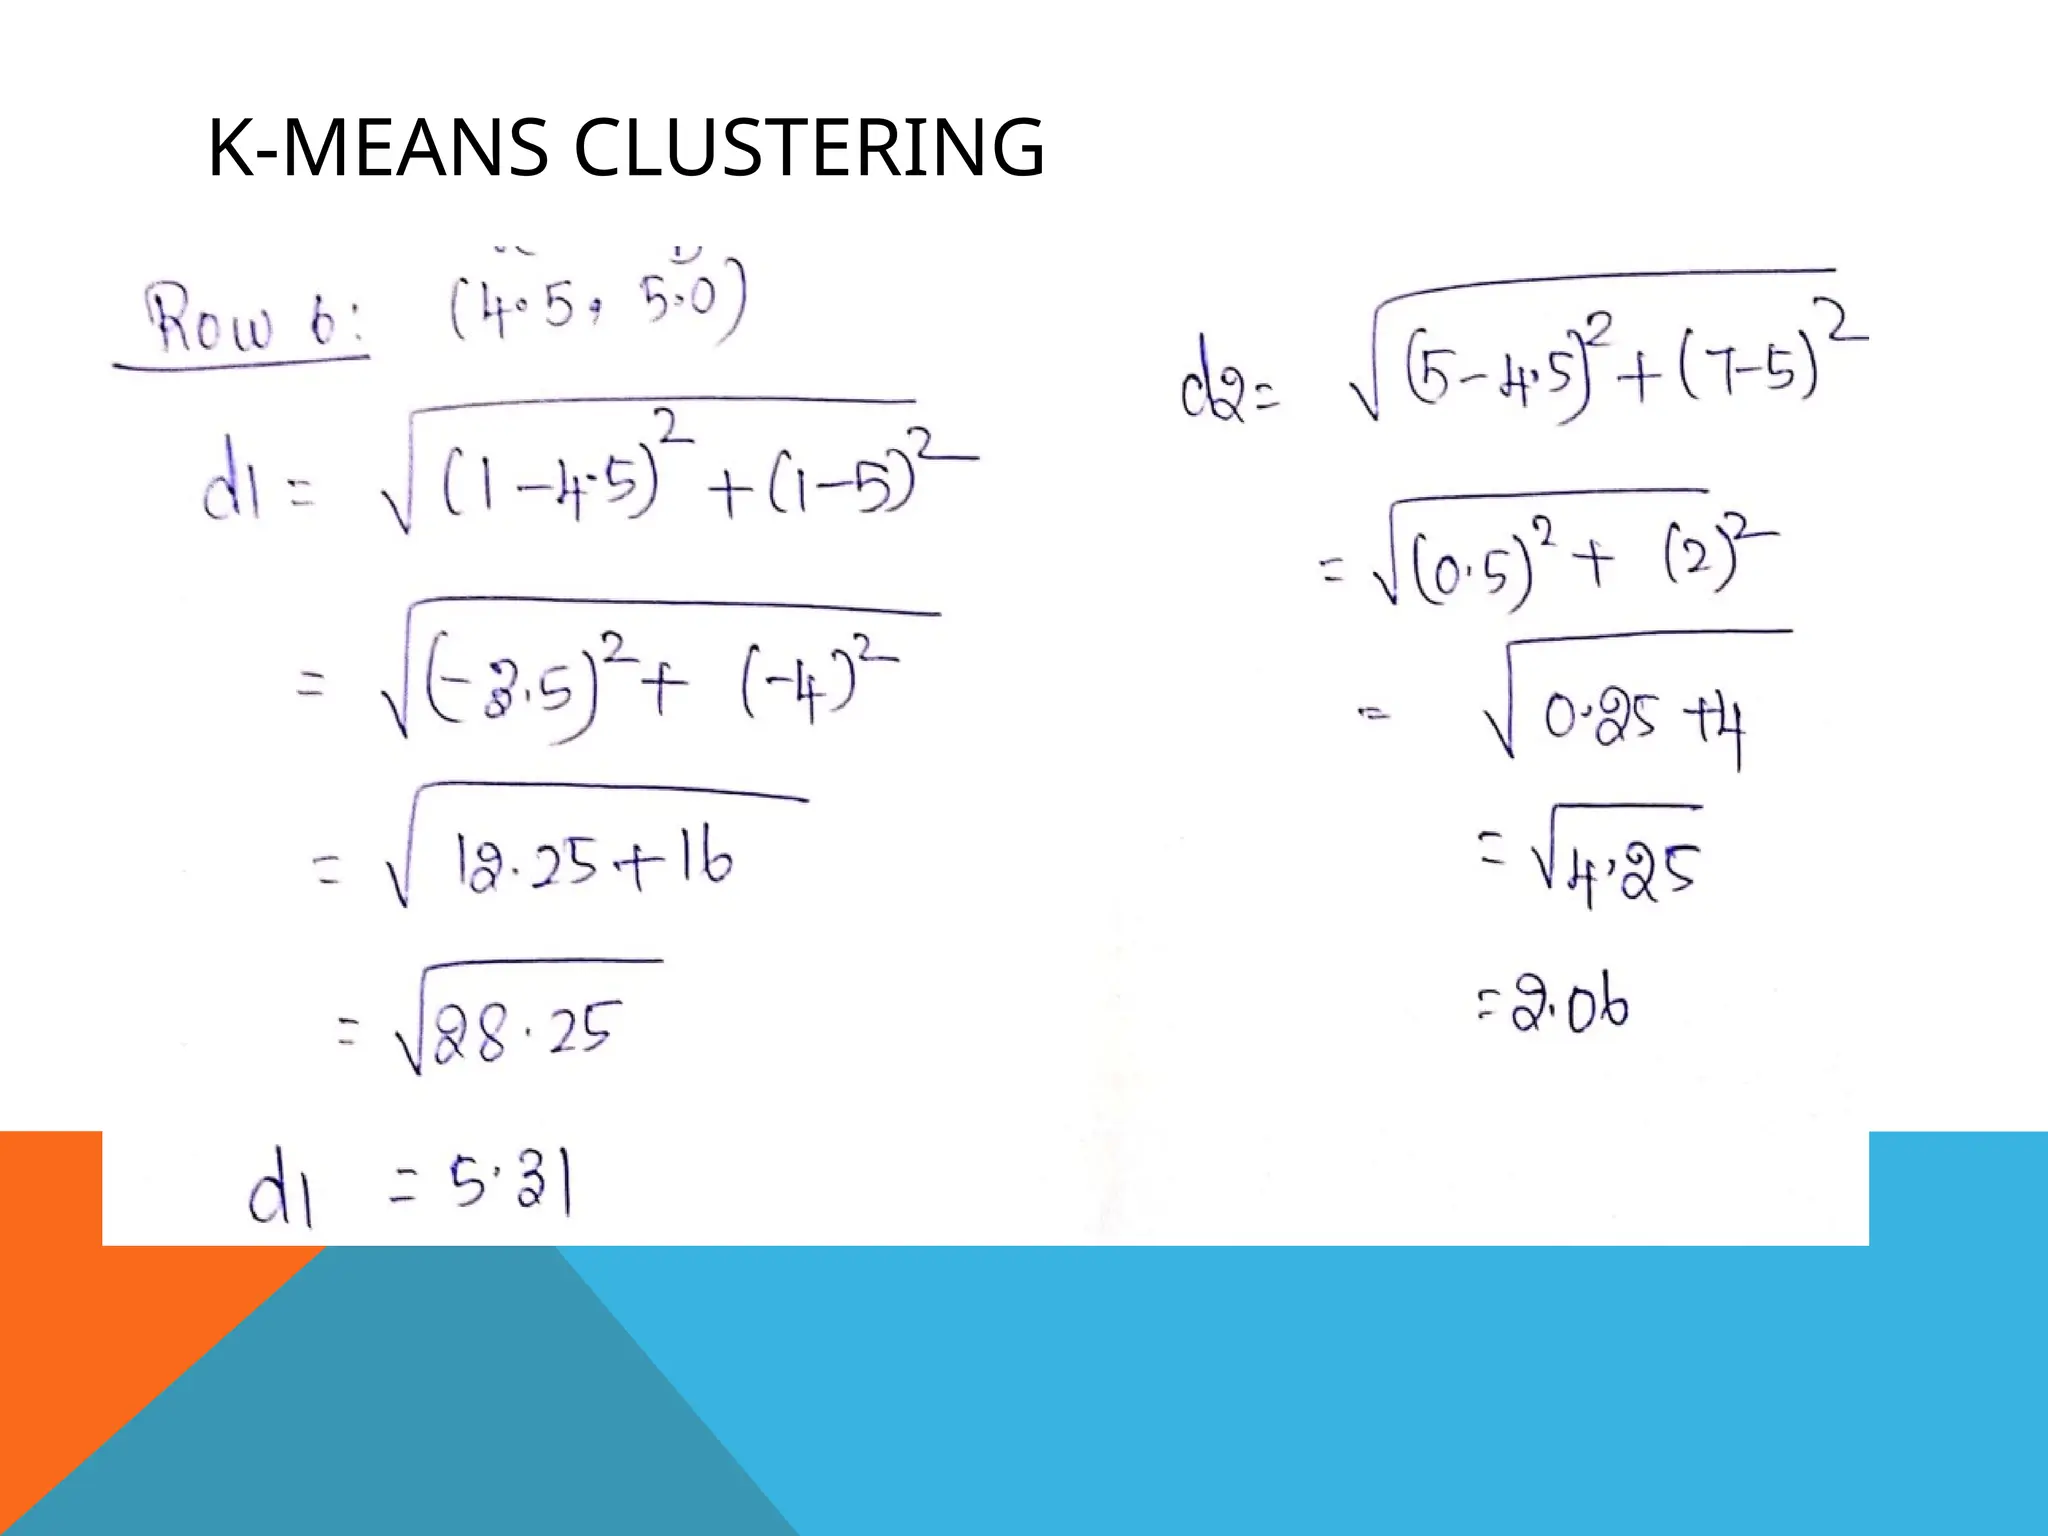
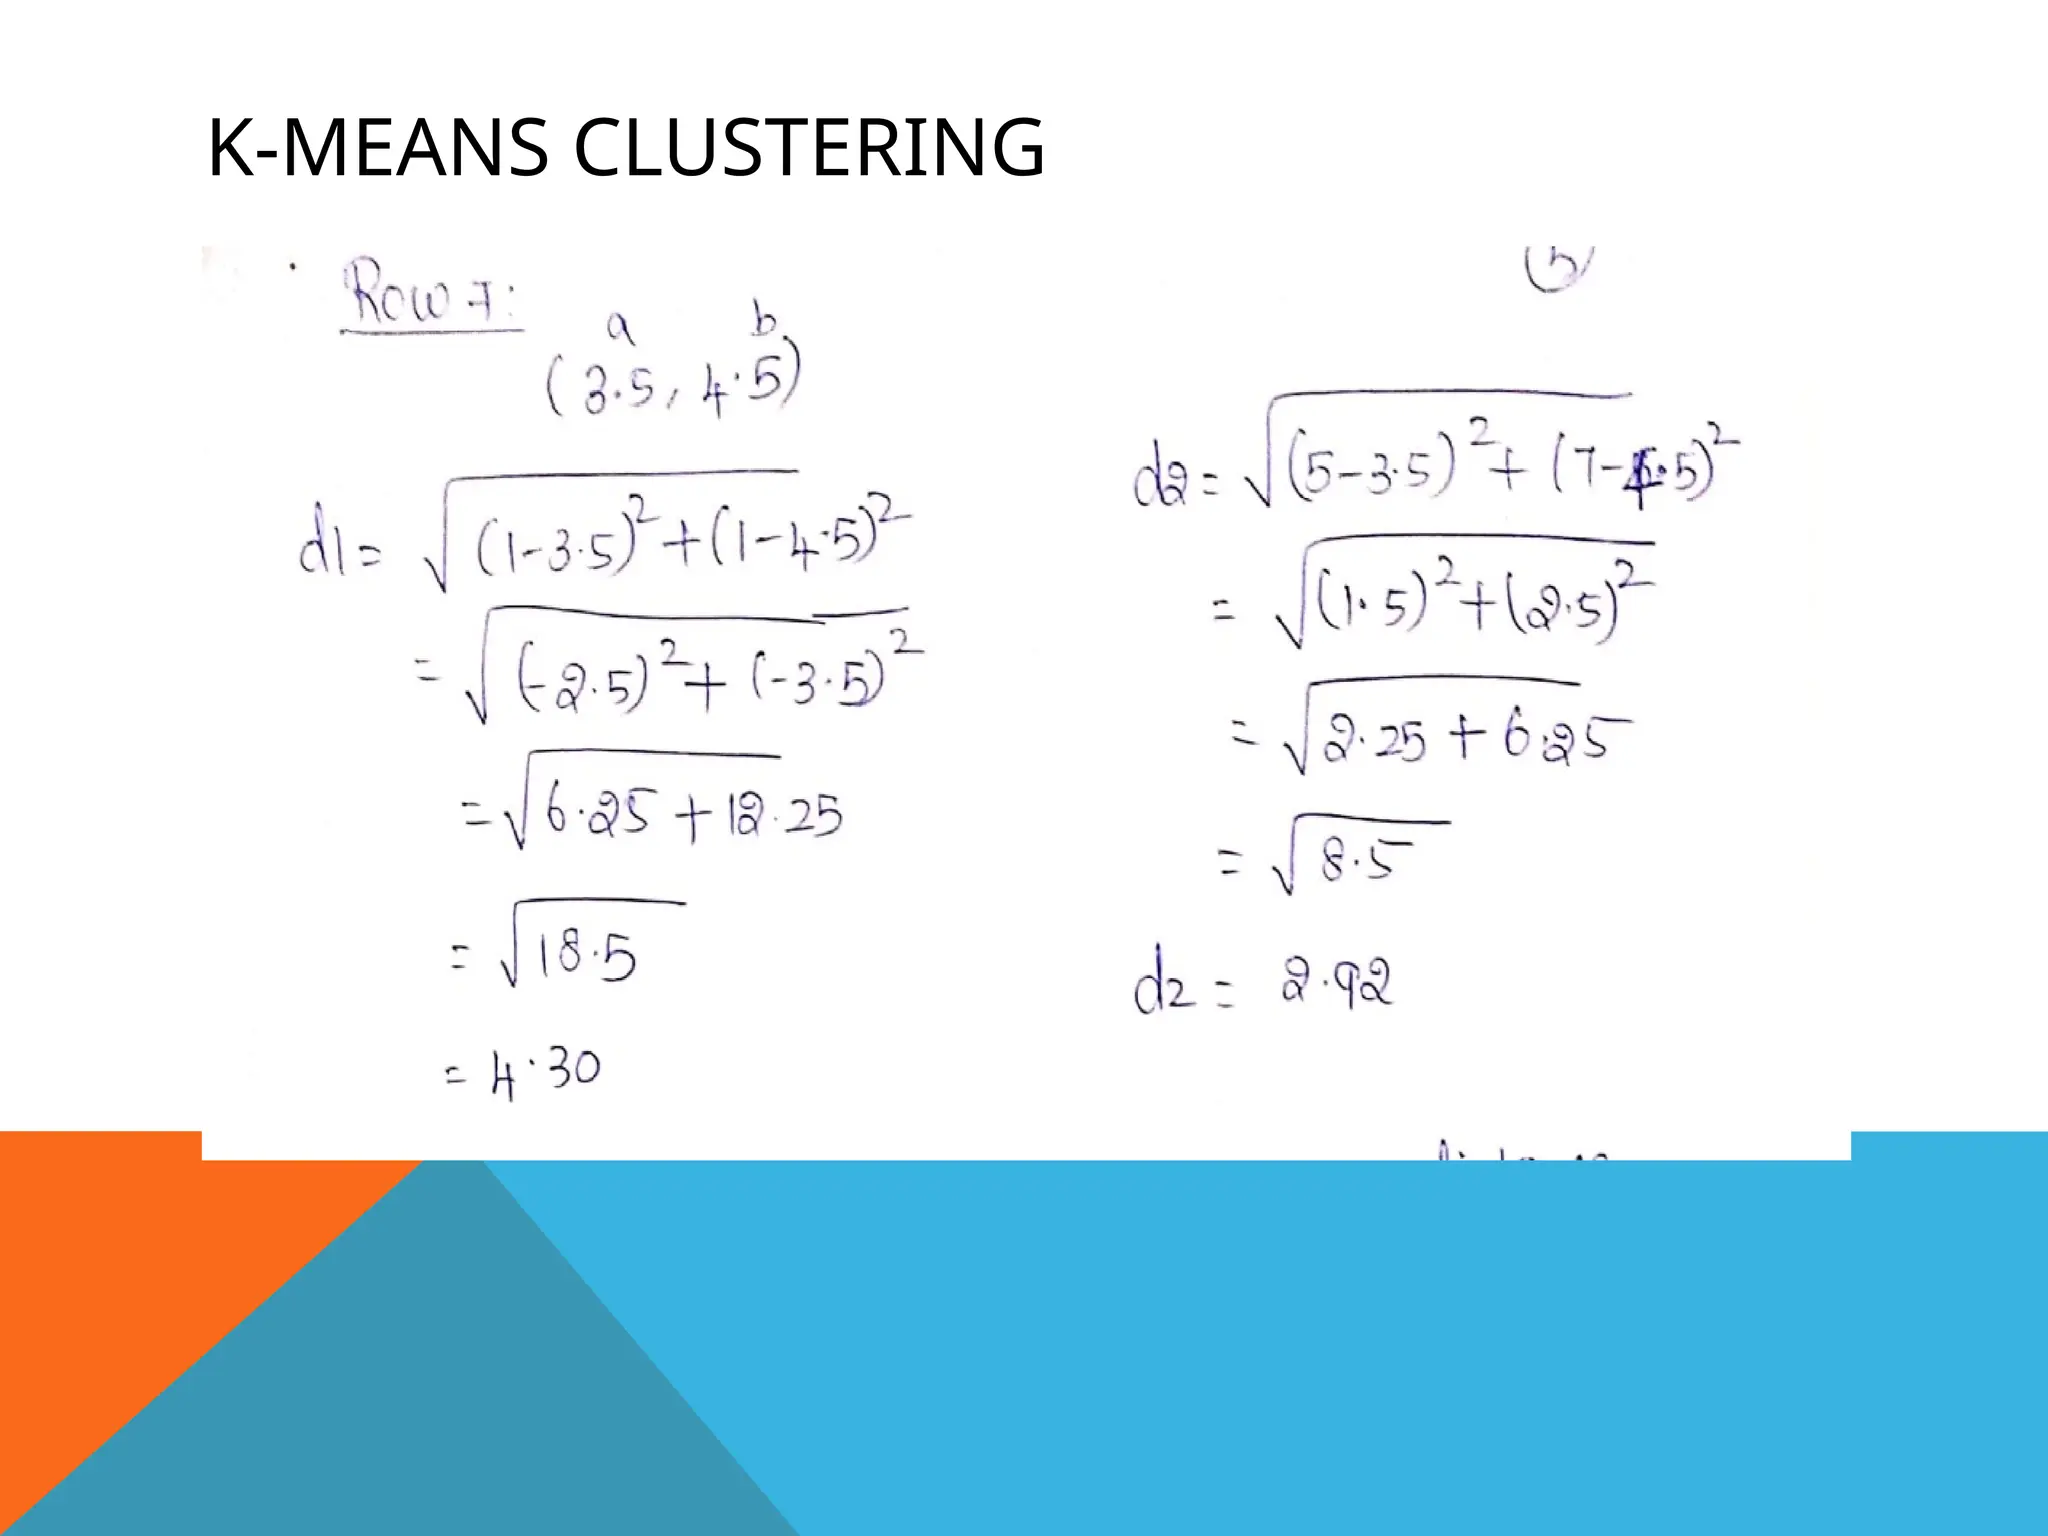
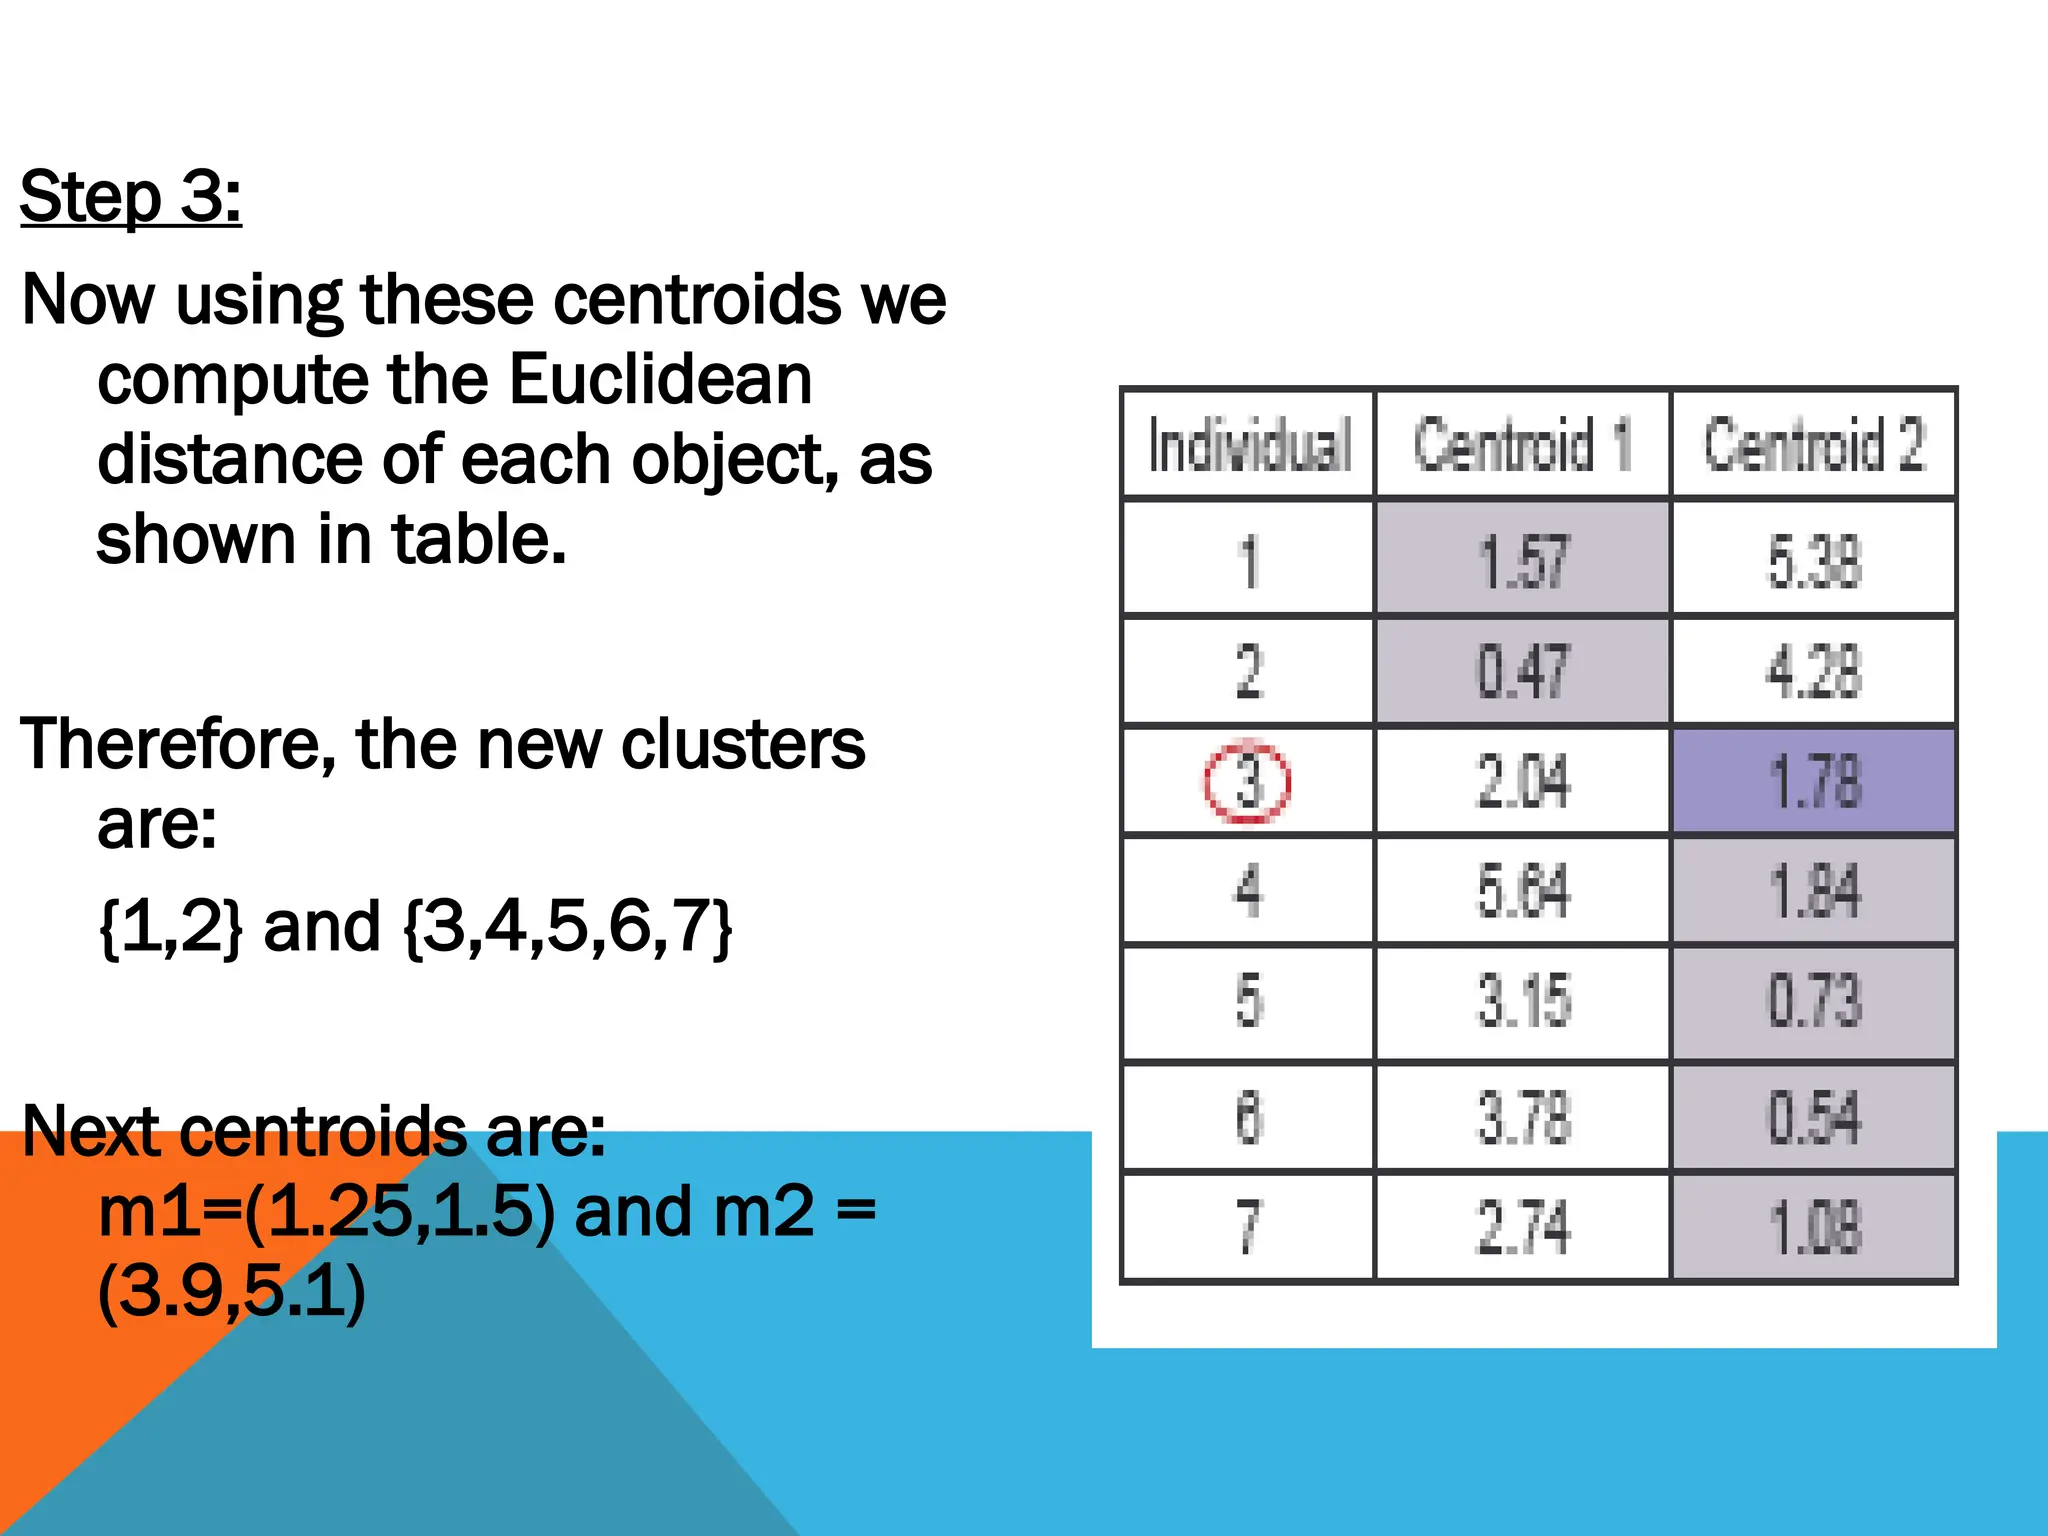
Step 3:
Now usingthese centroids we
compute the Euclidean
distance of each object, as
shown in table.
Therefore, the new clusters
are:
{1,2} and {3,4,5,6,7}
Next centroids are:
m1=(1.25,1.5) and m2 =
(3.9,5.1)
28.
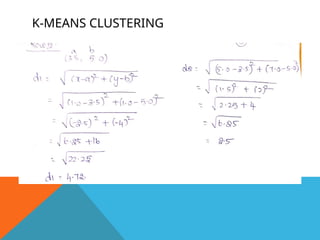
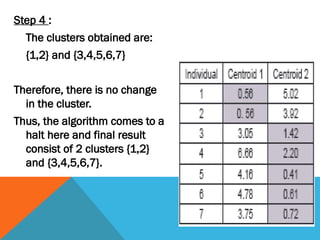
Step 4 :
Theclusters obtained are:
{1,2} and {3,4,5,6,7}
Therefore, there is no change
in the cluster.
Thus, the algorithm comes to a
halt here and final result
consist of 2 clusters {1,2}
and {3,4,5,6,7}.
29.
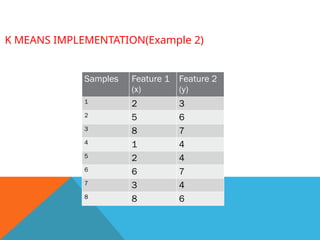
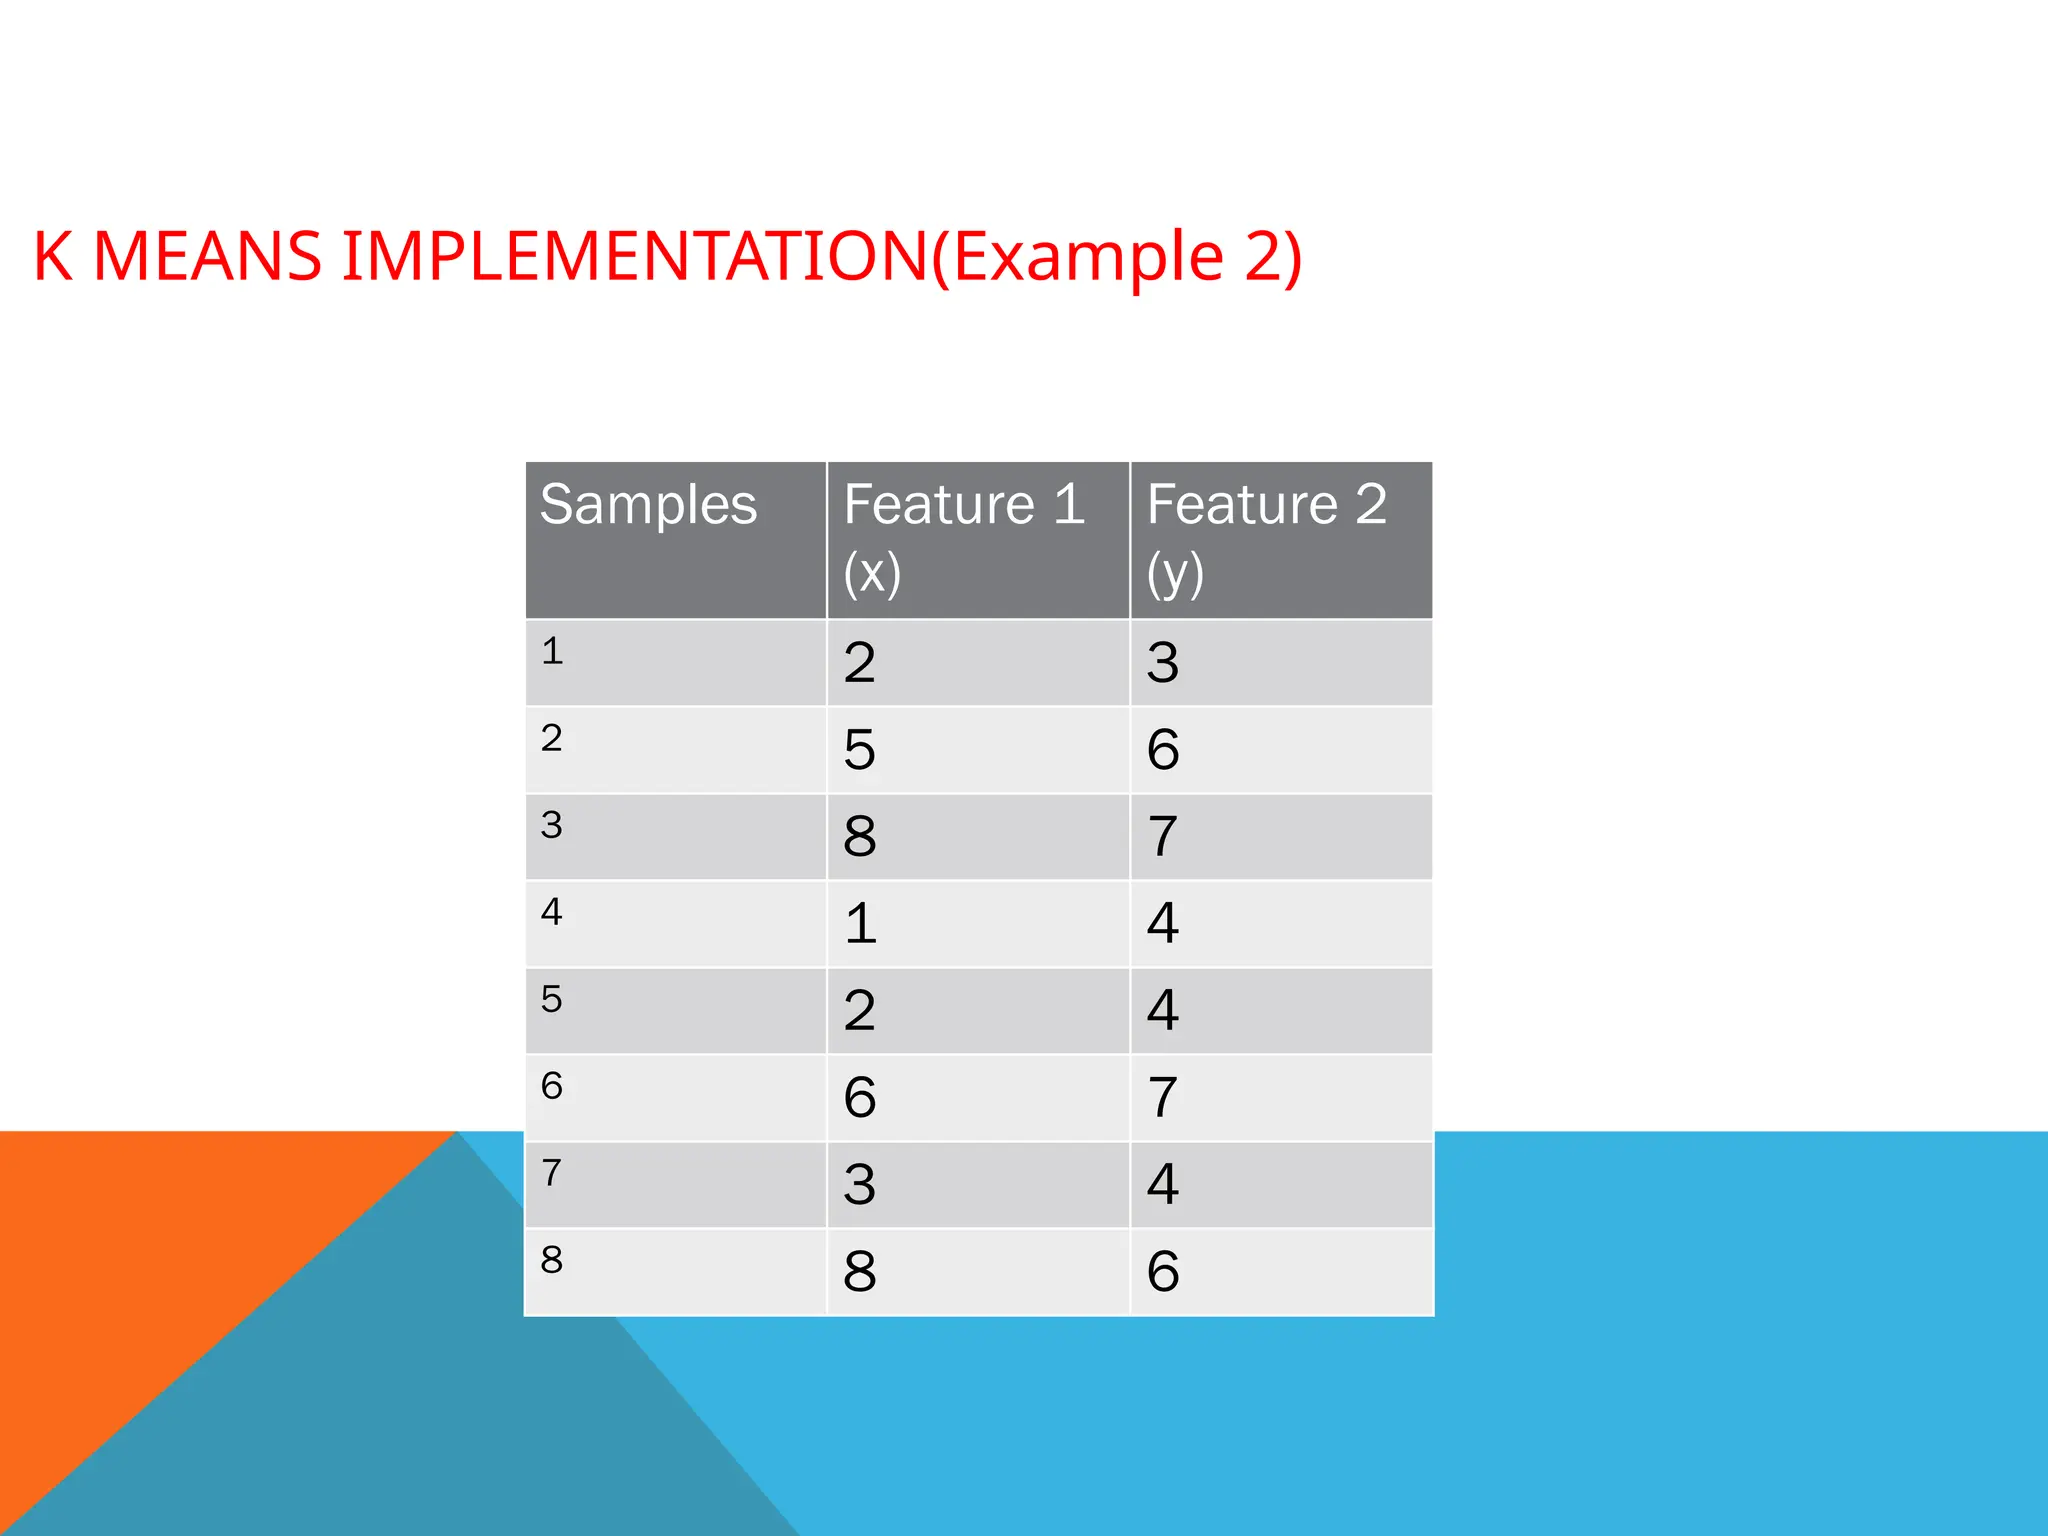
K MEANS IMPLEMENTATION(Example2)
Apply K means algorithm to group the samples into two clusters.
Samples Feature 1
(x)
Feature 2
(y)
1 2 3
2 5 6
3 8 7
4 1 4
5 2 4
6 6 7
7 3 4
8 8 6
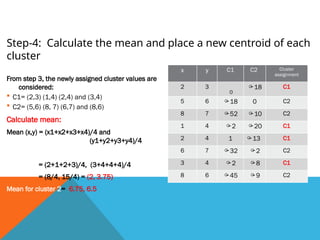
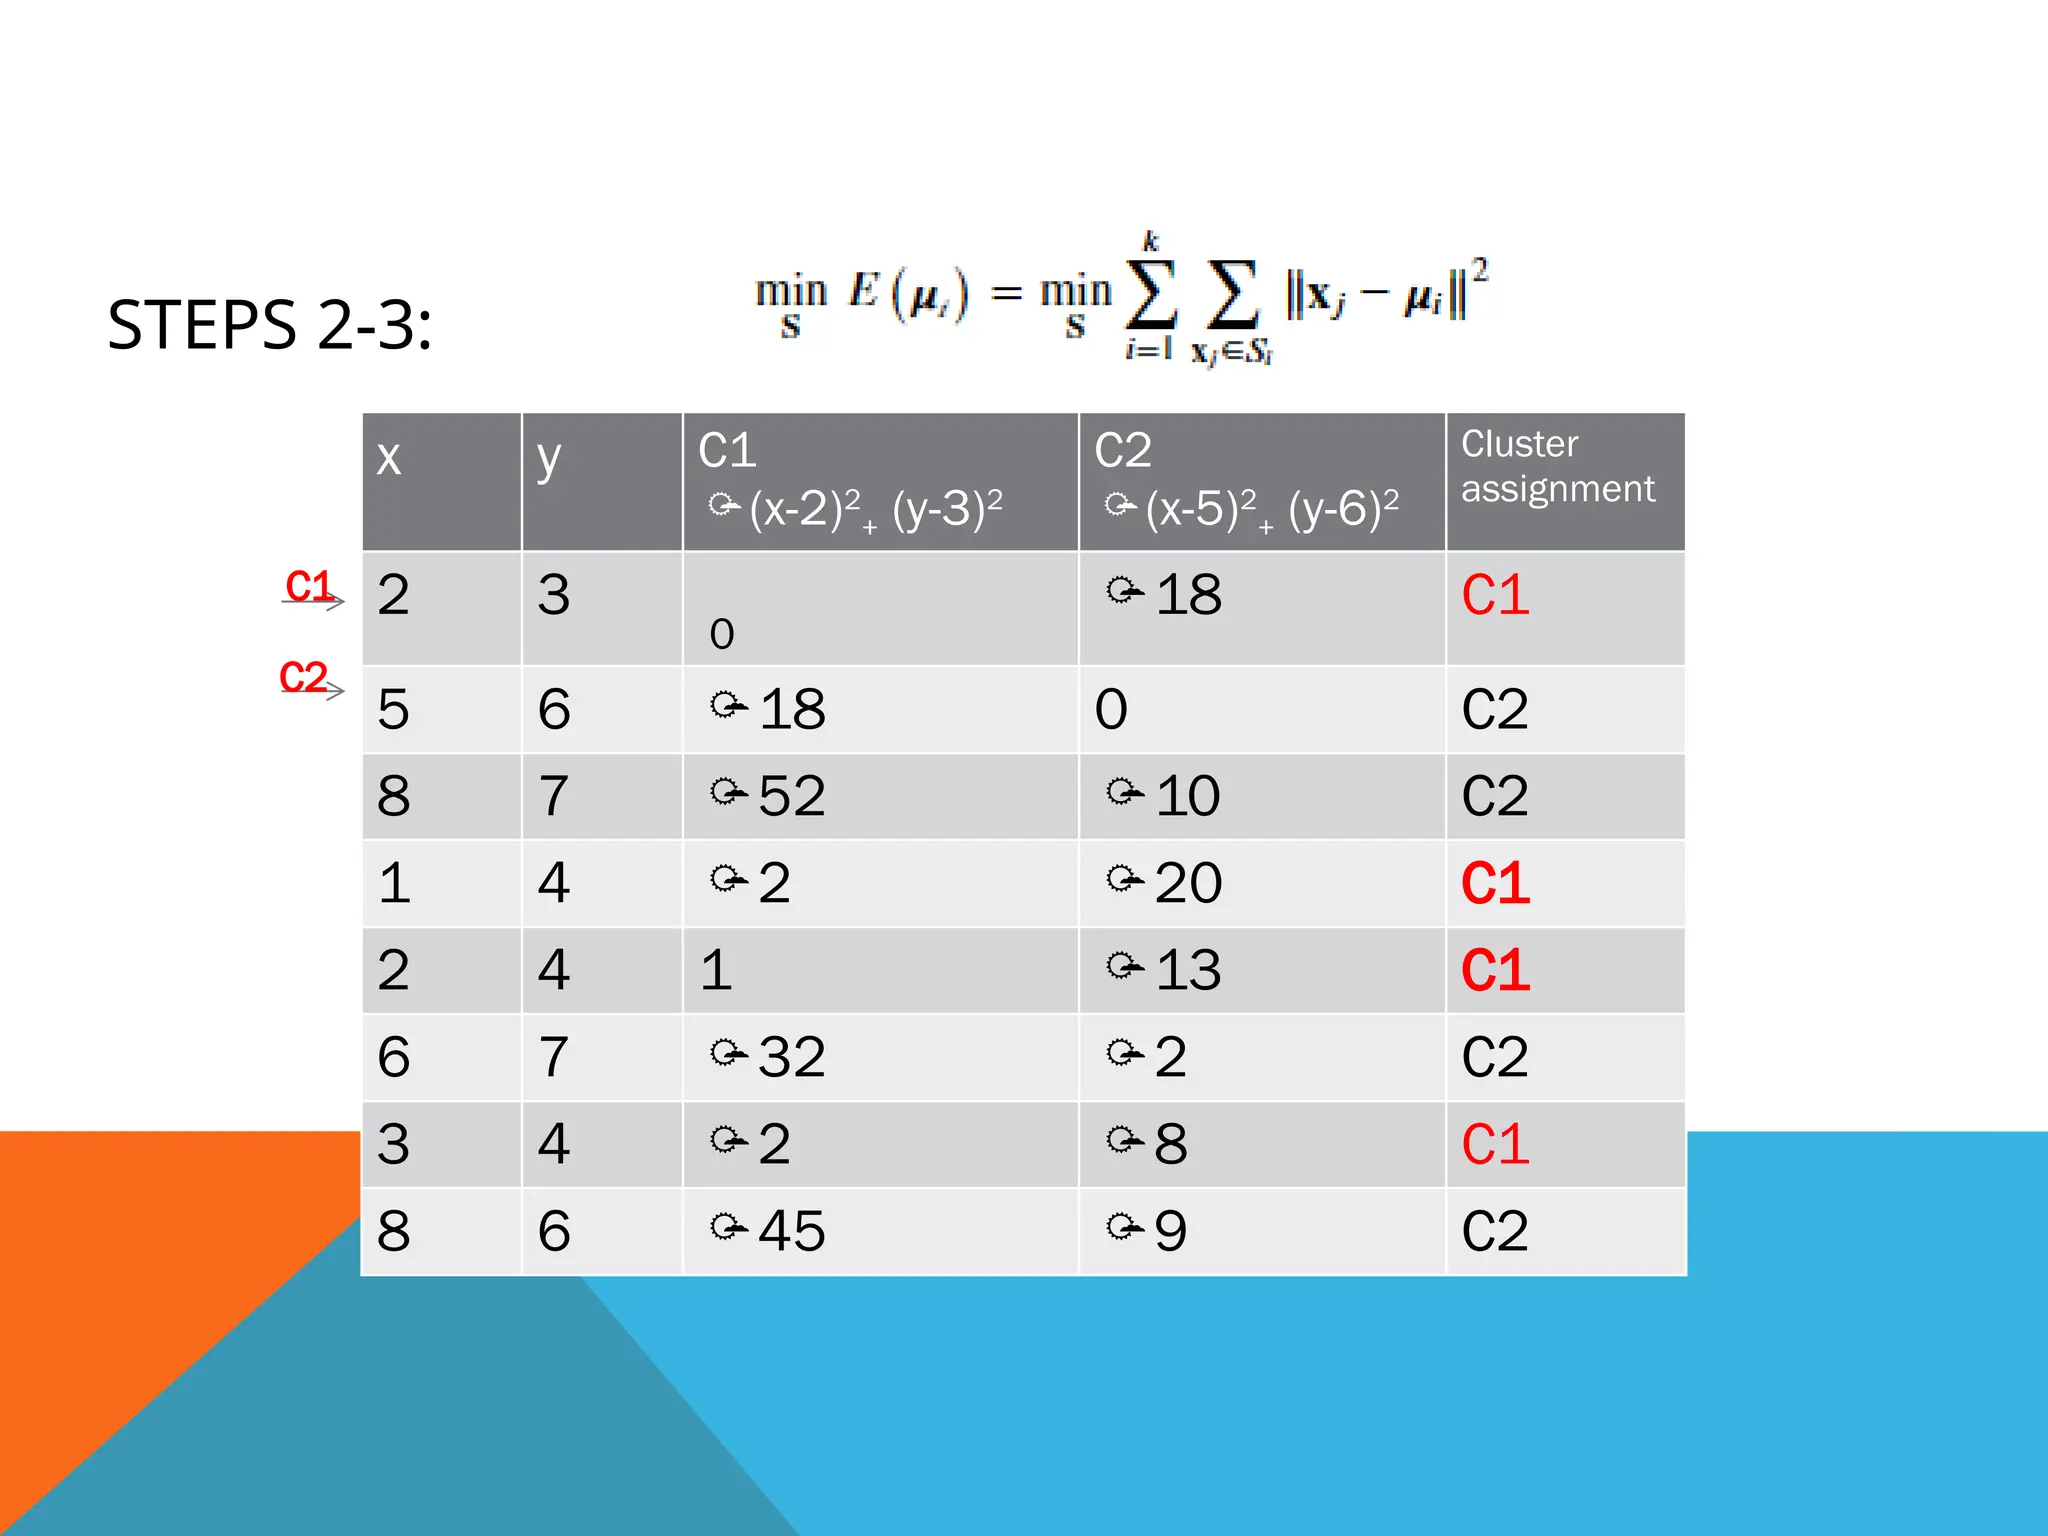
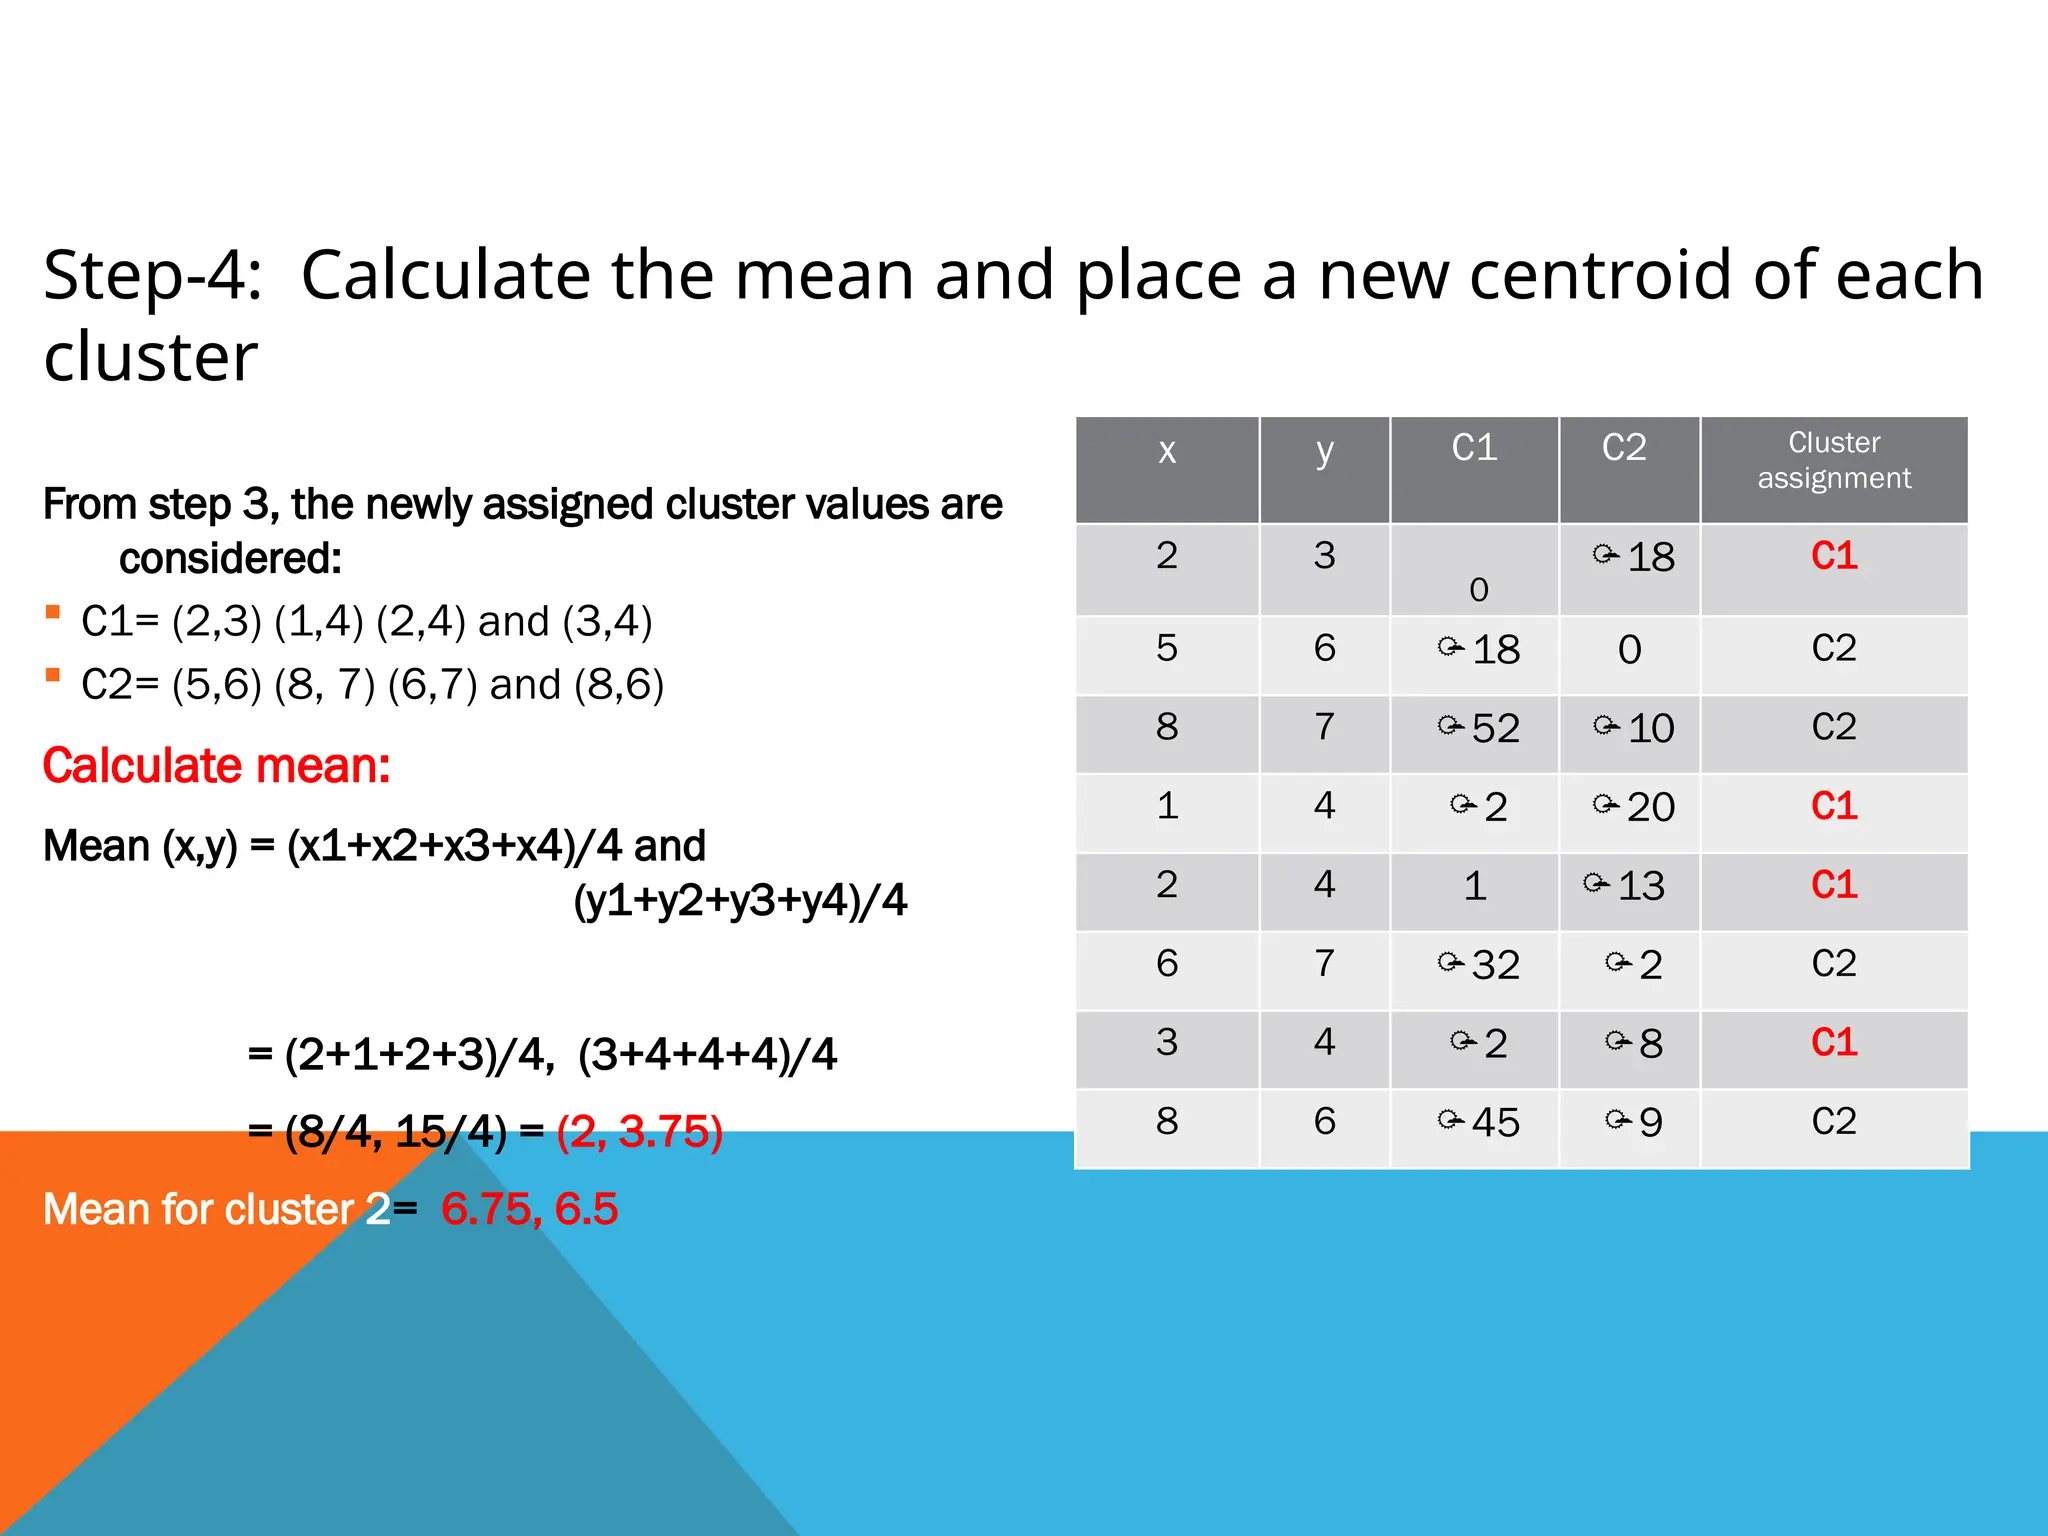
Step-4: Calculate themean and place a new centroid of each
cluster
From step 3, the newly assigned cluster values are
considered:
C1= (2,3) (1,4) (2,4) and (3,4)
C2= (5,6) (8, 7) (6,7) and (8,6)
Calculate mean:
Mean (x,y) = (x1+x2+x3+x4)/4 and
(y1+y2+y3+y4)/4
Mean for cluster 1
= (2+1+2+3)/4, (3+4+4+4)/4
= (8/4, 15/4) = (2, 3.75)
Mean for cluster 2= 6.75, 6.5
x y C1 C2 Cluster
assignment
2 3
0
18 C1
5 6 18 0 C2
8 7 52 10 C2
1 4 2 20 C1
2 4 1 13 C1
6 7 32 2 C2
3 4 2 8 C1
8 6 45 9 C2
32.
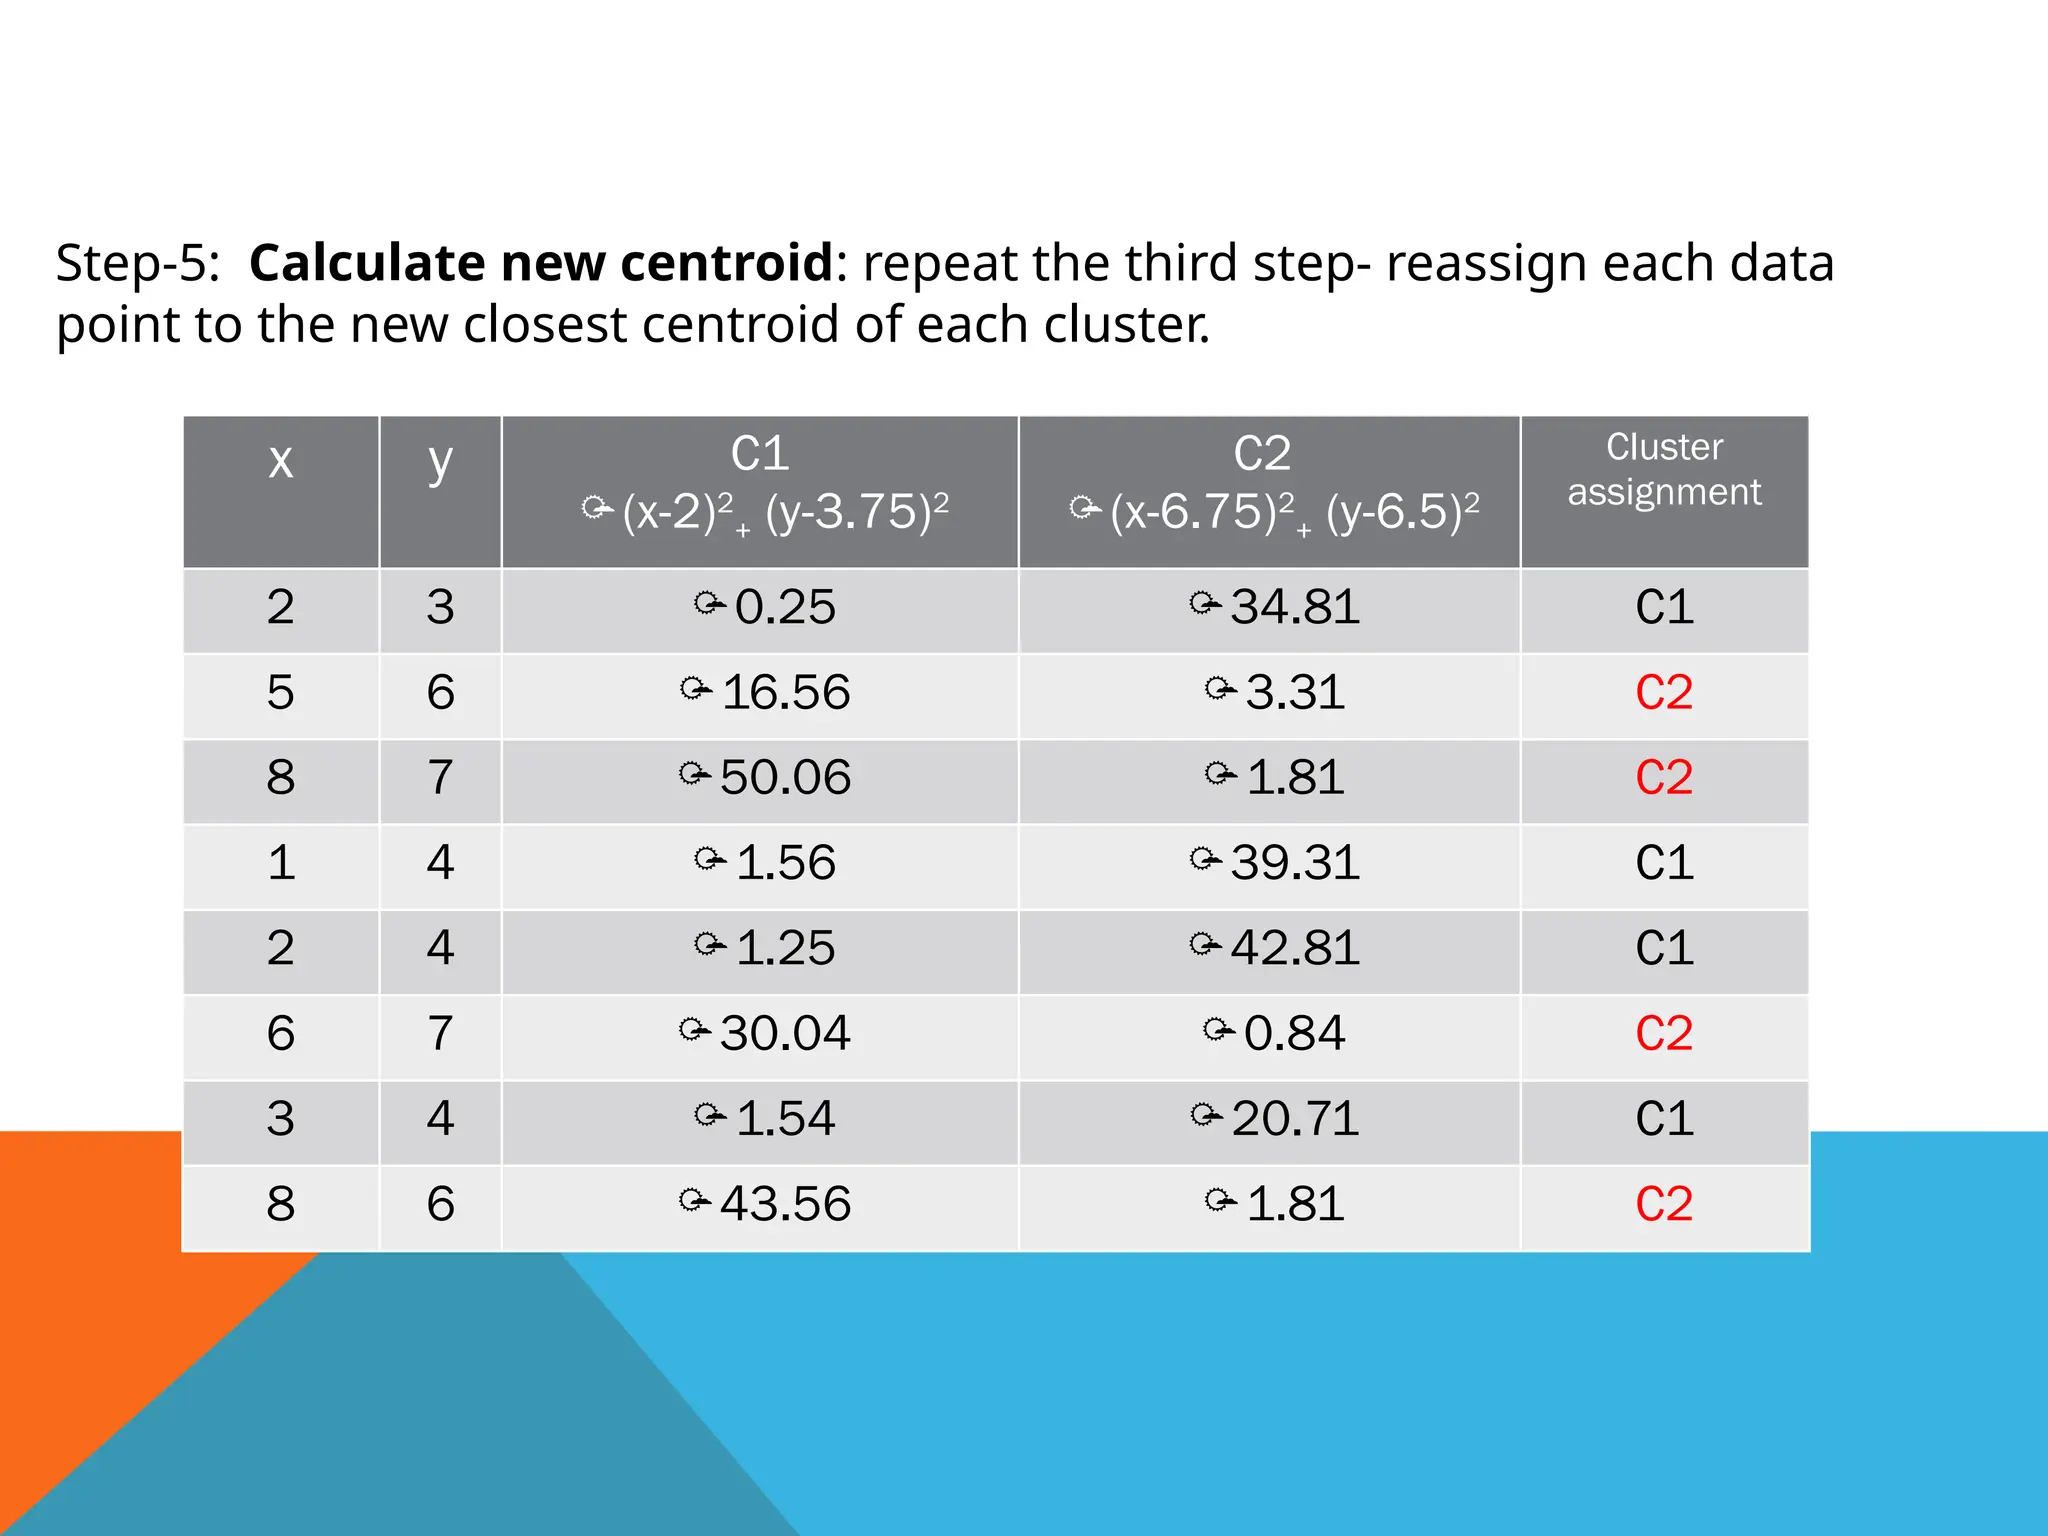
Step-5: Calculate newcentroid: repeat the third step- reassign each data
point to the new closest centroid of each cluster.
x y C1
(x-2)2
+ (y-3.75)2
C2
(x-6.75)2
+ (y-6.5)2
Cluster
assignment
2 3 0.25 34.81 C1
5 6 16.56 3.31 C2
8 7 50.06 1.81 C2
1 4 1.56 39.31 C1
2 4 1.25 42.81 C1
6 7 30.04 0.84 C2
3 4 1.54 20.71 C1
8 6 43.56 1.81 C2
33.
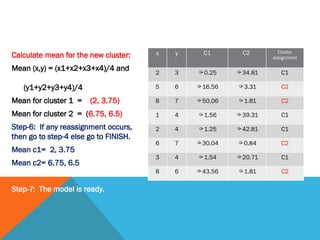
Calculate mean forthe new cluster:
Mean (x,y) = (x1+x2+x3+x4)/4 and
(y1+y2+y3+y4)/4
Mean for cluster 1 = (2, 3.75)
Mean for cluster 2 = (6.75, 6.5)
Step-6: If any reassignment occurs,
then go to step-4 else go to FINISH.
Mean c1= 2, 3.75
Mean c2= 6.75, 6.5
Step-7: The model is ready.
x y C1 C2 Cluster
assignment
2 3 0.25 34.81 C1
5 6 16.56 3.31 C2
8 7 50.06 1.81 C2
1 4 1.56 39.31 C1
2 4 1.25 42.81 C1
6 7 30.04 0.84 C2
3 4 1.54 20.71 C1
8 6 43.56 1.81 C2
34.
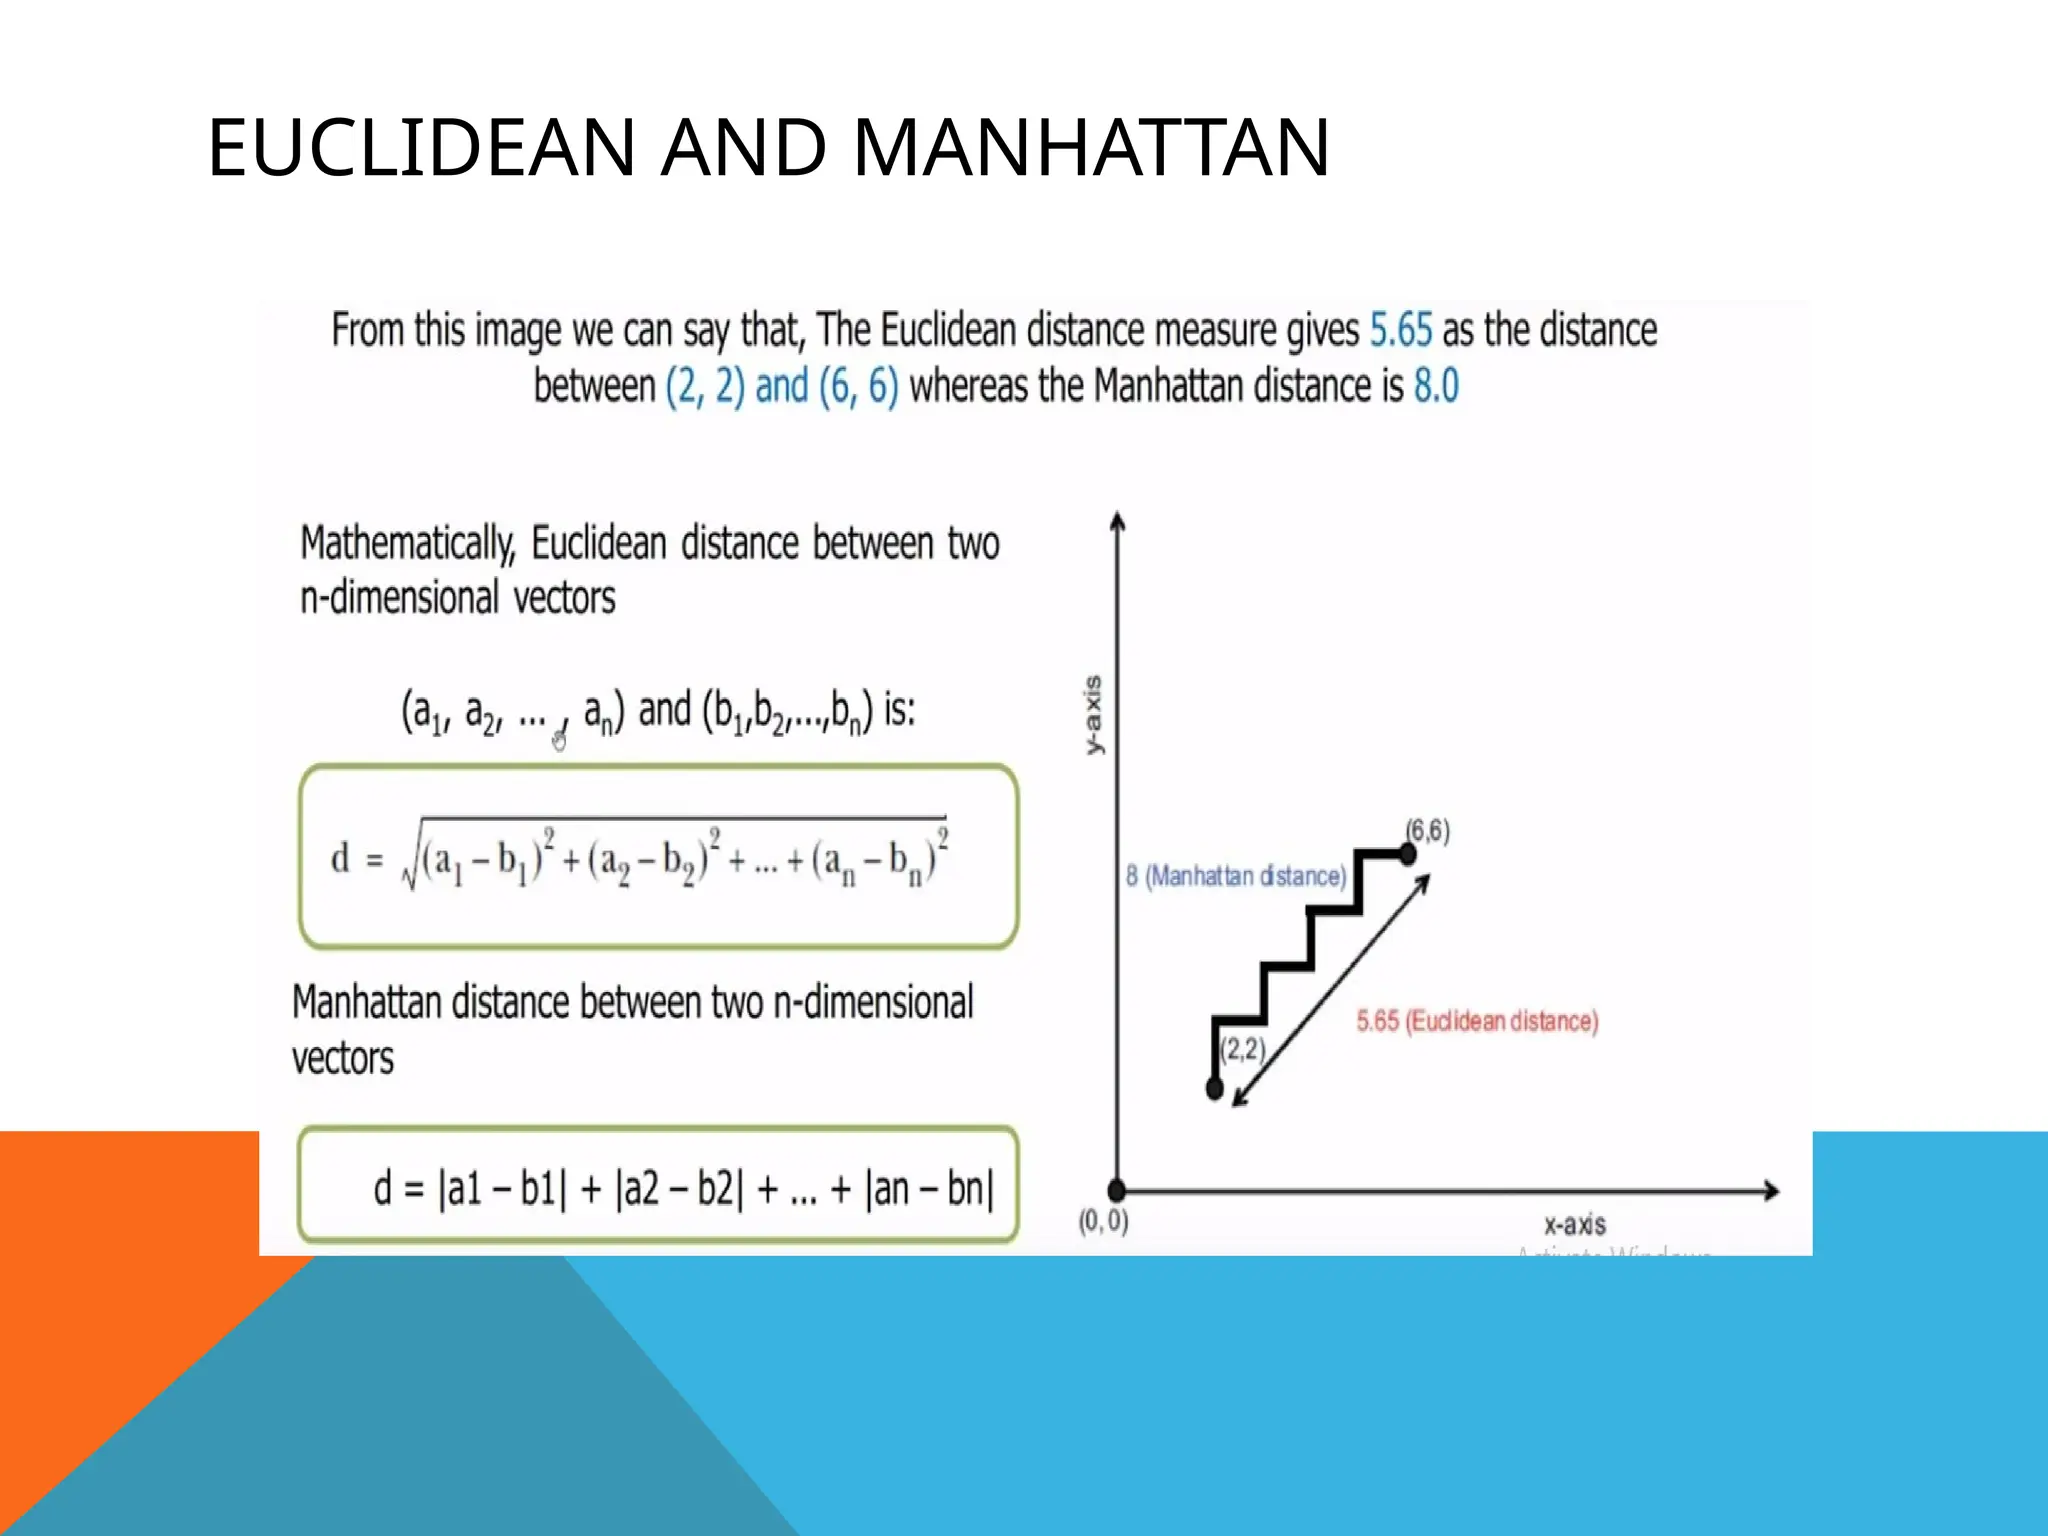
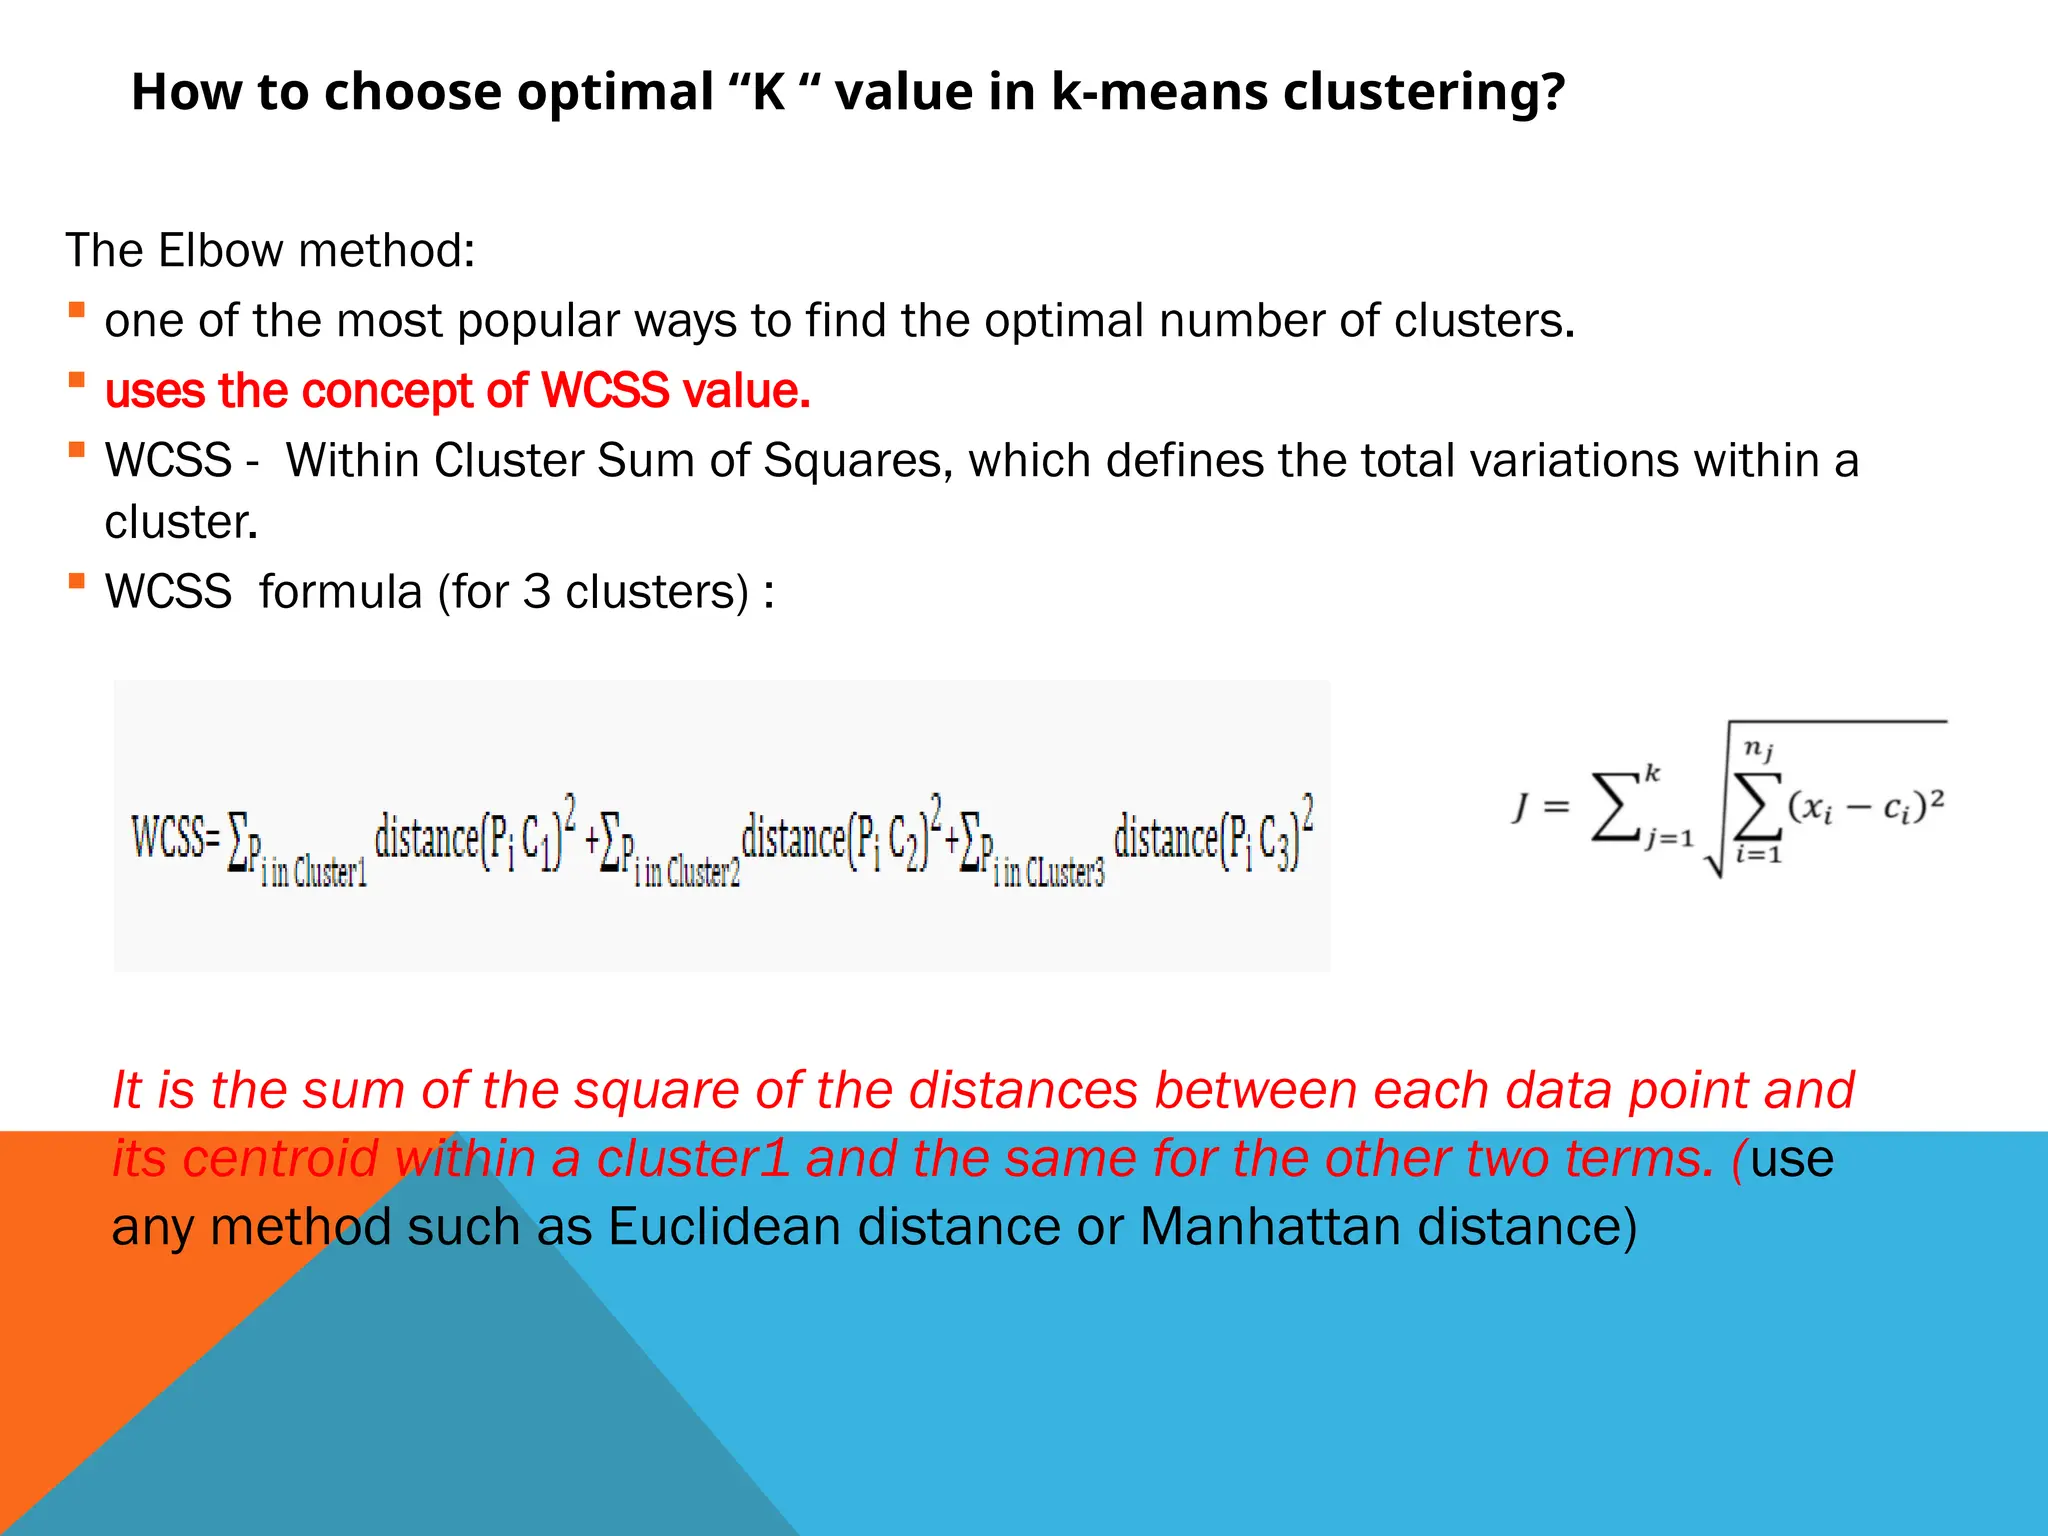
How to chooseoptimal “K “ value in k-means clustering?
The Elbow method:
one of the most popular ways to find the optimal number of clusters.
uses the concept of WCSS value.
WCSS - Within Cluster Sum of Squares, which defines the total variations within a
cluster.
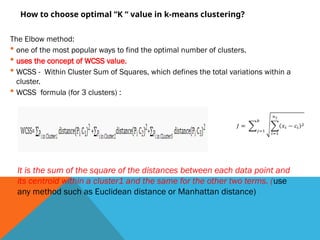
WCSS formula (for 3 clusters) :
It is the sum of the square of the distances between each data point and
its centroid within a cluster1 and the same for the other two terms. (use
any method such as Euclidean distance or Manhattan distance)
35.
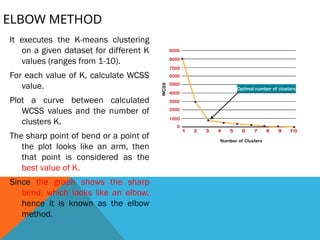
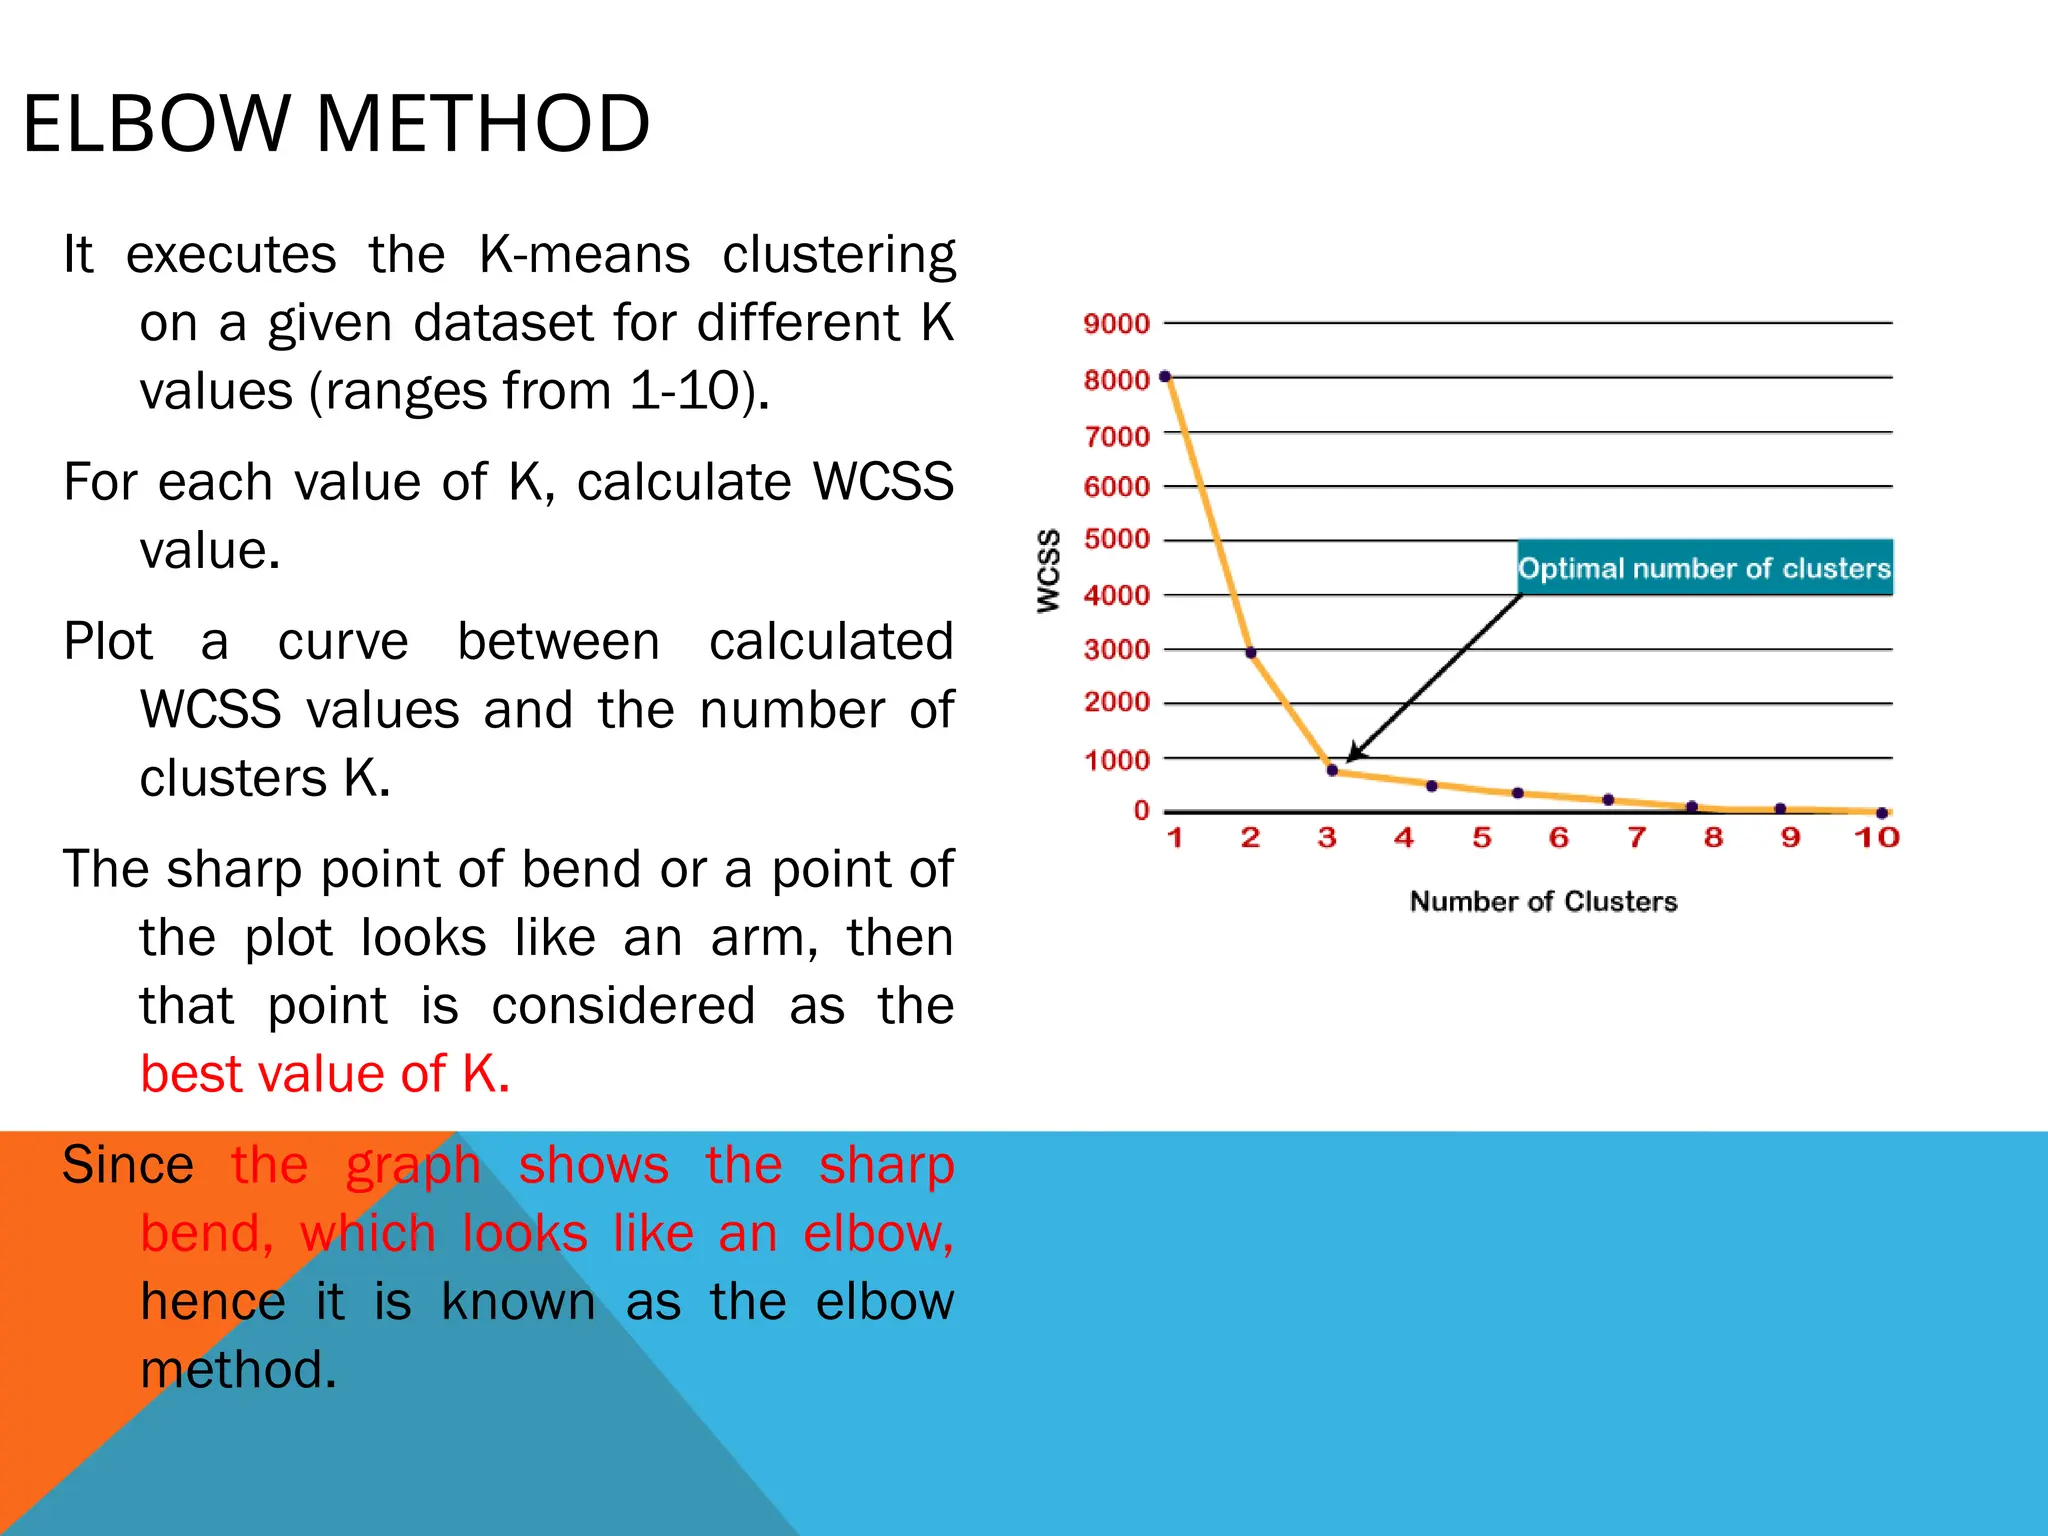
ELBOW METHOD
It executesthe K-means clustering
on a given dataset for different K
values (ranges from 1-10).
For each value of K, calculate WCSS
value.
Plot a curve between calculated
WCSS values and the number of
clusters K.
The sharp point of bend or a point of
the plot looks like an arm, then
that point is considered as the
best value of K.
Since the graph shows the sharp
bend, which looks like an elbow,
hence it is known as the elbow
method.