Linear Regression | Machine Learning | Data Science
Linear regression is a statistical method for modeling relationships between variables. Simple linear regression involves one independent variable predicting one dependent variable based on a linear equation. Multiple linear regression expands this to model relationships between multiple independent variables and one dependent variable. Linear regression finds the line of best fit that minimizes error to describe these relationships based on assumptions of homoscedasticity, independence of observations, normality, and linearity.
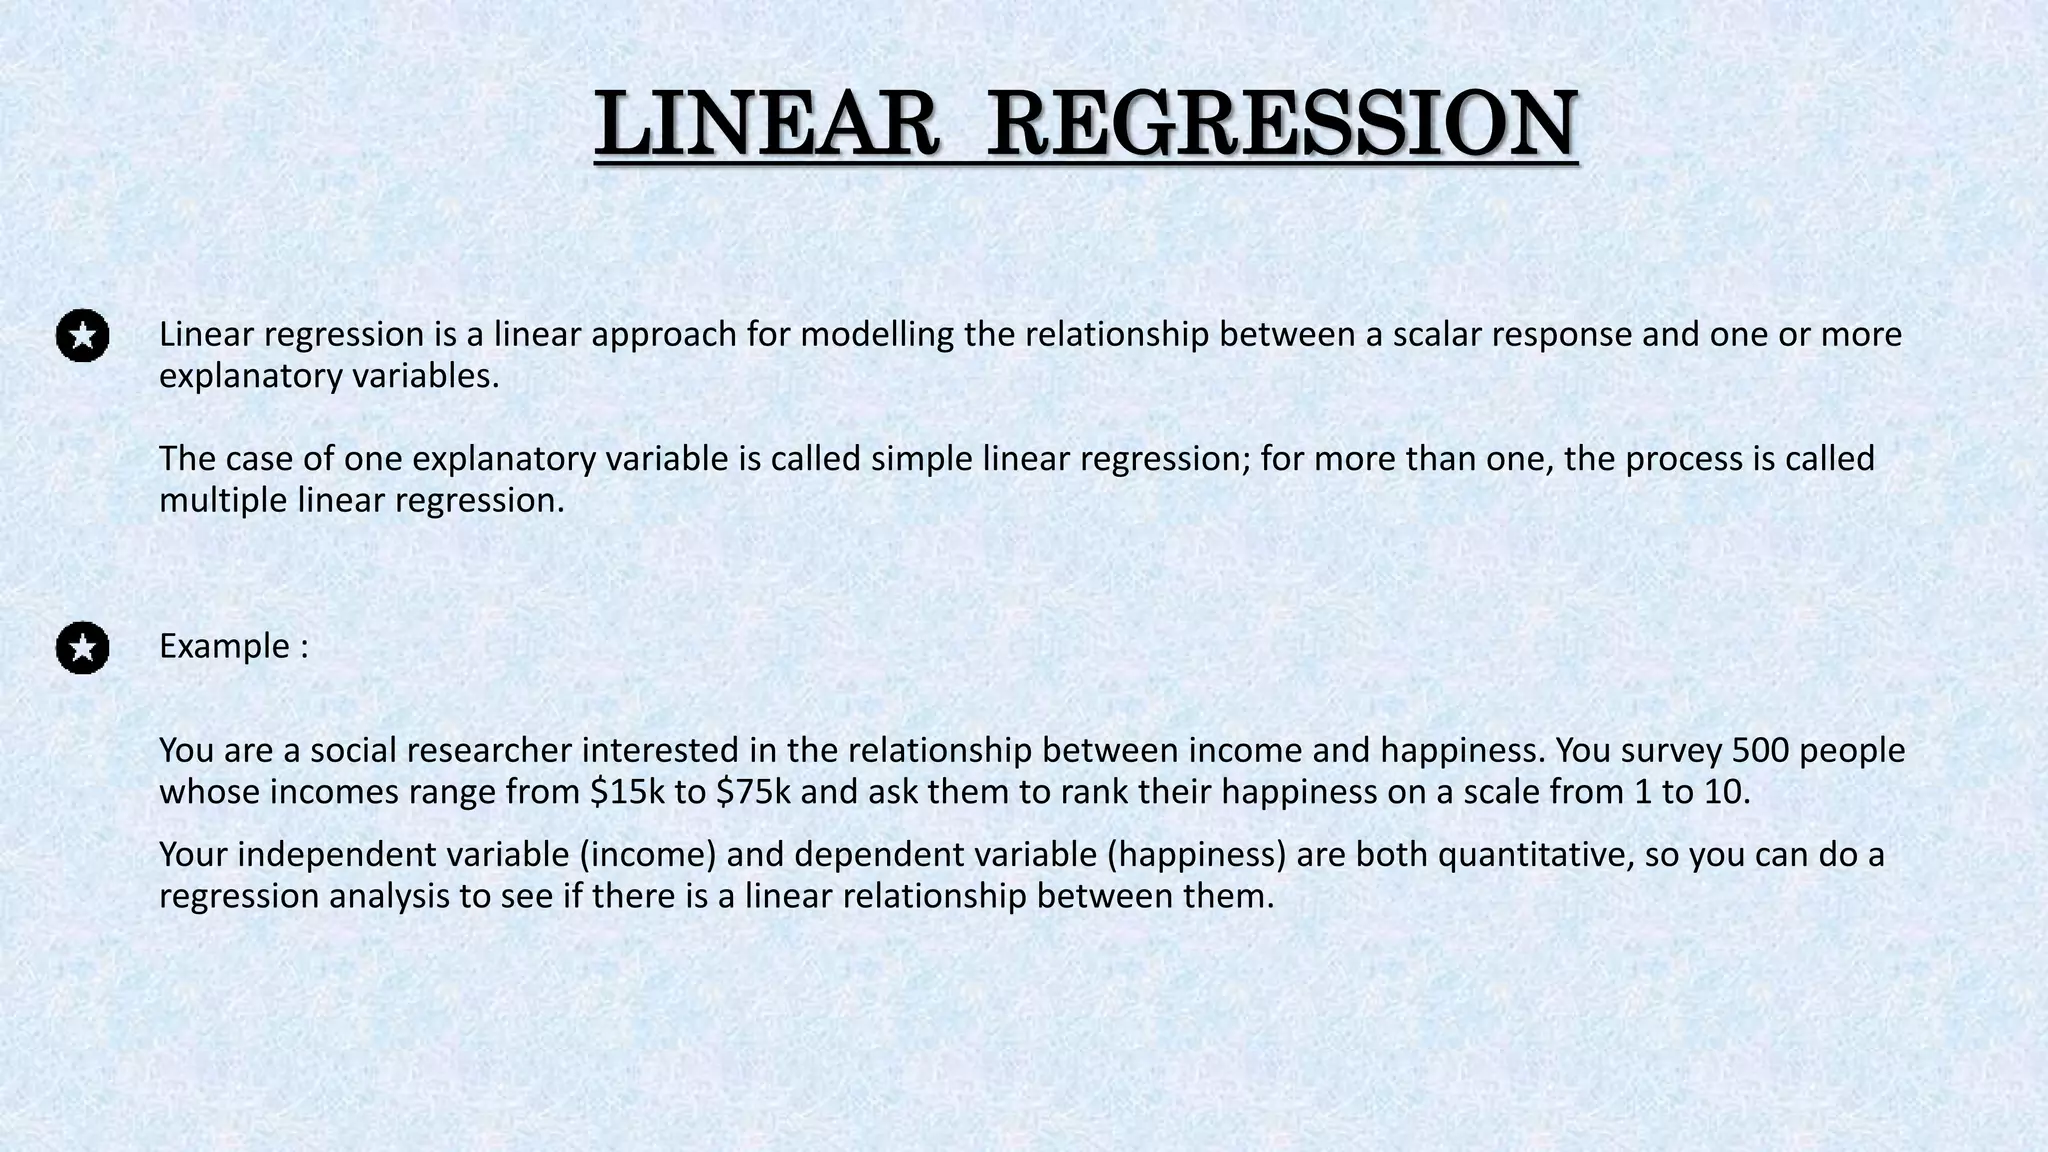
LINEAR REGRESSION
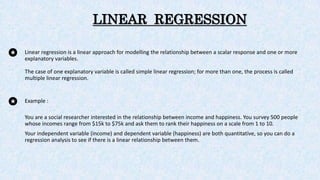
Linear regressionis a linear approach for modelling the relationship between a scalar response and one or more
explanatory variables.
The case of one explanatory variable is called simple linear regression; for more than one, the process is called
multiple linear regression.
Example :
You are a social researcher interested in the relationship between income and happiness. You survey 500 people
whose incomes range from $15k to $75k and ask them to rank their happiness on a scale from 1 to 10.
Your independent variable (income) and dependent variable (happiness) are both quantitative, so you can do a
regression analysis to see if there is a linear relationship between them.
3.
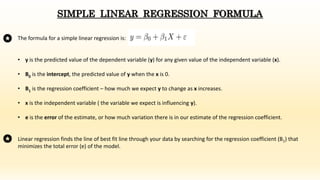
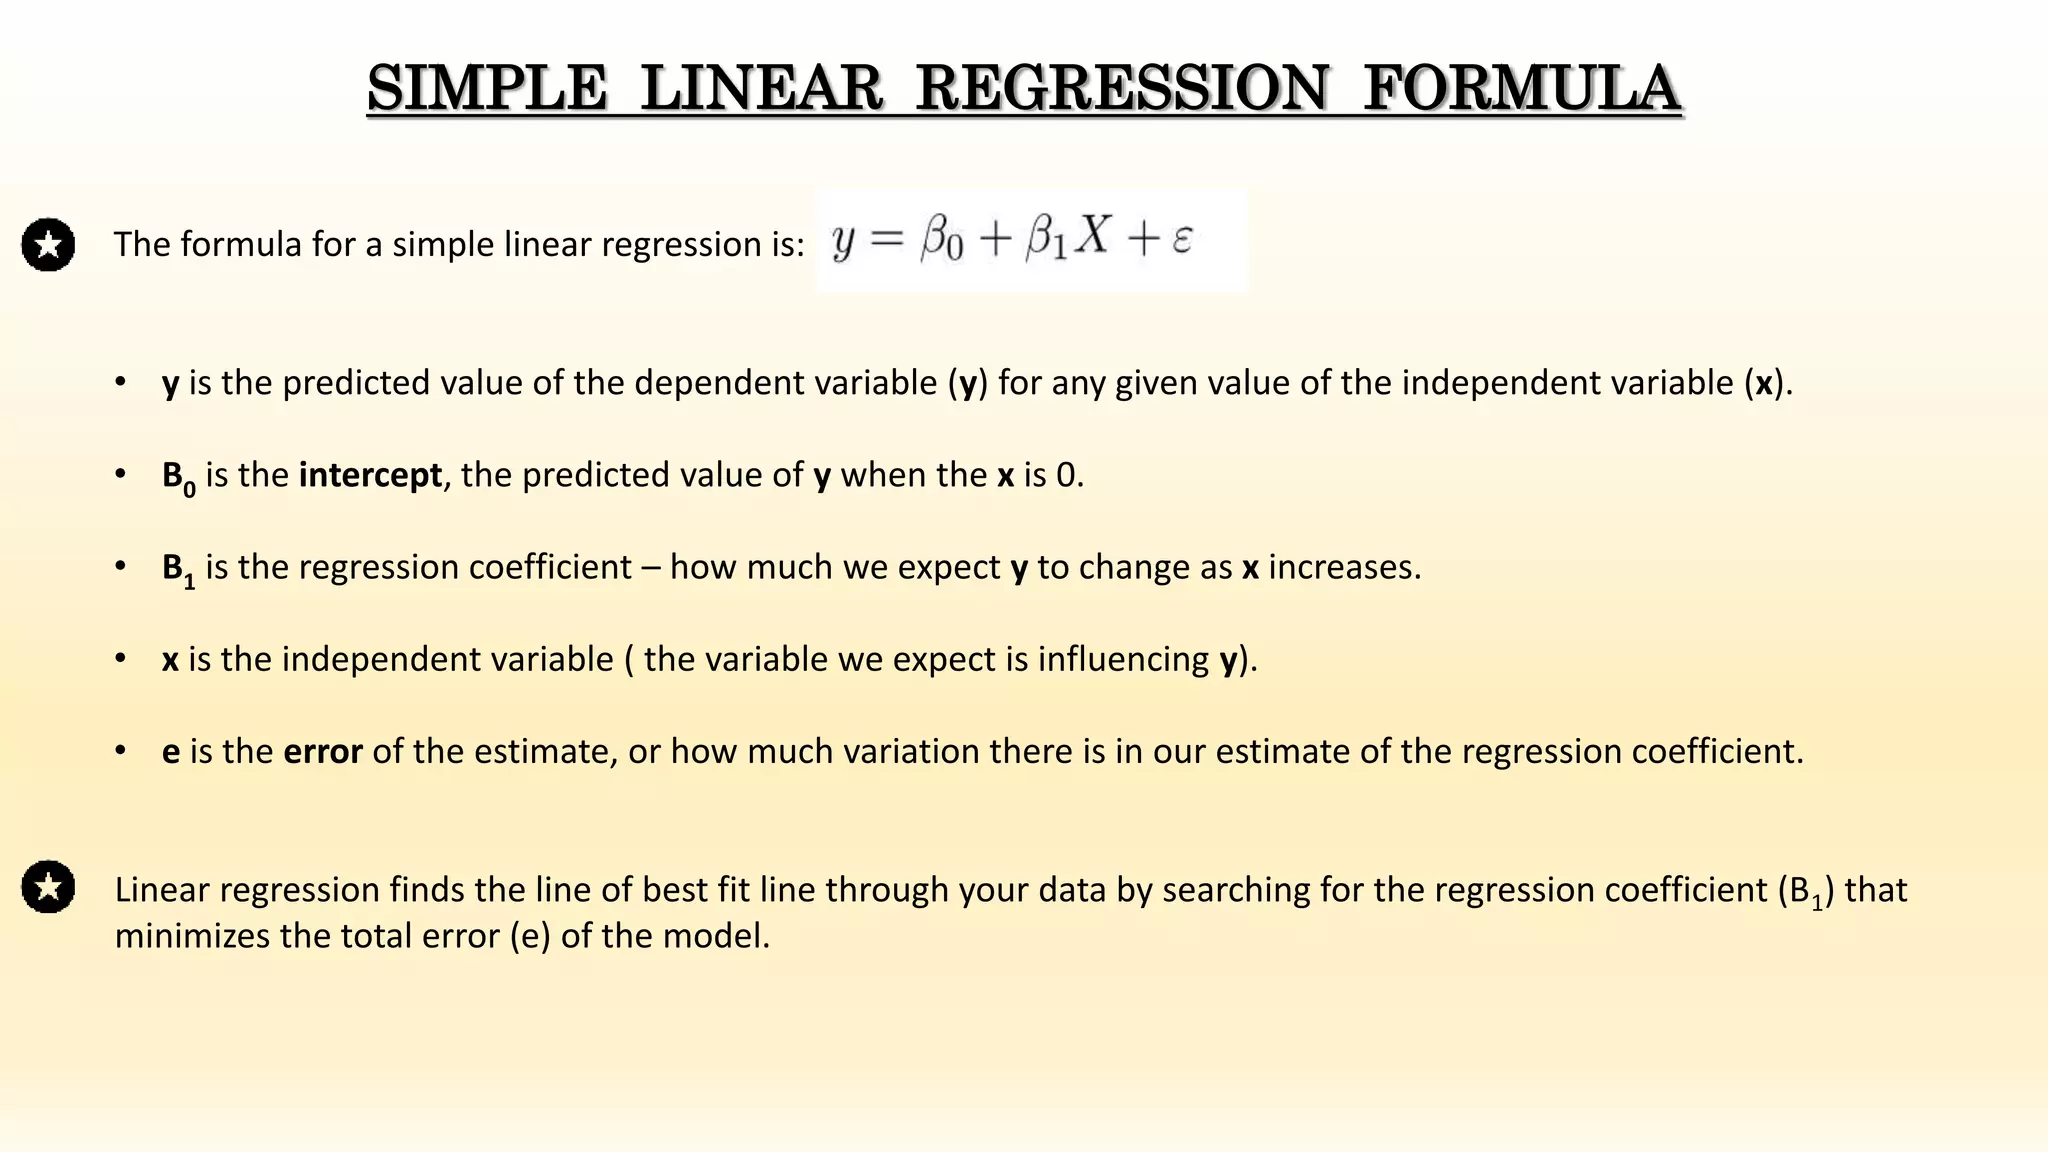
The formula fora simple linear regression is:
• y is the predicted value of the dependent variable (y) for any given value of the independent variable (x).
• B0 is the intercept, the predicted value of y when the x is 0.
• B1 is the regression coefficient – how much we expect y to change as x increases.
• x is the independent variable ( the variable we expect is influencing y).
• e is the error of the estimate, or how much variation there is in our estimate of the regression coefficient.
SIMPLE LINEAR REGRESSION FORMULA
Linear regression finds the line of best fit line through your data by searching for the regression coefficient (B1) that
minimizes the total error (e) of the model.
4.
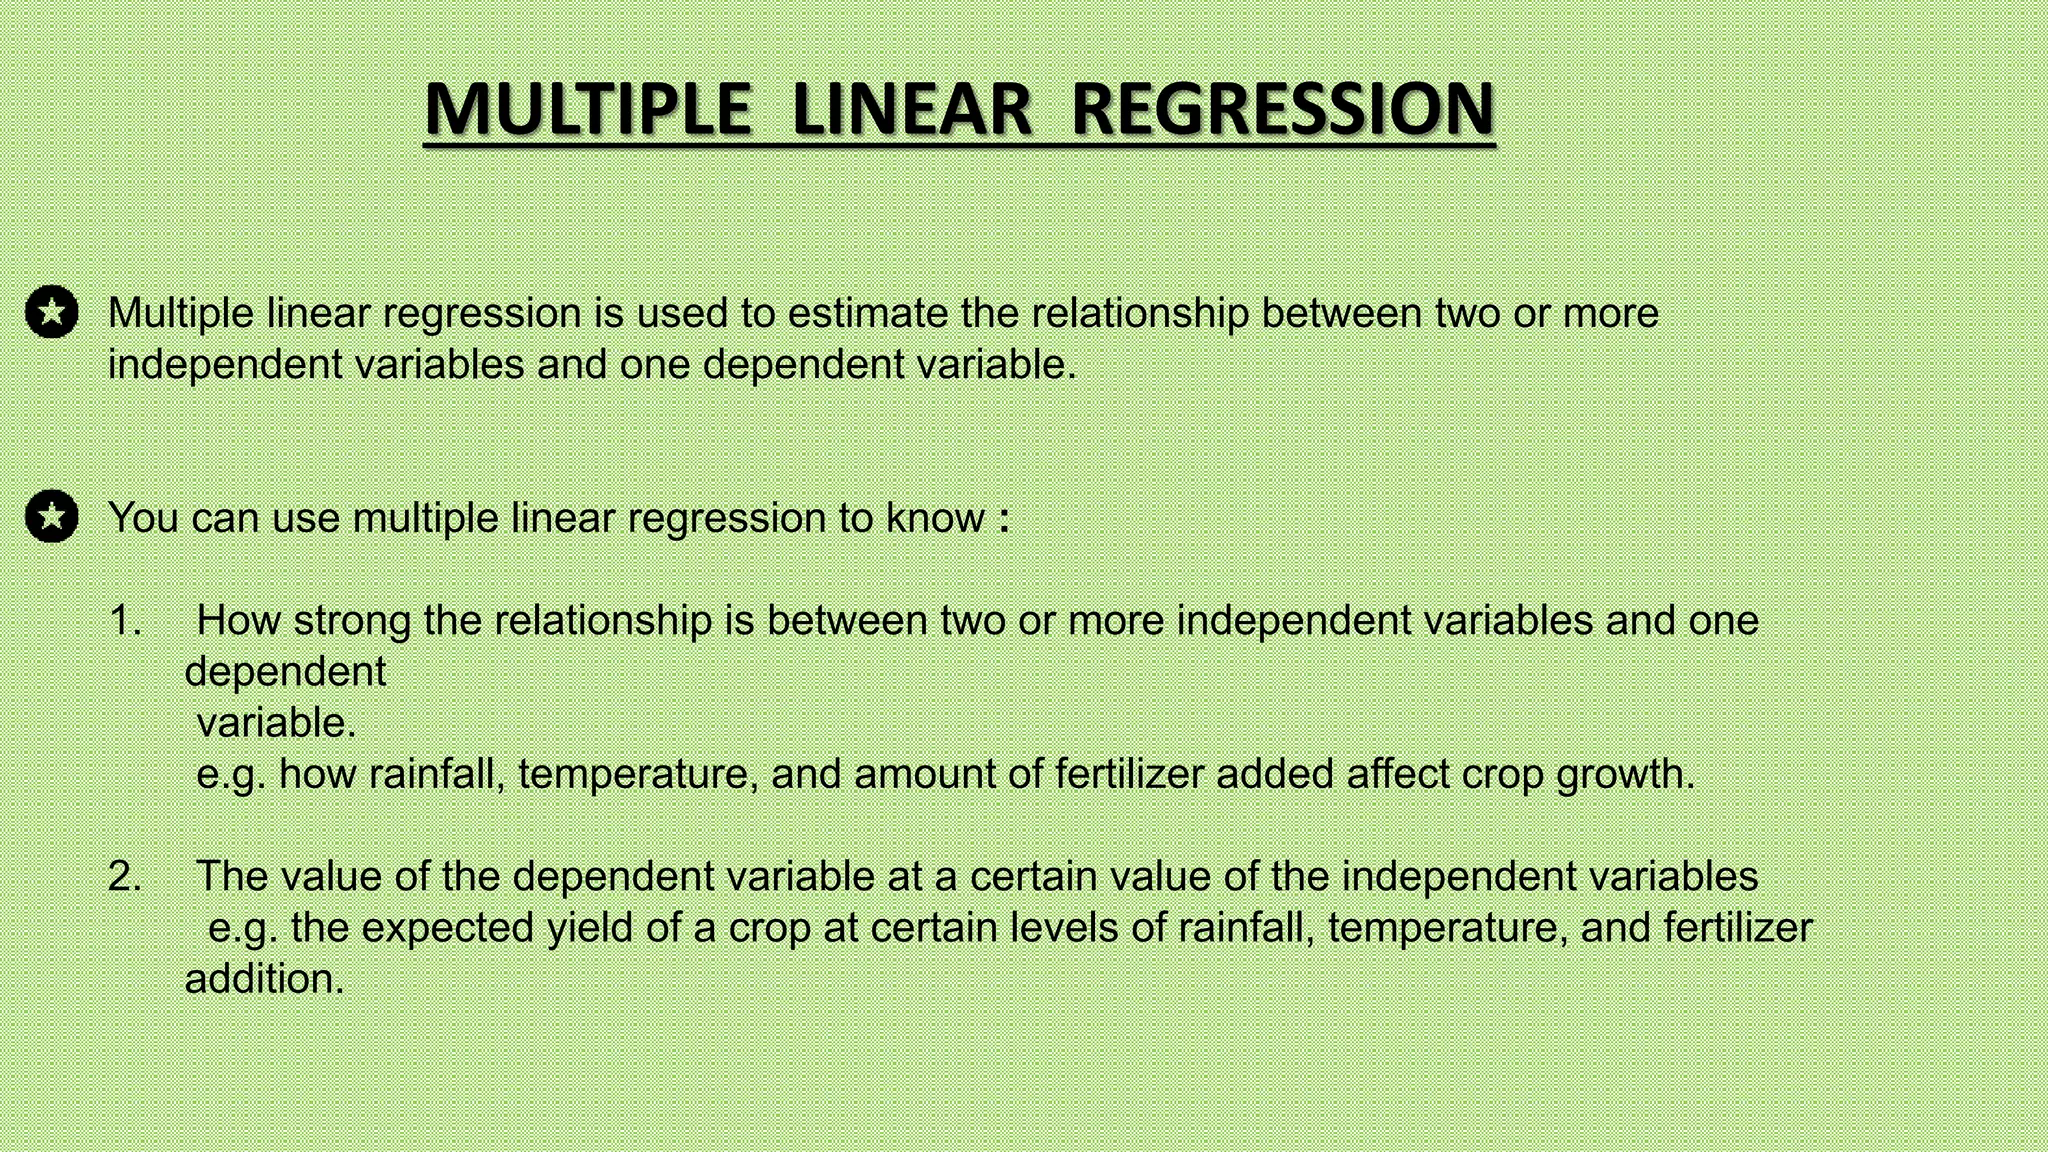
Multiple linear regressionis used to estimate the relationship between two or more
independent variables and one dependent variable.
You can use multiple linear regression to know :
1. How strong the relationship is between two or more independent variables and one
dependent
variable.
e.g. how rainfall, temperature, and amount of fertilizer added affect crop growth.
2. The value of the dependent variable at a certain value of the independent variables
e.g. the expected yield of a crop at certain levels of rainfall, temperature, and fertilizer
addition.
MULTIPLE LINEAR REGRESSION
5.
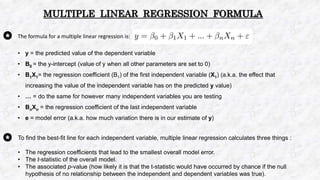
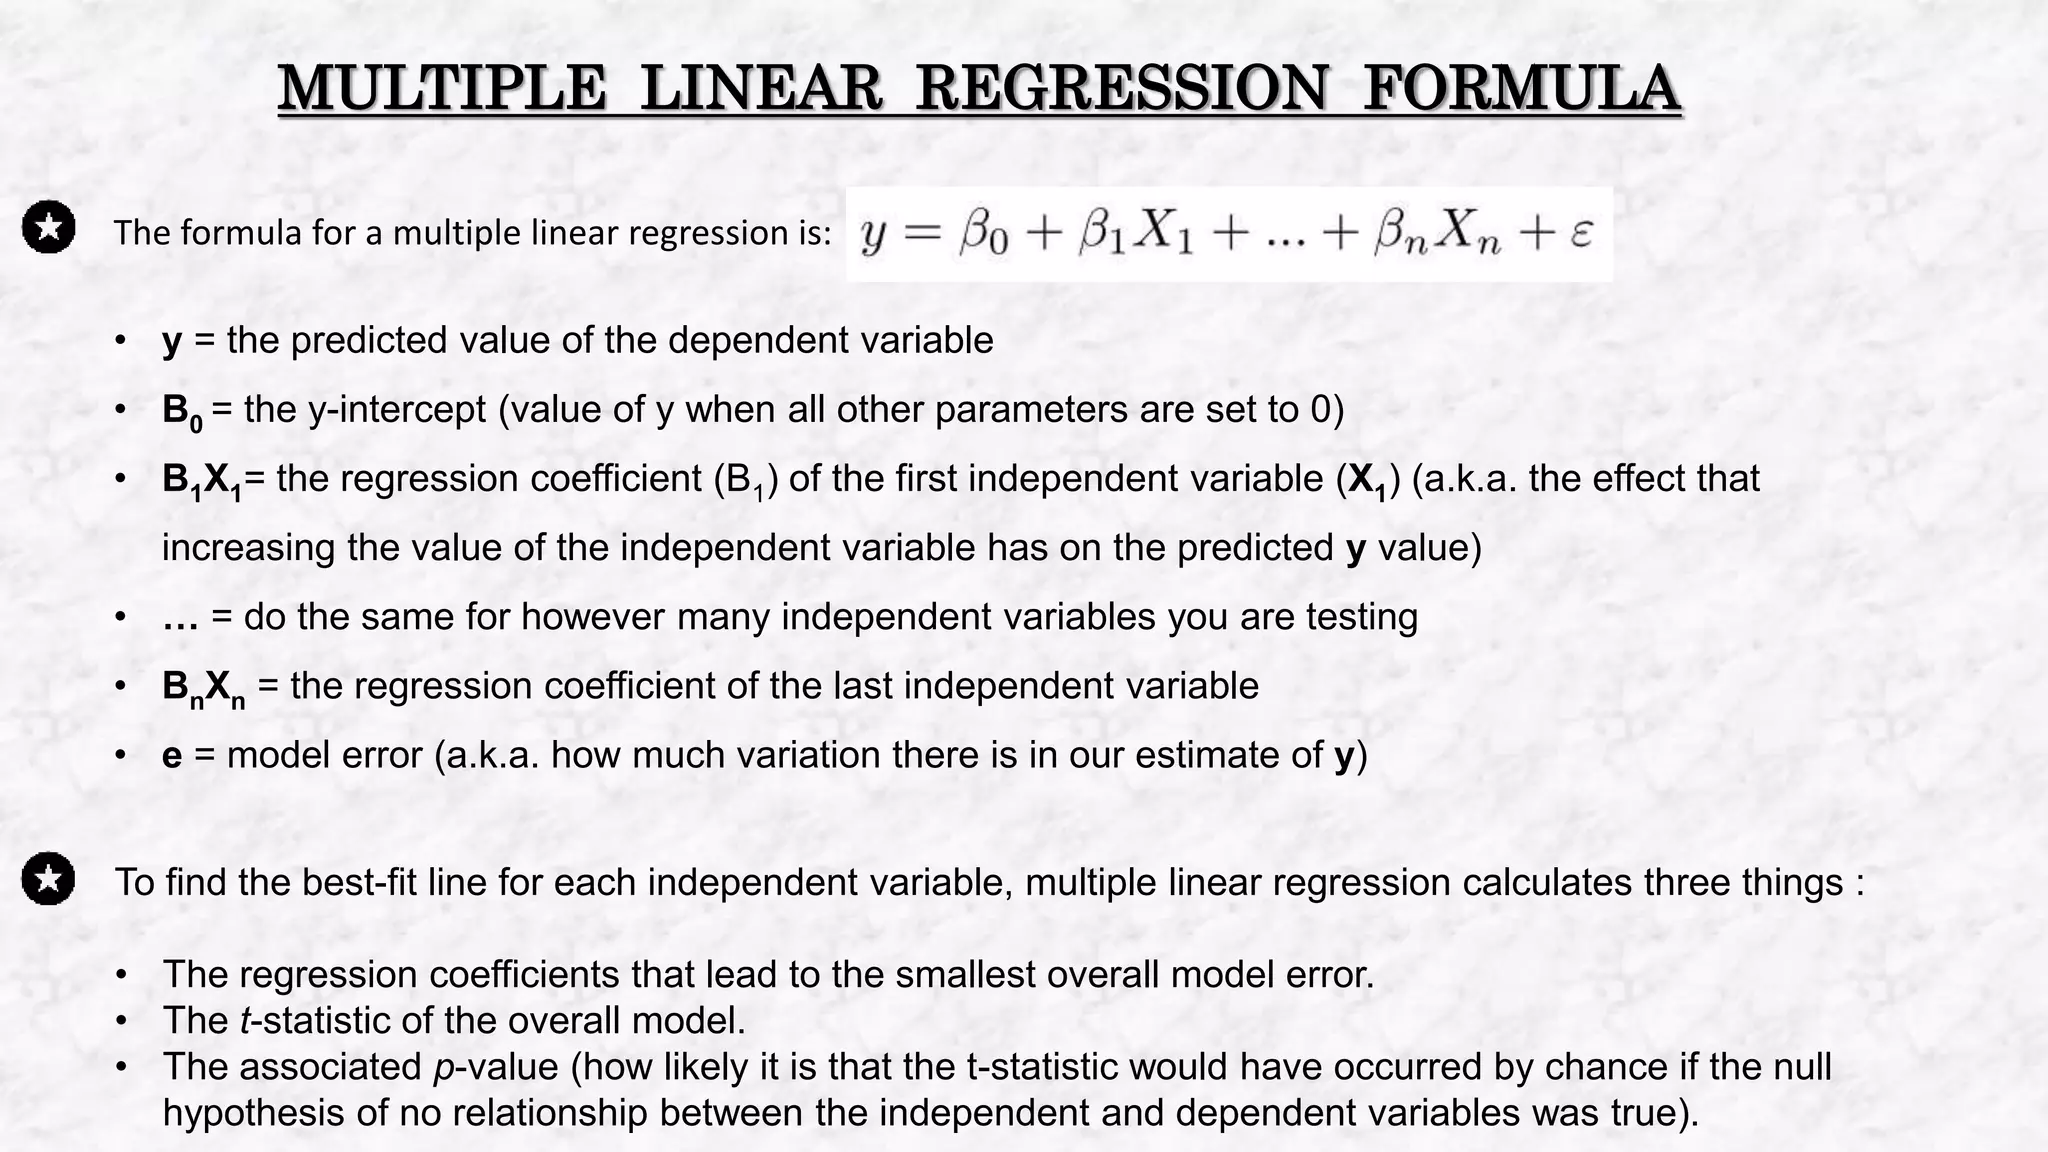
The formula fora multiple linear regression is:
• y = the predicted value of the dependent variable
• B0 = the y-intercept (value of y when all other parameters are set to 0)
• B1X1= the regression coefficient (B1) of the first independent variable (X1) (a.k.a. the effect that
increasing the value of the independent variable has on the predicted y value)
• … = do the same for however many independent variables you are testing
• BnXn = the regression coefficient of the last independent variable
• e = model error (a.k.a. how much variation there is in our estimate of y)
MULTIPLE LINEAR REGRESSION FORMULA
To find the best-fit line for each independent variable, multiple linear regression calculates three things :
• The regression coefficients that lead to the smallest overall model error.
• The t-statistic of the overall model.
• The associated p-value (how likely it is that the t-statistic would have occurred by chance if the null
hypothesis of no relationship between the independent and dependent variables was true).
6.
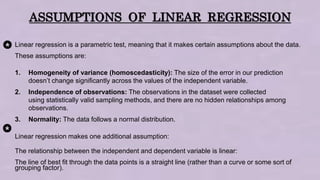
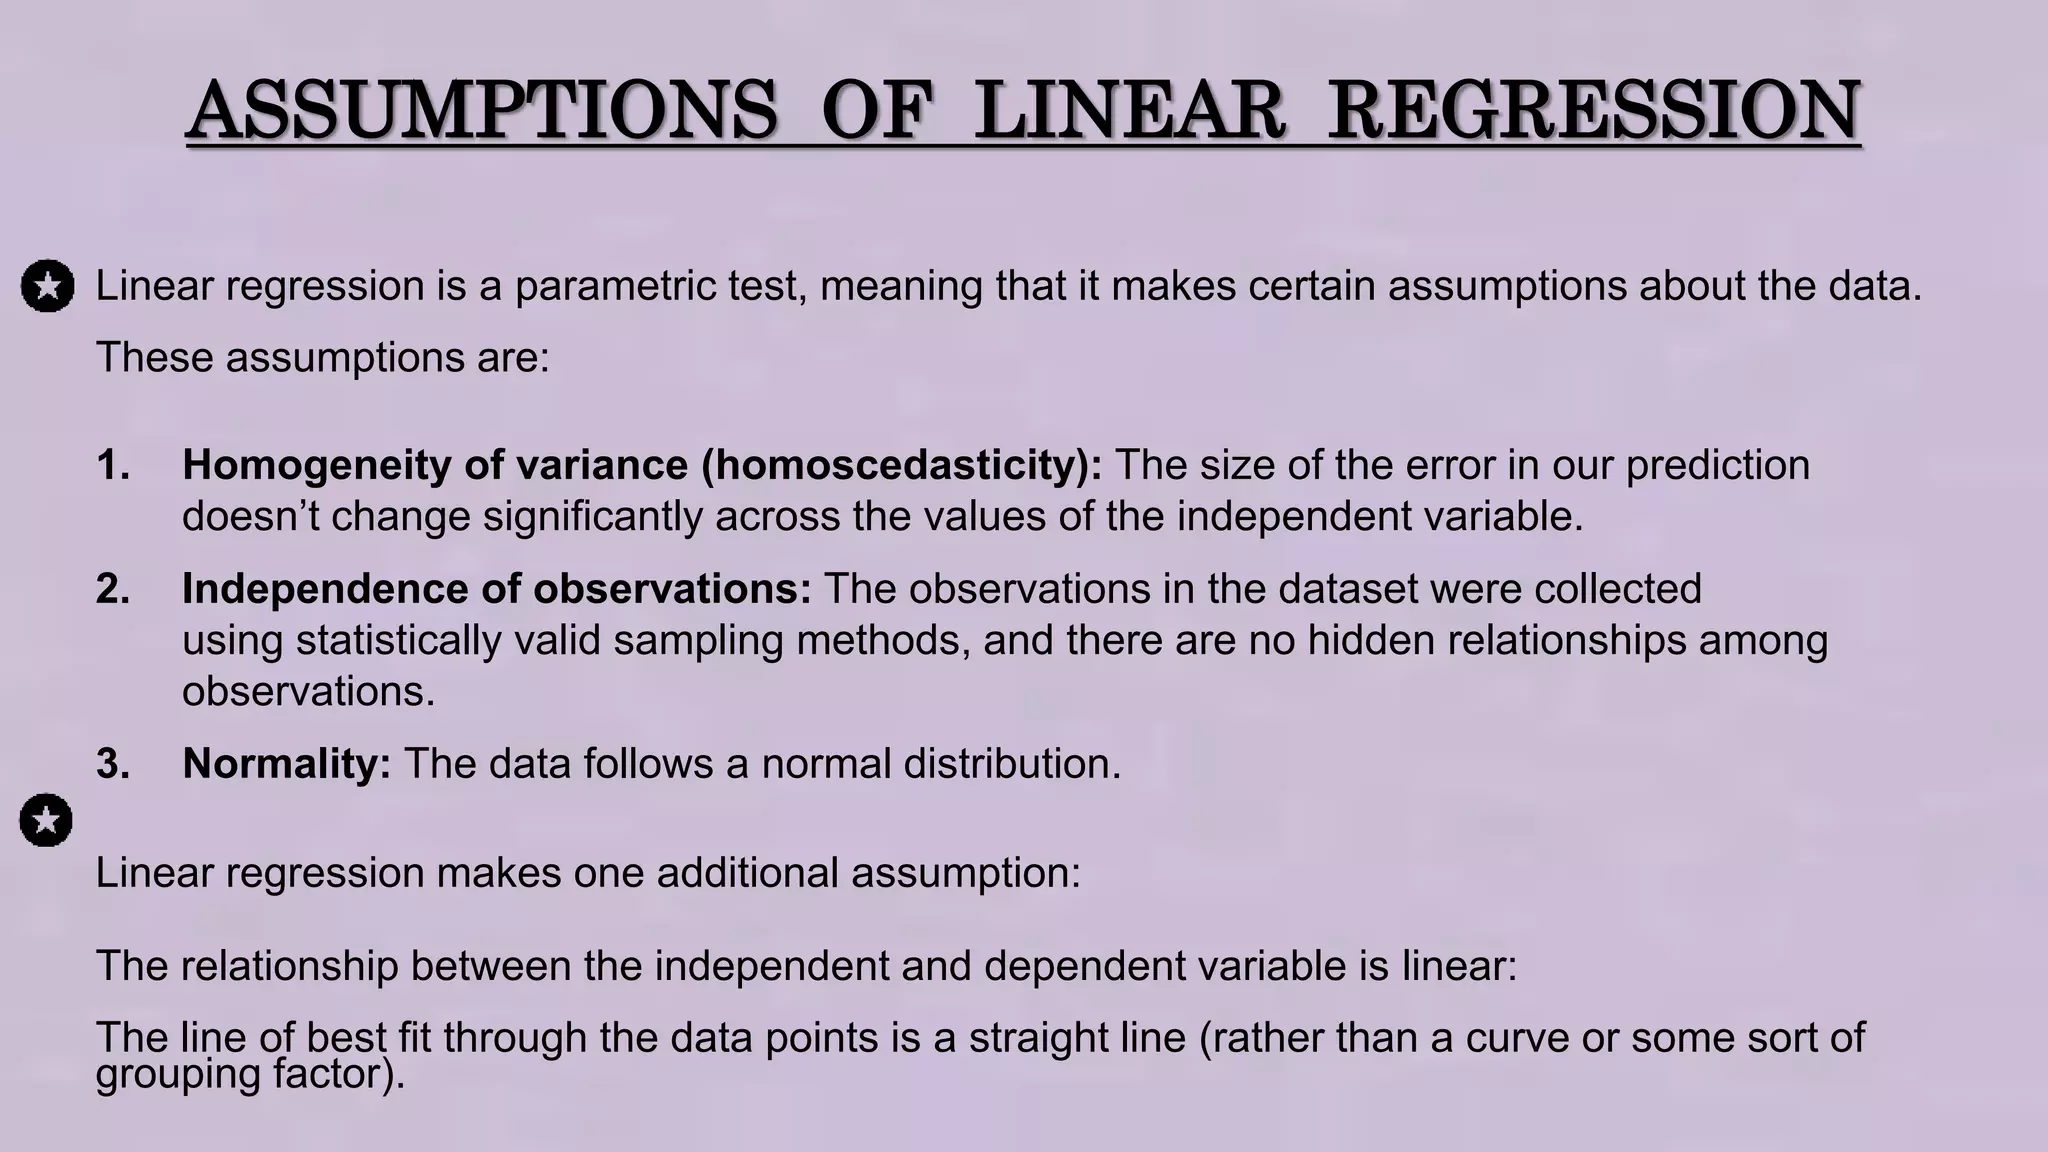
ASSUMPTIONS OF LINEARREGRESSION
Linear regression is a parametric test, meaning that it makes certain assumptions about the data.
These assumptions are:
1. Homogeneity of variance (homoscedasticity): The size of the error in our prediction
doesn’t change significantly across the values of the independent variable.
2. Independence of observations: The observations in the dataset were collected
using statistically valid sampling methods, and there are no hidden relationships among
observations.
3. Normality: The data follows a normal distribution.
Linear regression makes one additional assumption:
The relationship between the independent and dependent variable is linear:
The line of best fit through the data points is a straight line (rather than a curve or some sort of
grouping factor).