

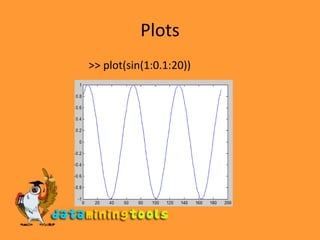
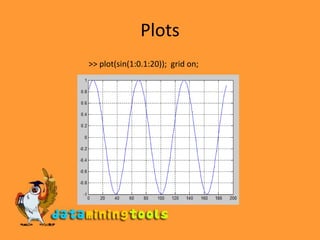

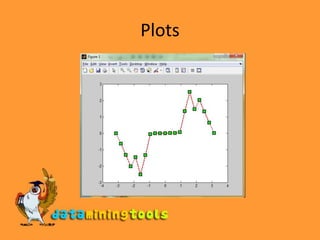
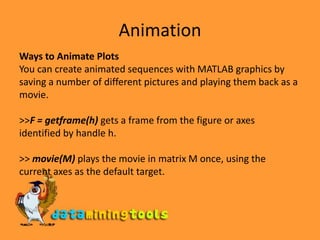
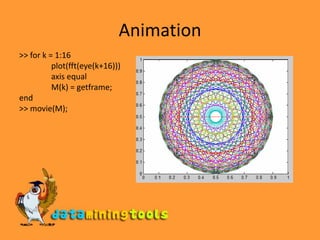


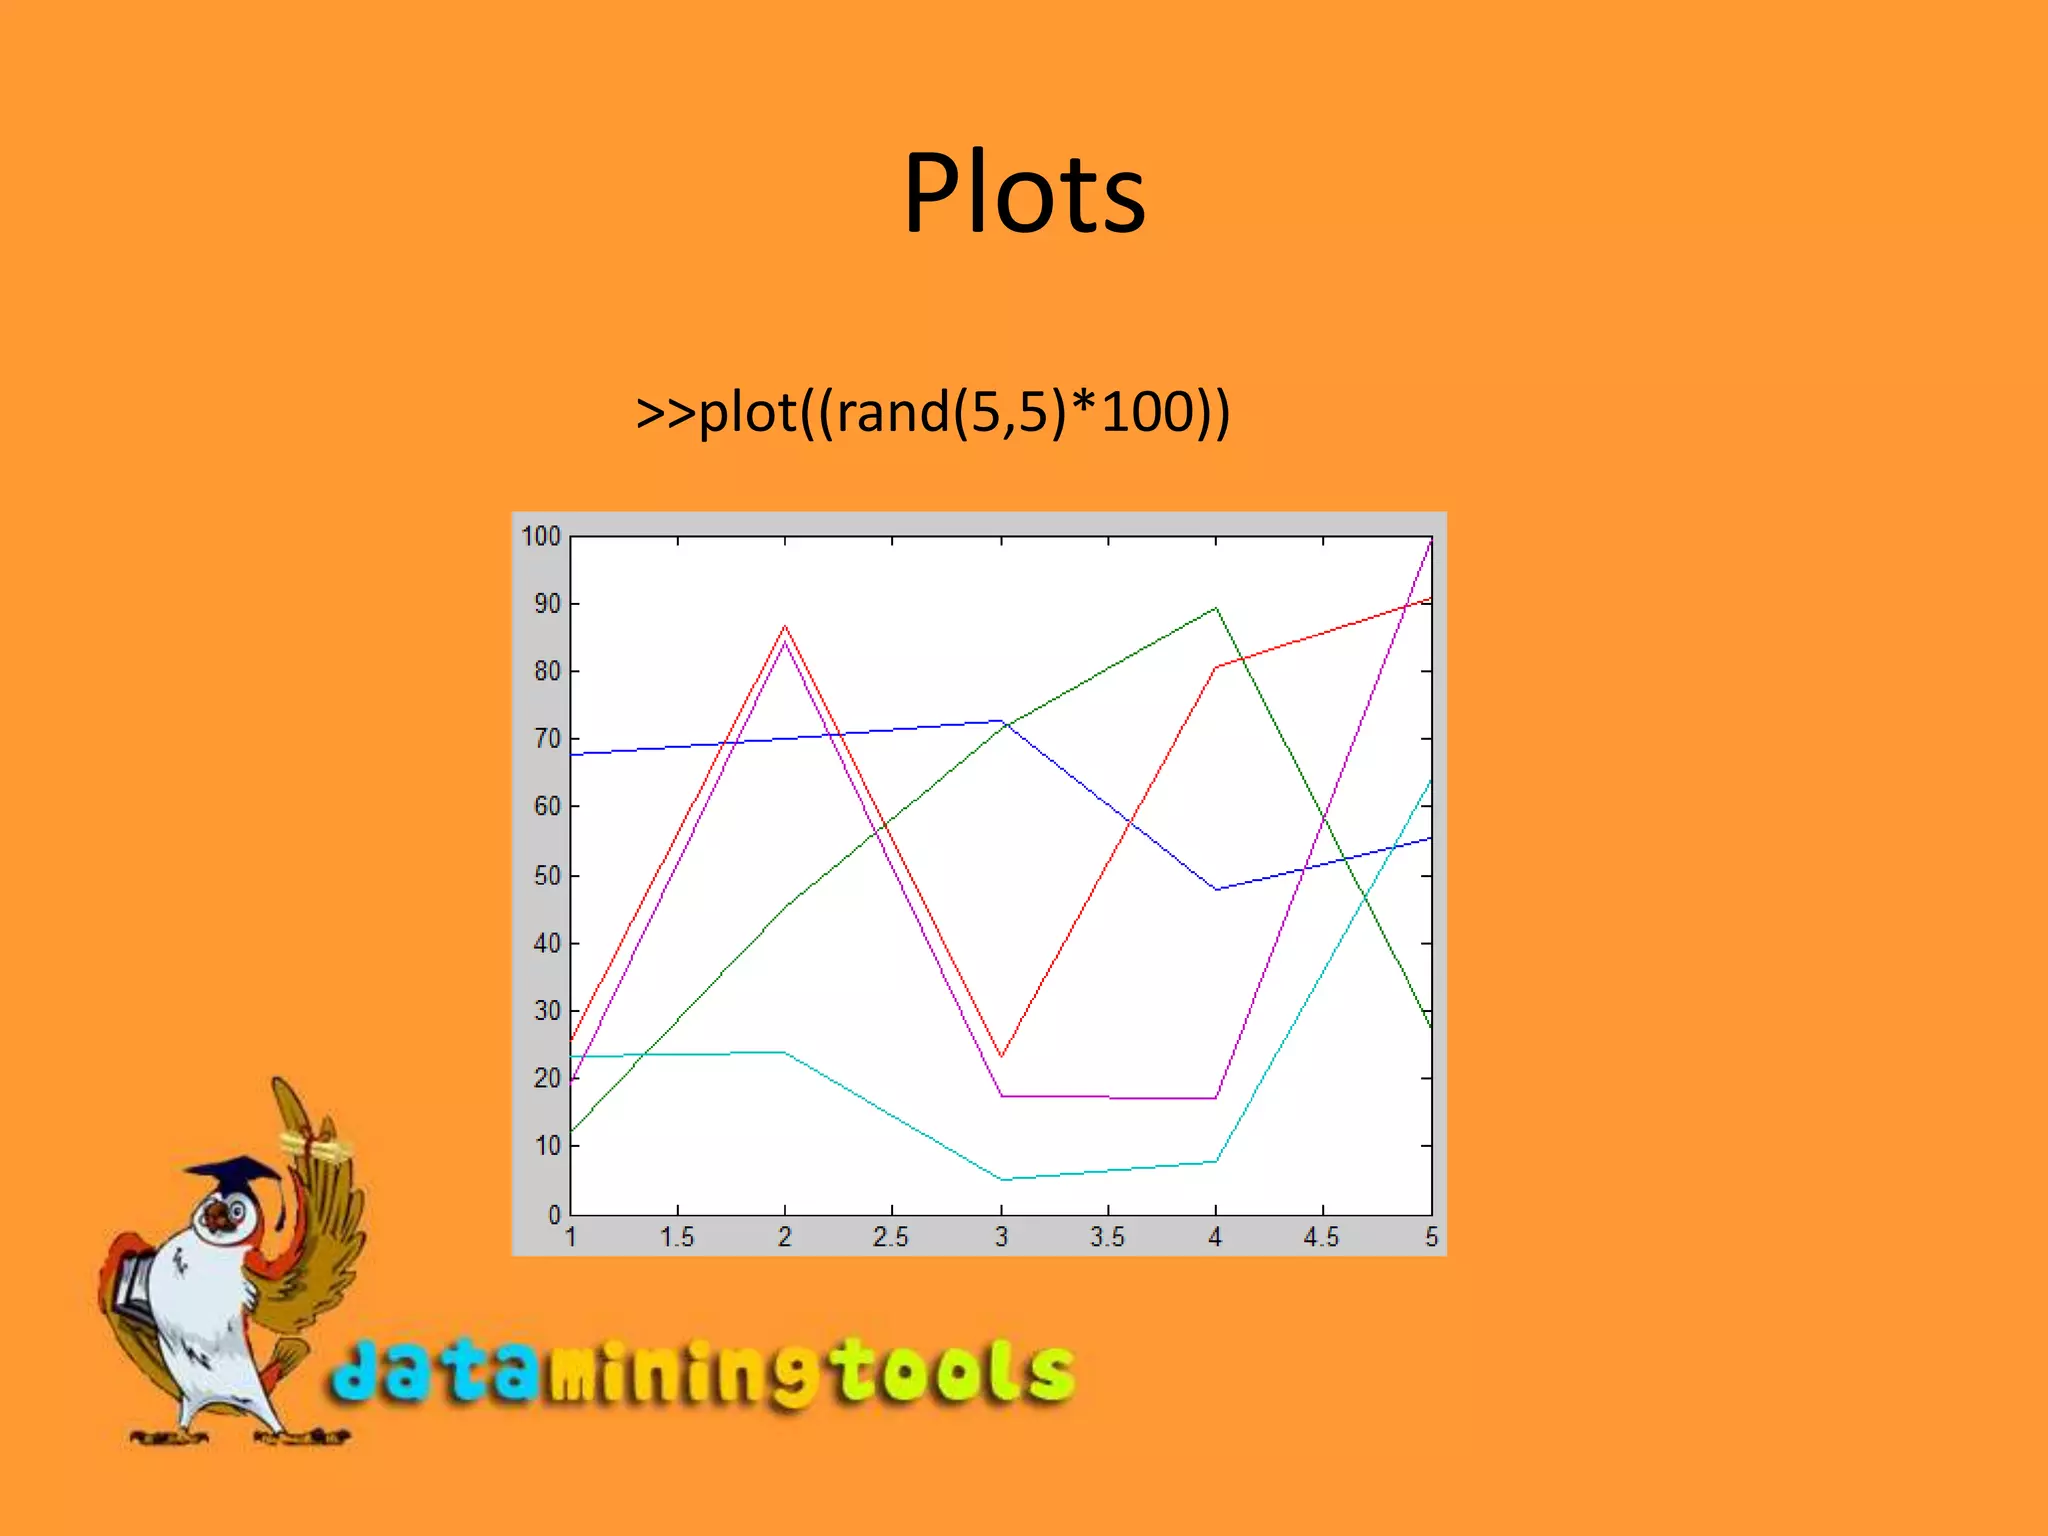

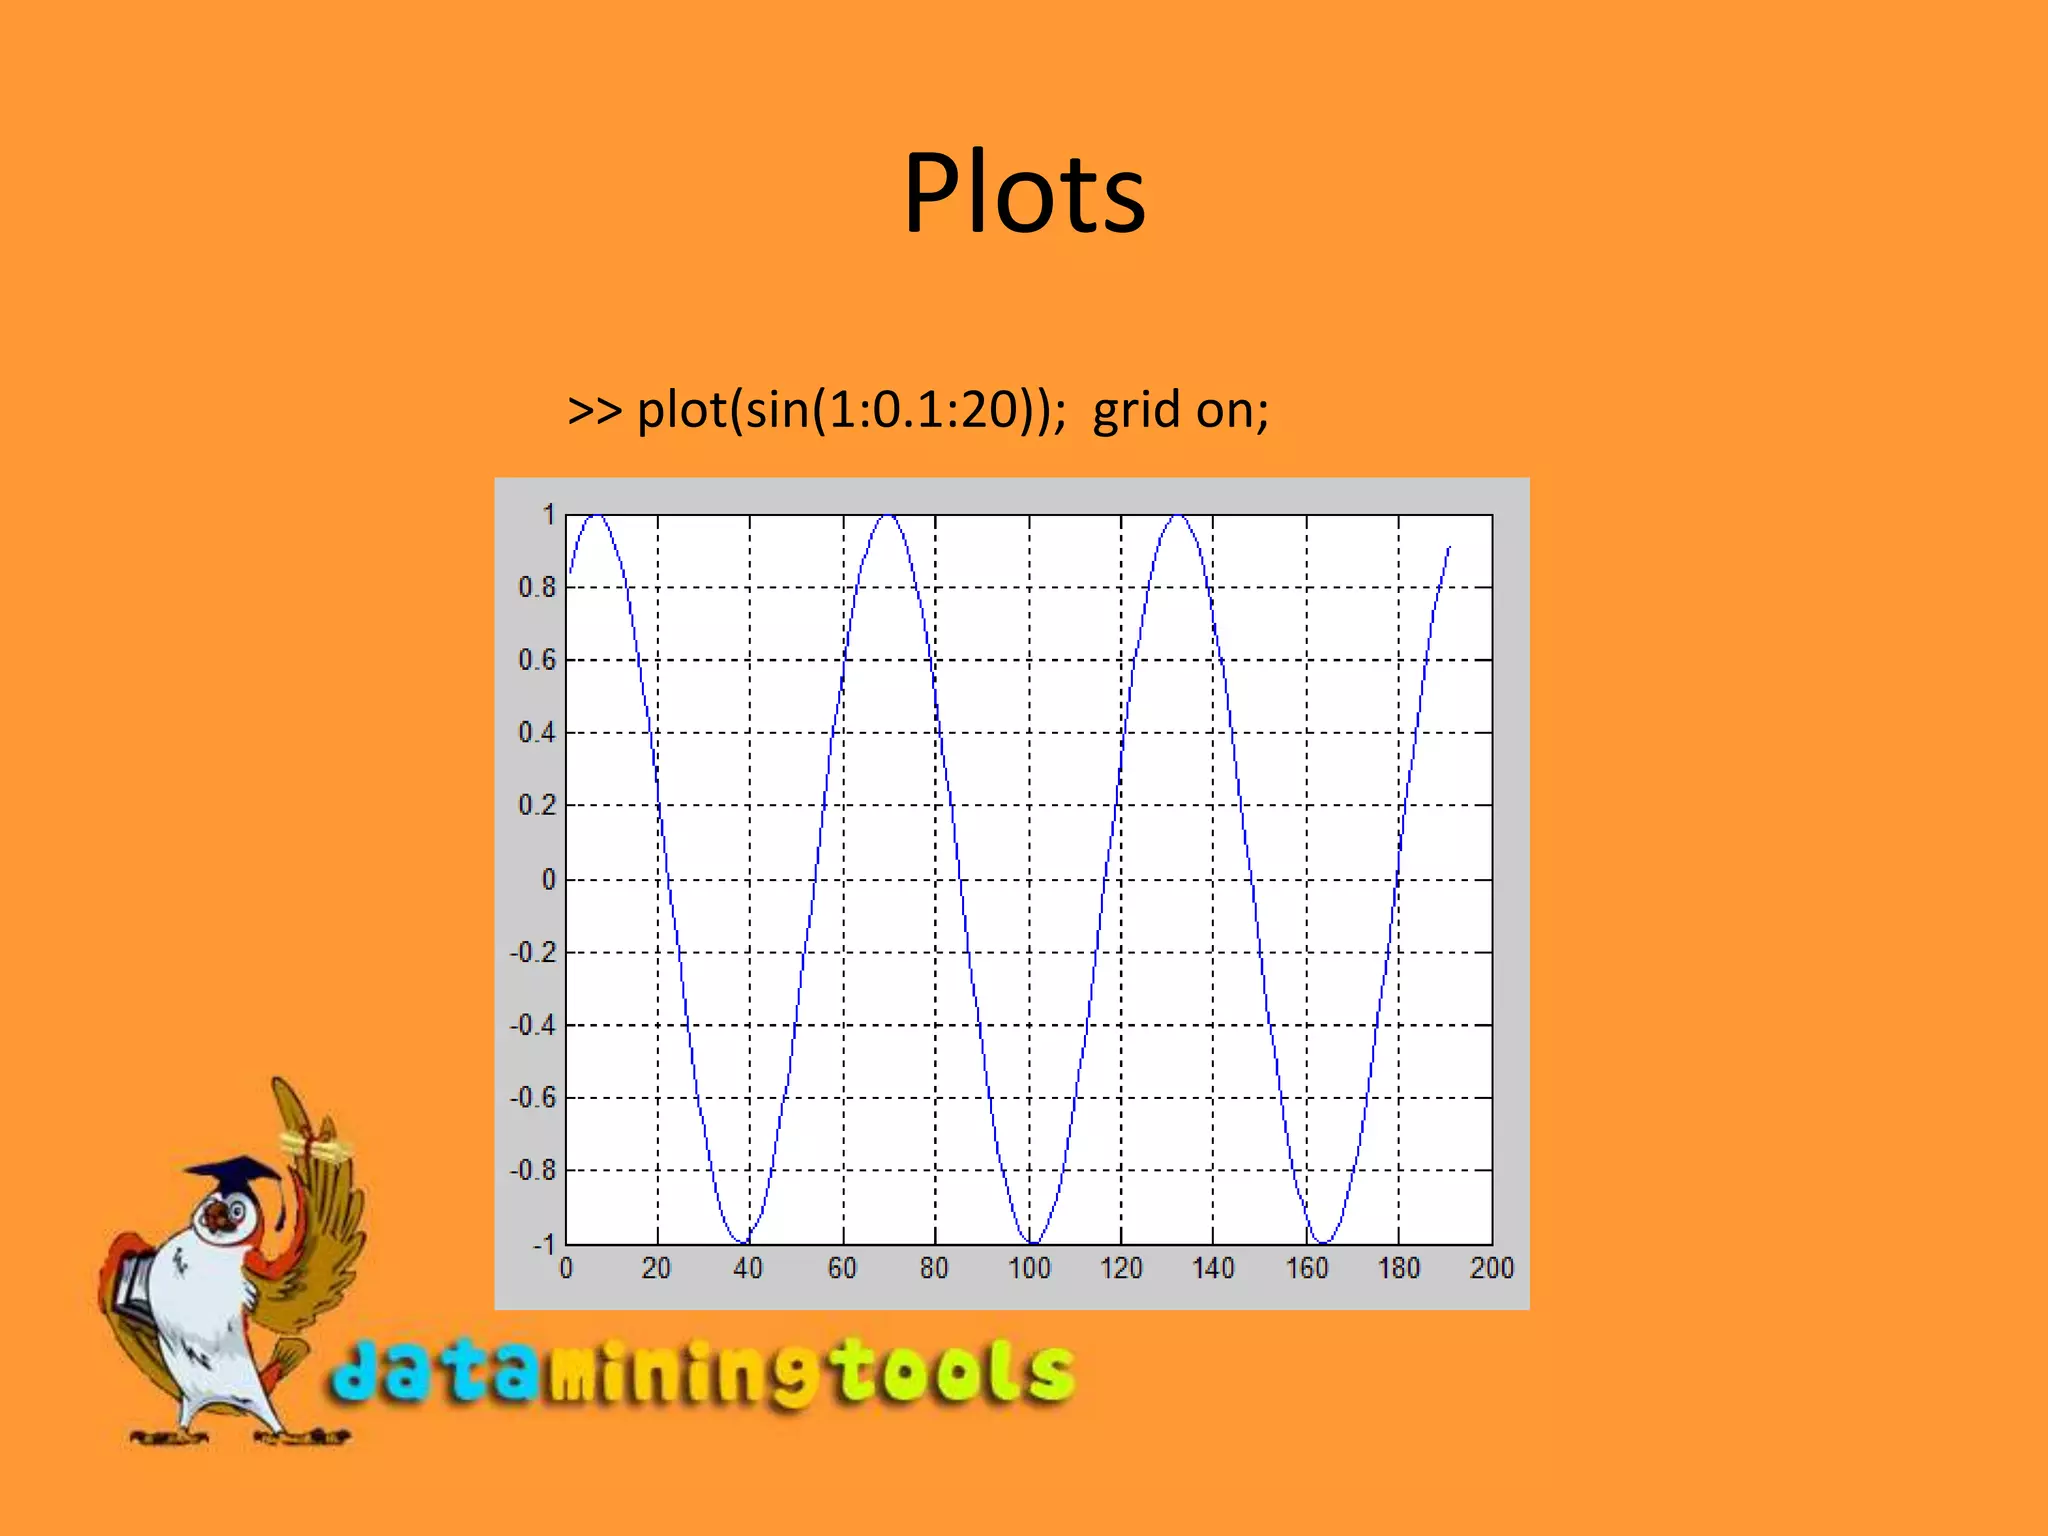
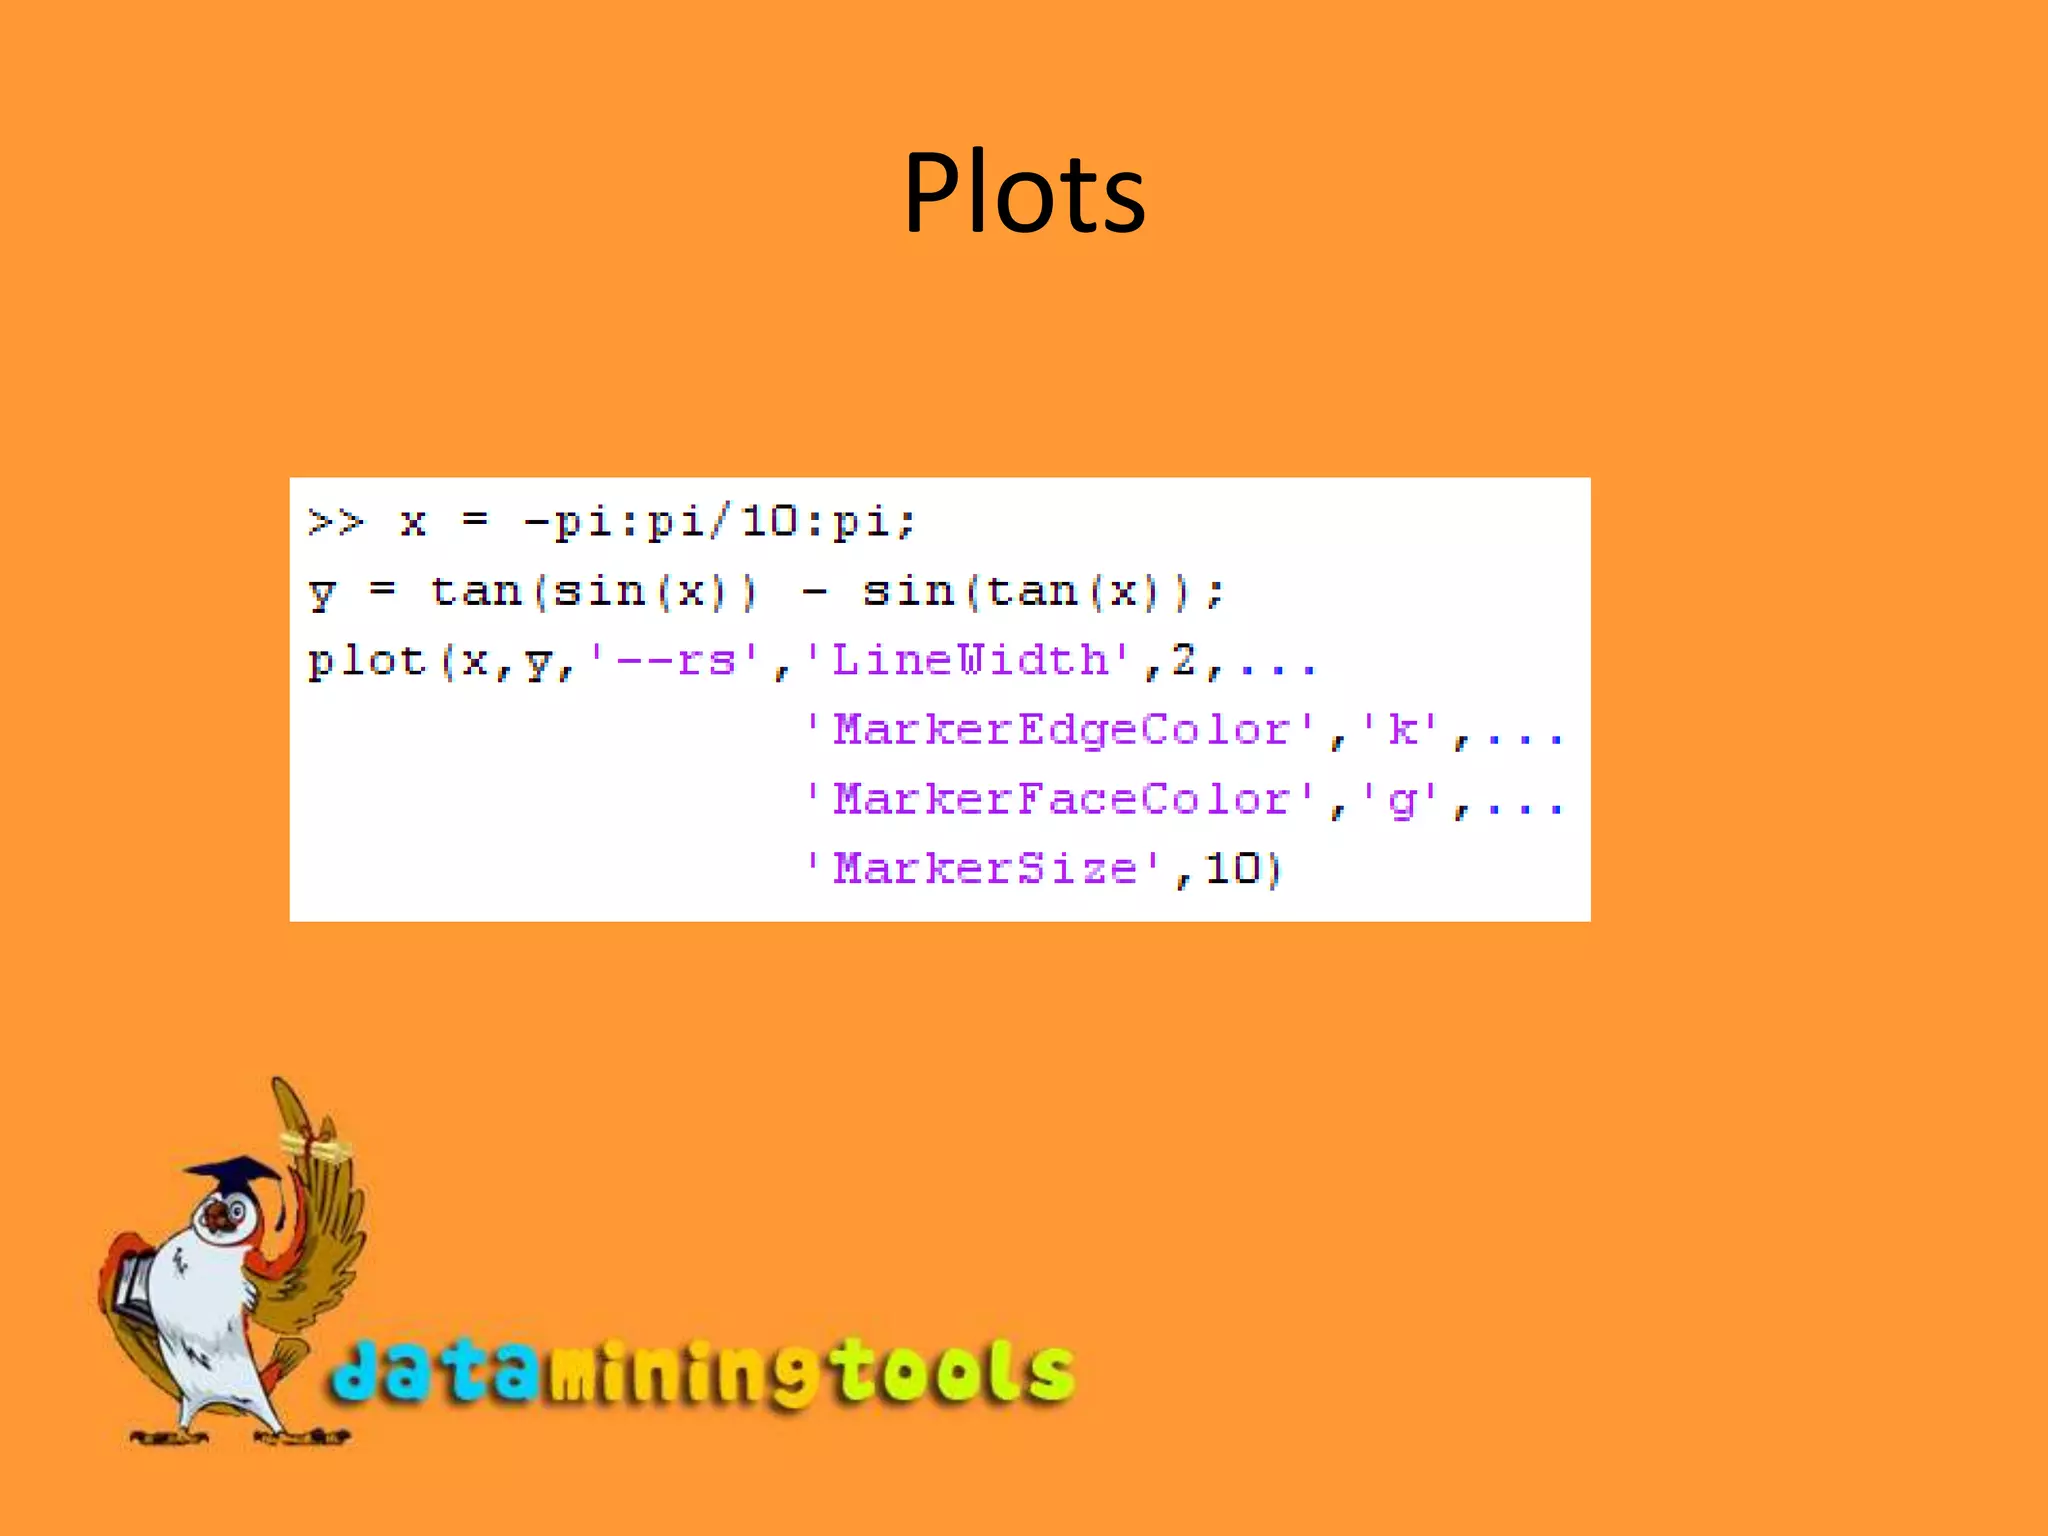


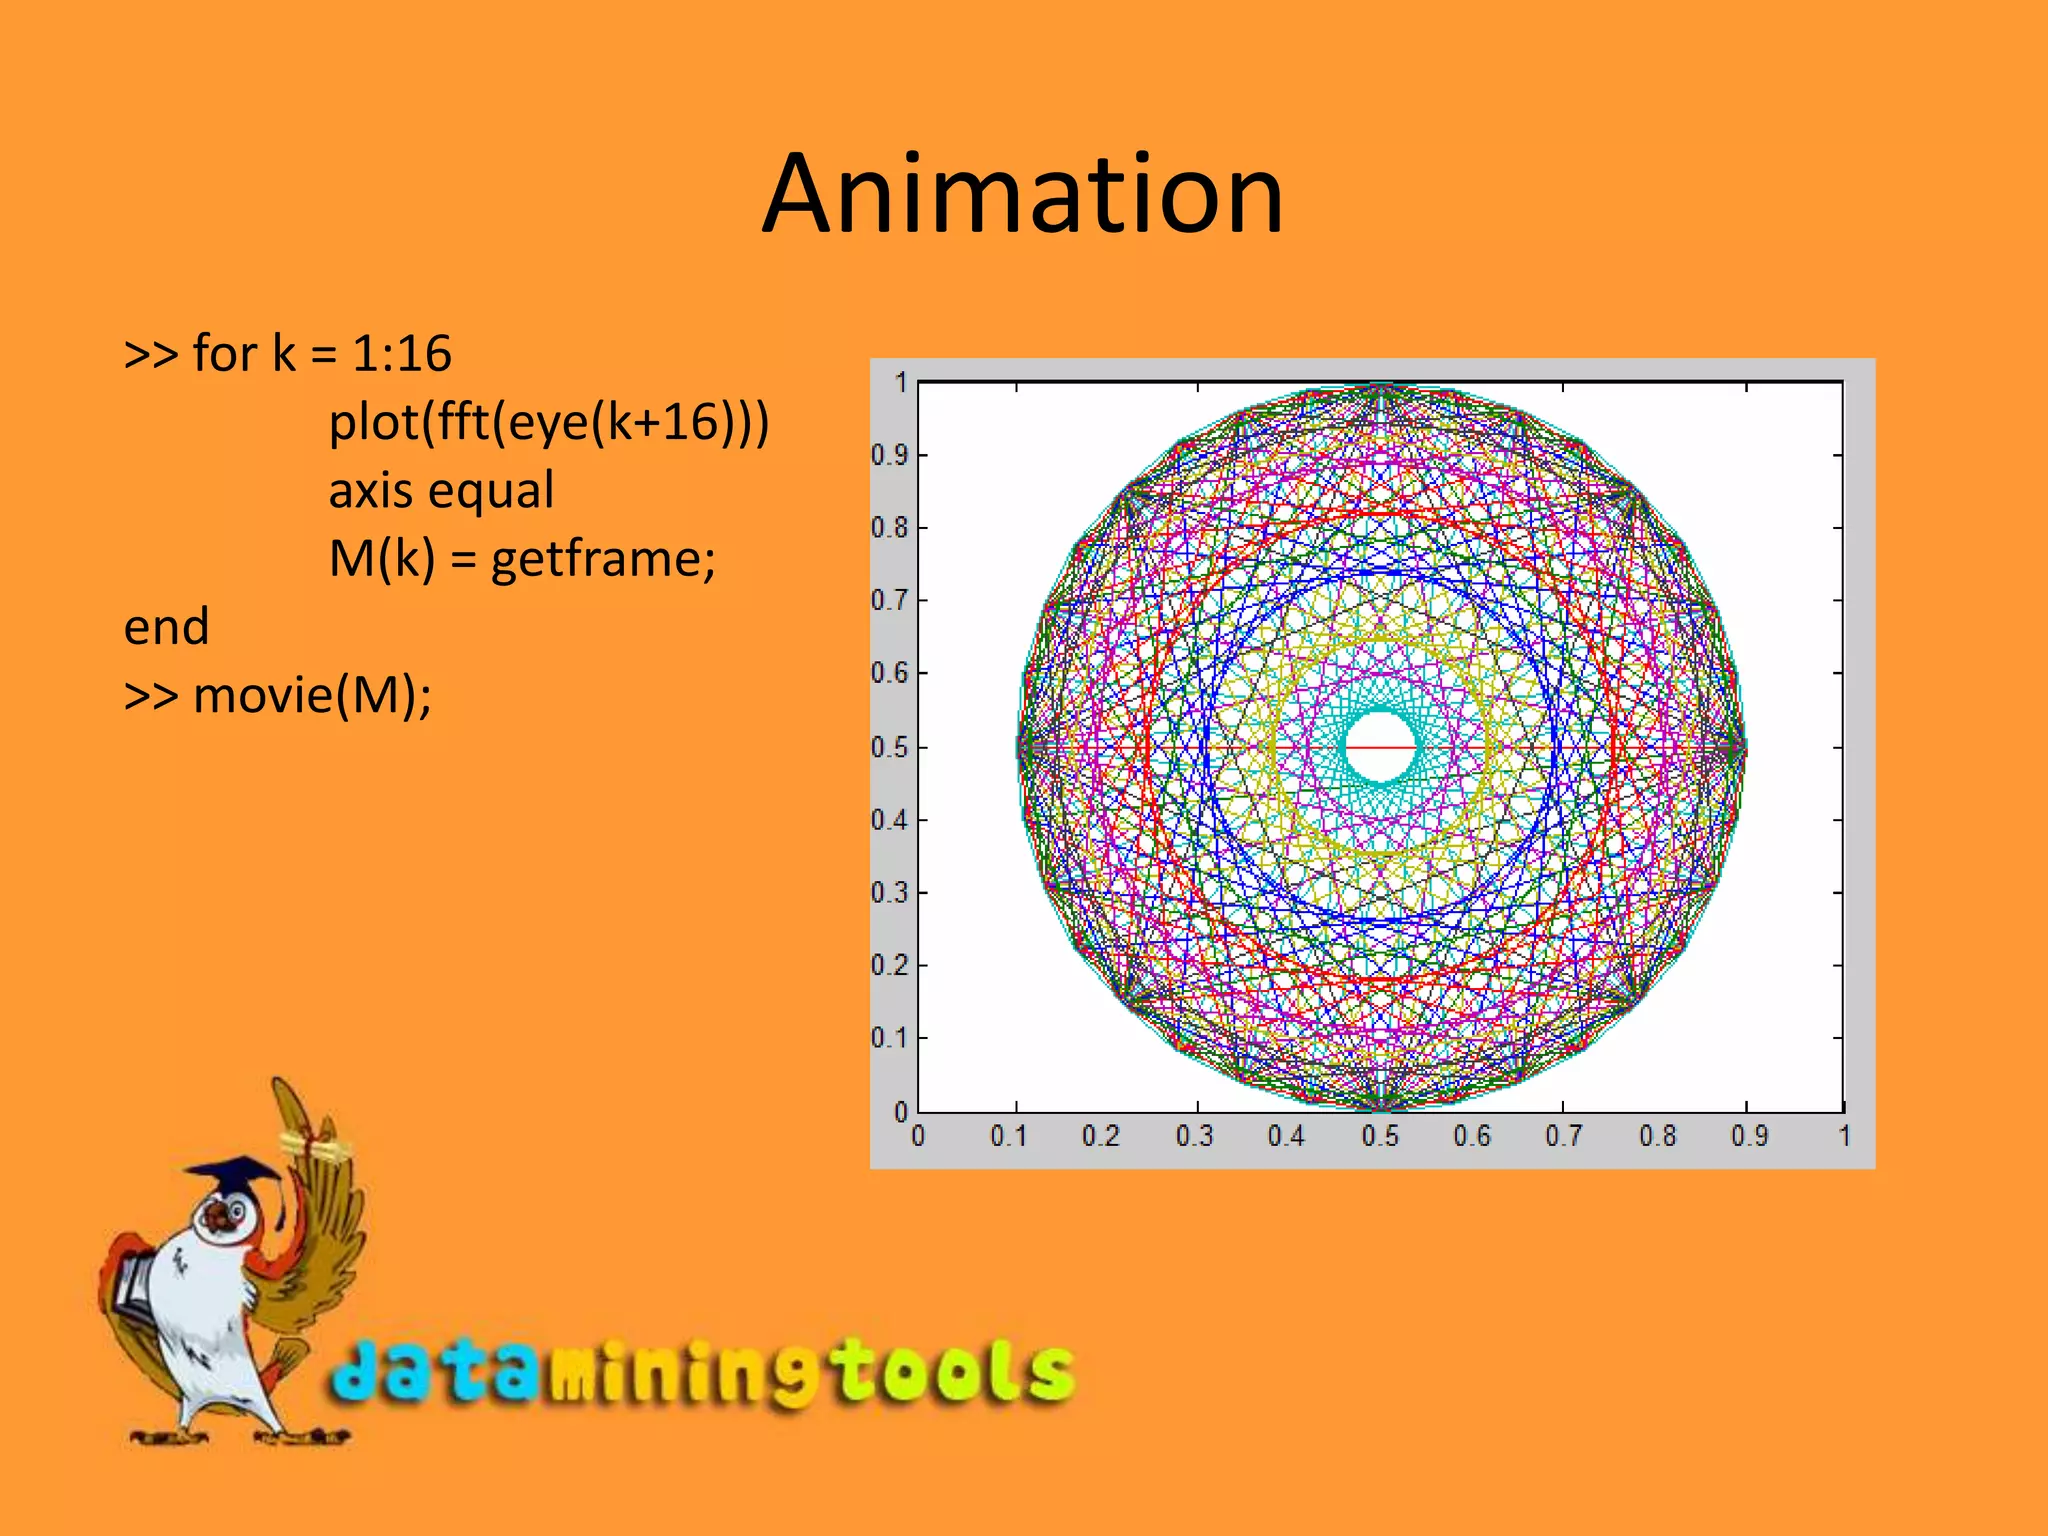


The document discusses visualizing data in Matlab. It describes how the plot function can be used to create graphs with different parameters. It also explains how to create animations by saving multiple frames from figures using getframe and playing them back with movie. An example is provided to generate an animation by plotting the FFT of an identity matrix over increasing sizes and saving each frame.


