Downloaded 65 times


![Using Status files
• Perfect for batch operations
• perl, python, php
• Status file
TIMESTAMP:1276203703
STATUS:0
HOSTNAME:myserver
• Observer
if [ $(get_time_delta ${file}) -gt ${max_d_s} ]; then
err "Delta is greater than ${max_delta} hours"
return
Fi
if [ "$(parse_status_file ${file} STATUS)" != "0" ]; then
err "Last backup status is not 0“
return
Fi
echo ${ok}
27](https://image.slidesharecdn.com/multilayermonitoringv1-12777345099738-phpapp01/85/Multi-Layer-Monitoring-V1-25-320.jpg)


![Using Status files
• Perfect for batch operations
• perl, python, php
• Status file
TIMESTAMP:1276203703
STATUS:0
HOSTNAME:myserver
• Observer
if [ $(get_time_delta ${file}) -gt ${max_d_s} ]; then
err "Delta is greater than ${max_delta} hours"
return
Fi
if [ "$(parse_status_file ${file} STATUS)" != "0" ]; then
err "Last backup status is not 0“
return
Fi
echo ${ok}
27](https://image.slidesharecdn.com/multilayermonitoringv1-12777345099738-phpapp01/75/Multi-Layer-Monitoring-V1-25-2048.jpg)


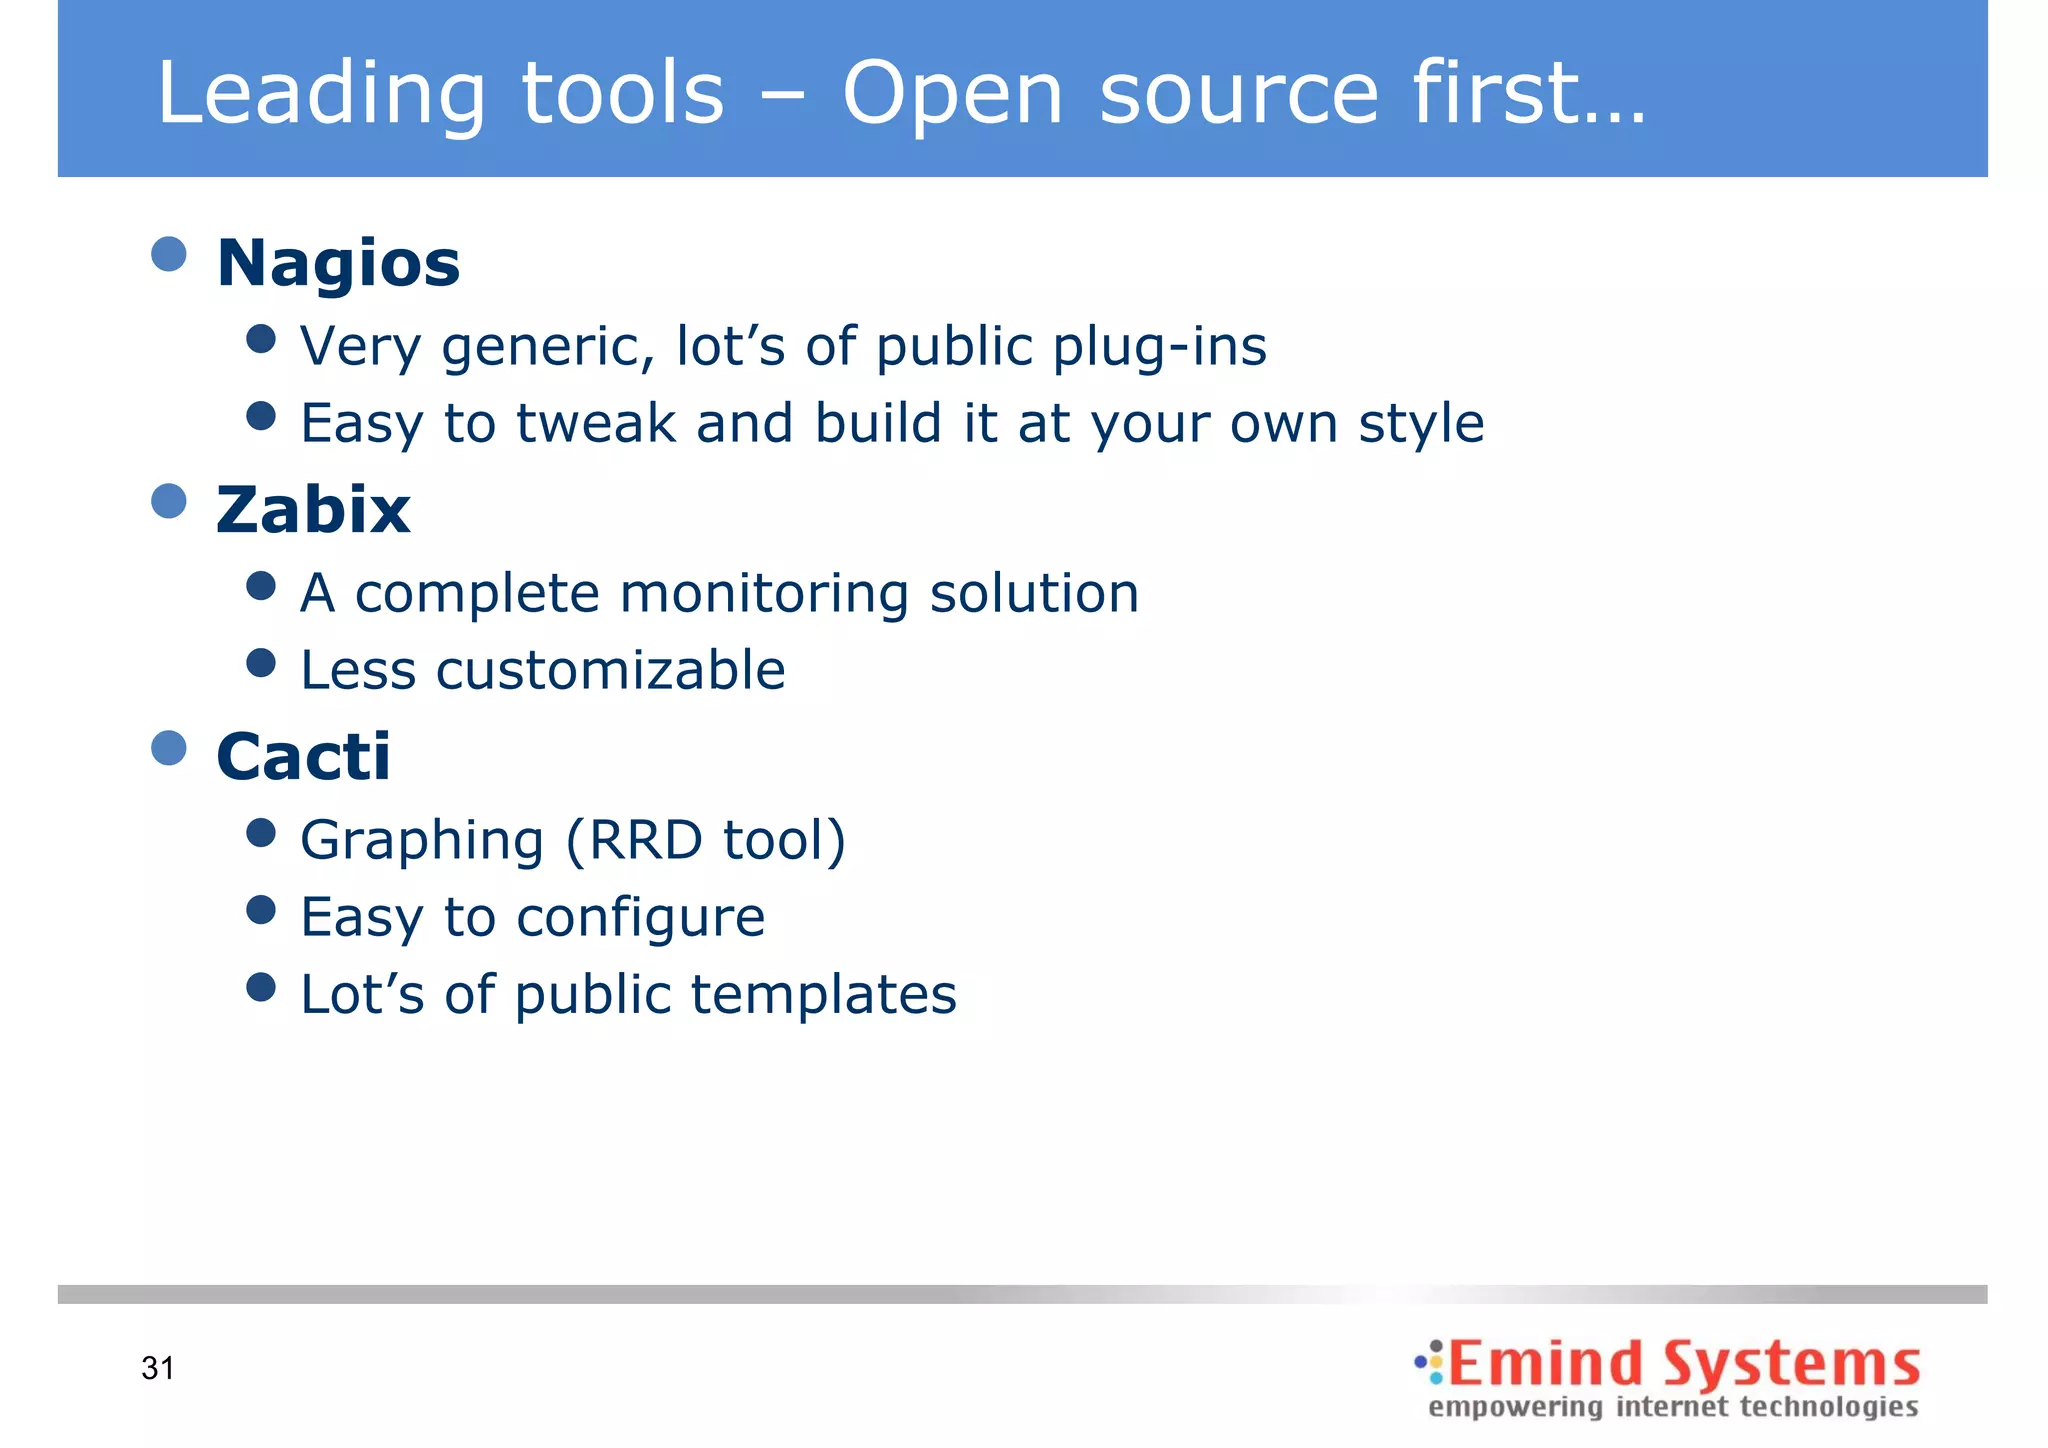


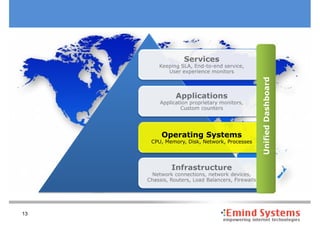
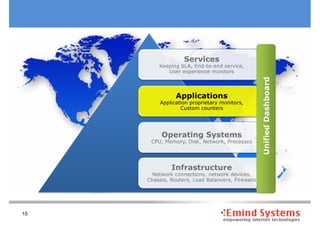
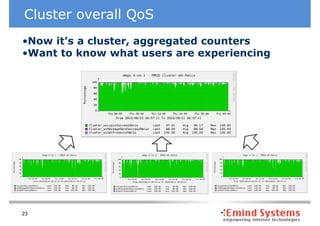
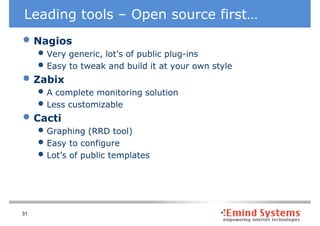
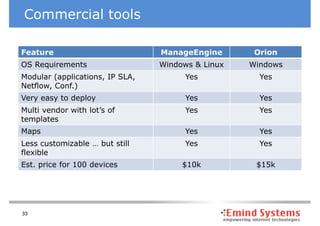
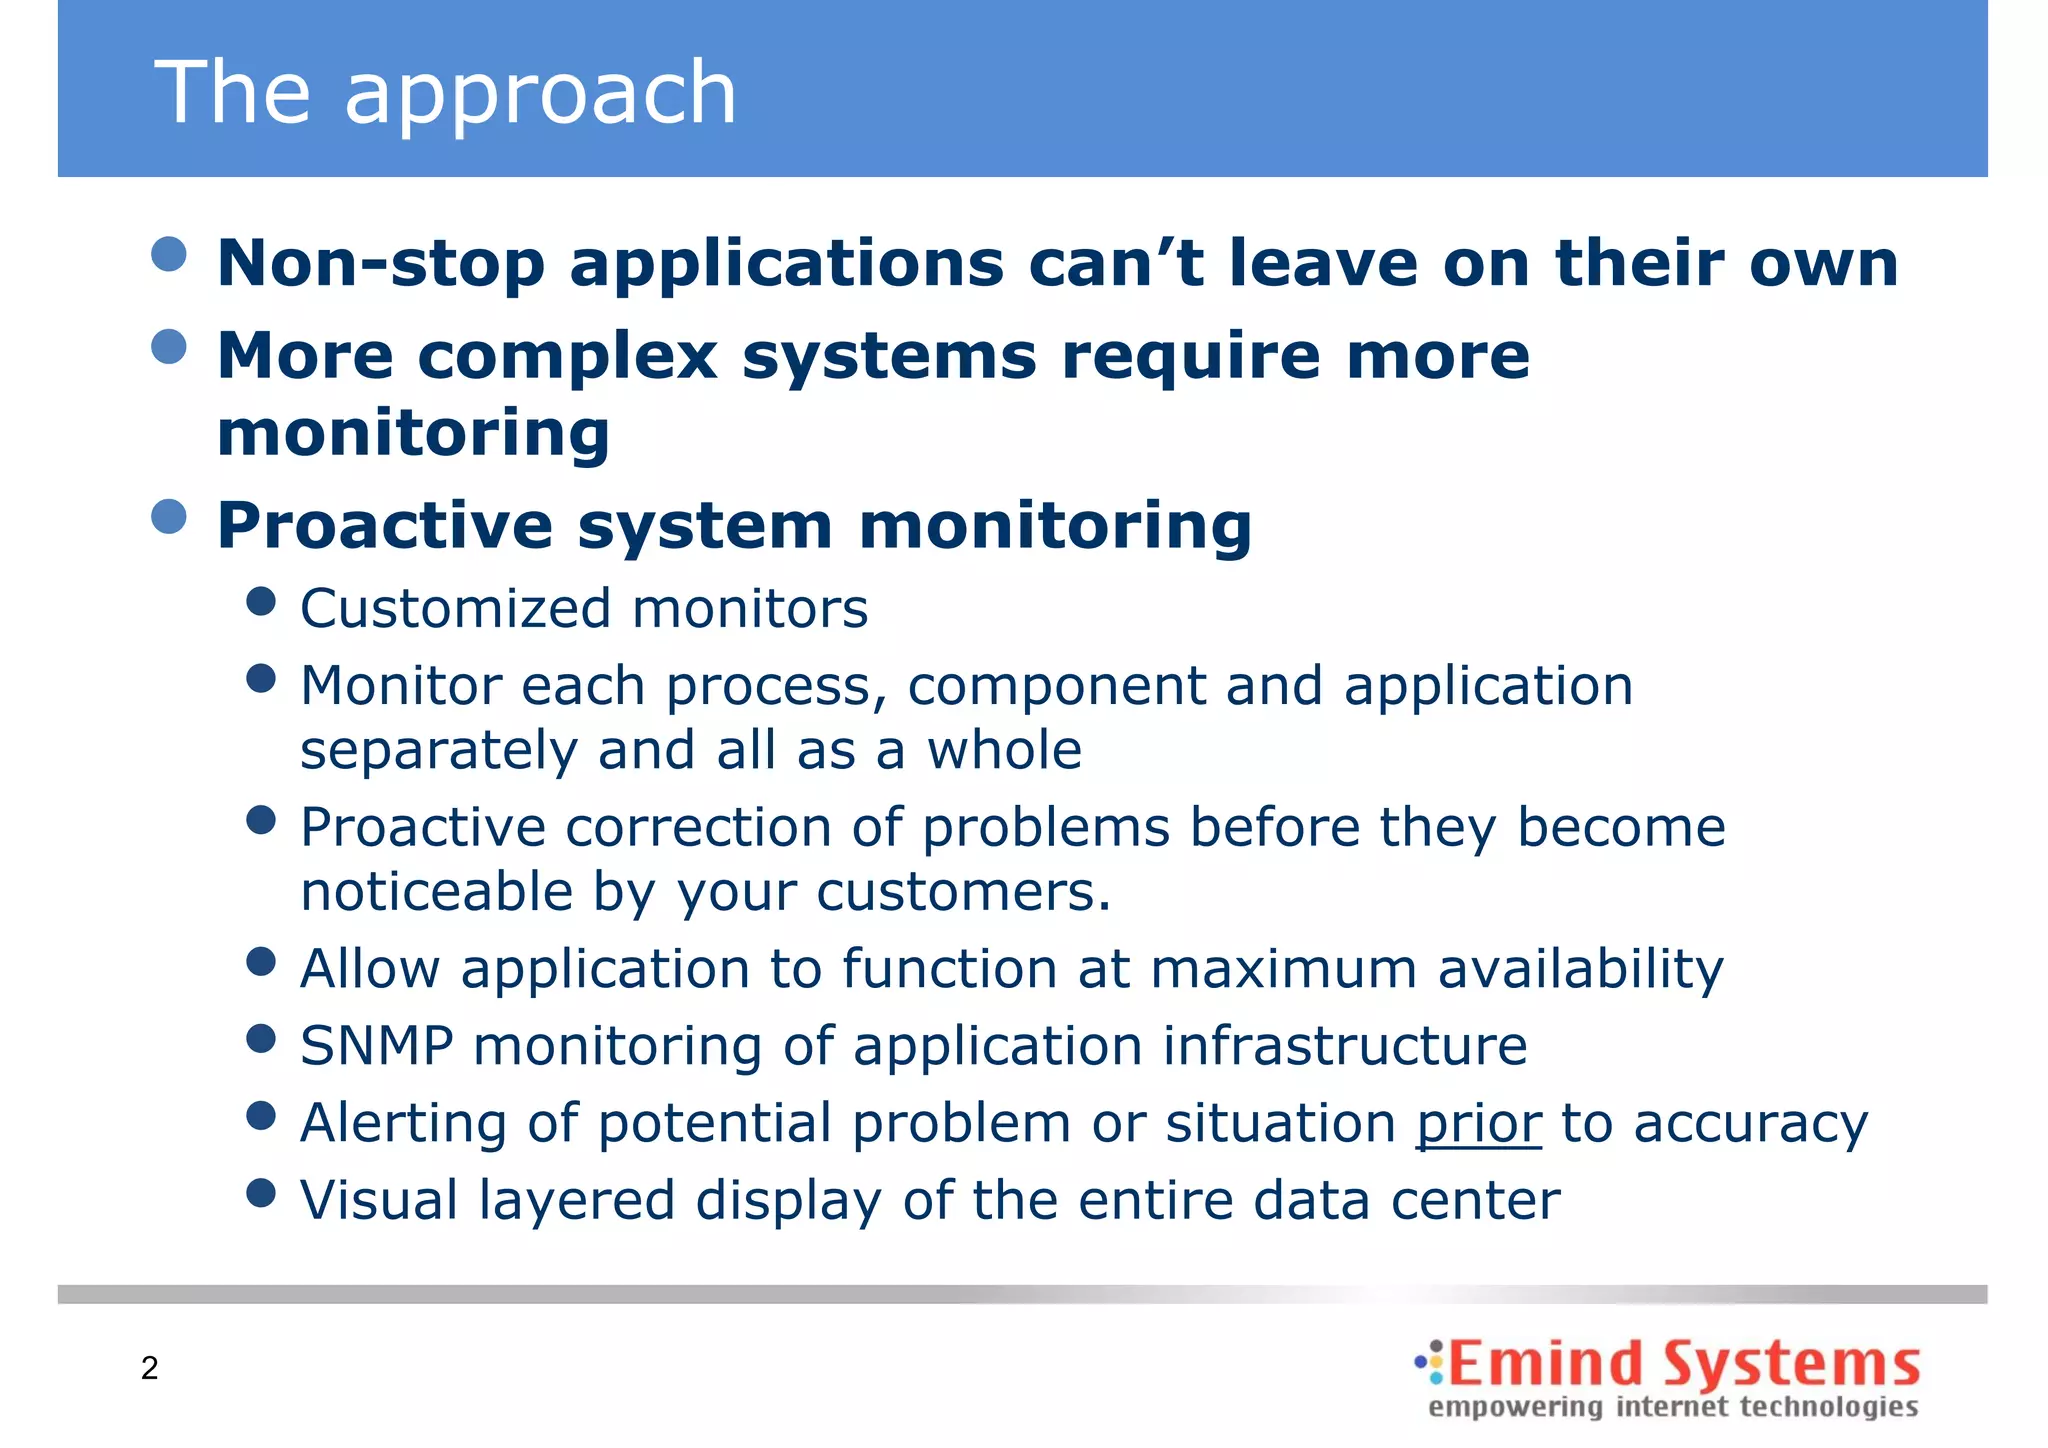
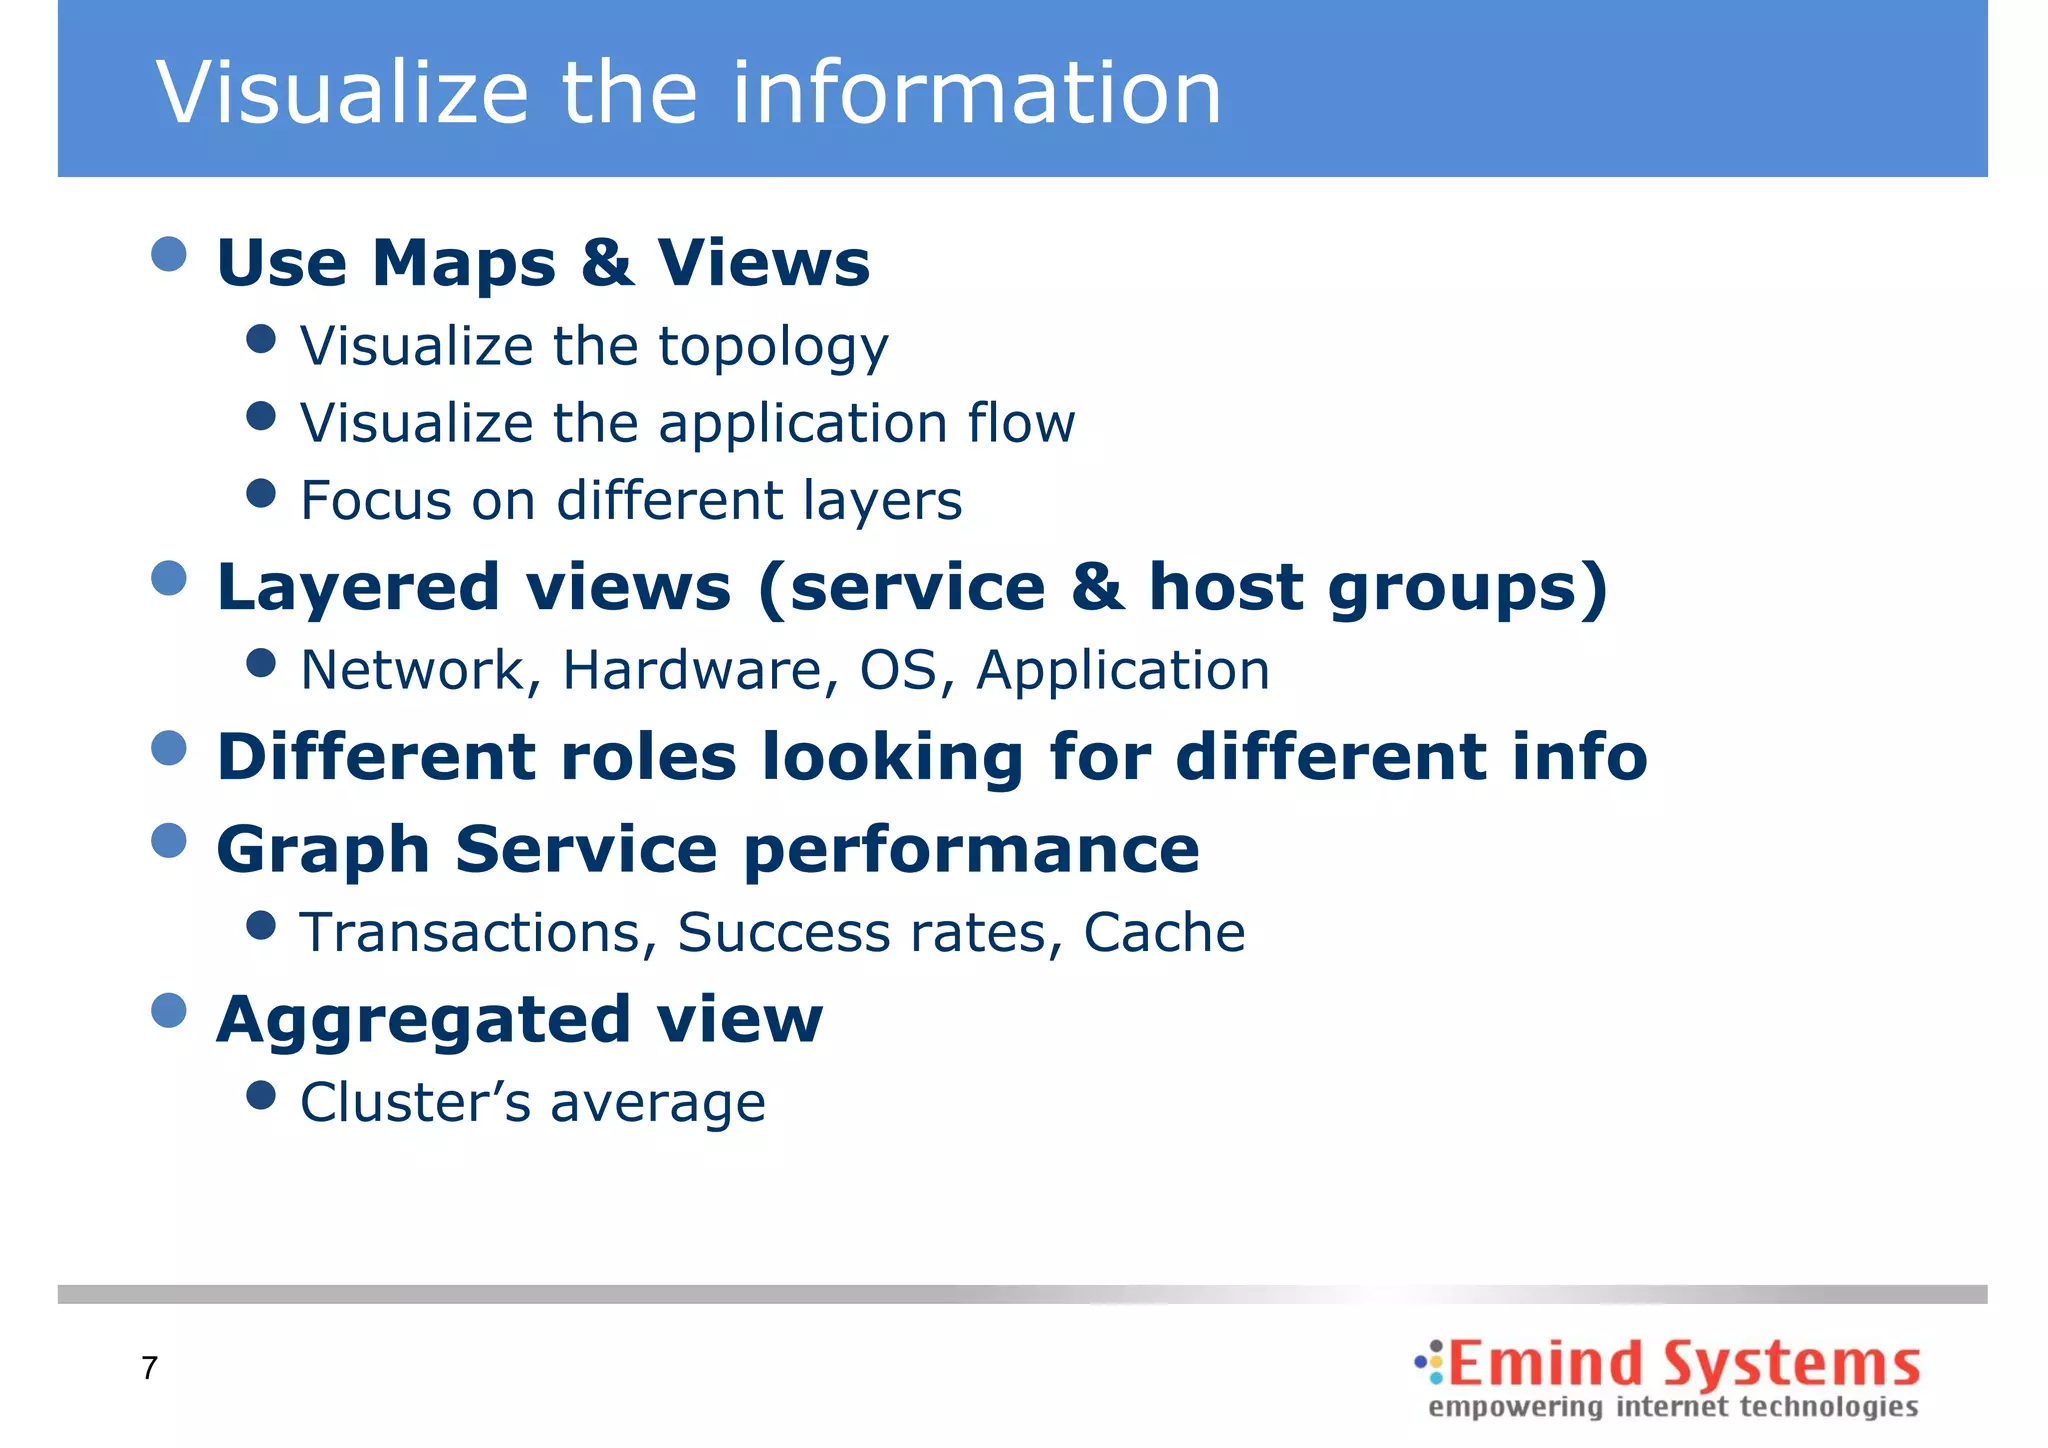
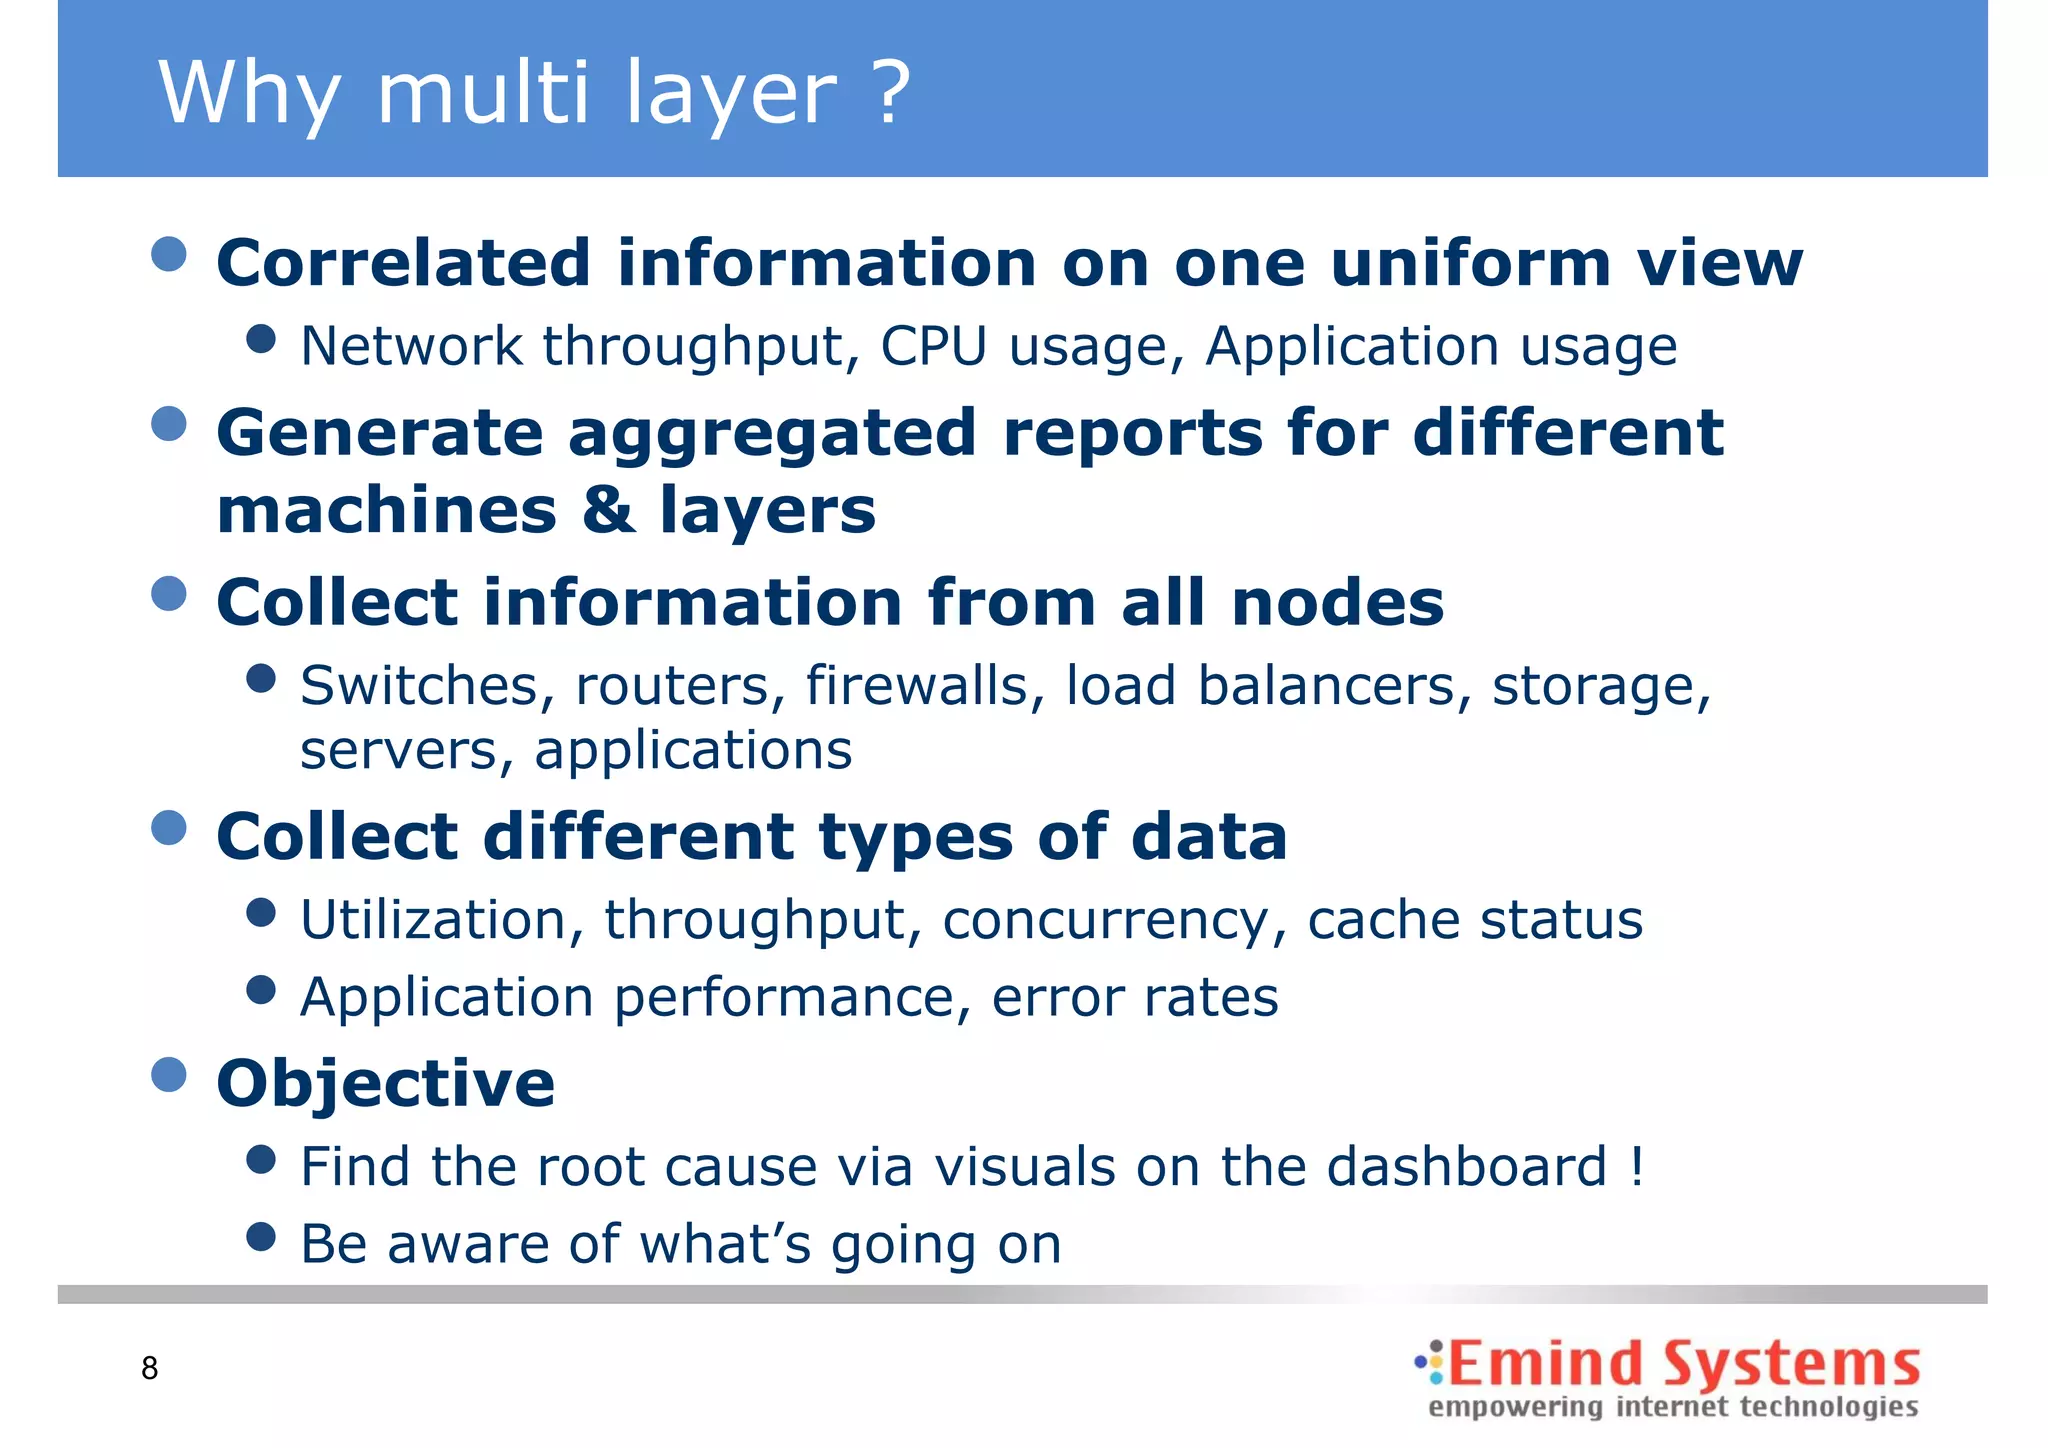
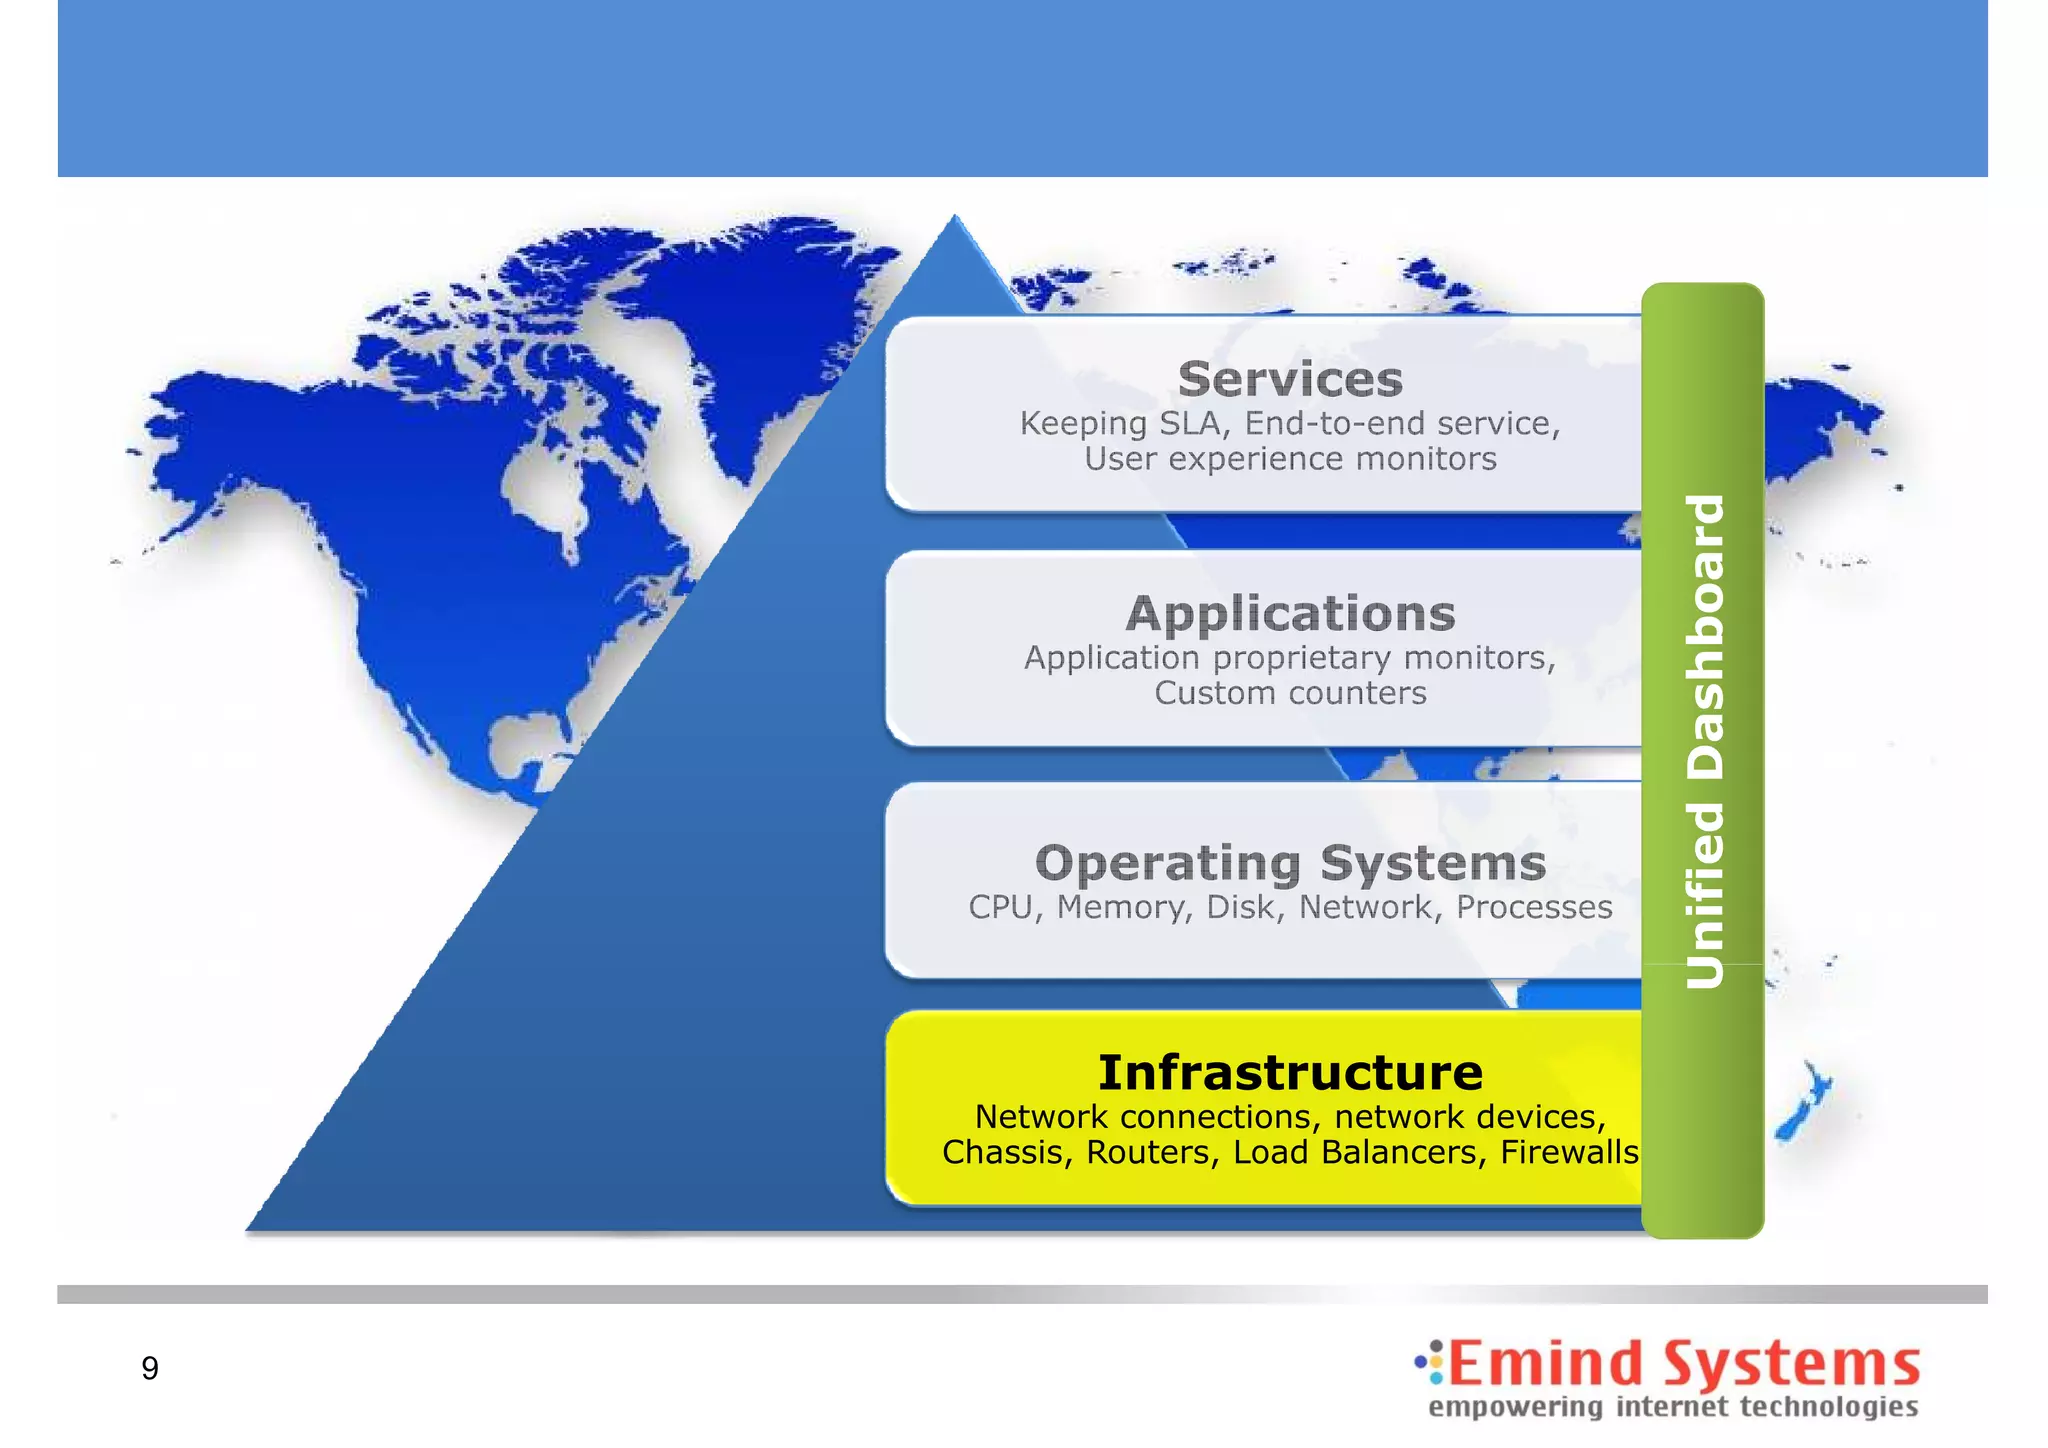
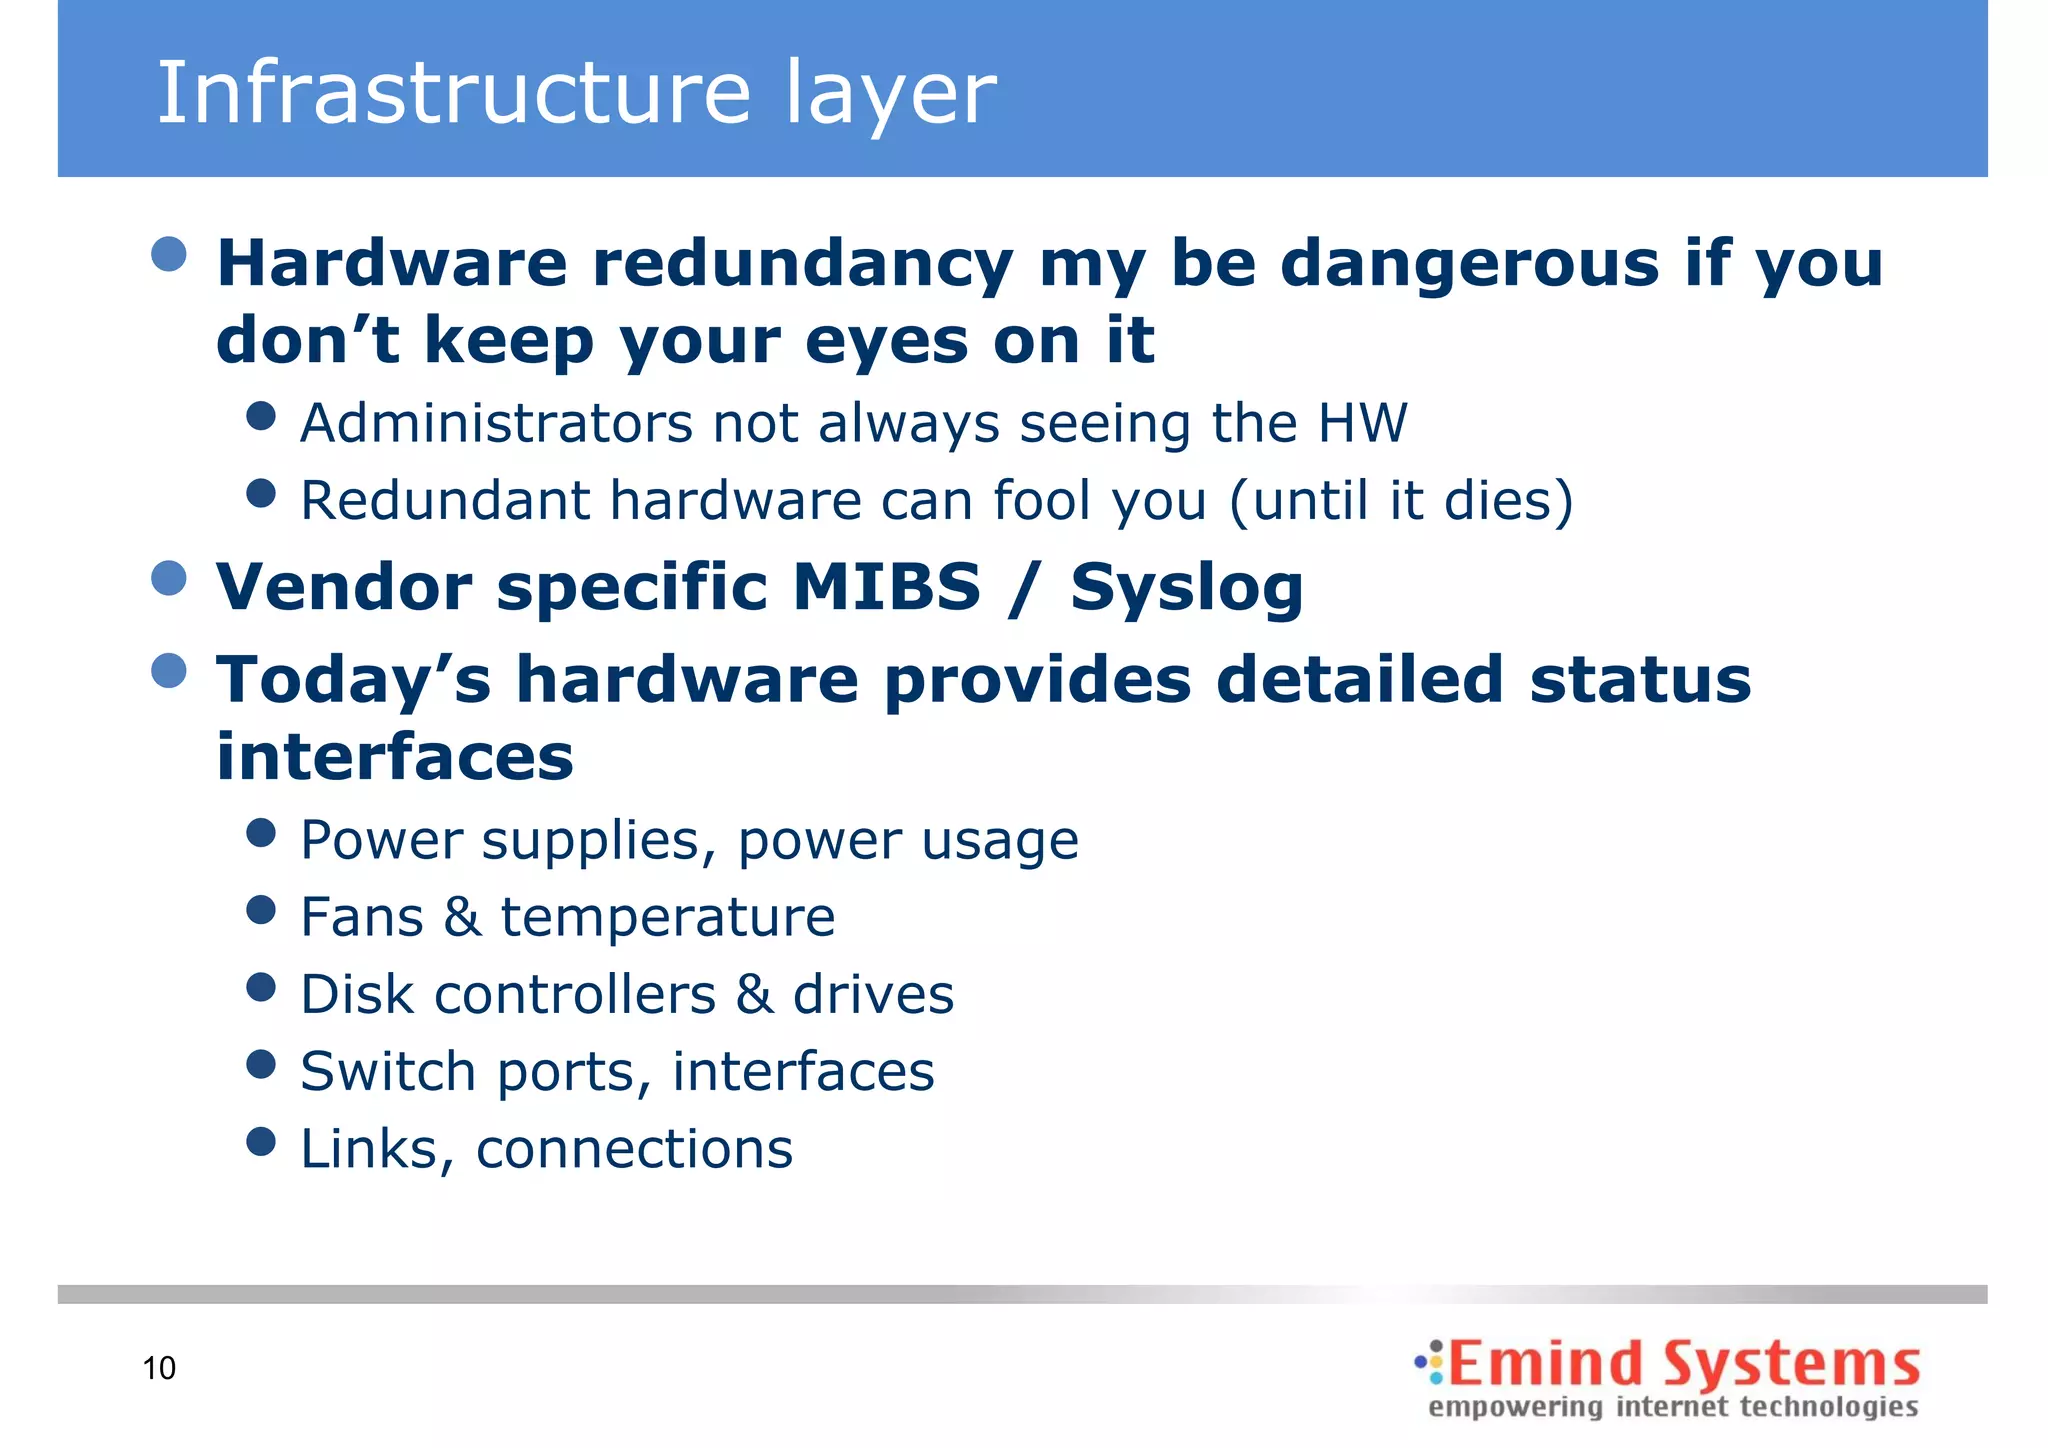
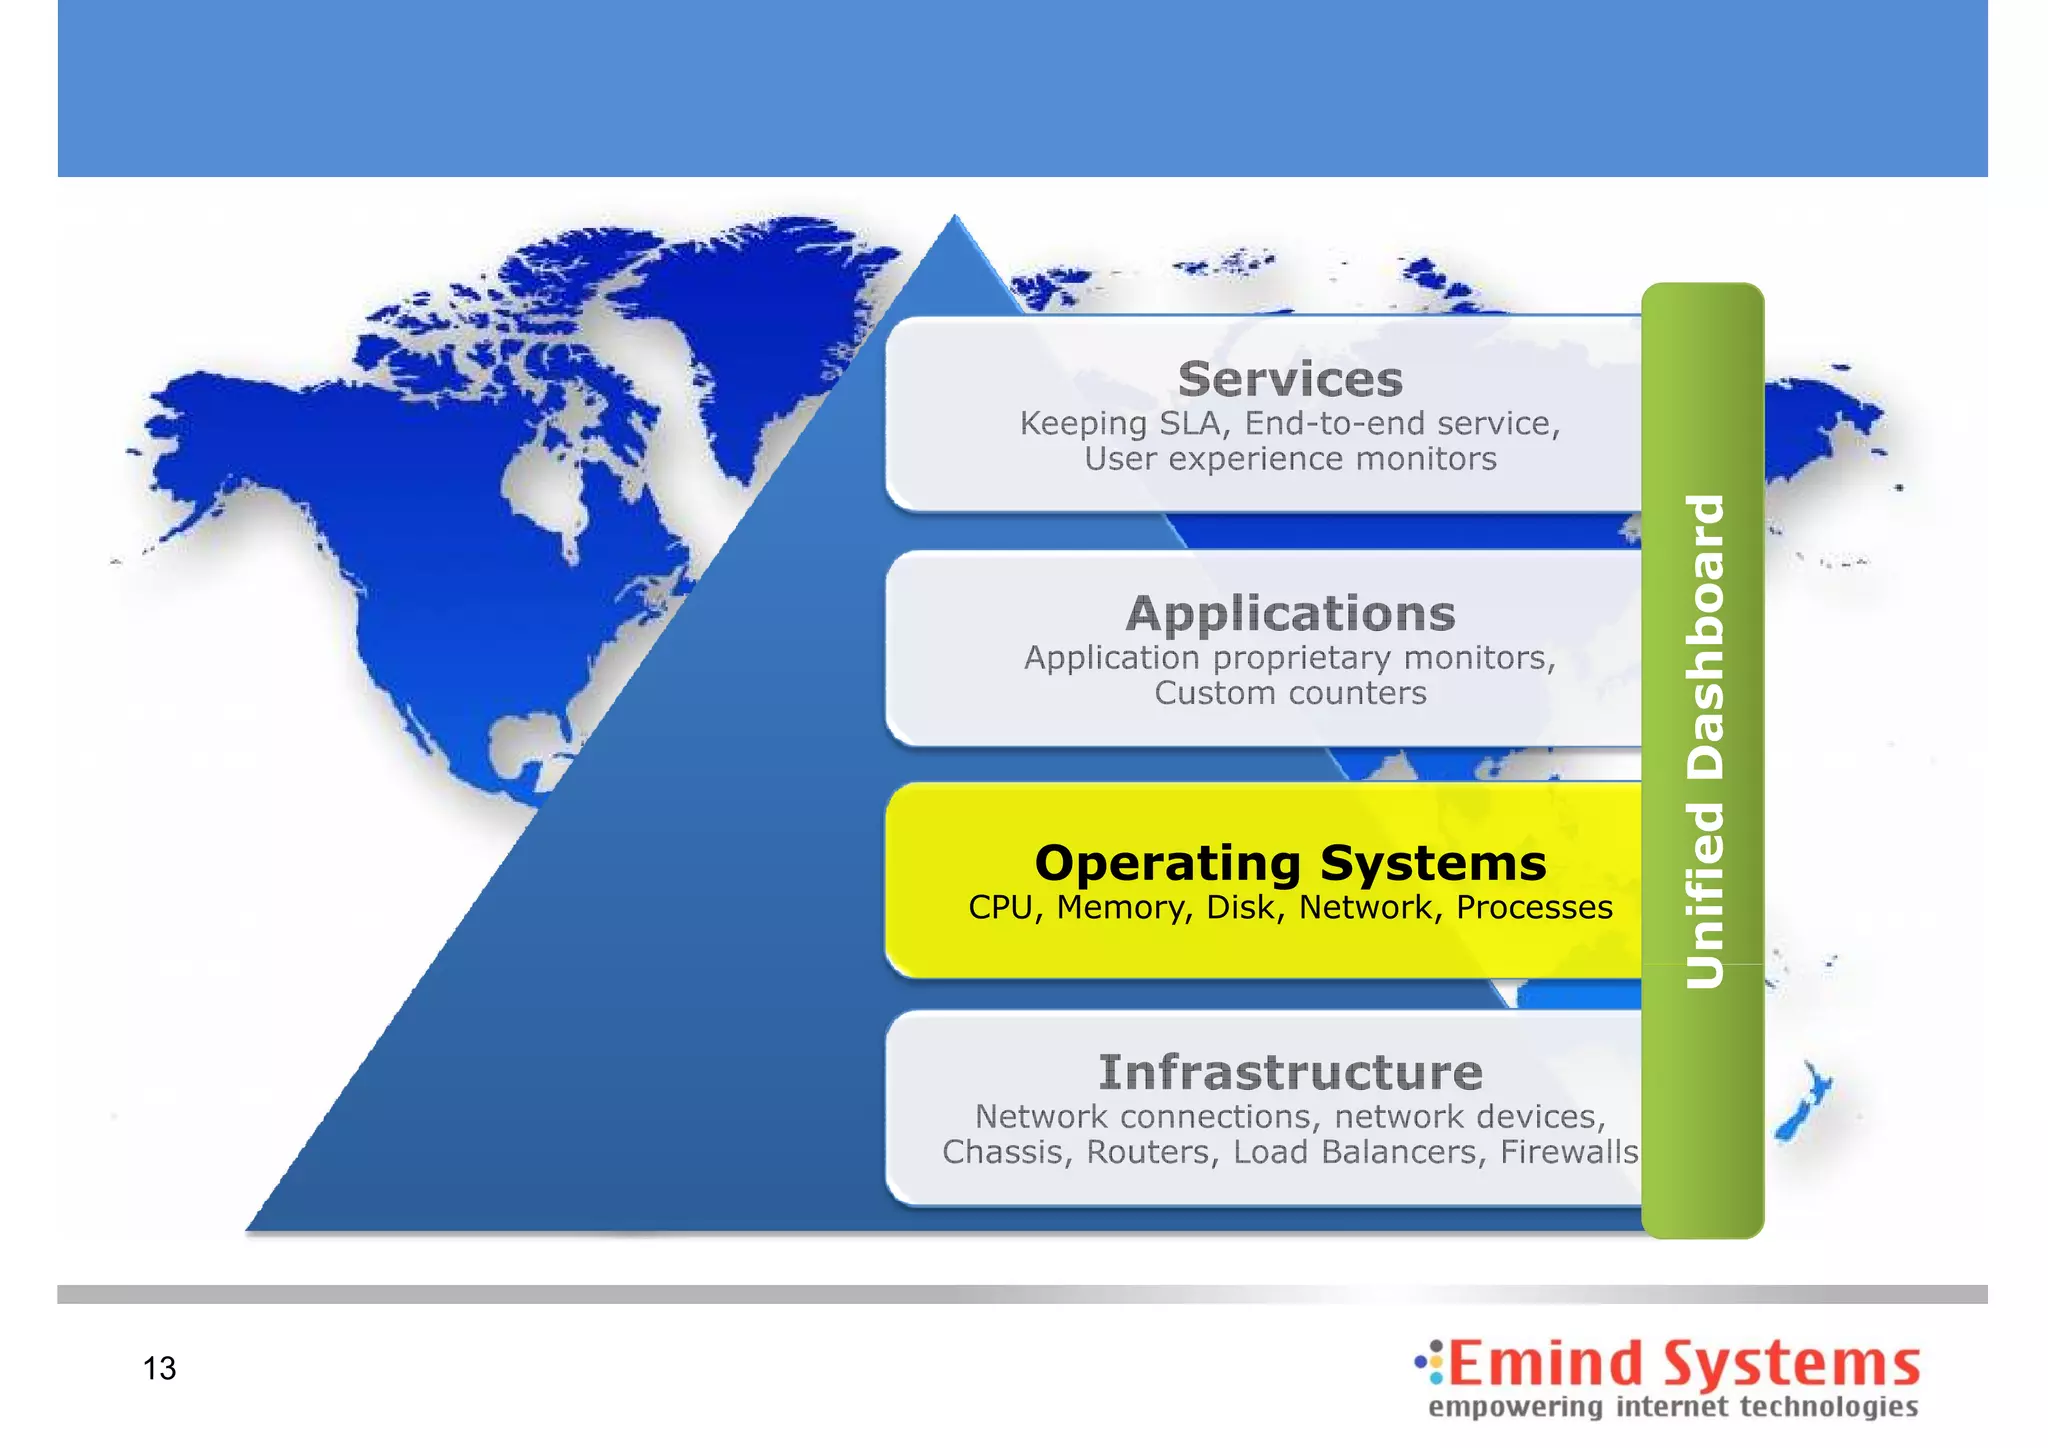
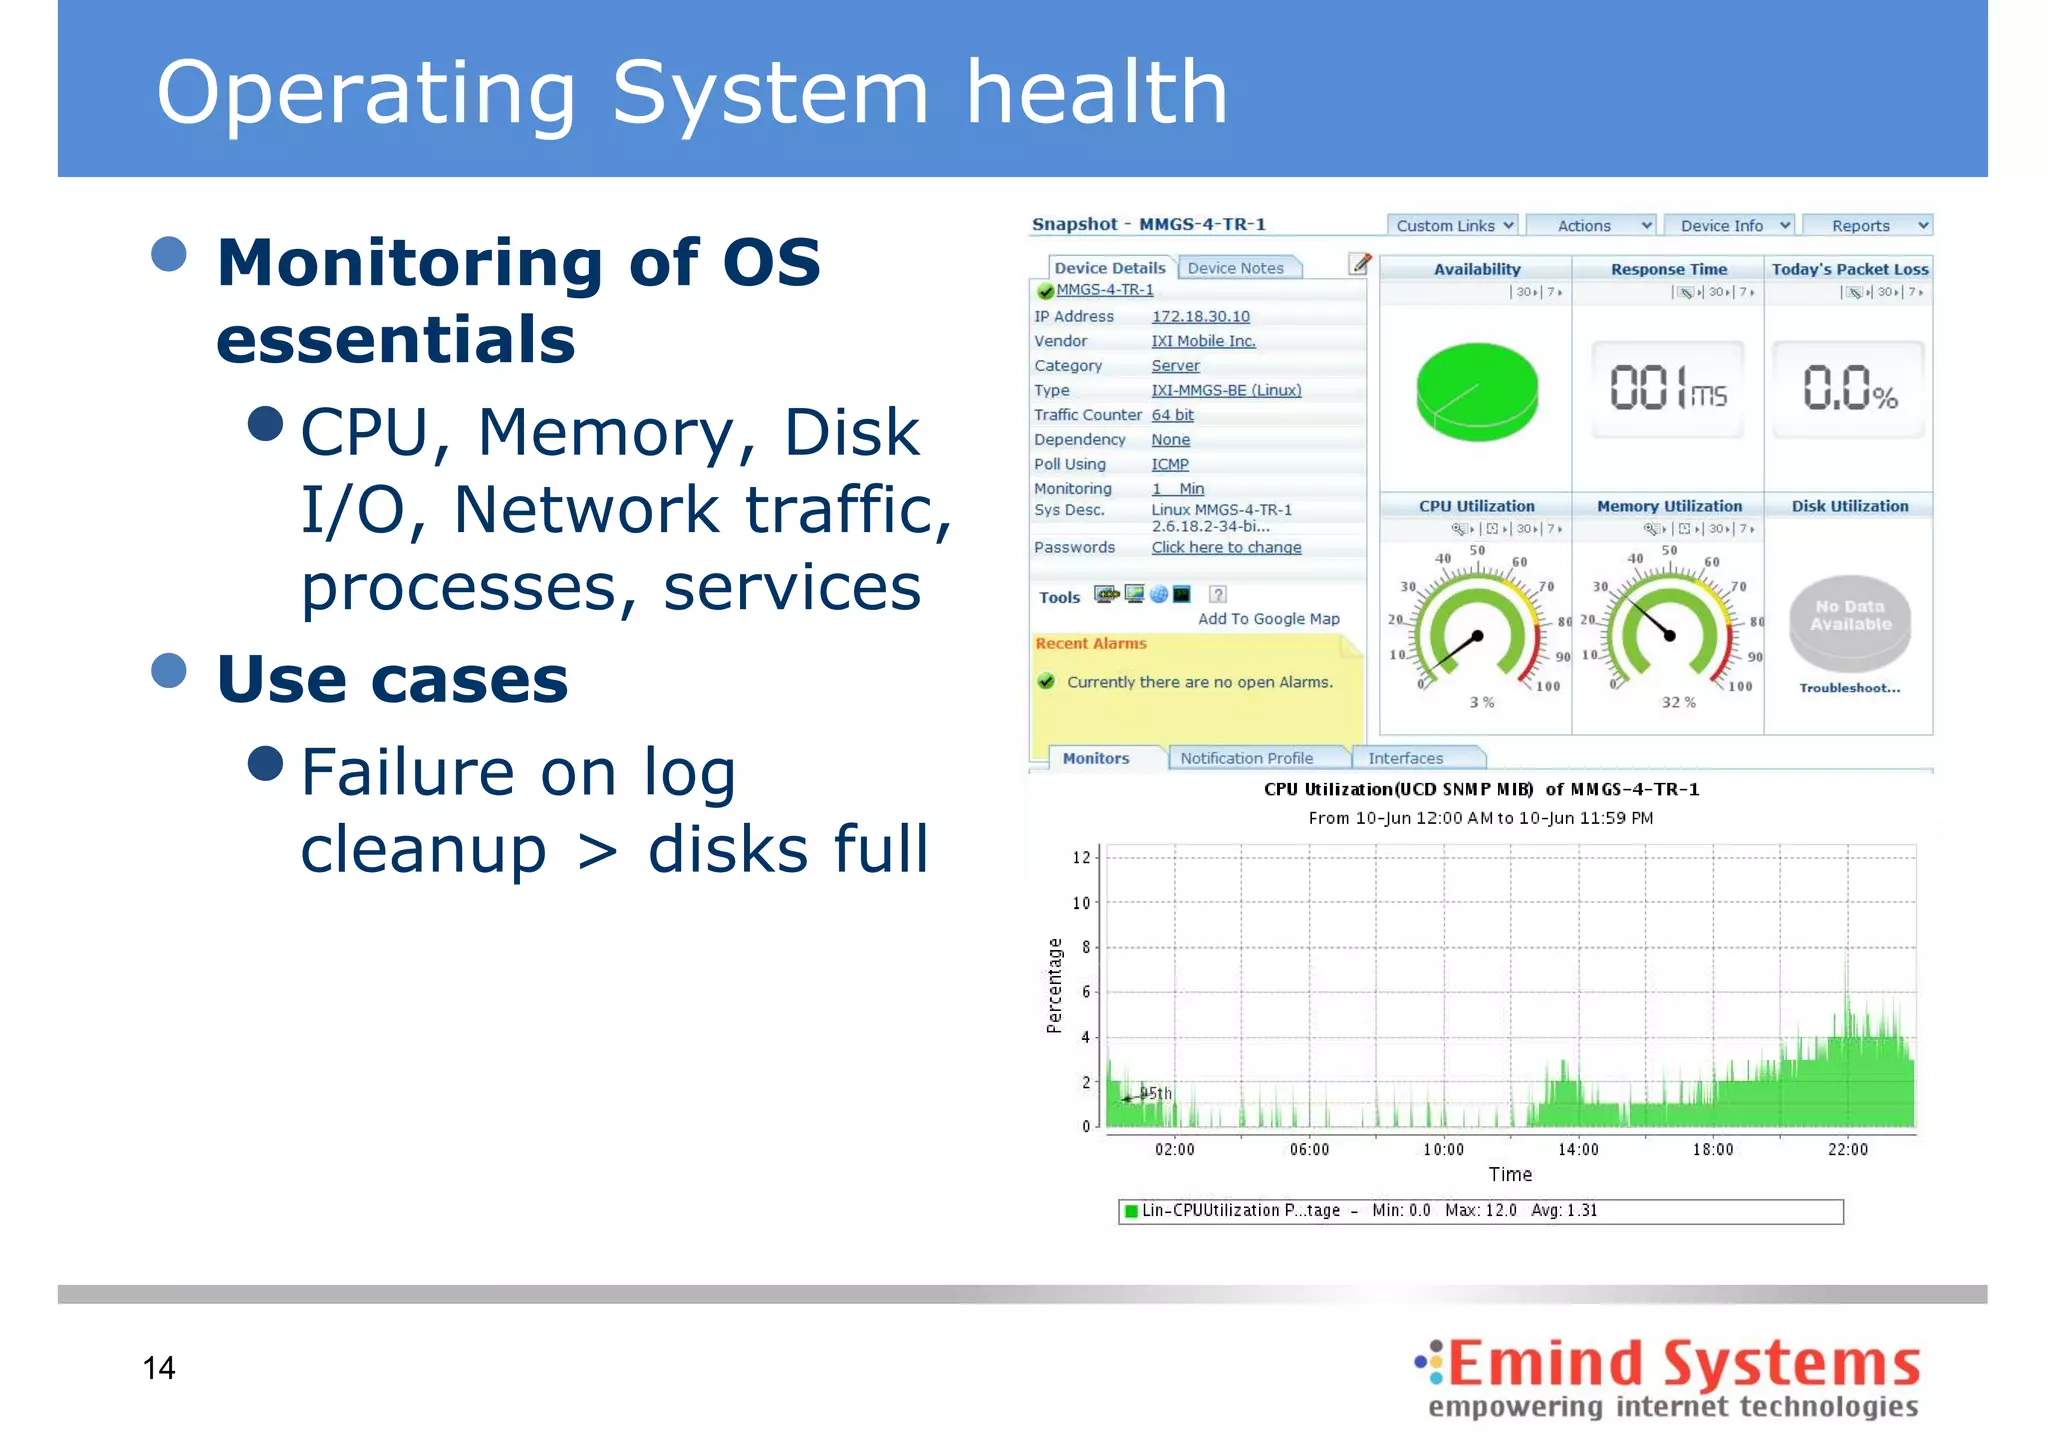
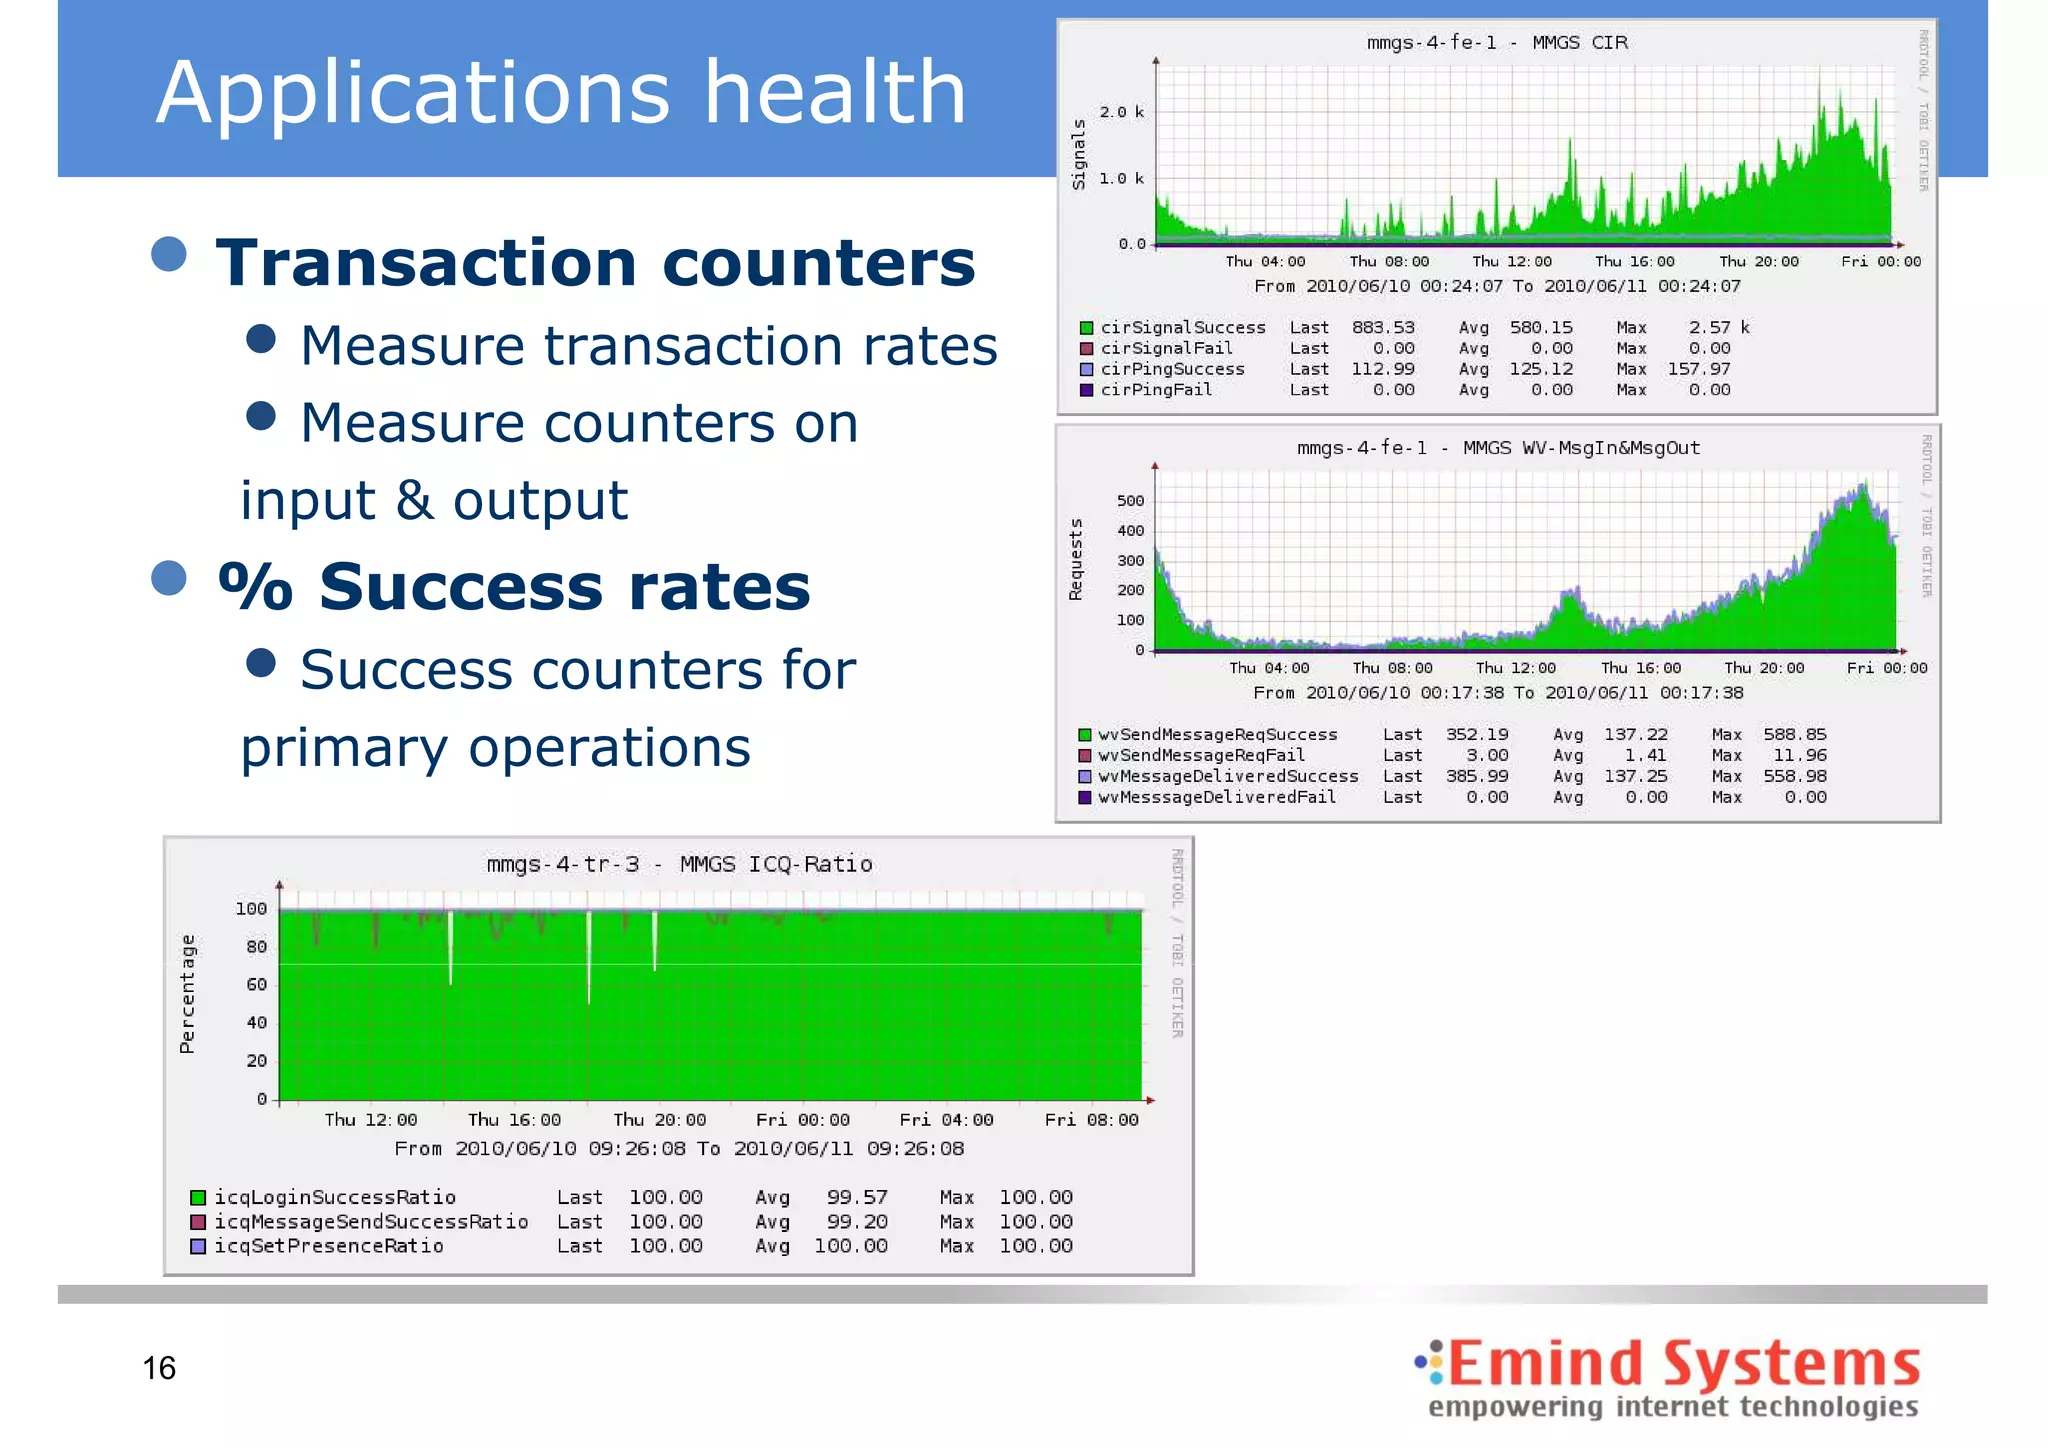
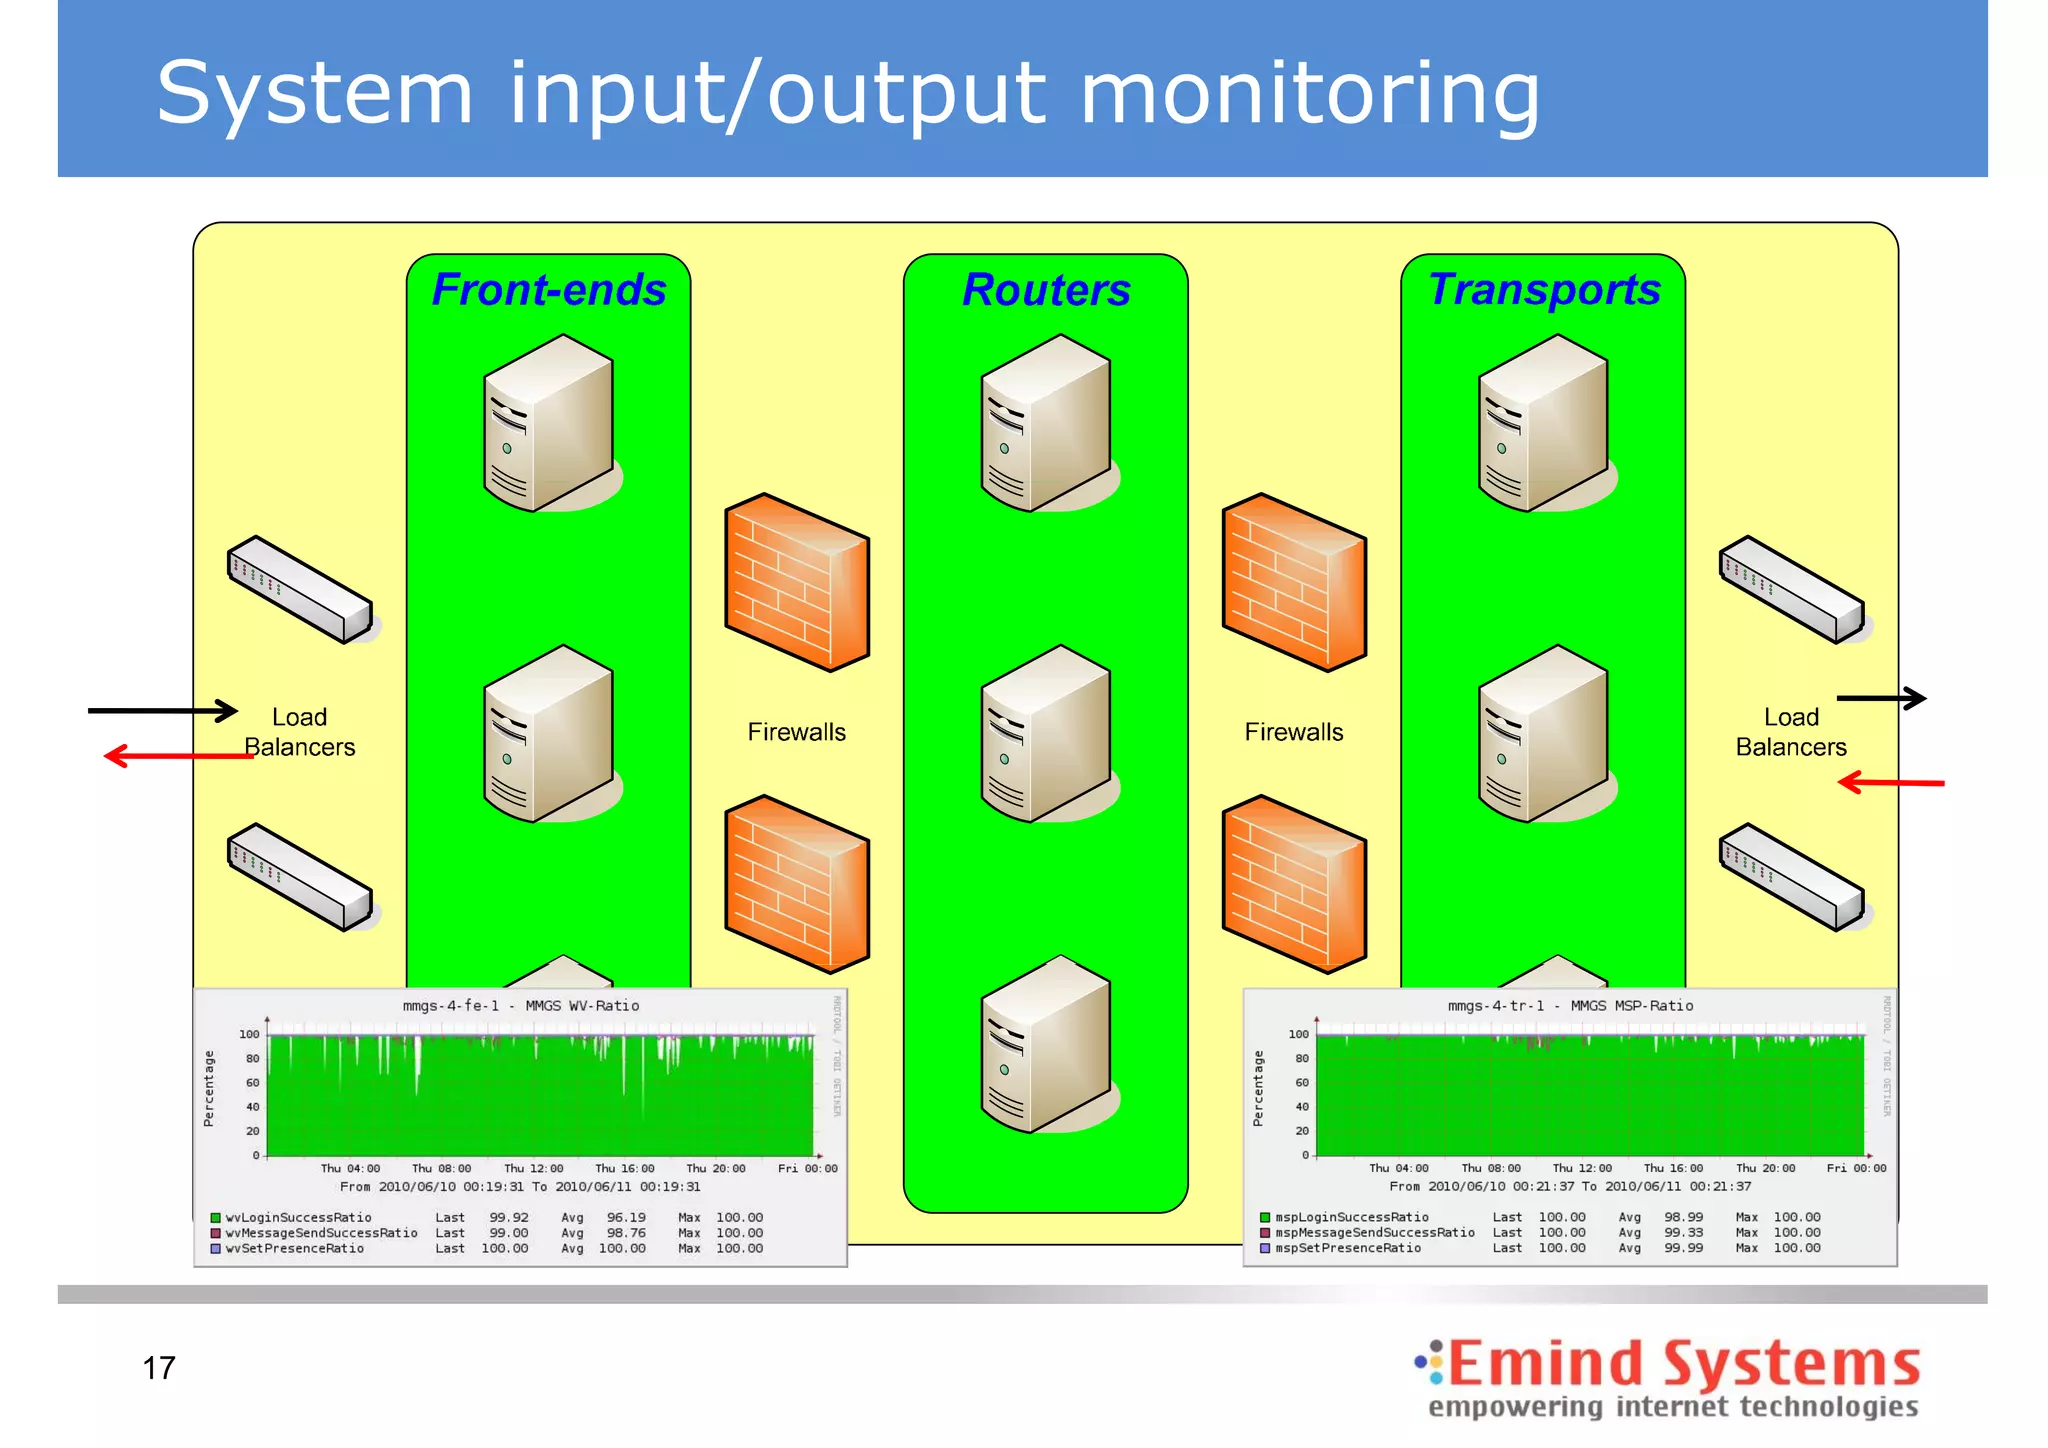
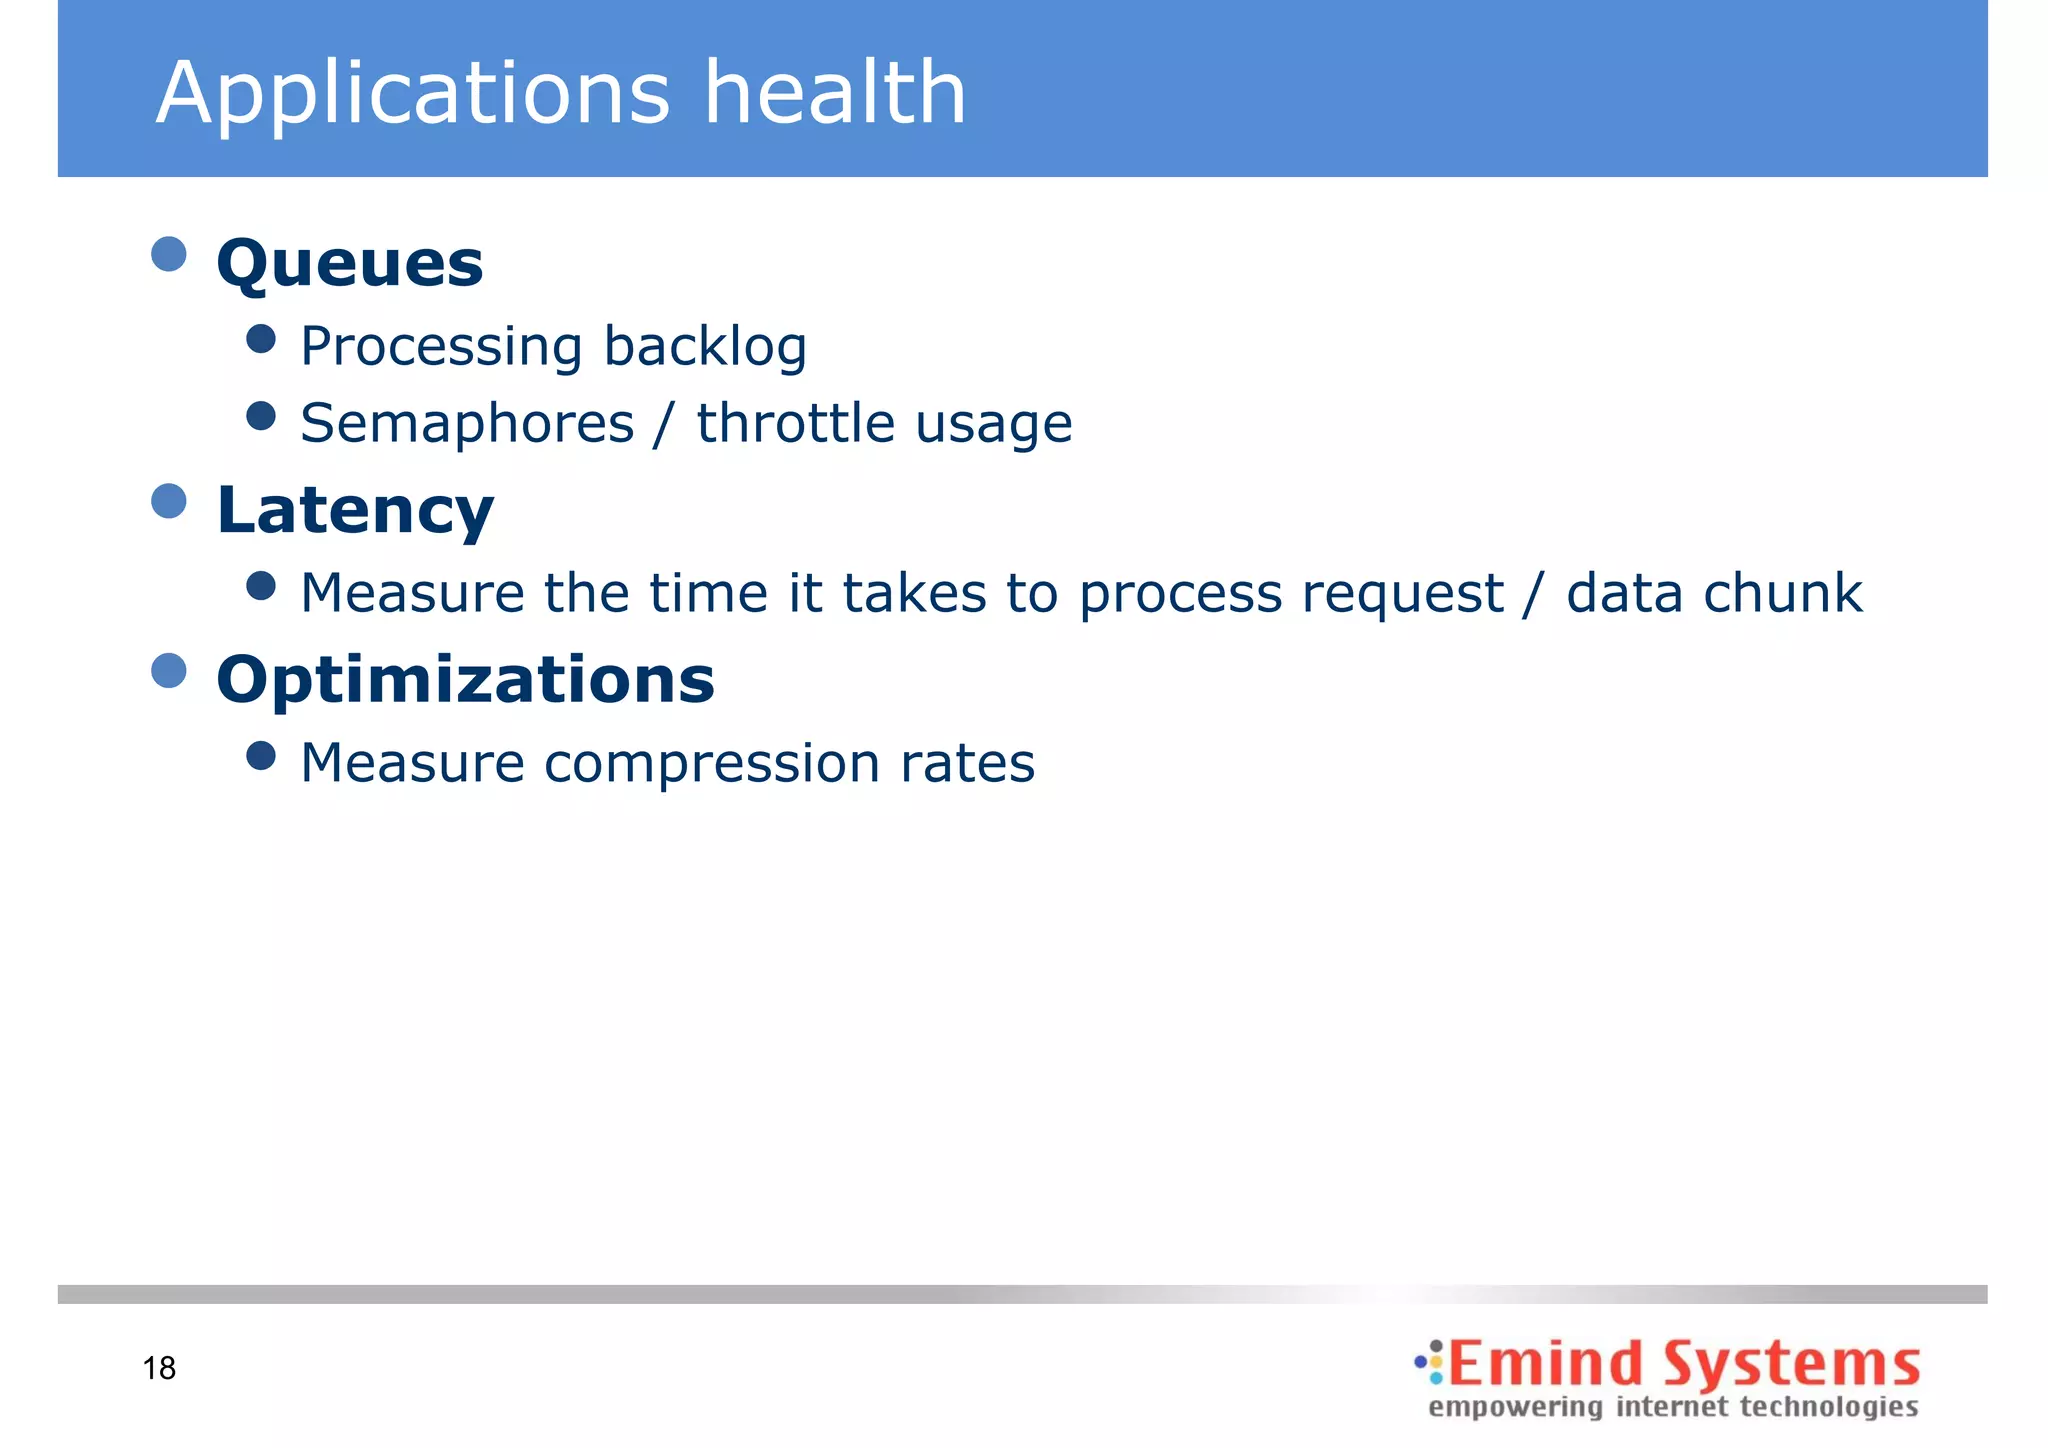
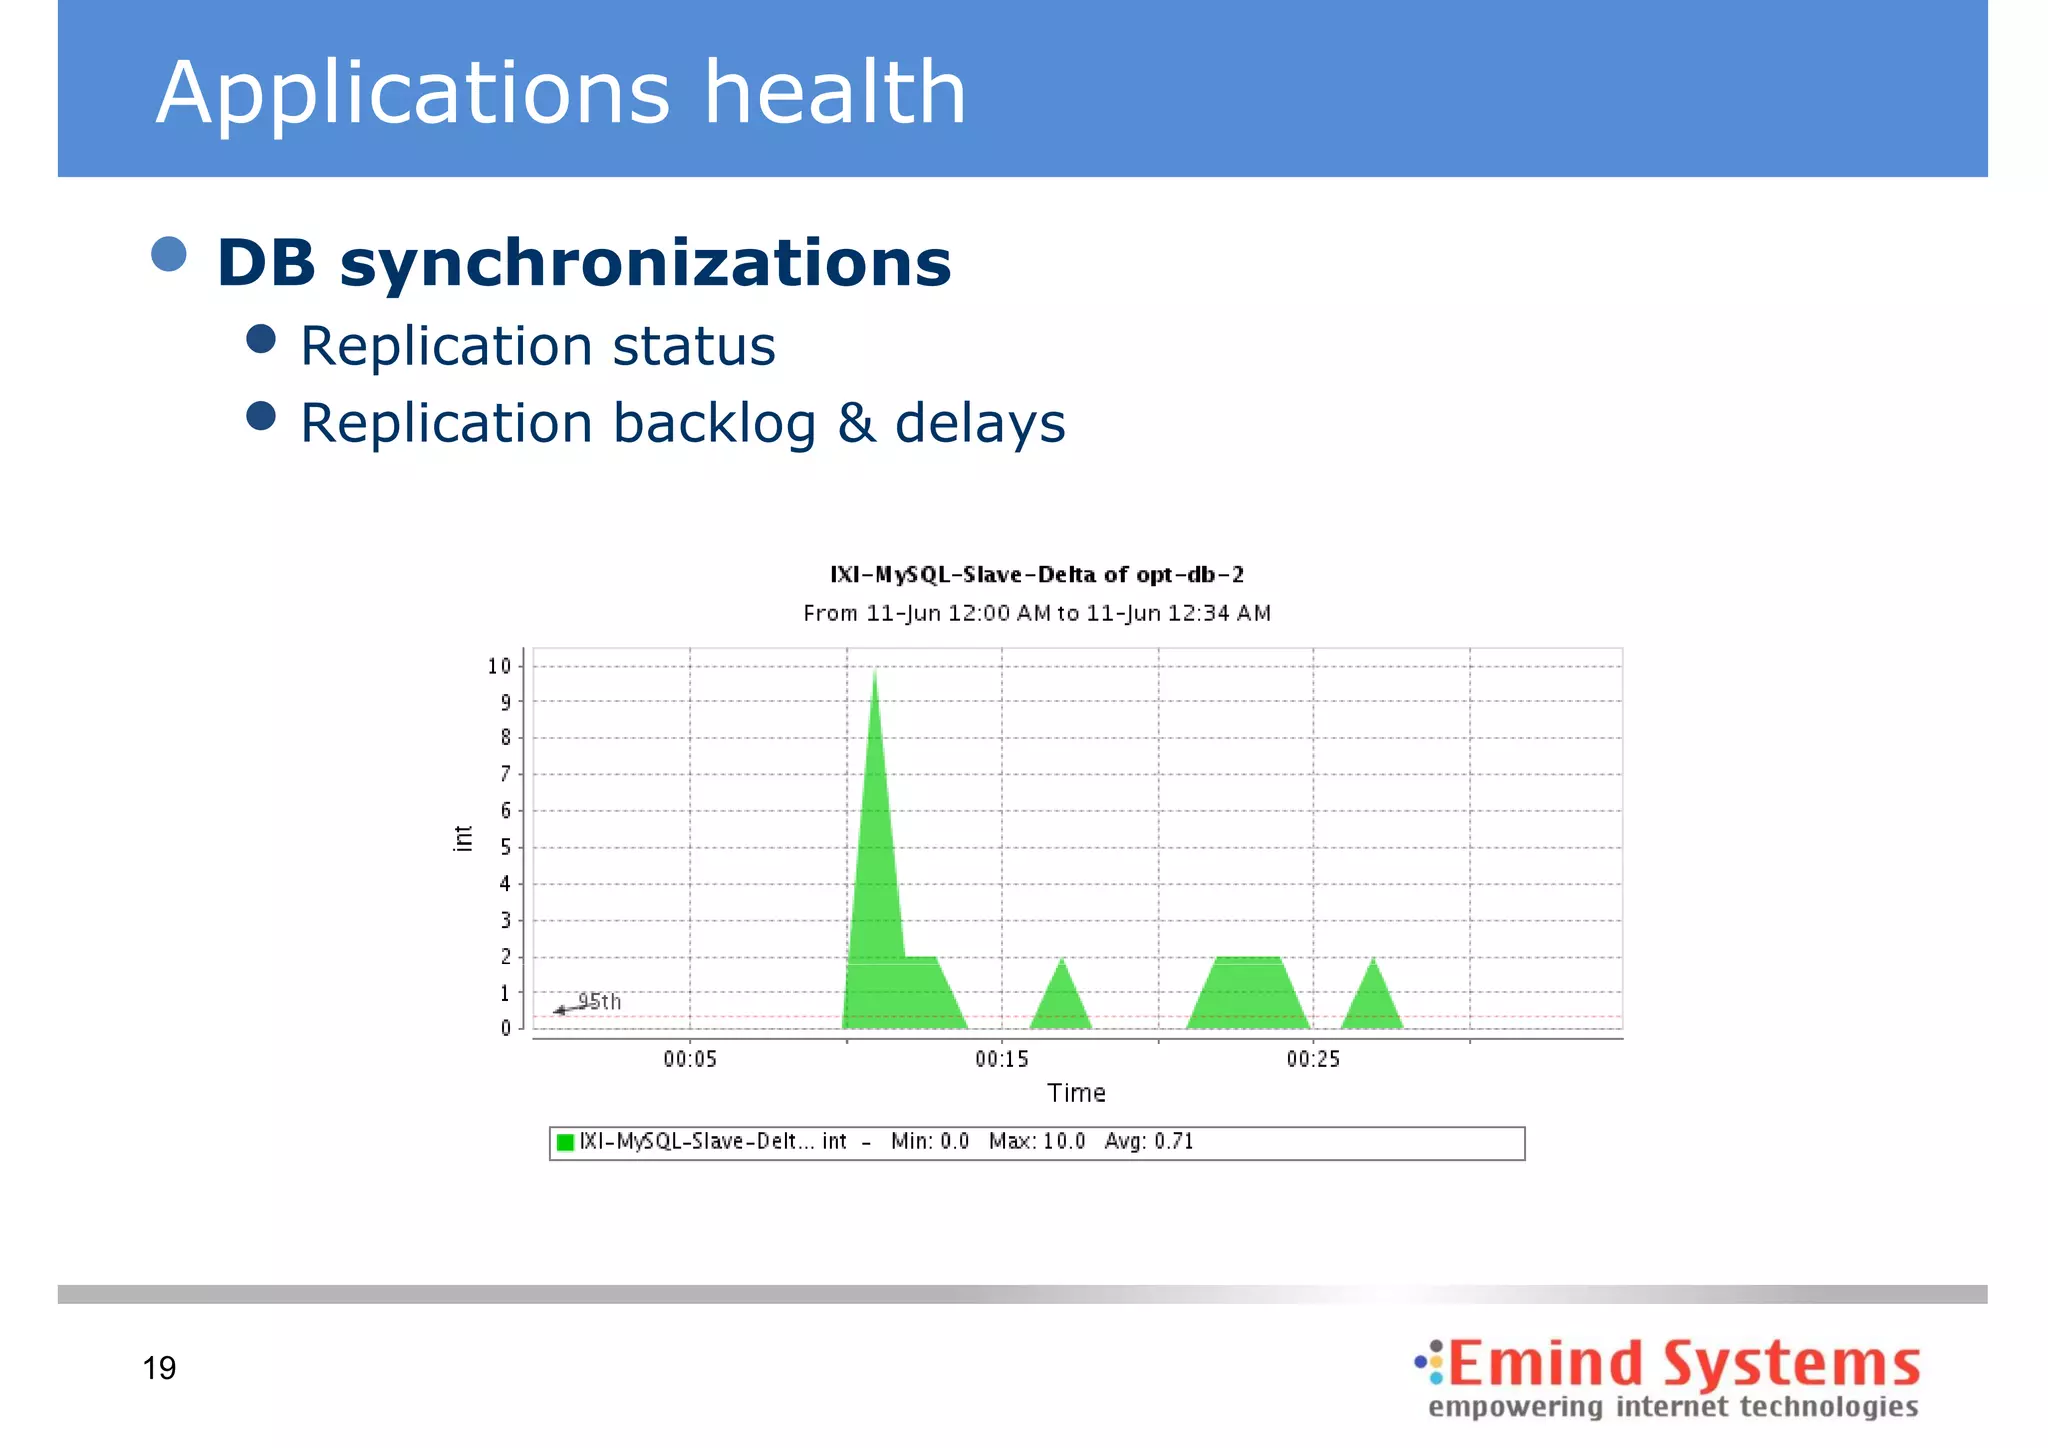
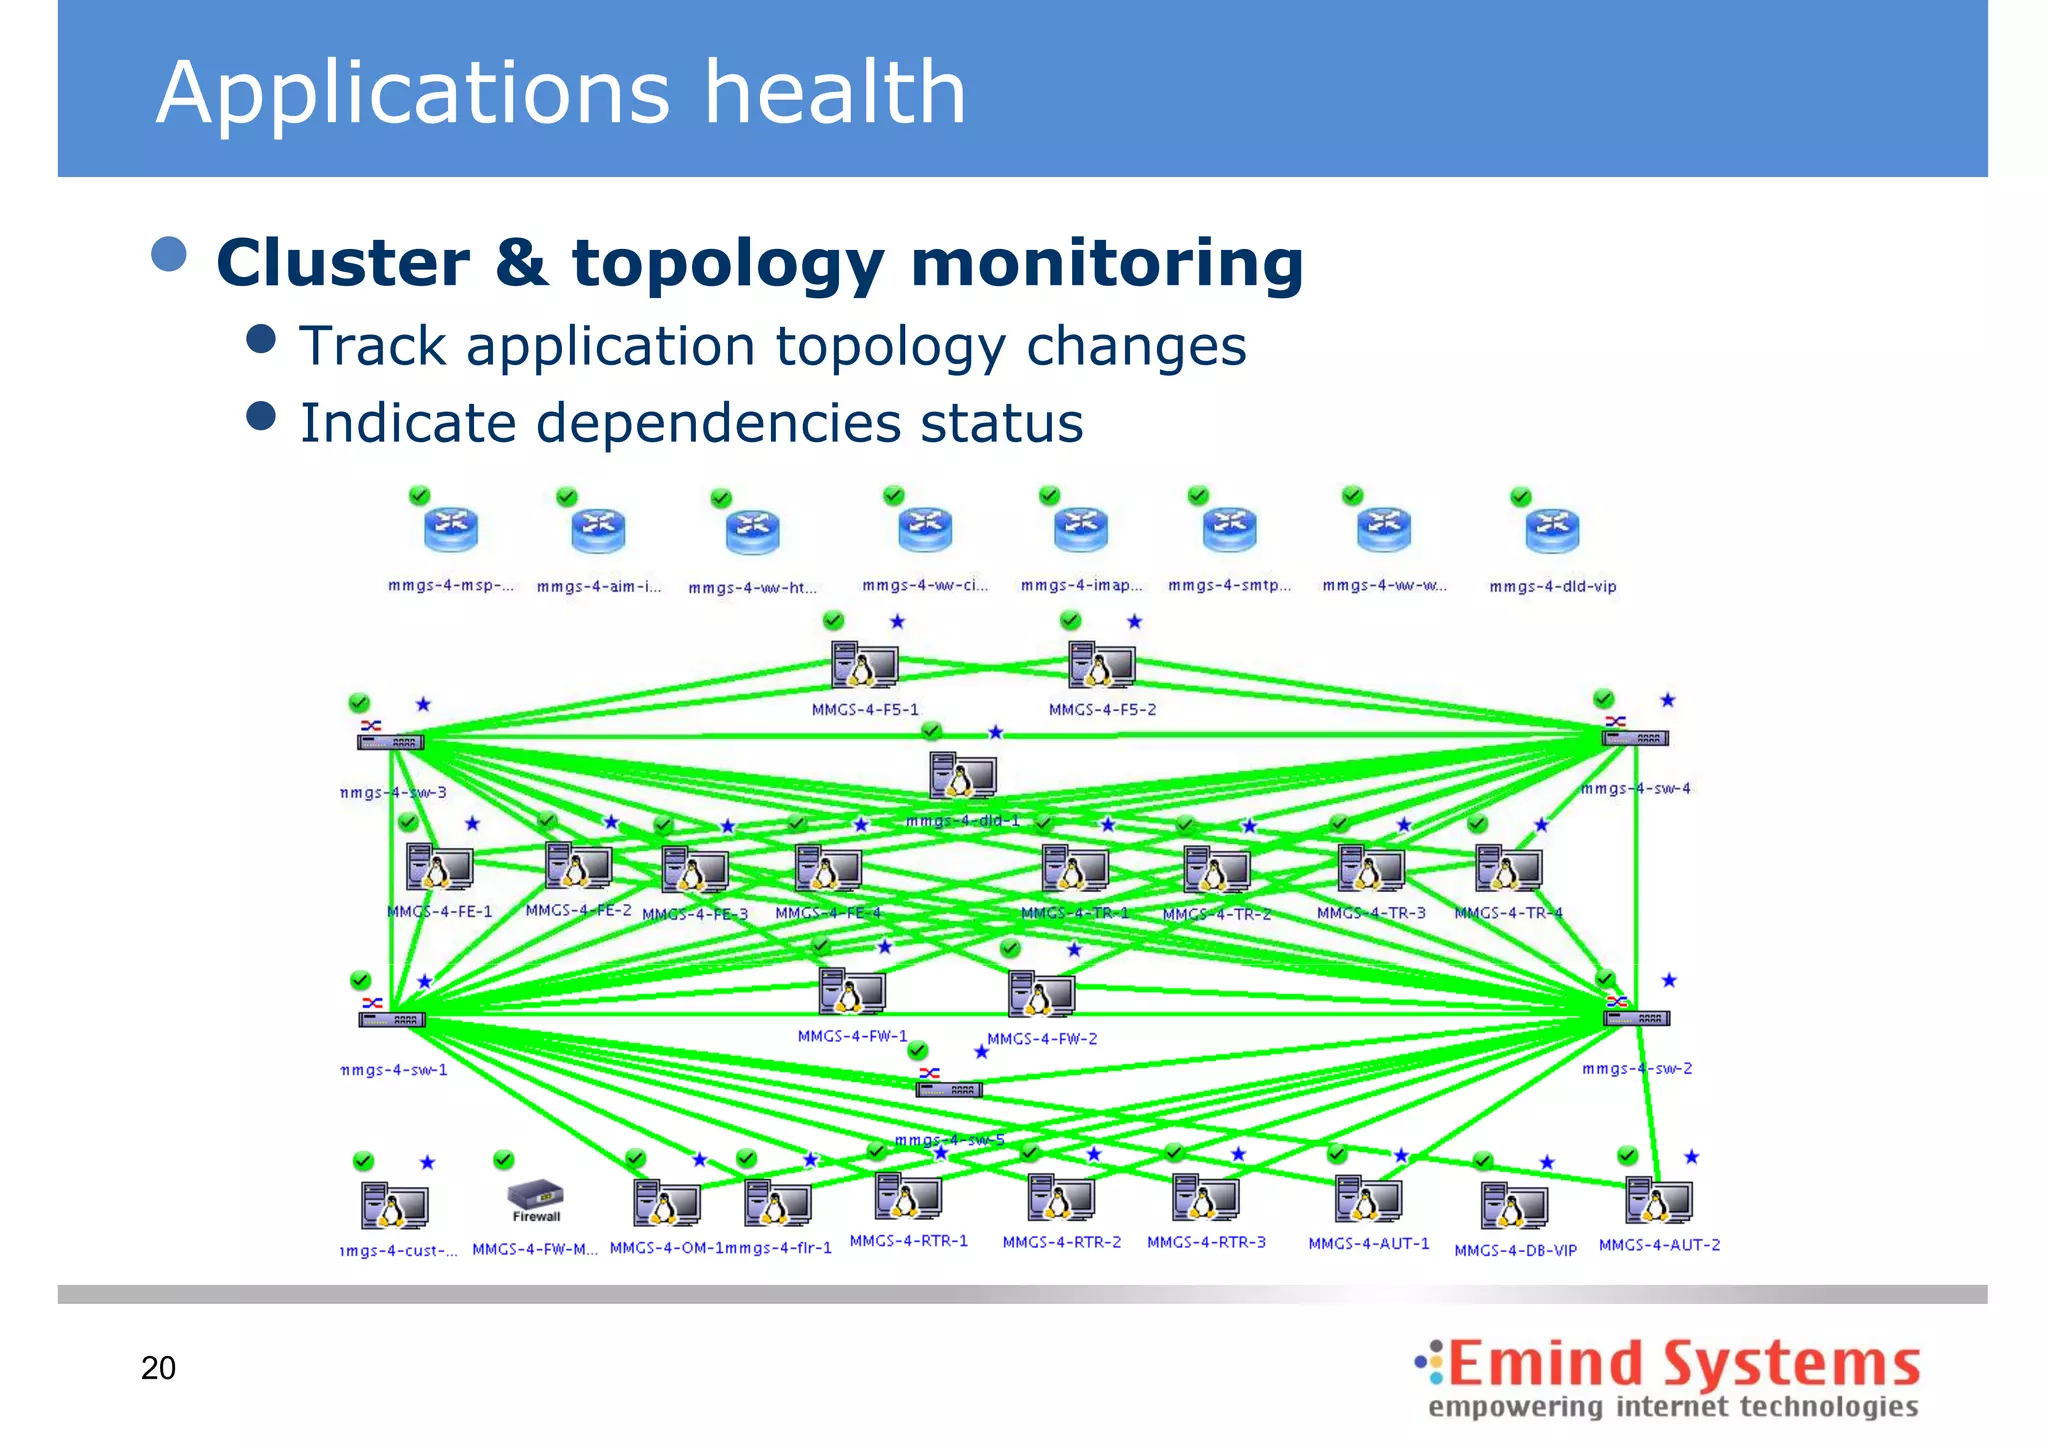
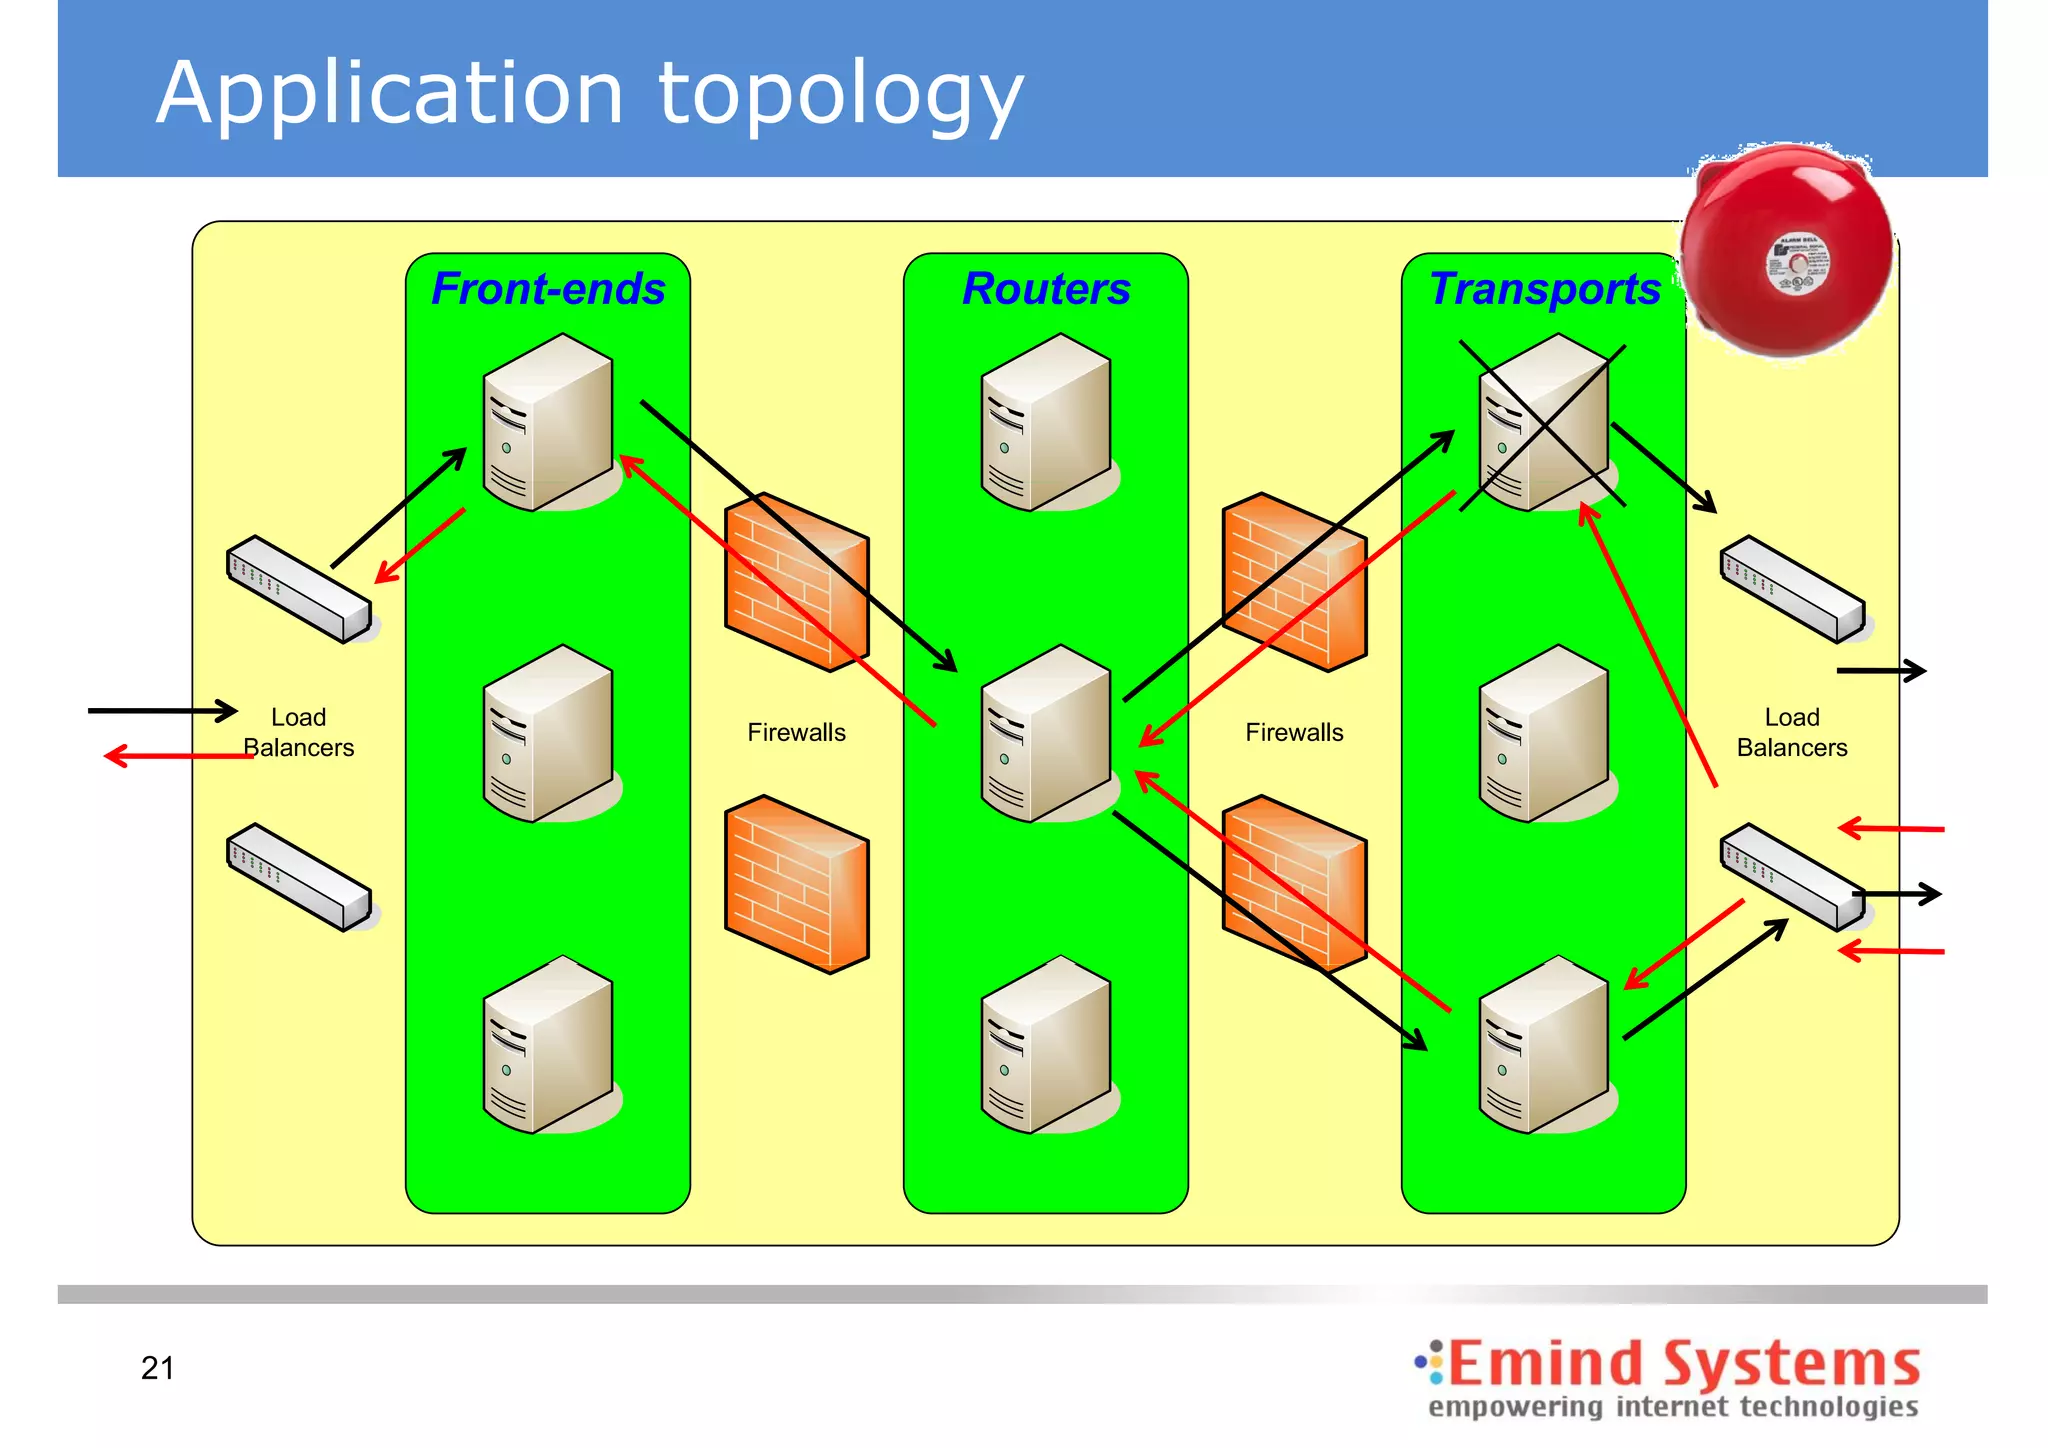
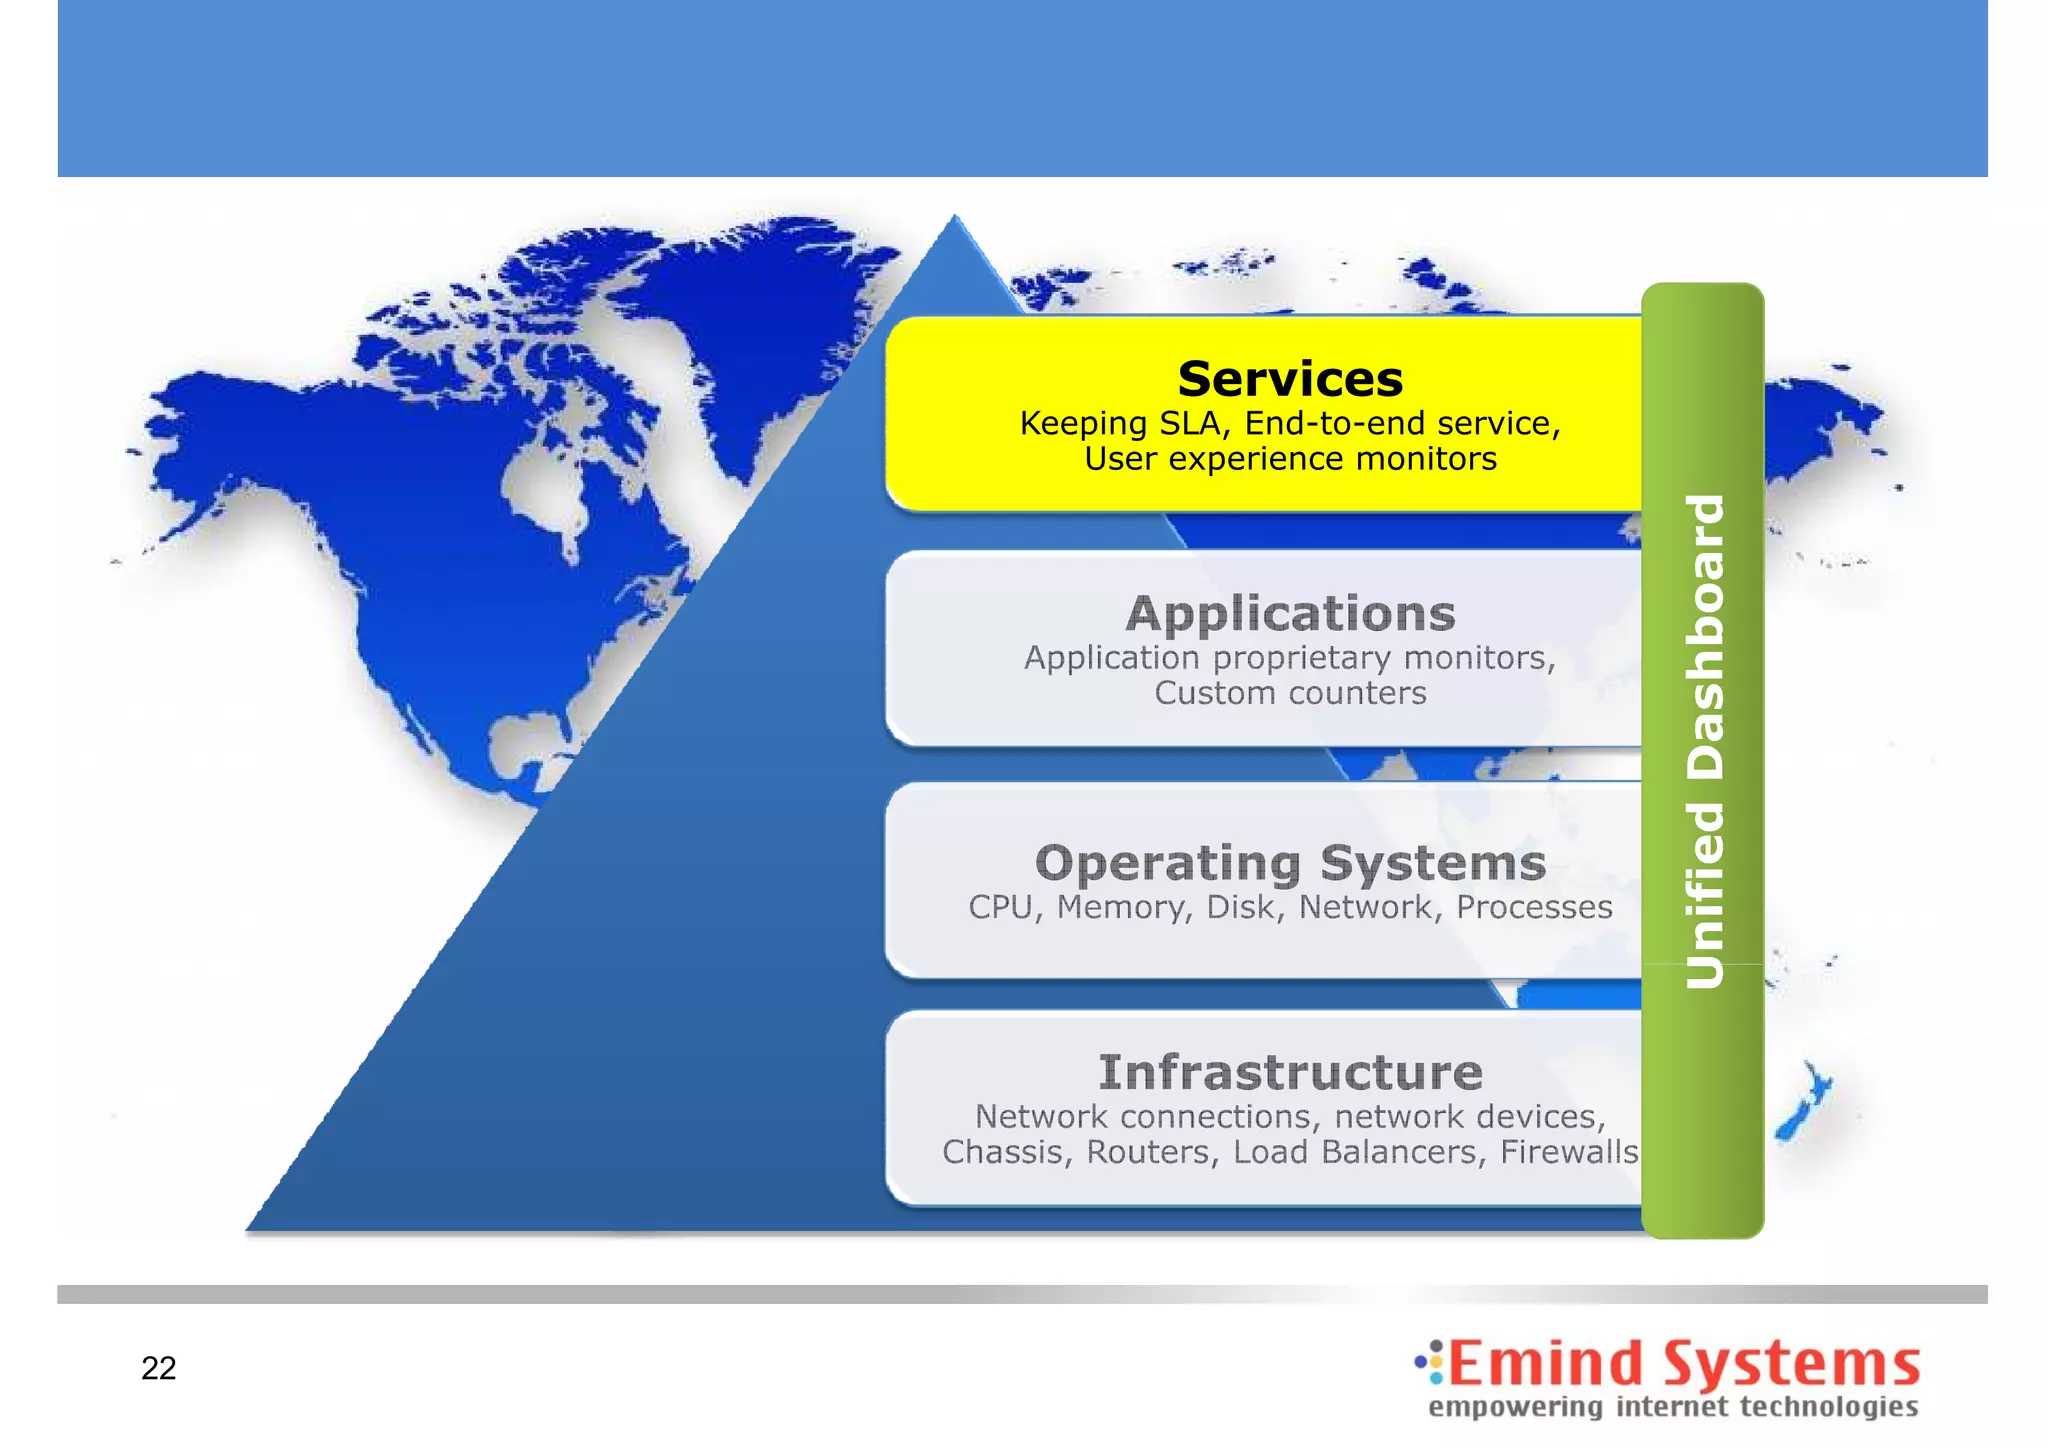
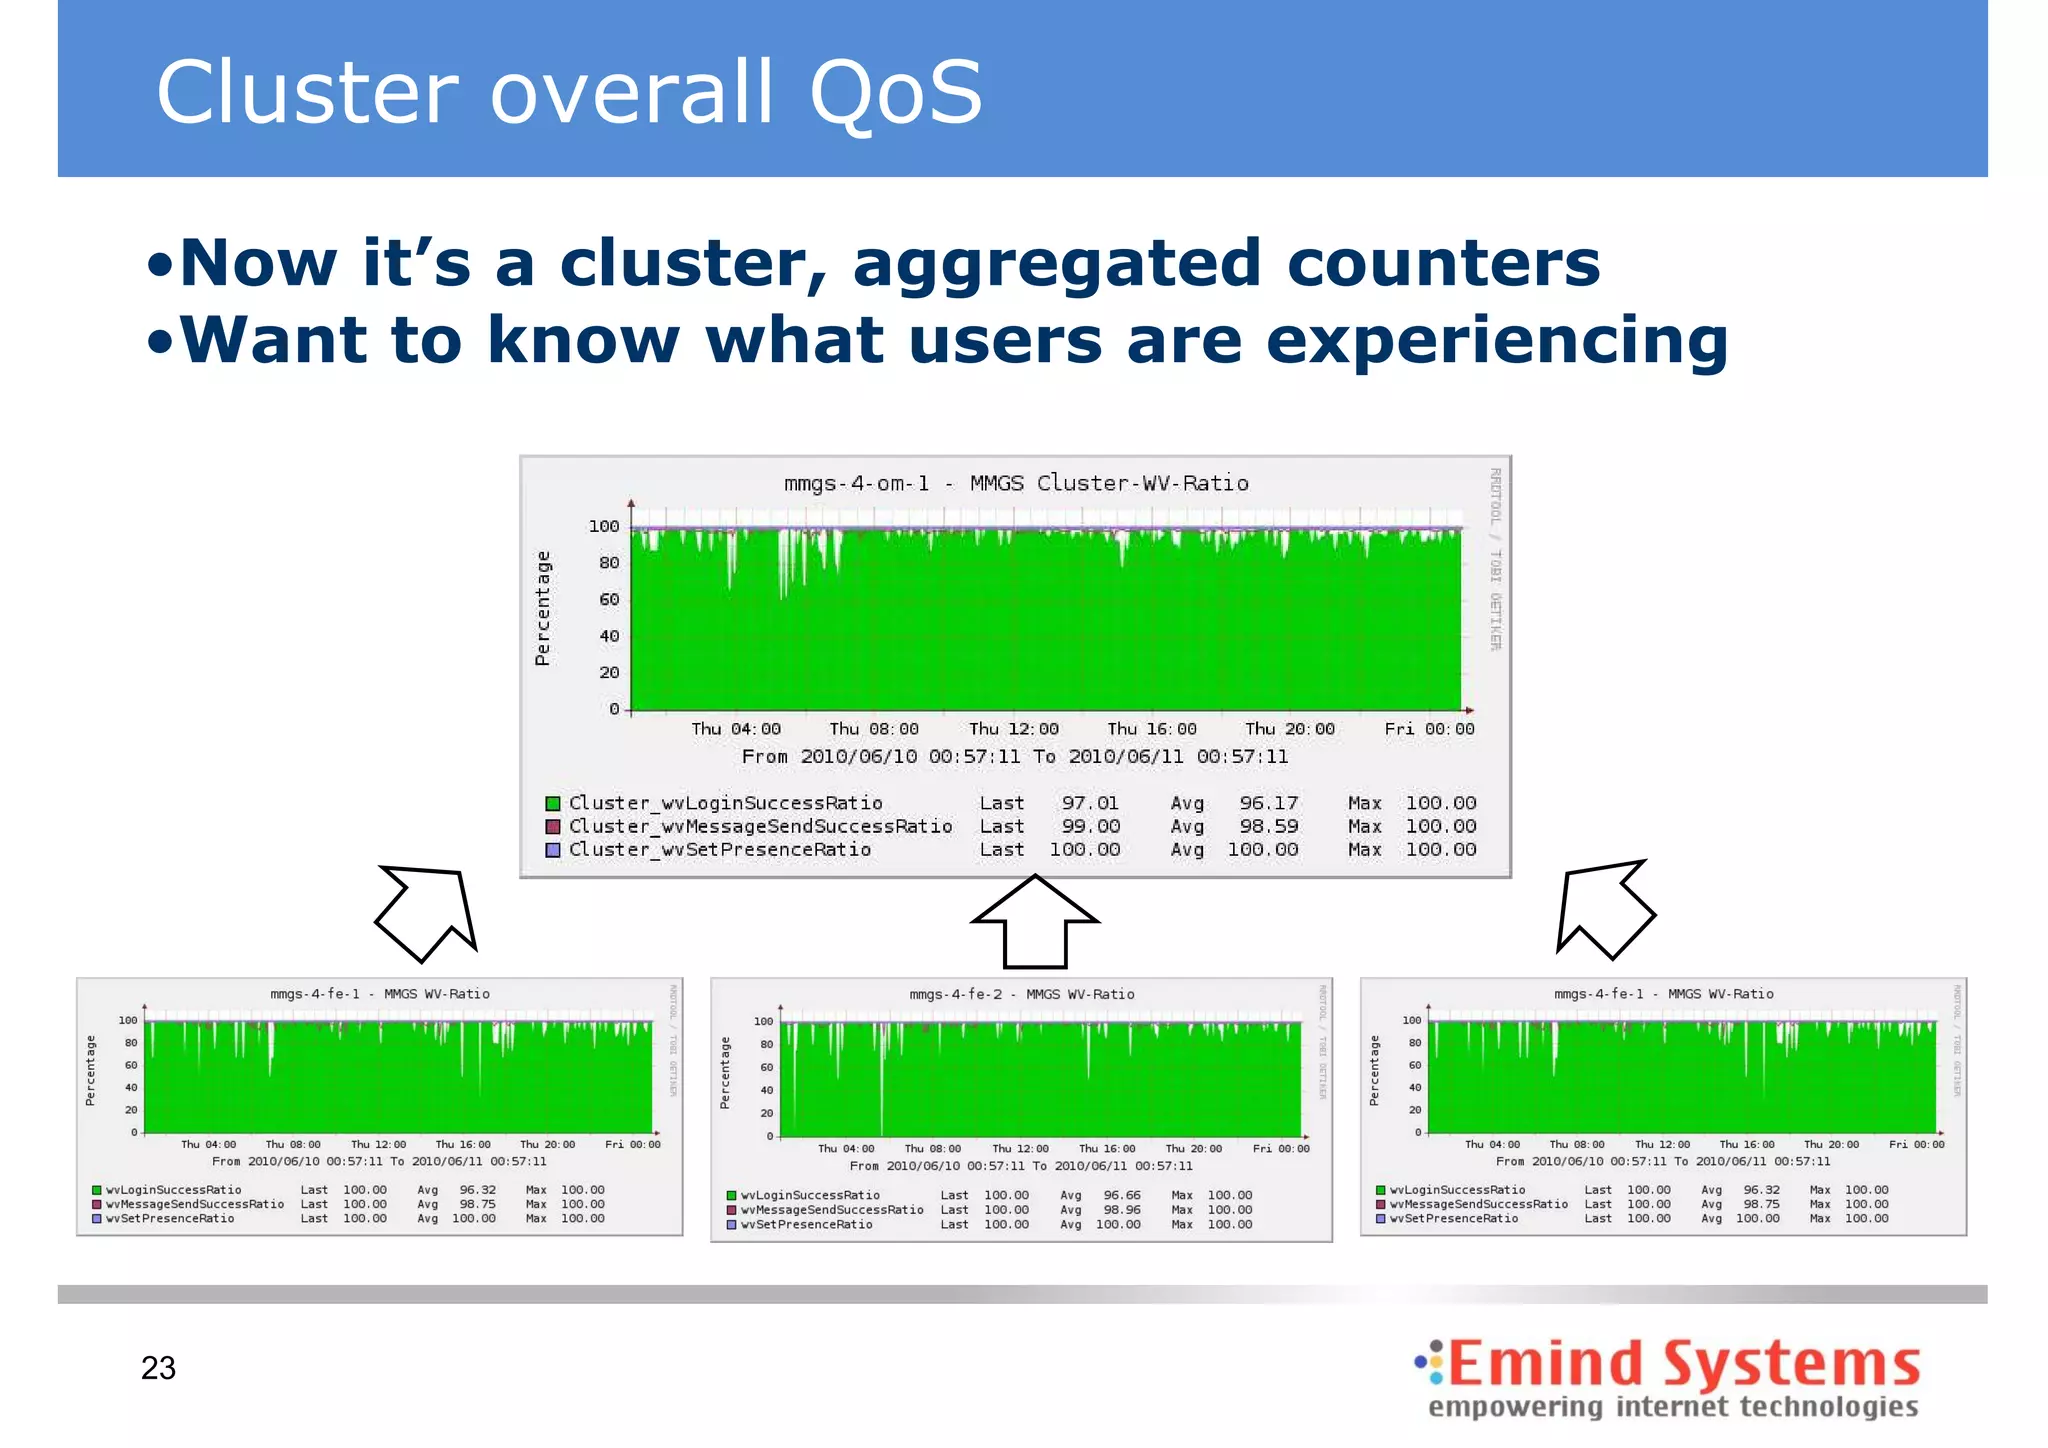
The document discusses maintaining non-stop services through multi-layered monitoring. It recommends monitoring each process, component and application separately as well as collectively to proactively identify and address problems. A multi-layered approach including monitoring services, applications, operating systems and infrastructure helps correlate information and troubleshoot issues. Visual dashboards can aggregate and display monitoring data across these layers to provide a unified view of system health and performance.


![[Webinar] AWS Monitoring with Site24x7](https://cdn.slidesharecdn.com/ss_thumbnails/site24x7-awsmonitoringwithsite24x704thnov2015-151105060402-lva1-app6891-thumbnail.jpg?width=600ounds&width=560&fit=bounds)


