Download as PDF, PPTX


![Standardization and Normalization (4)
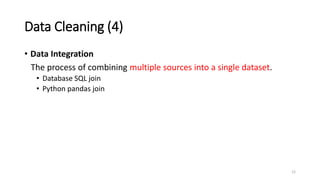
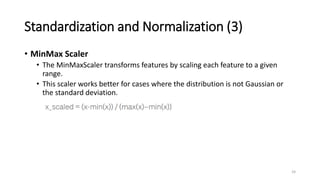
• MaxAbs Scaler
• The MaxAbsScaler works very similarly to the MinMaxScaler but automatically
scales the data to a [-1,1] range based on the absolute maximum.
25](https://image.slidesharecdn.com/1overviewofdataprocessing-211030044738/85/overview-of_data_processing-25-320.jpg)

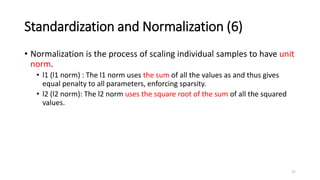


![Standardization and Normalization (4)
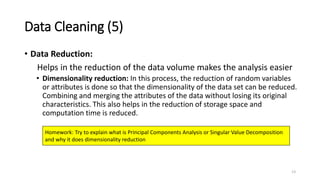
• MaxAbs Scaler
• The MaxAbsScaler works very similarly to the MinMaxScaler but automatically
scales the data to a [-1,1] range based on the absolute maximum.
25](https://image.slidesharecdn.com/1overviewofdataprocessing-211030044738/75/overview-of_data_processing-25-2048.jpg)


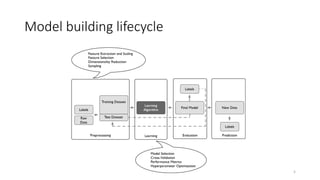
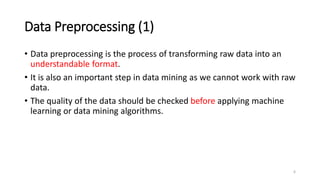
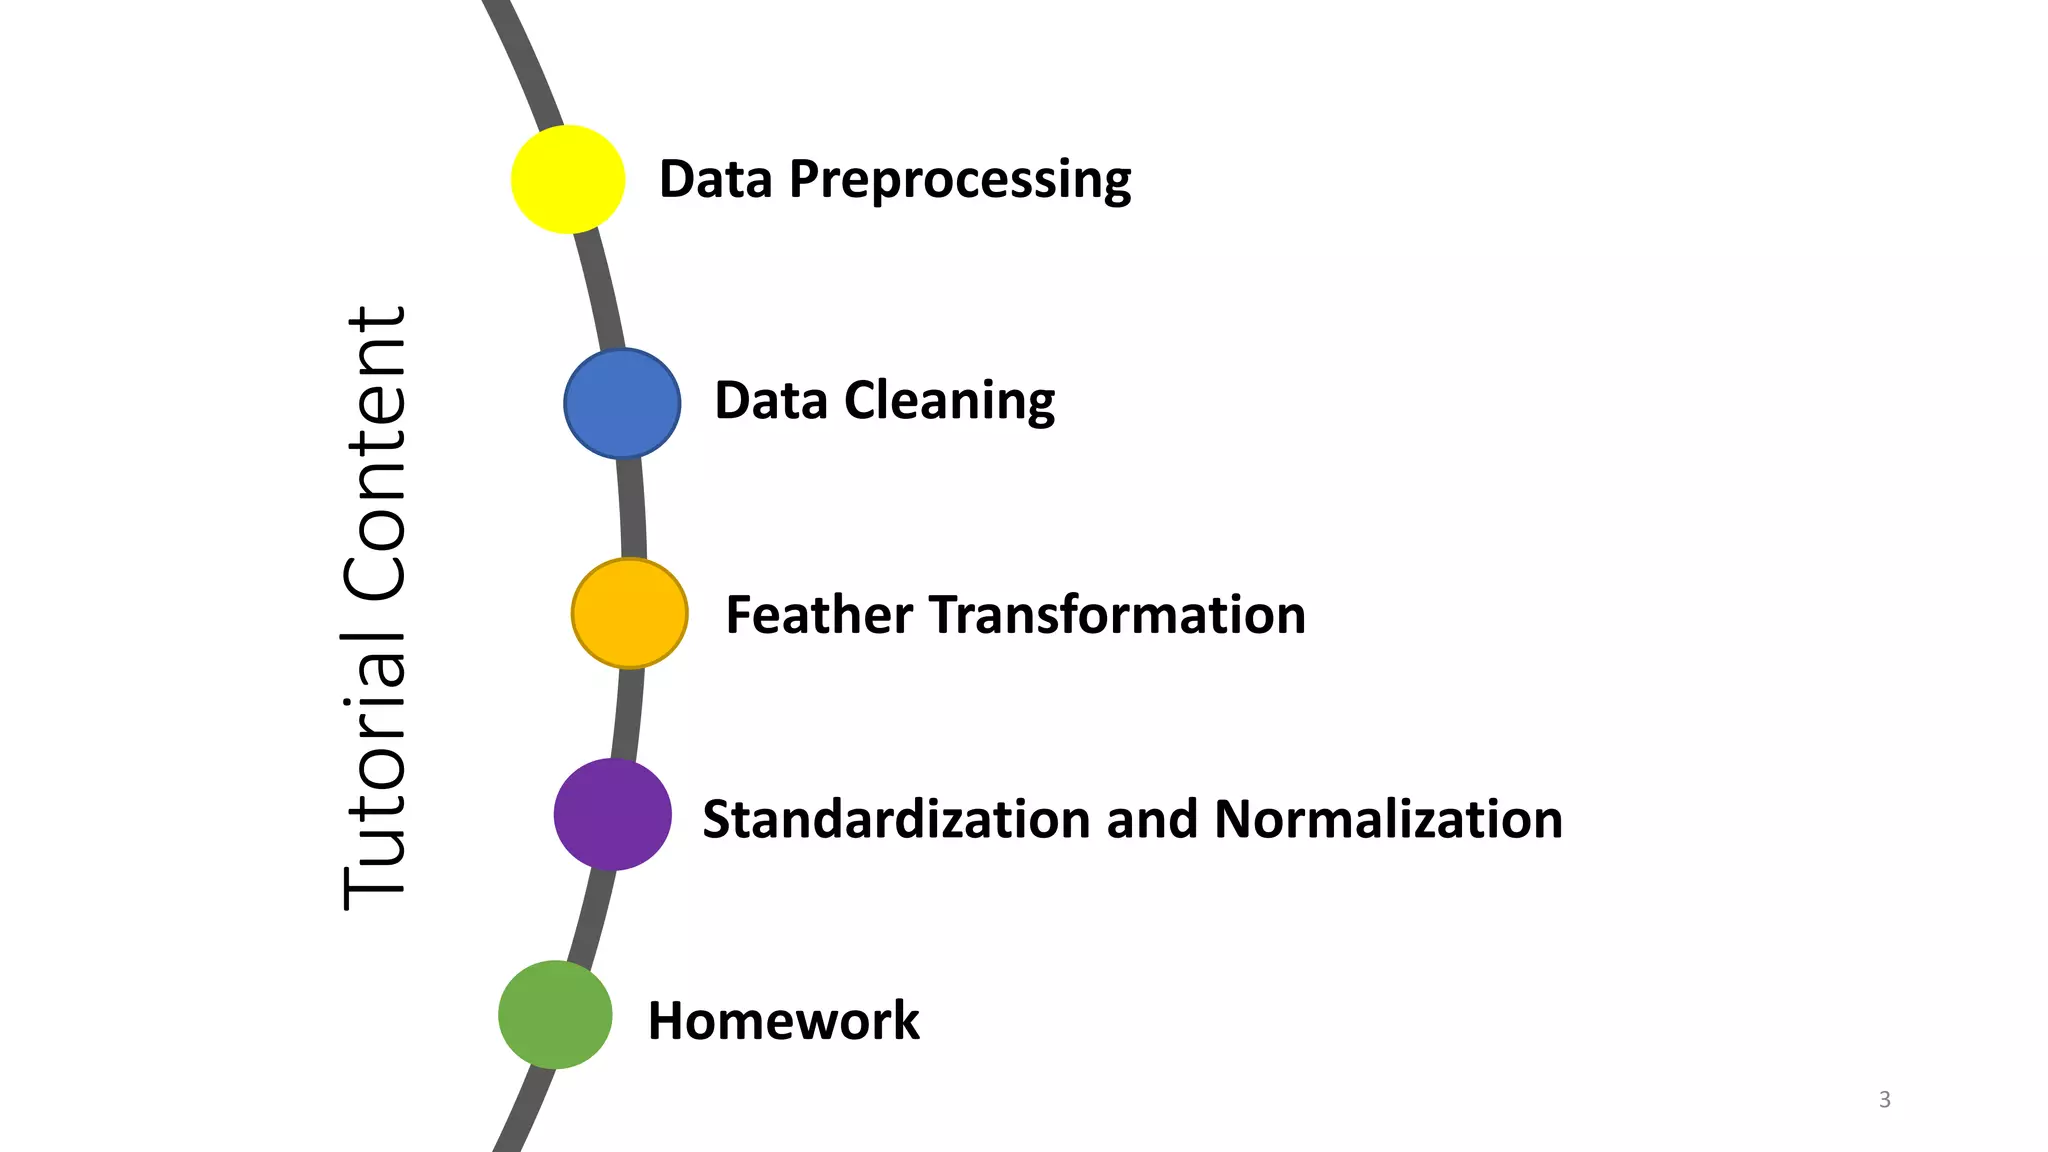
The document provides an overview of key concepts in data preprocessing including data cleaning, feature transformation, standardization and normalization. It discusses techniques such as handling missing values, binning noisy data, dimensionality reduction, discretizing continuous features, and different scaling methods like standardization, min-max scaling and robust scaling. Code examples are provided to demonstrate these preprocessing techniques on various datasets. Homework includes explaining z-score standardization and dimensionality reduction, and preprocessing the Titanic dataset through cleaning, standardization and normalization.


