Download to read offline


![PARSEC WP2: decisions via a CNN*
•
convolutions
Average or max [+ sub-sampling]
Non linear function
(= activation function)
normalisation
*Convolutional Neural Network](https://image.slidesharecdn.com/parsec191119slideshare-191204225231/85/Parsec-191119-slideshare-36-320.jpg)


![PARSEC WP2: decisions via a CNN*
•
convolutions
Average or max [+ sub-sampling]
Non linear function
(= activation function)
normalisation
*Convolutional Neural Network](https://image.slidesharecdn.com/parsec191119slideshare-191204225231/75/Parsec-191119-slideshare-36-2048.jpg)


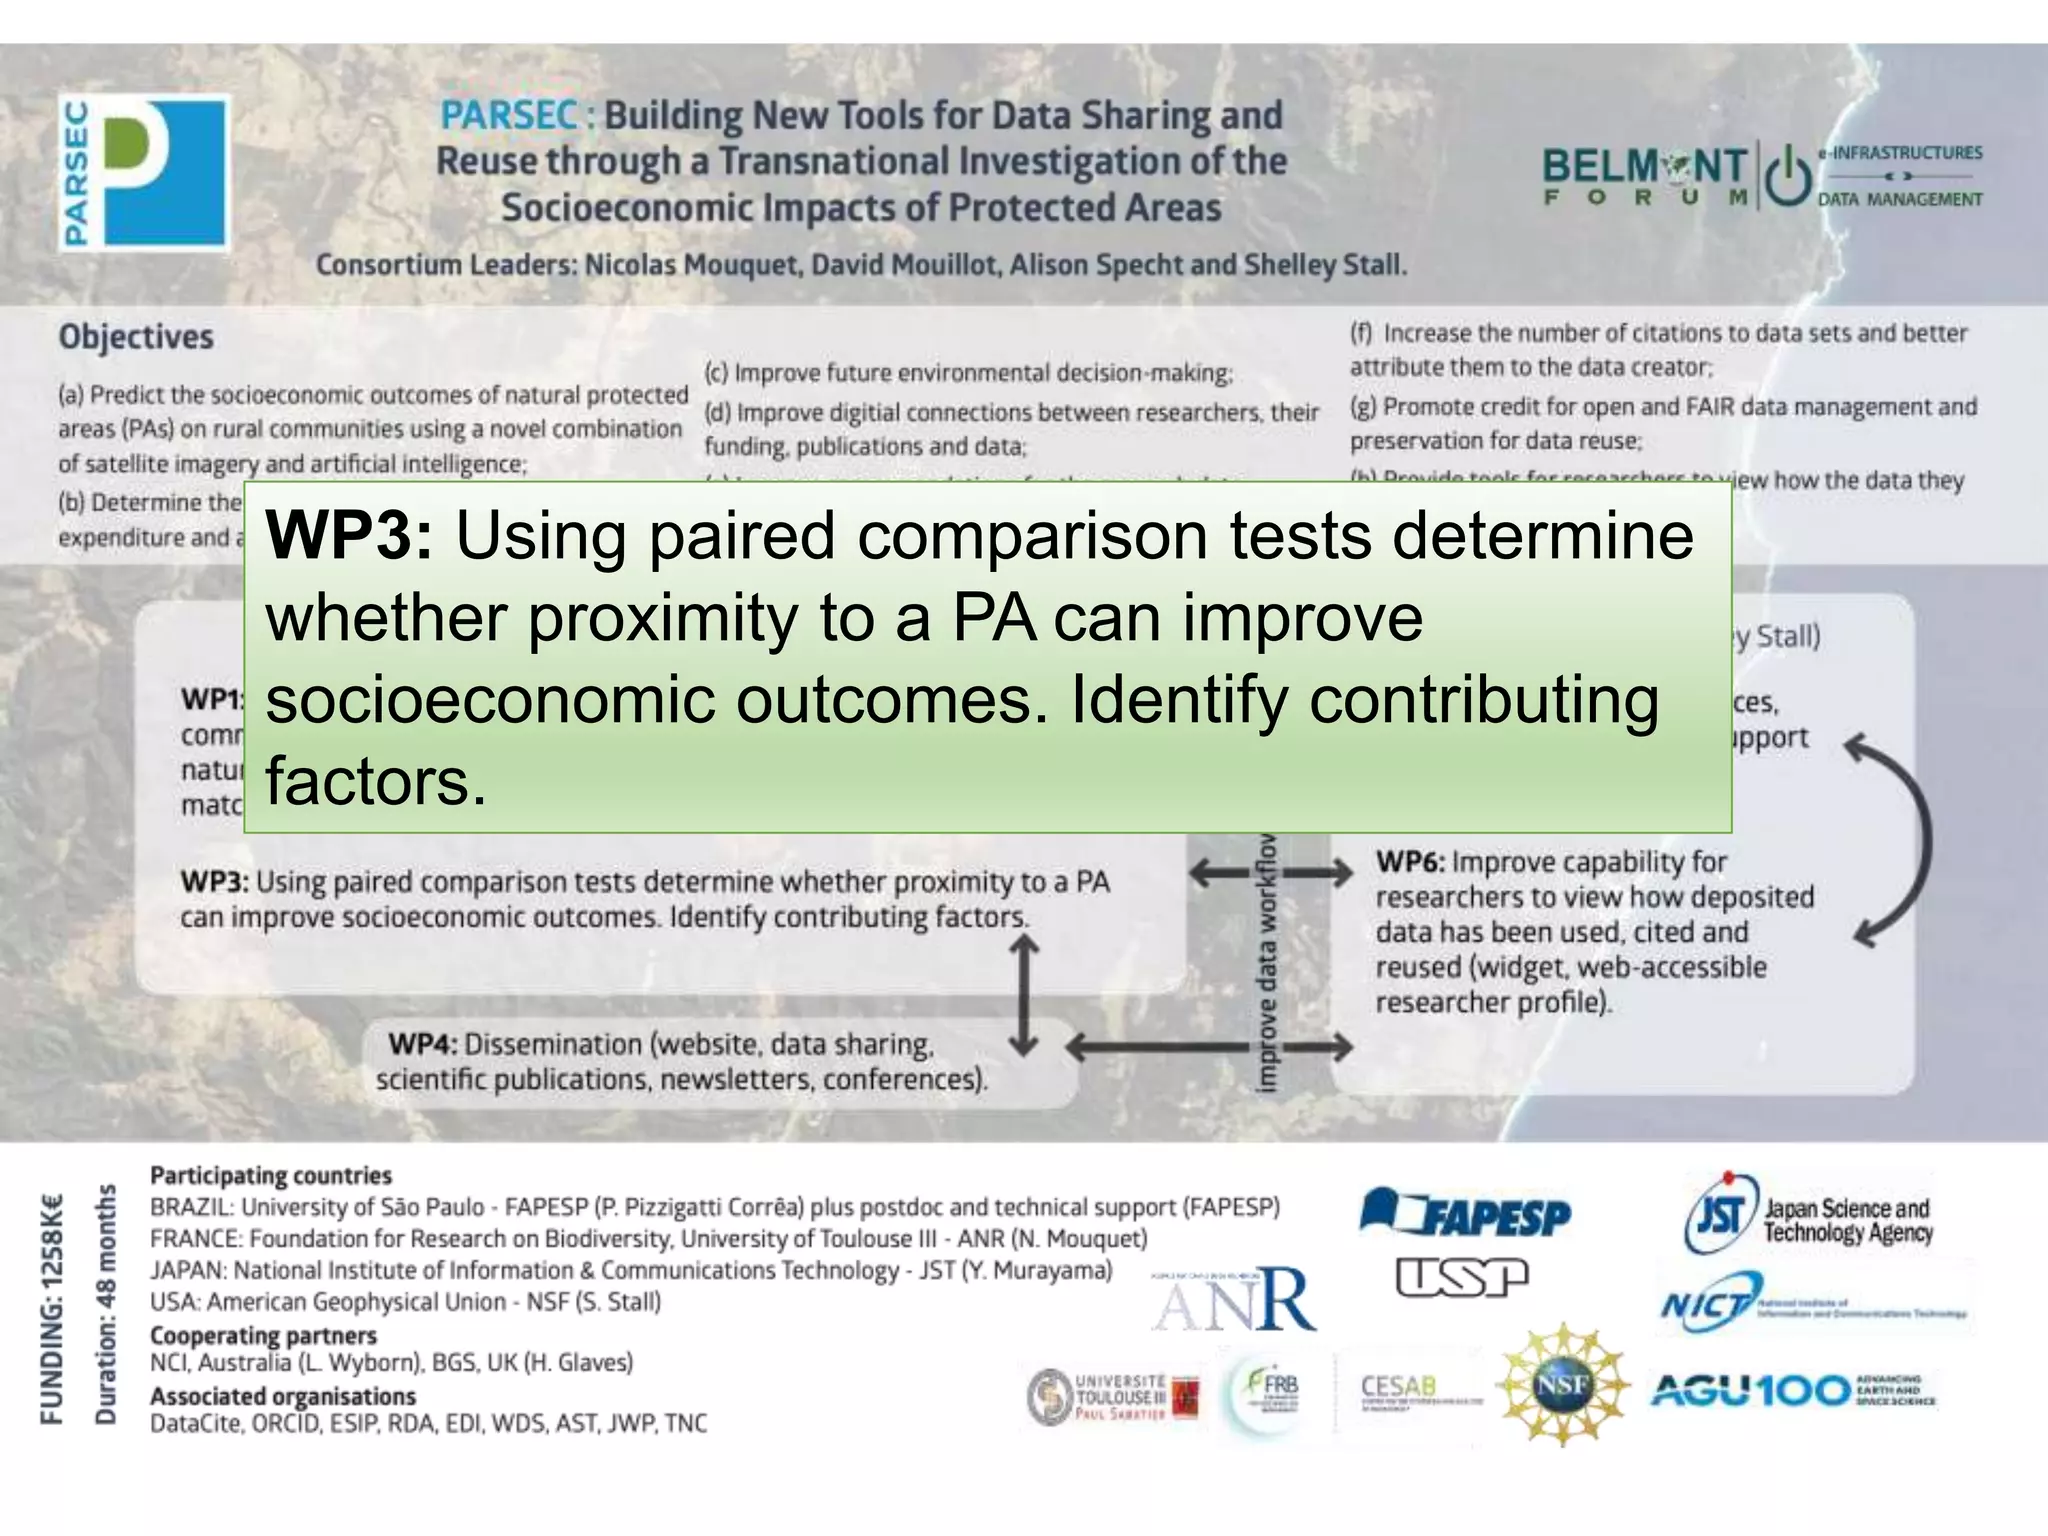


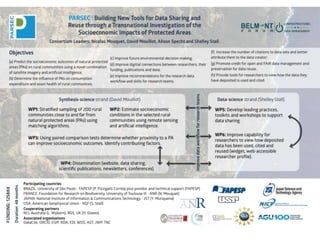
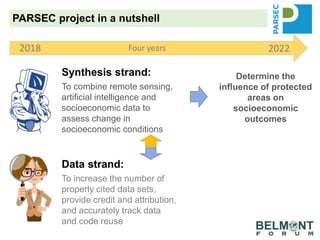
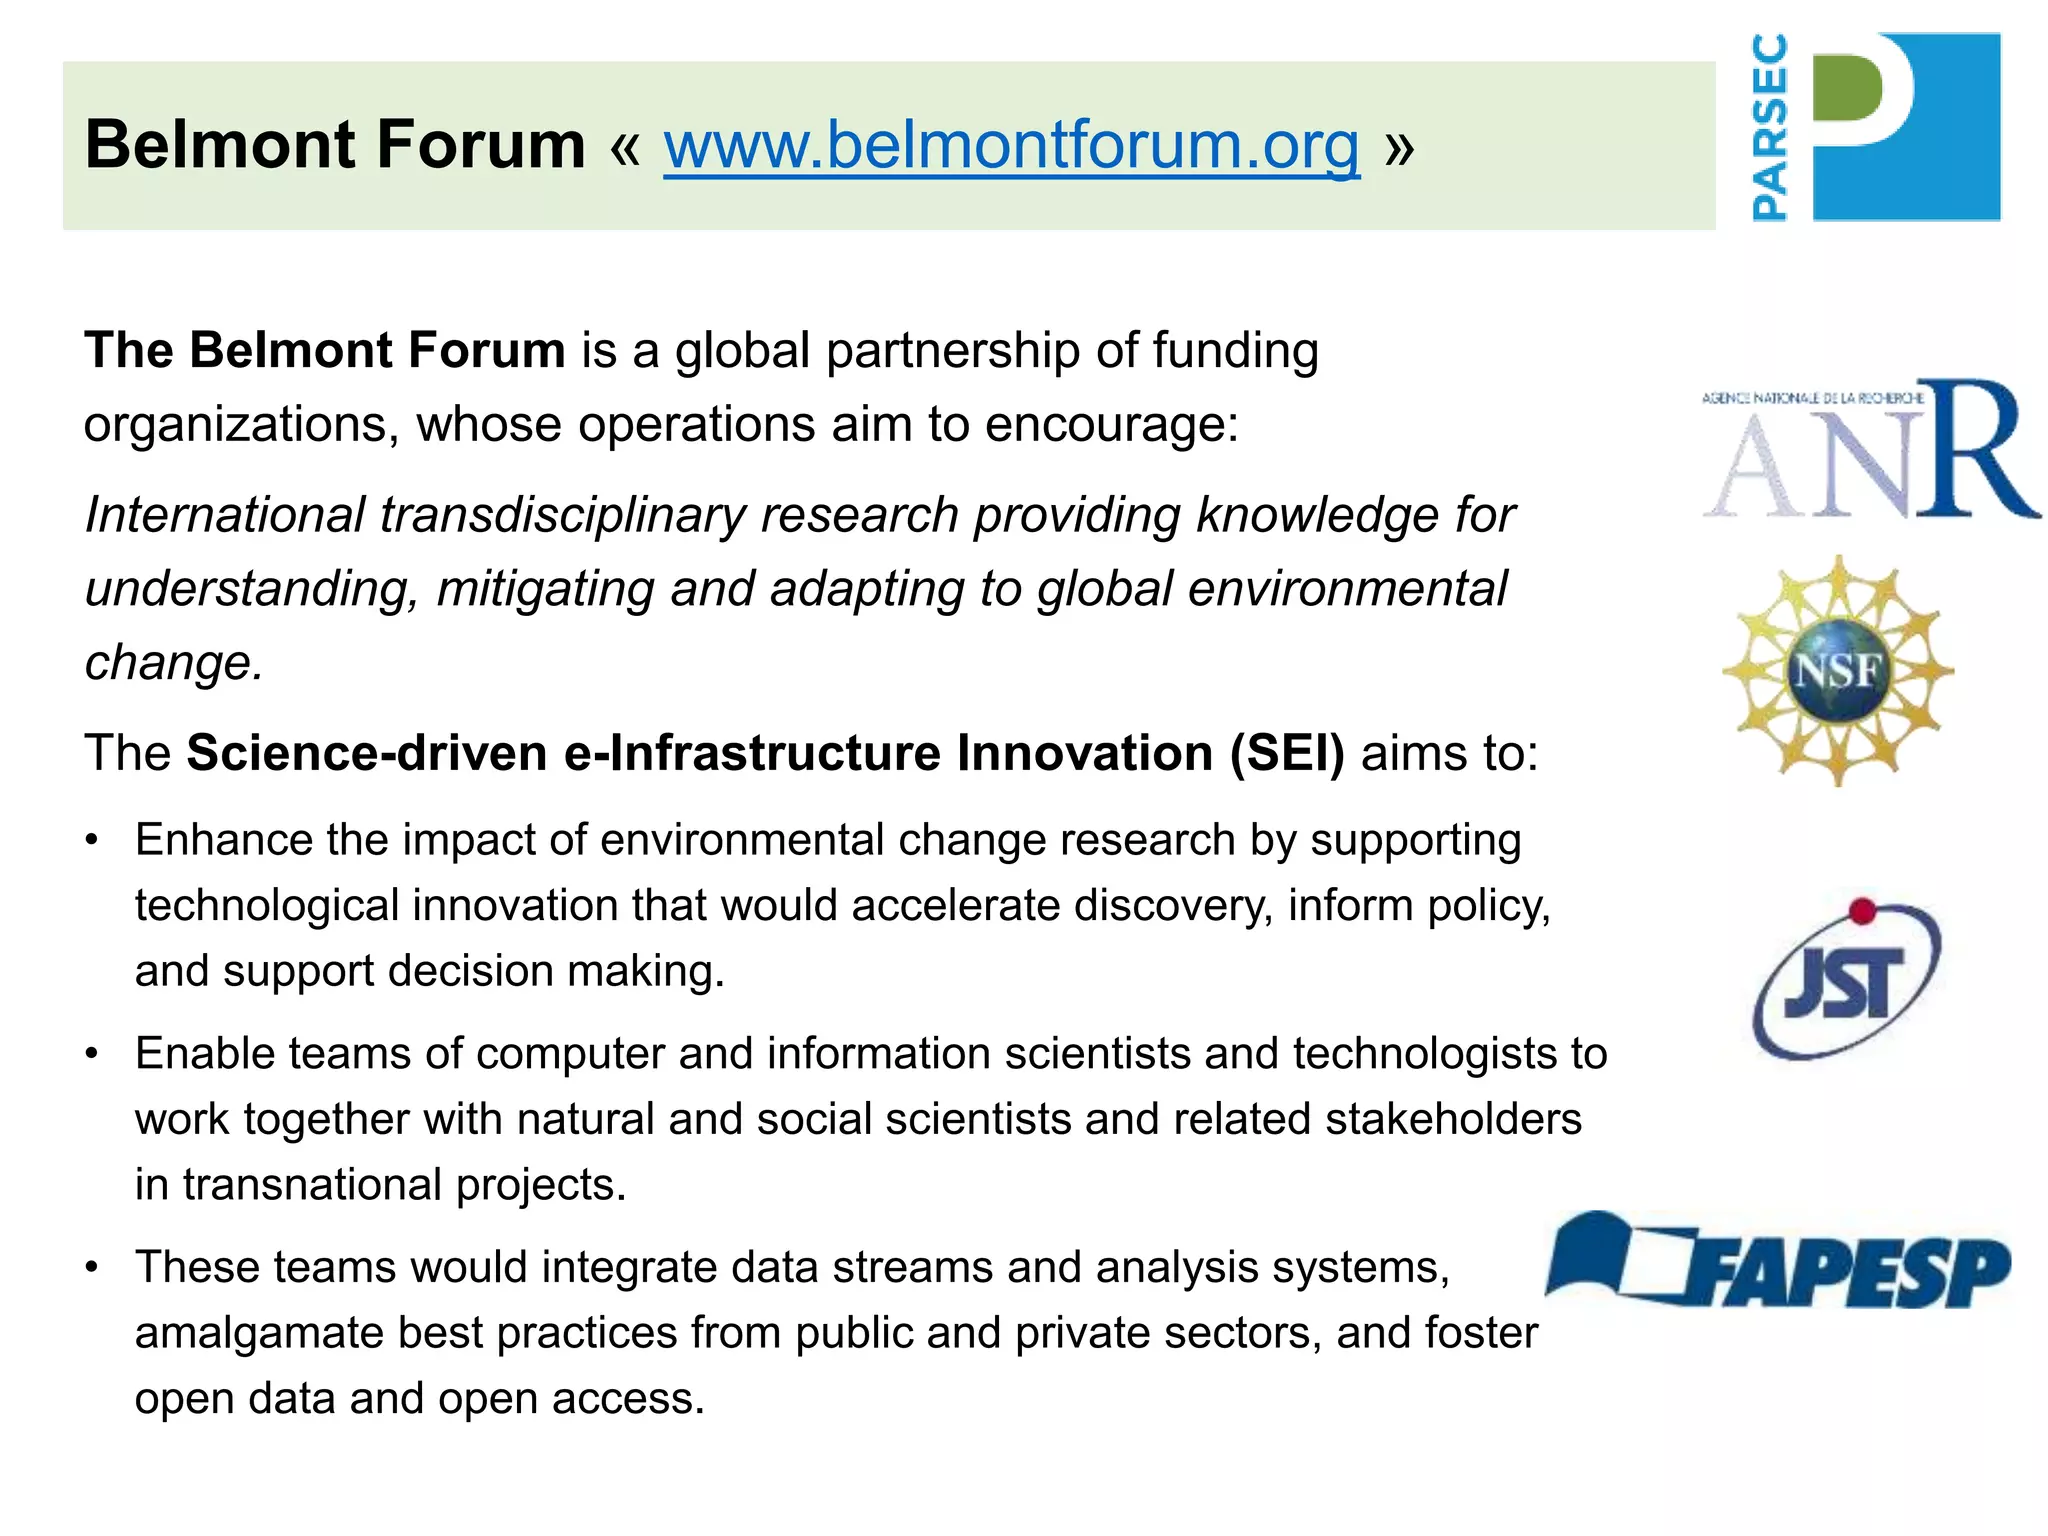
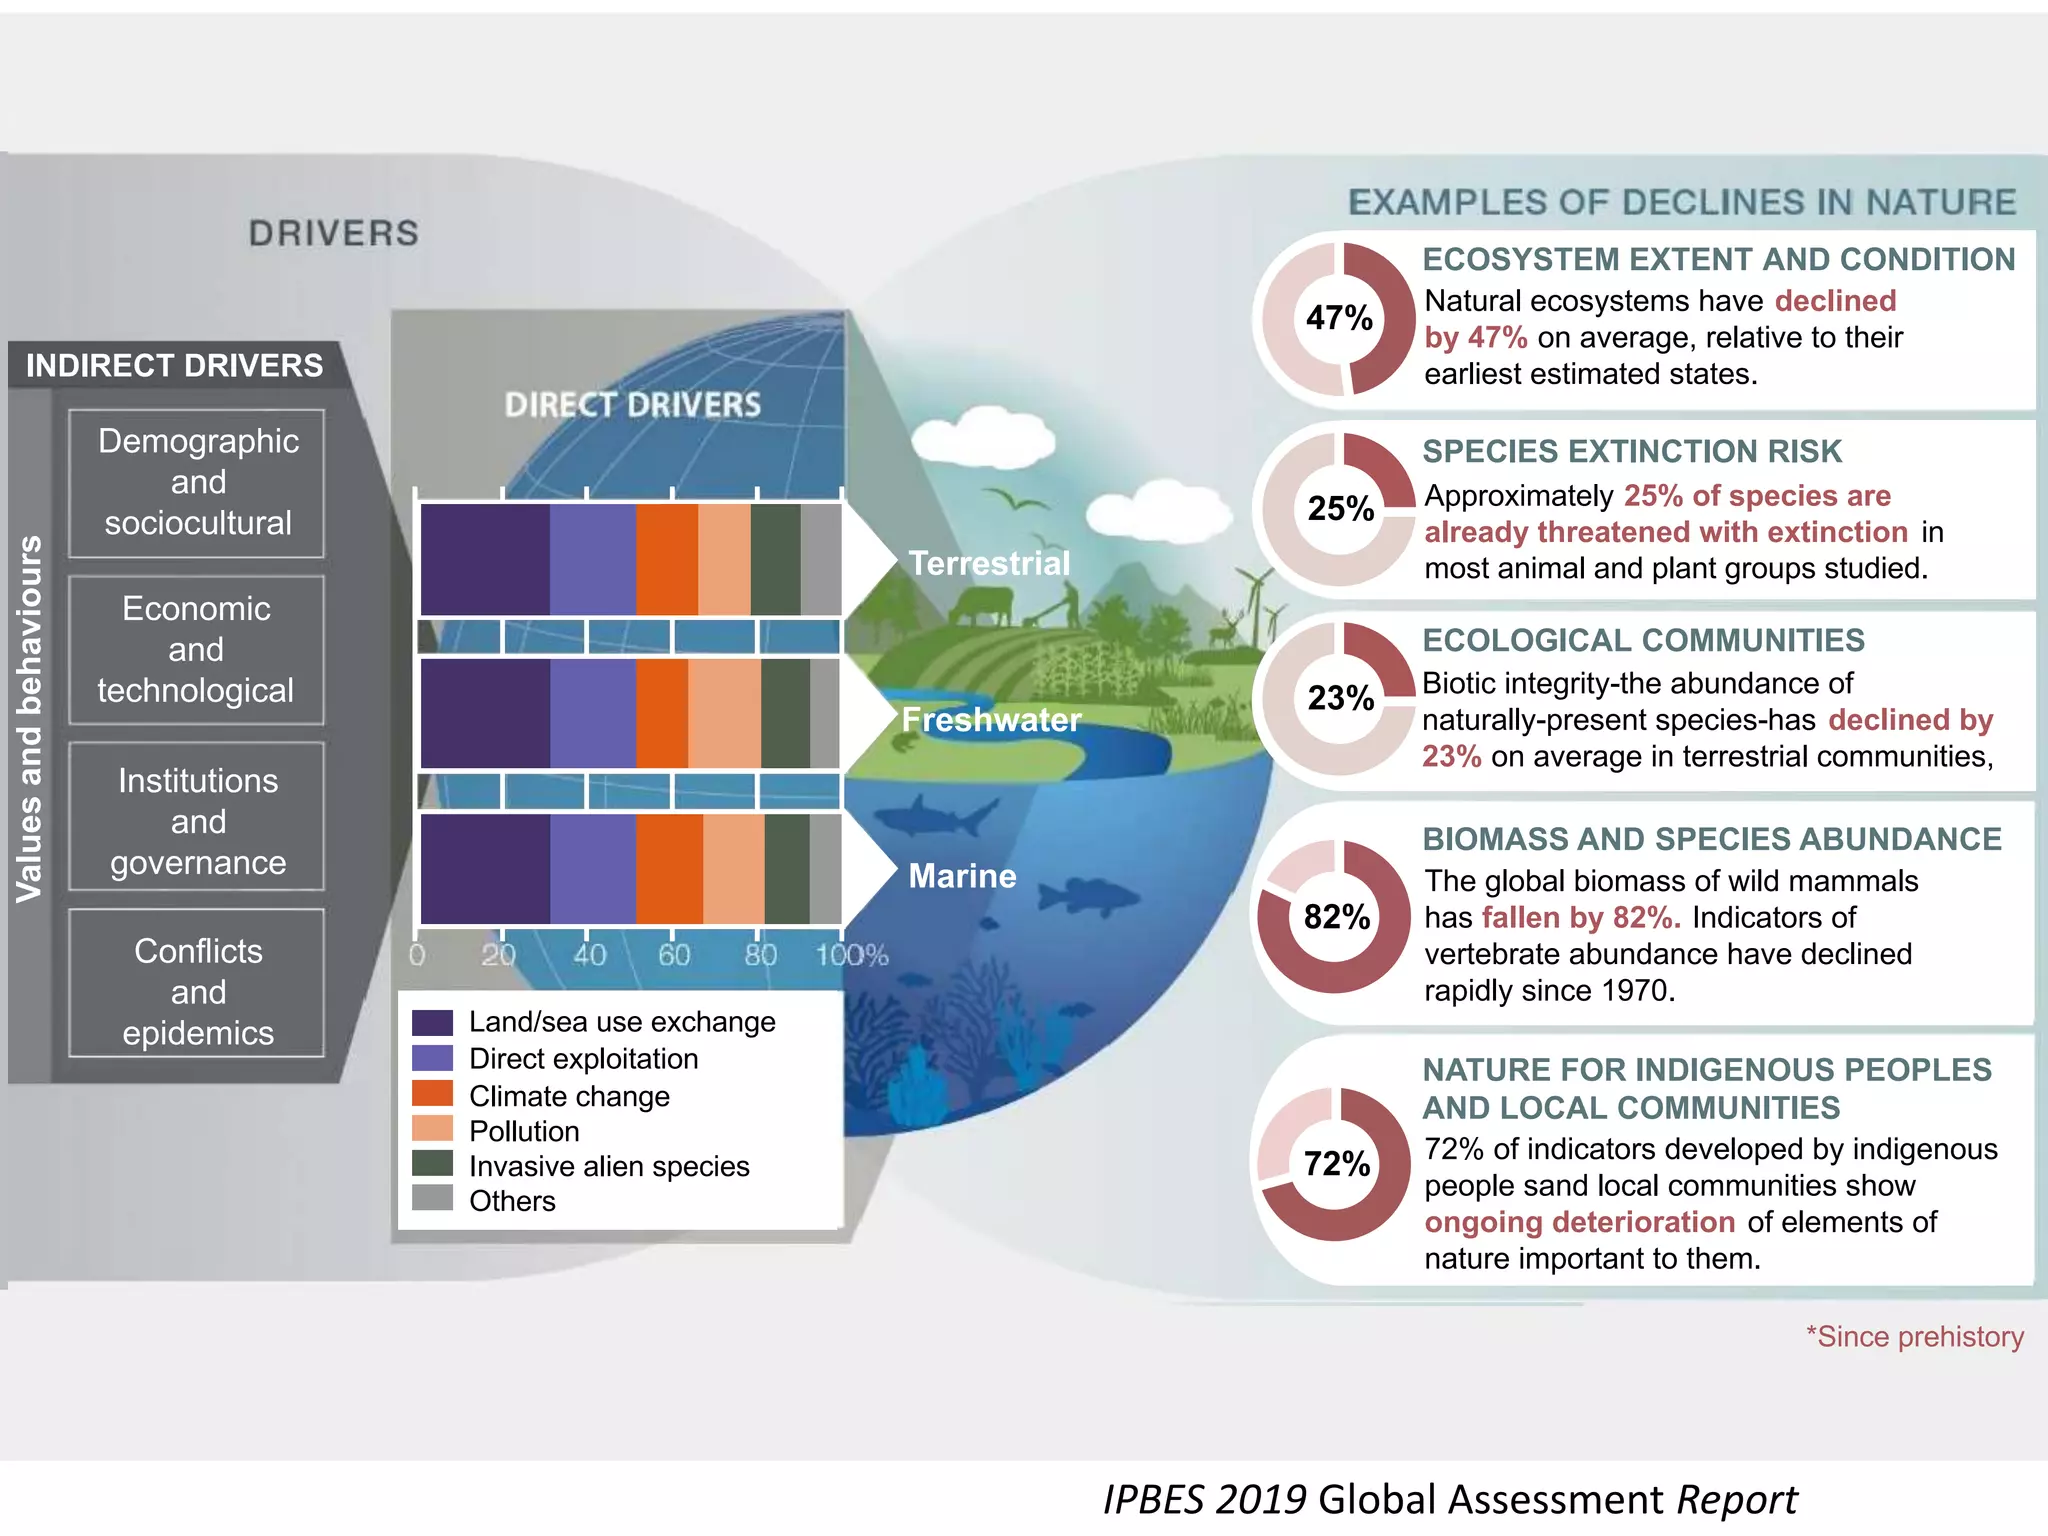
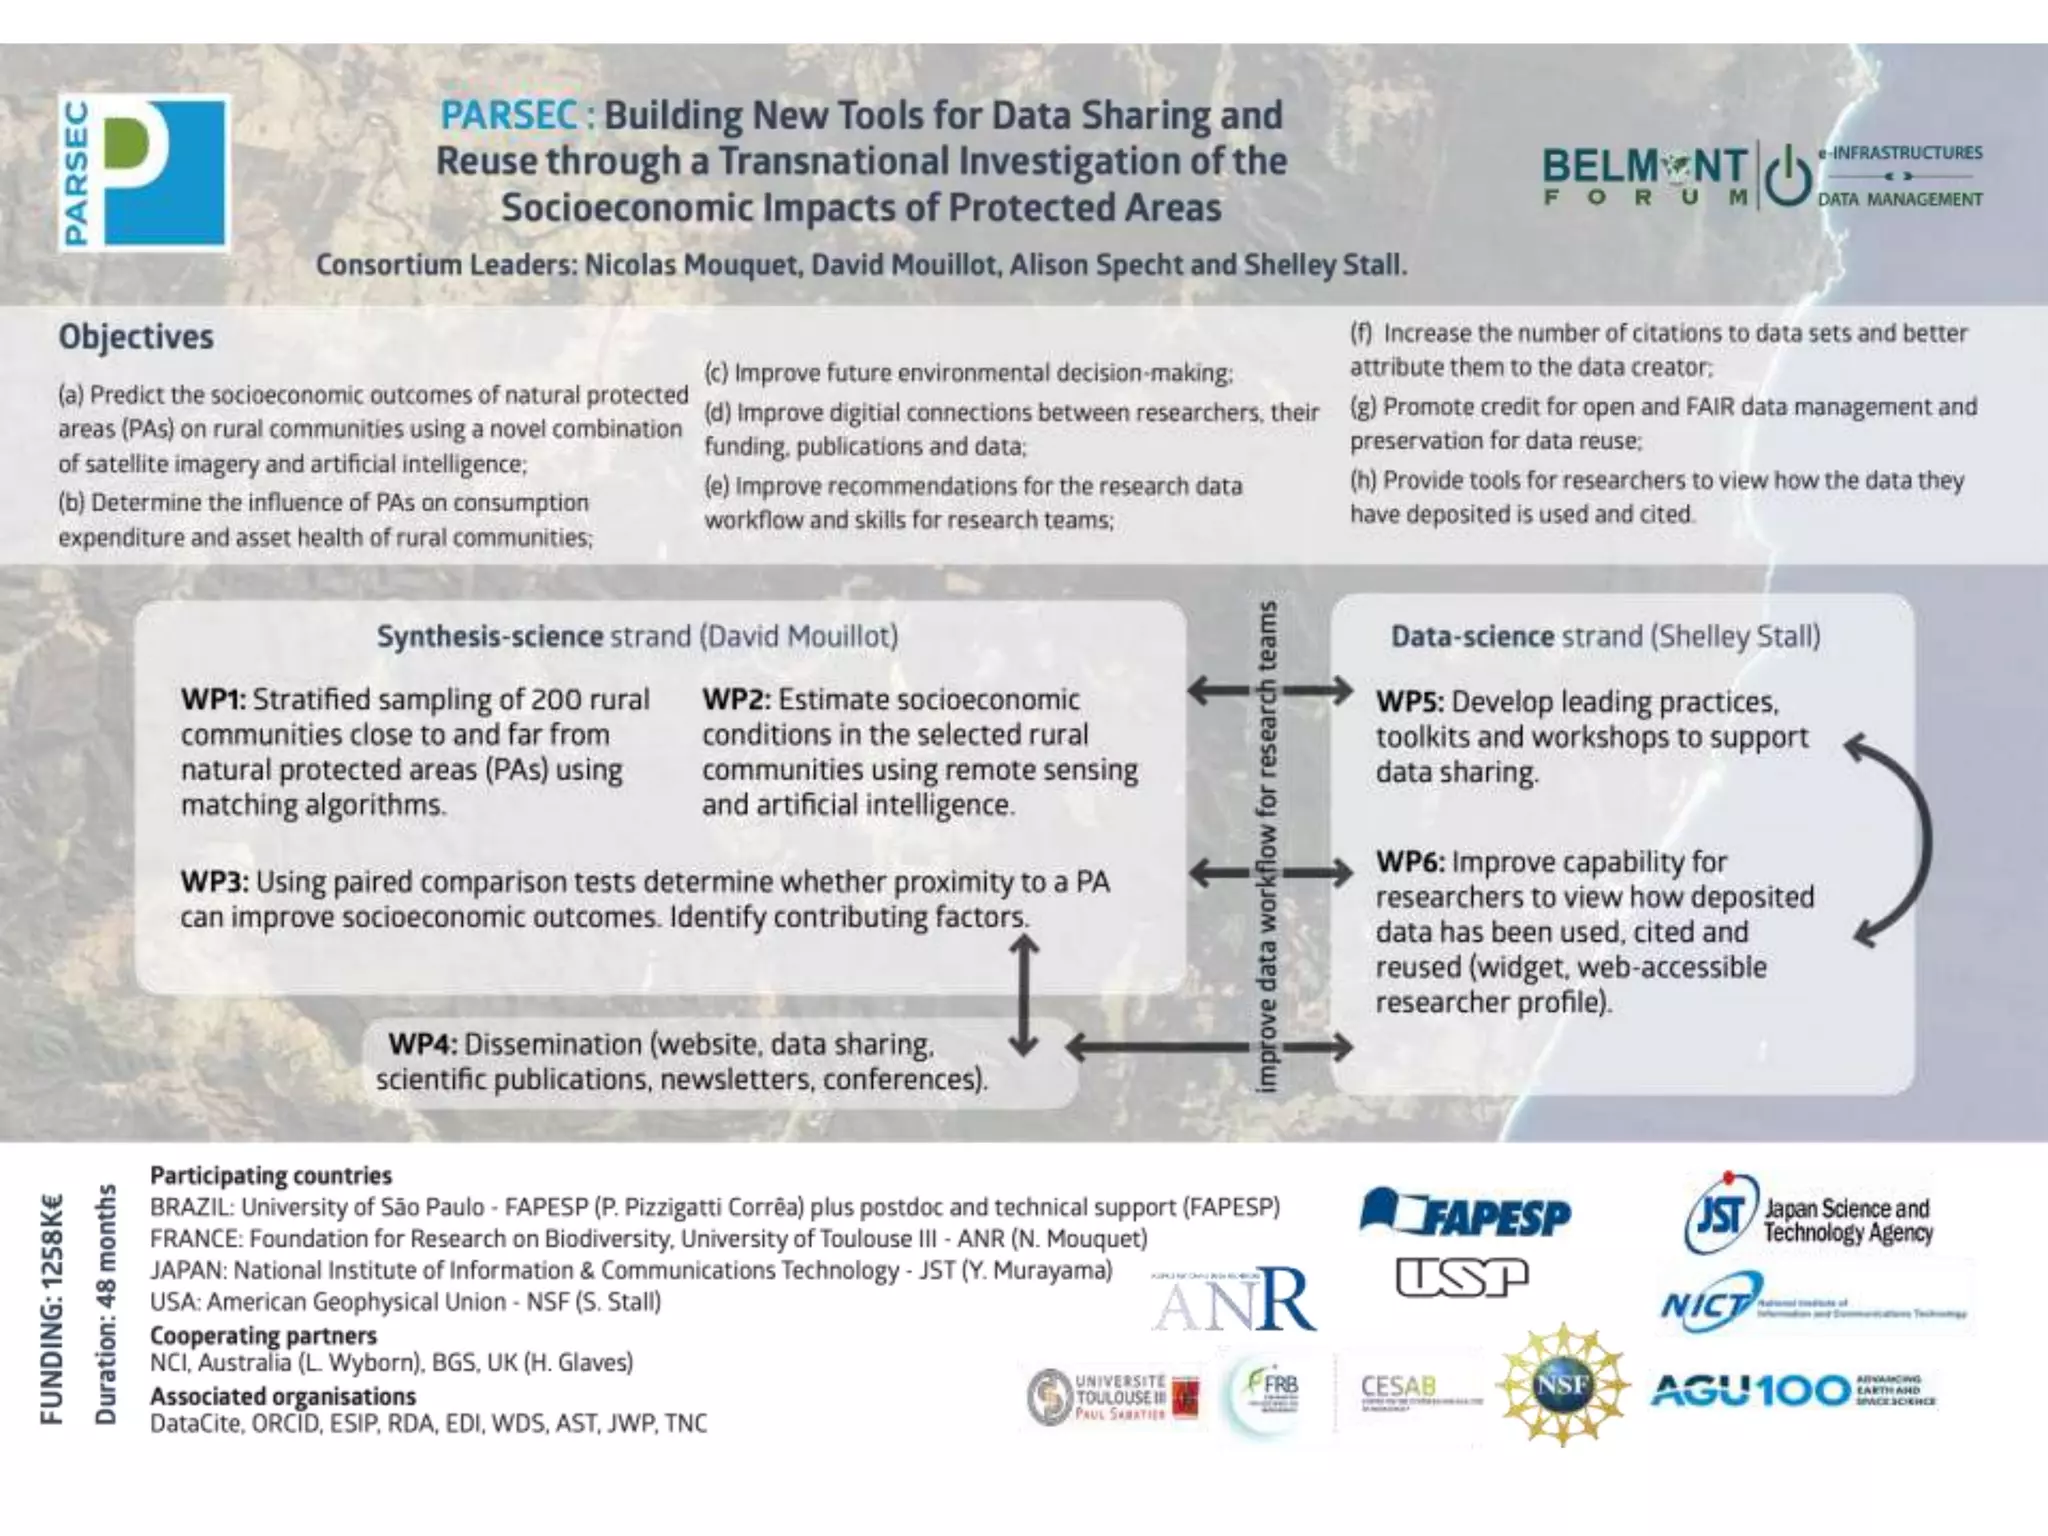
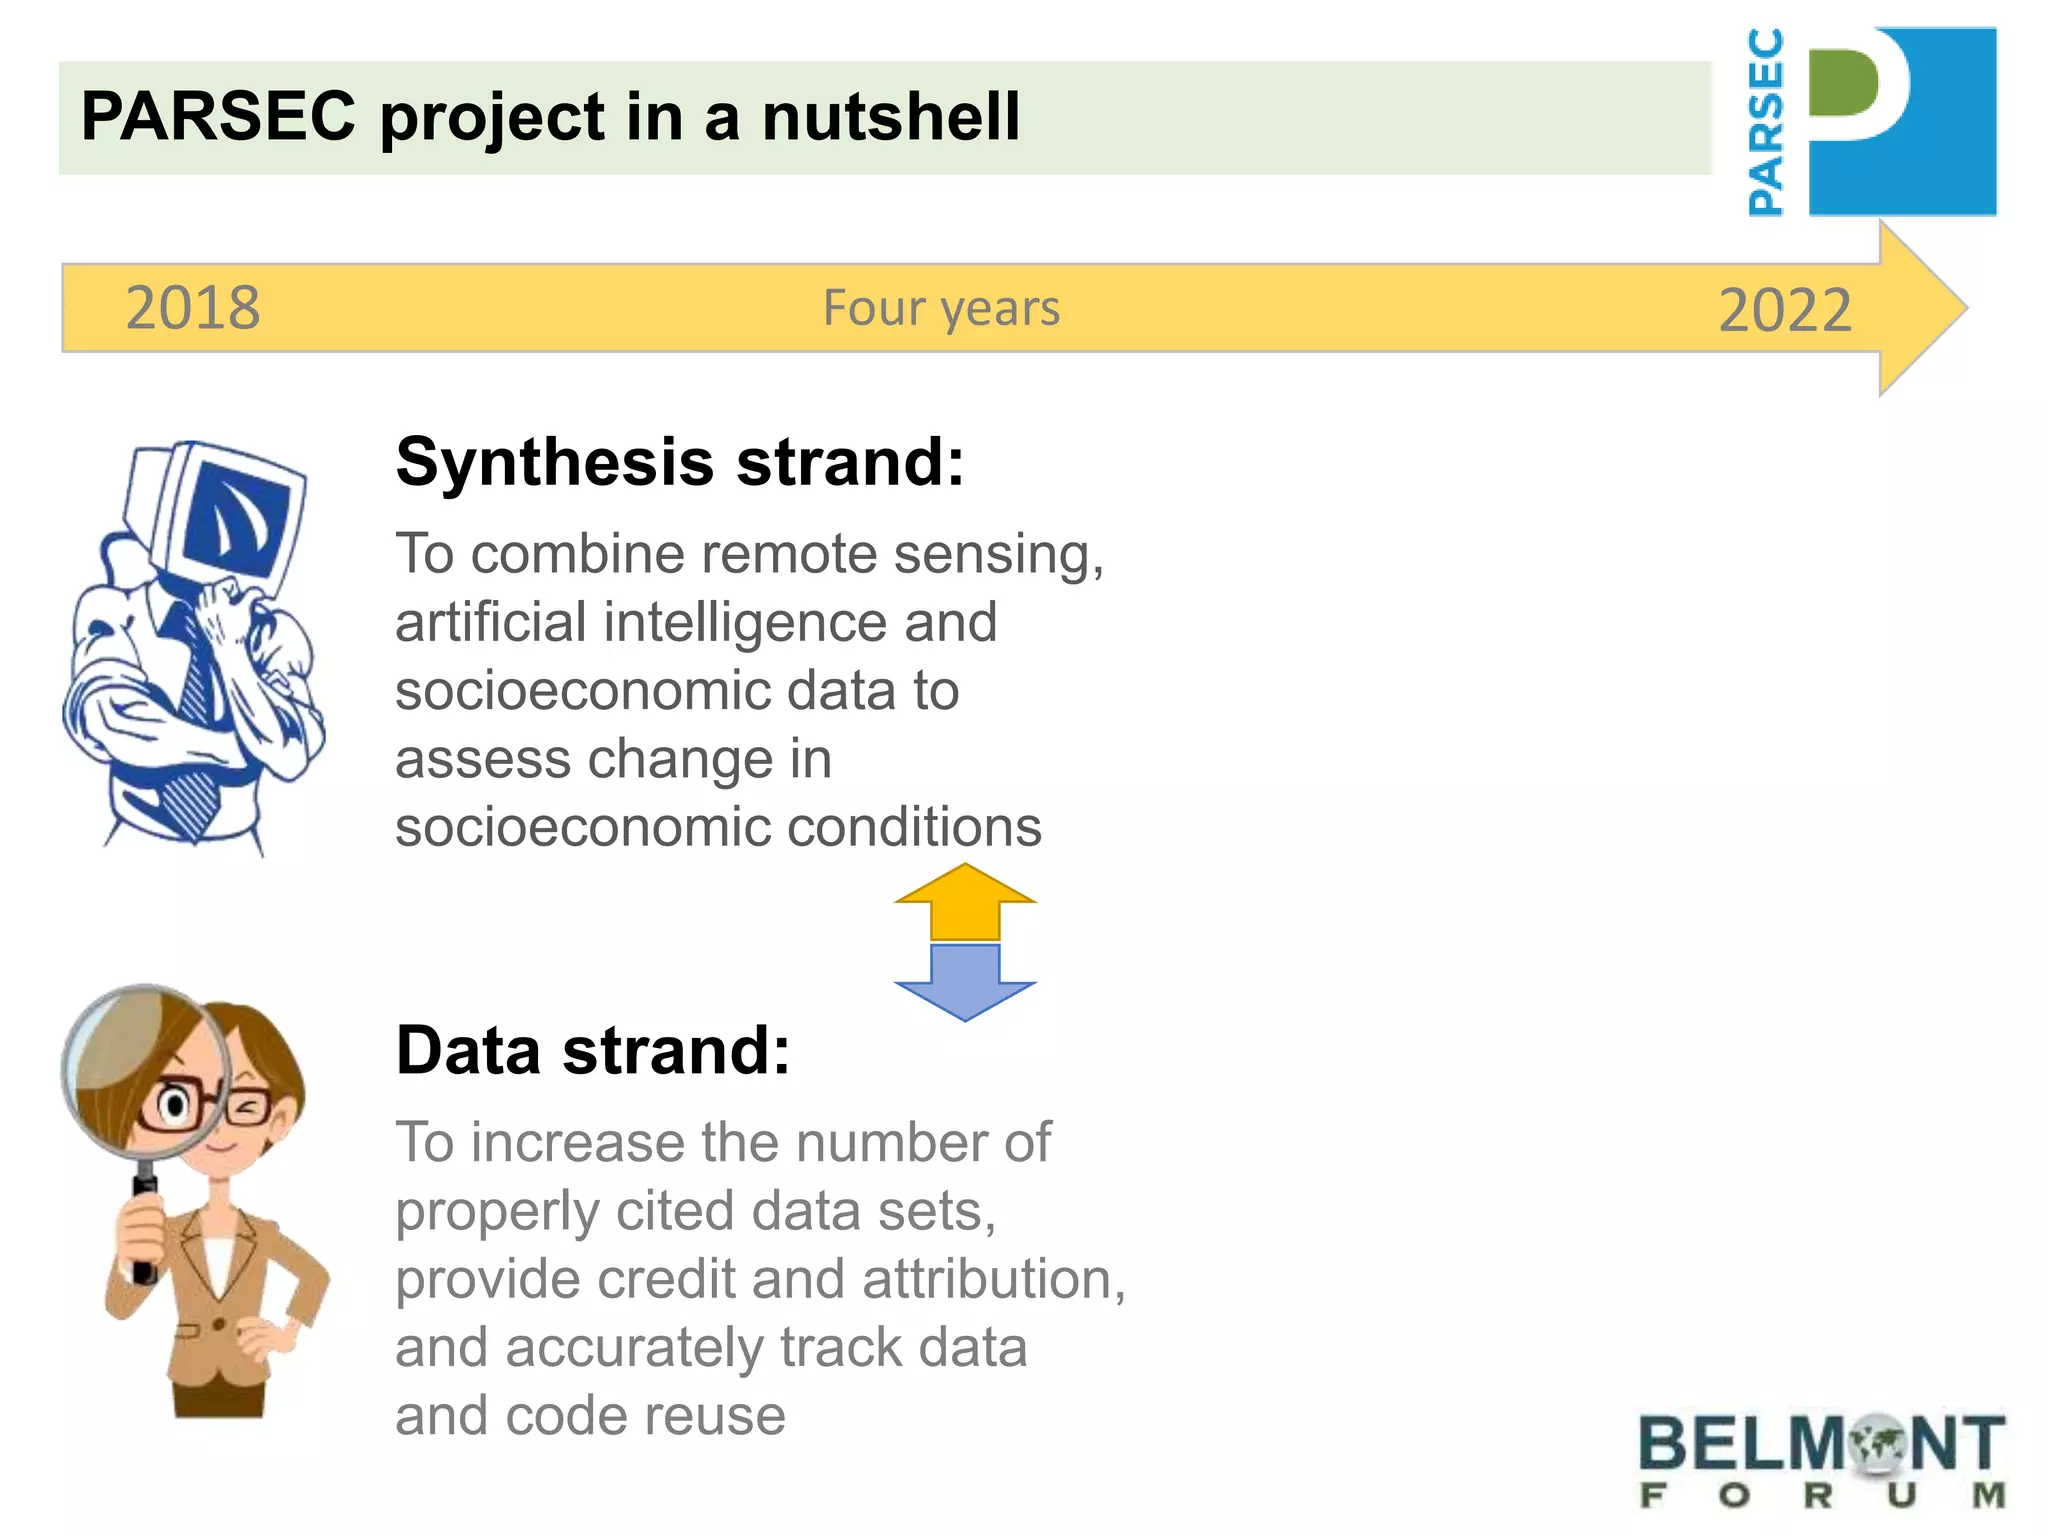
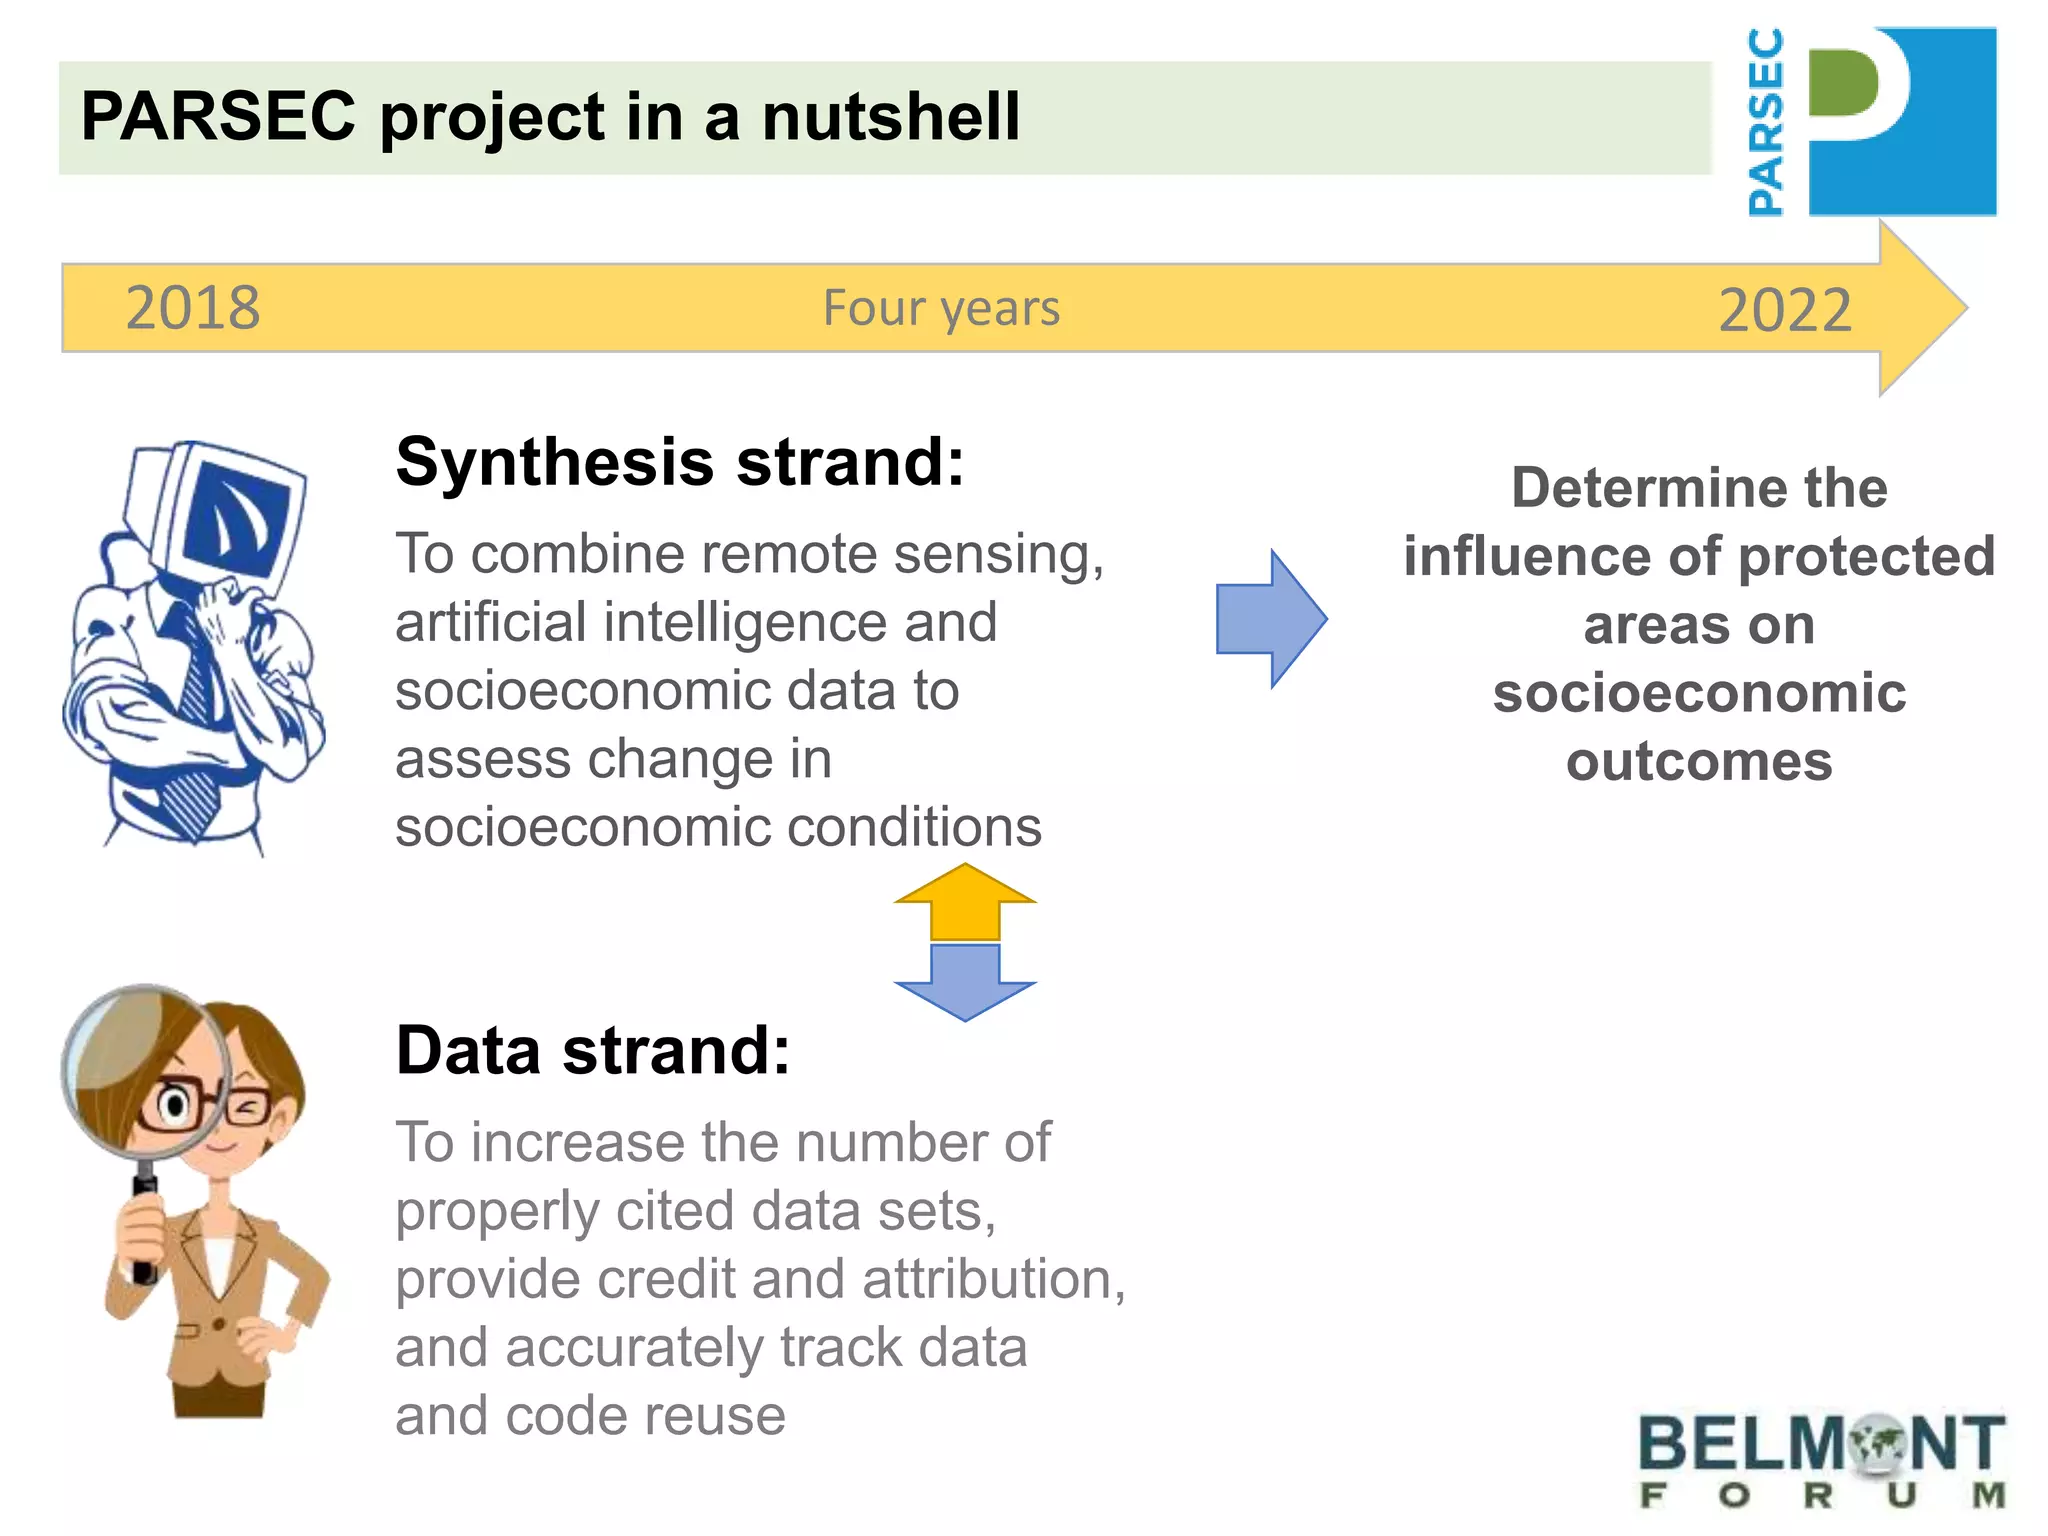
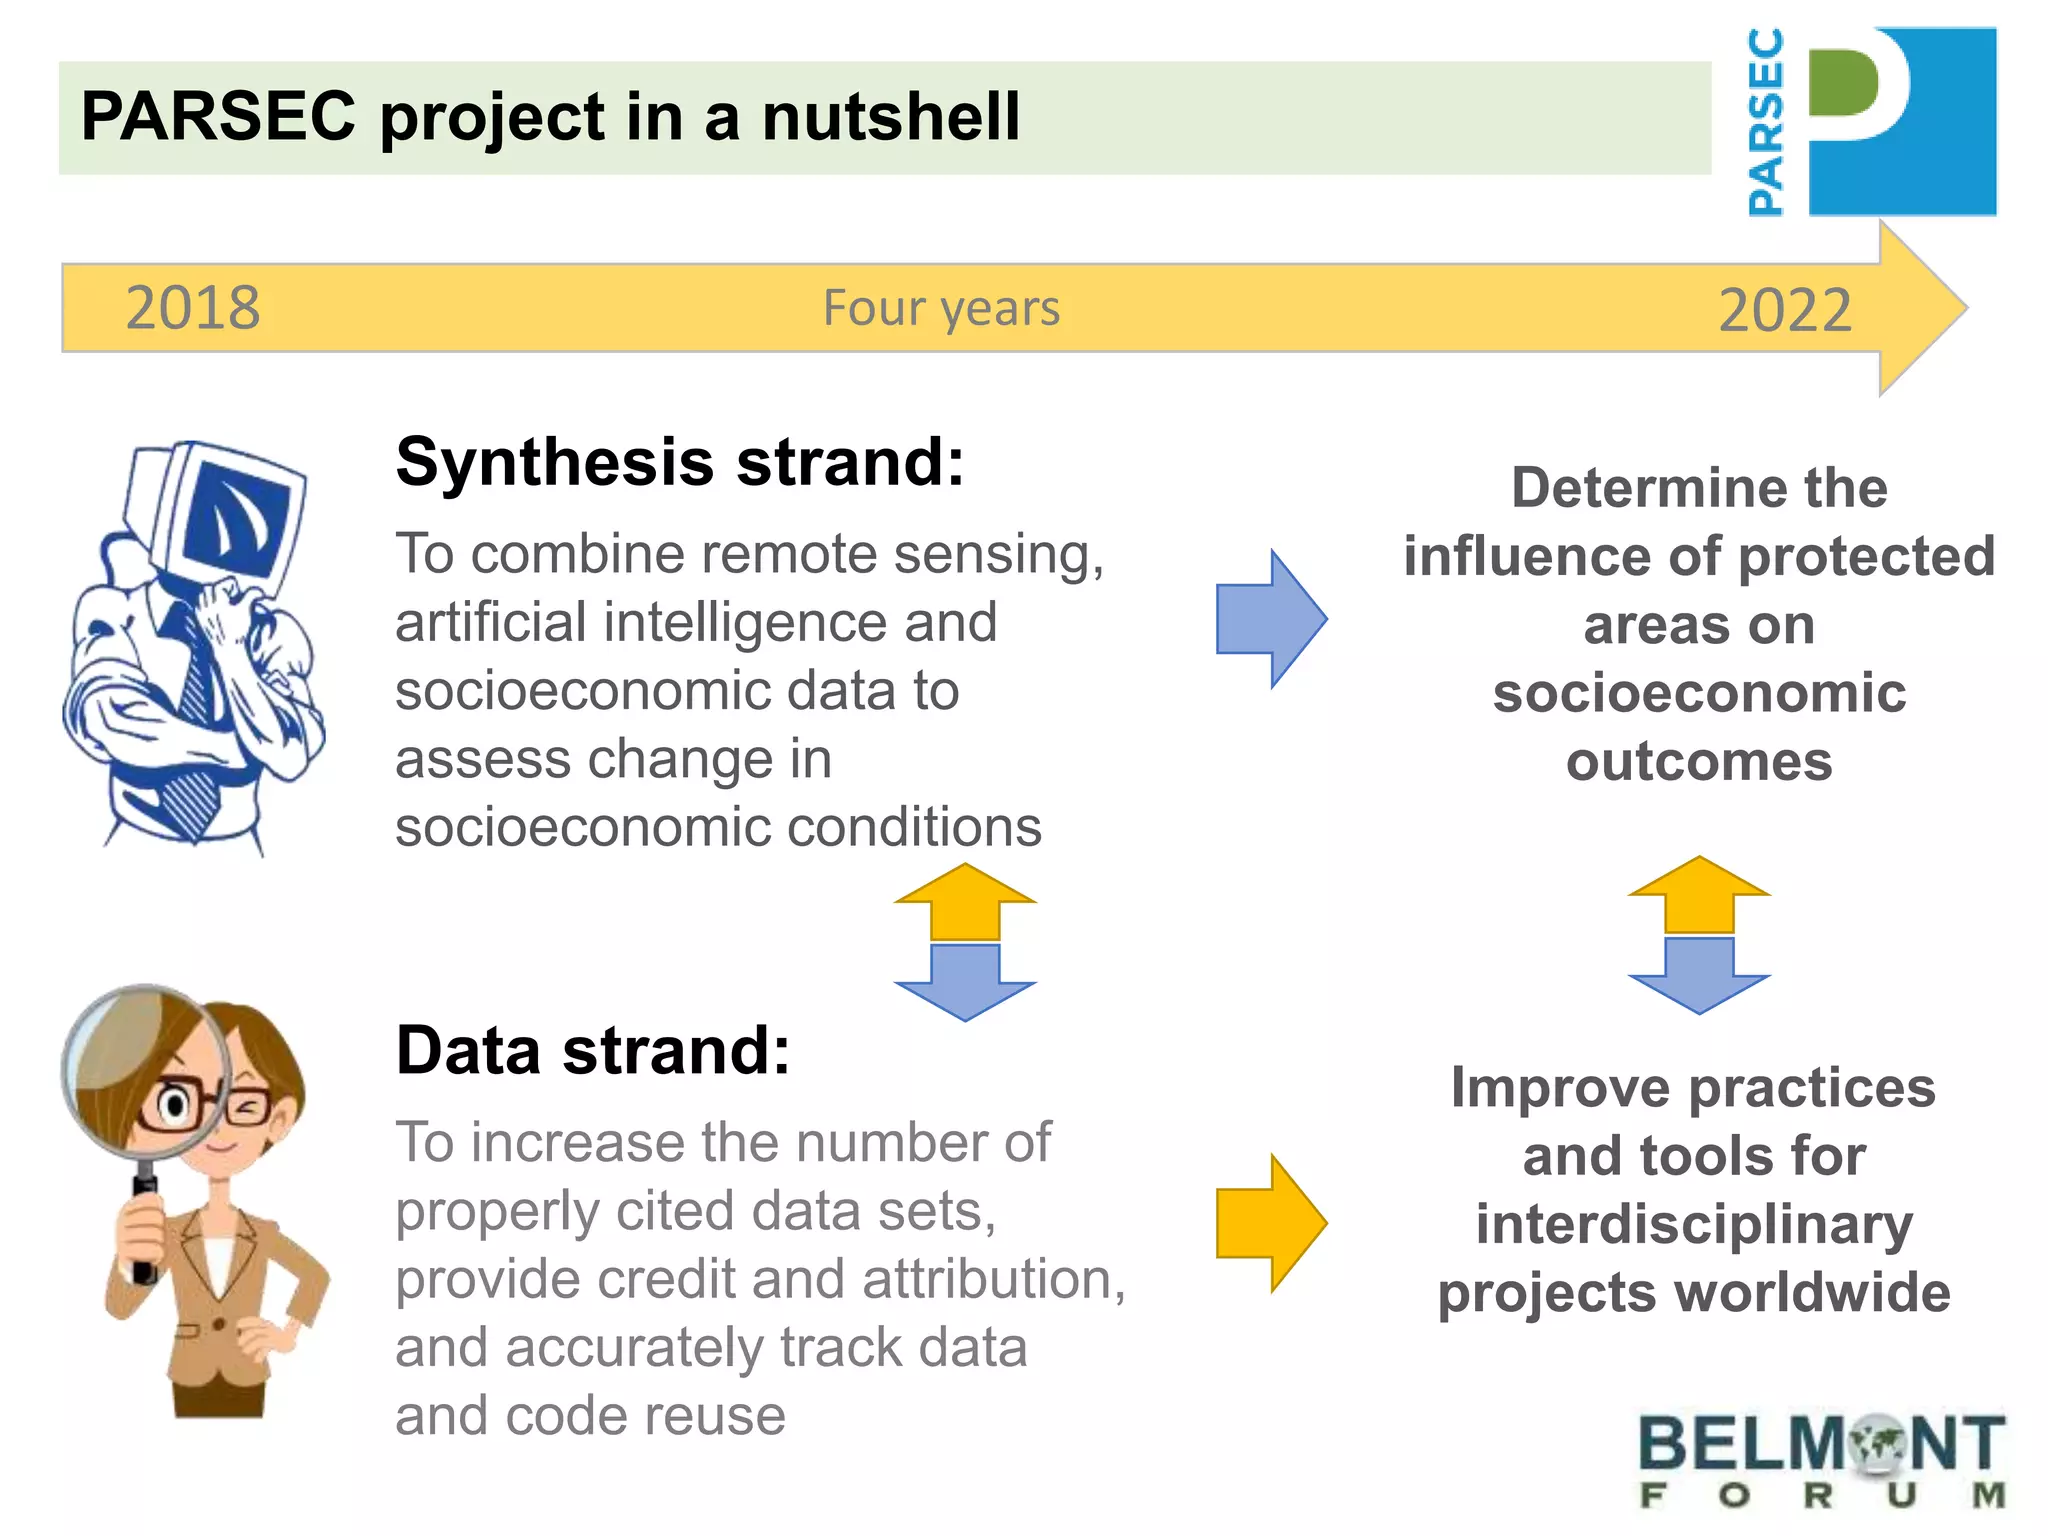
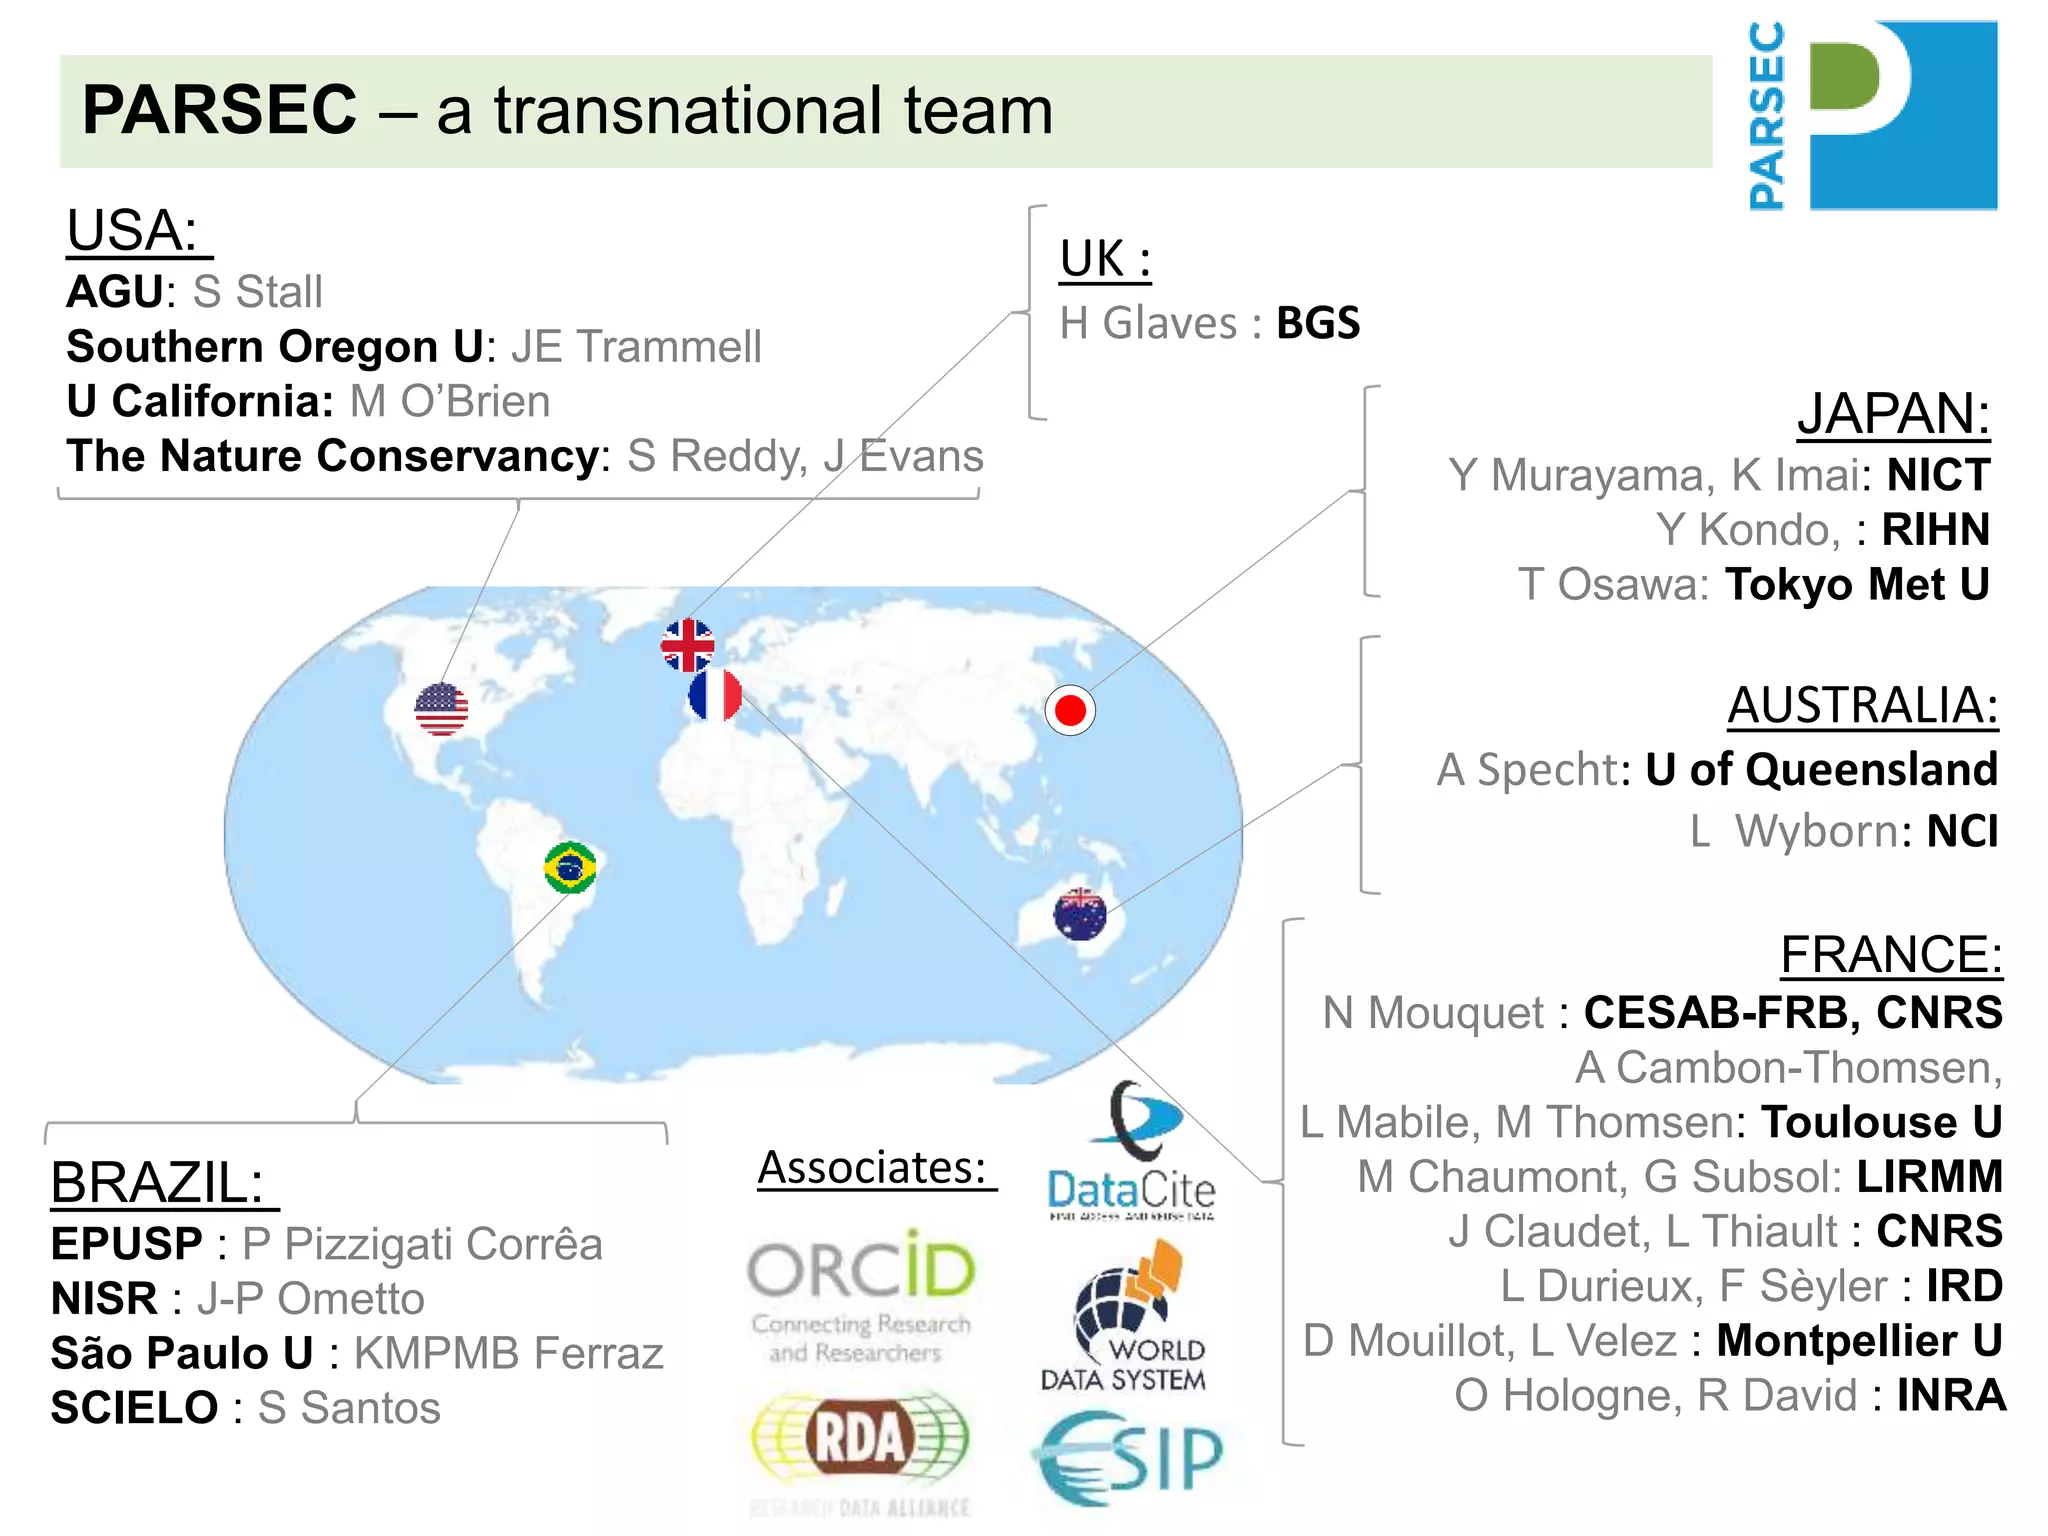
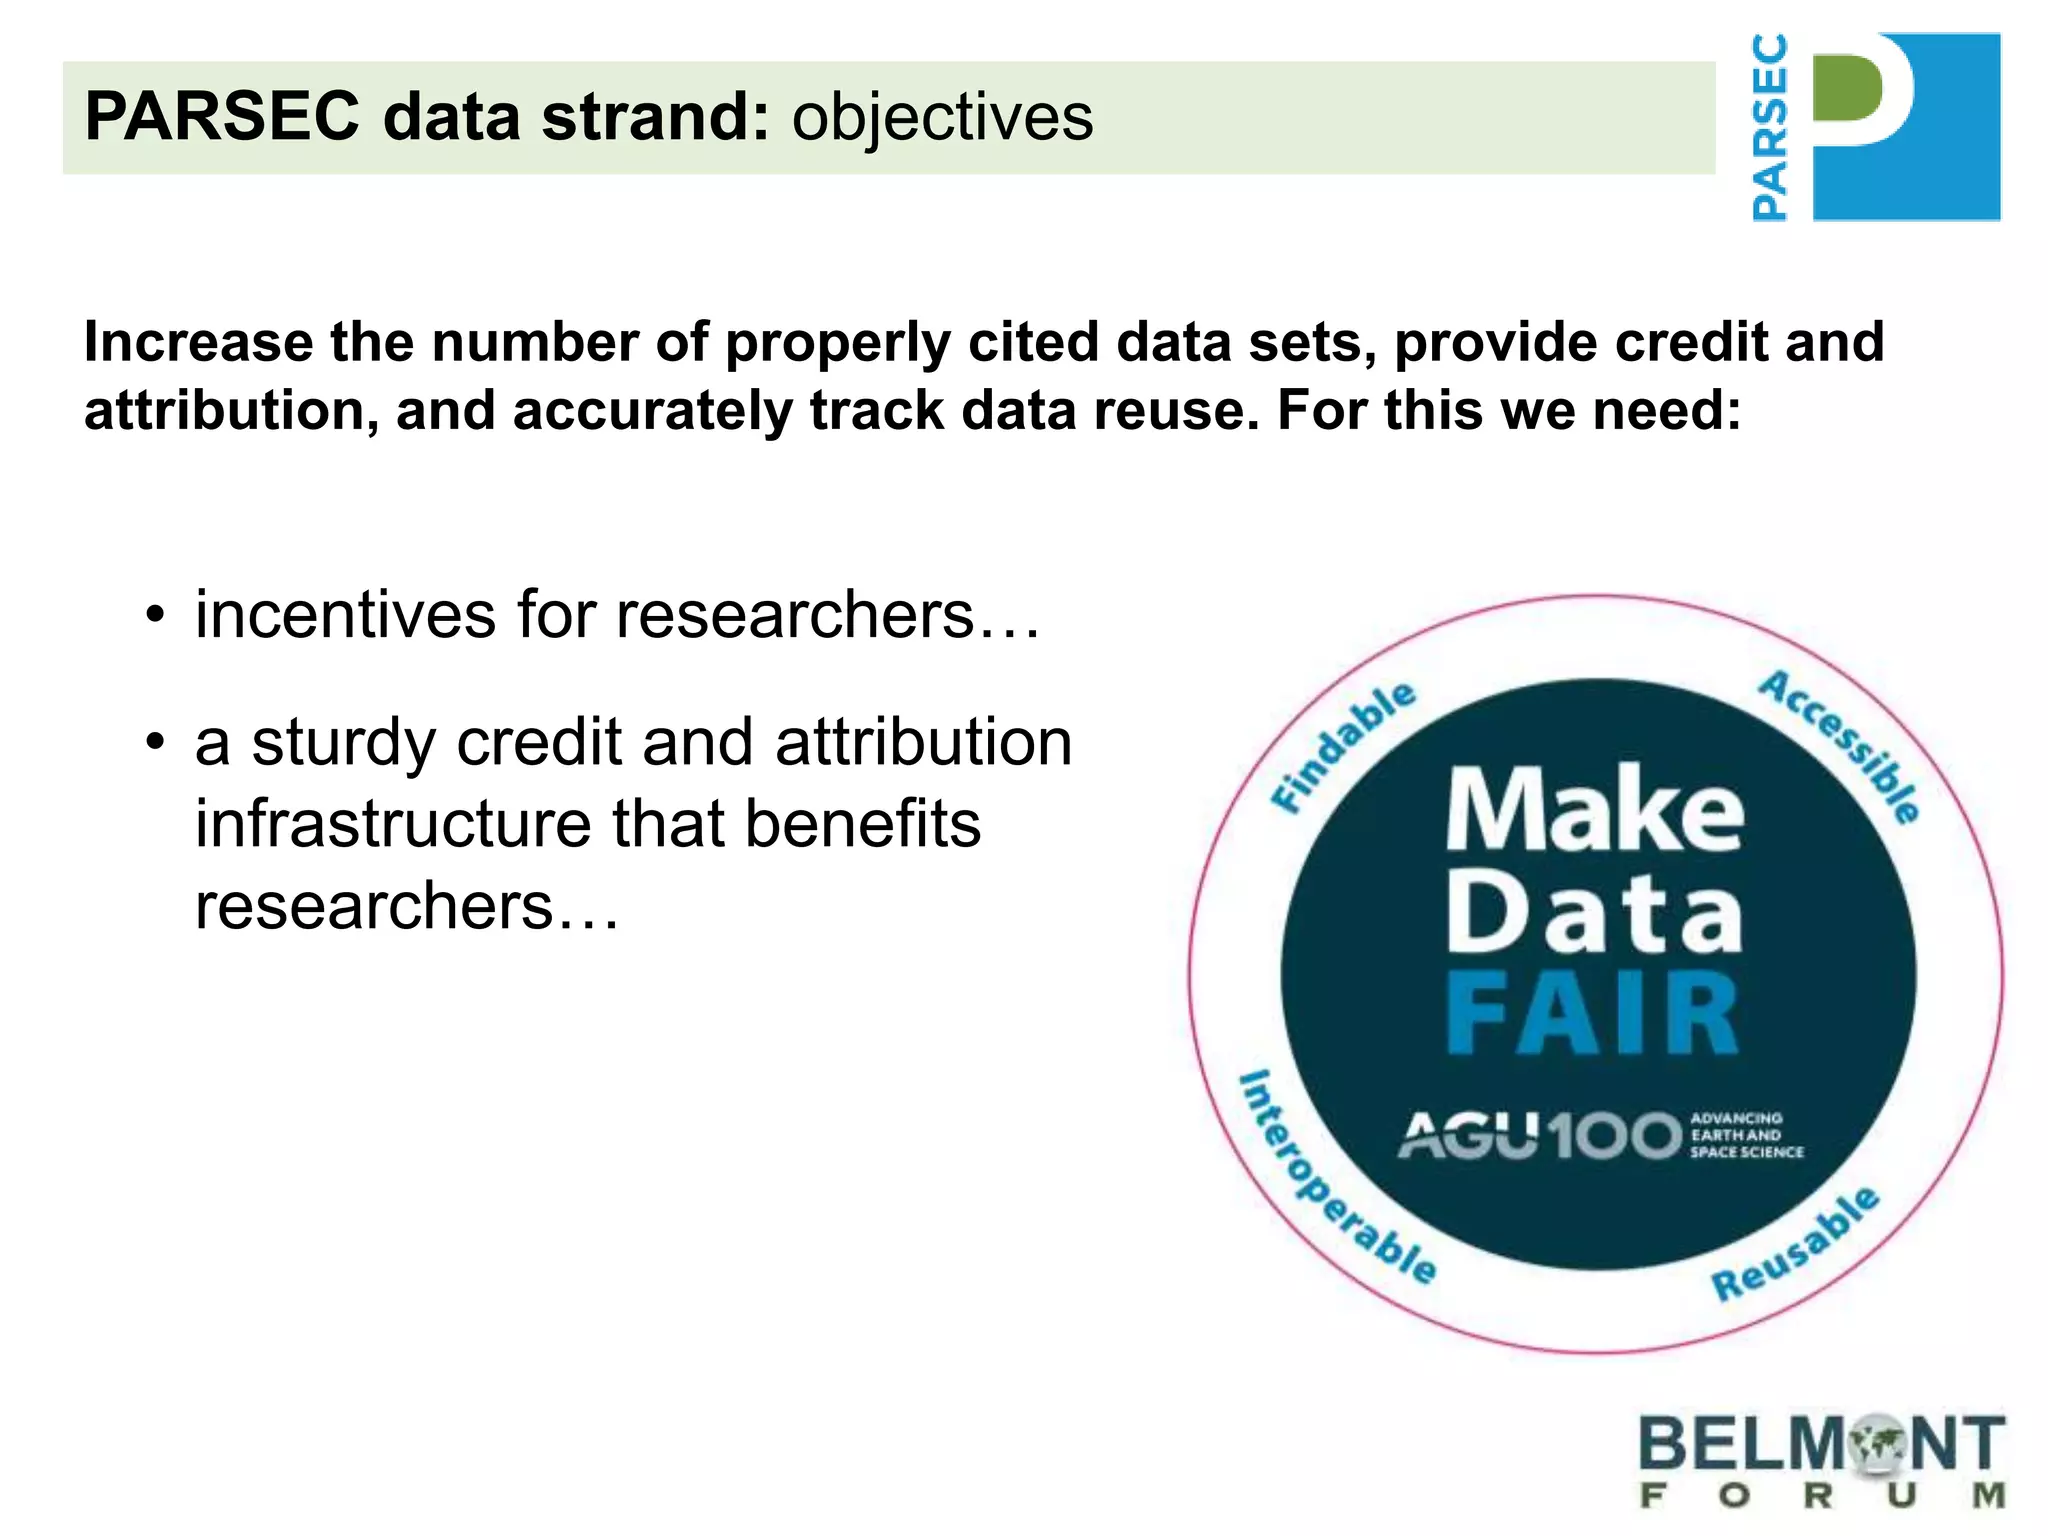
The PARSEC project utilizes satellite imagery and artificial intelligence to analyze the impact of protected areas on socioeconomic outcomes, bridging the gap between scientific research and digital resources. It aims to enhance environmental change research through interdisciplinary collaboration while tackling issues like species extinction and ecosystem degradation. The project emphasizes the importance of properly citing datasets and sharing data to improve its discoverability and reuse, providing guidance and best practices for researchers and stakeholders.


