Download as PDF, PPTX


![WHAT IS MEMORY ALLOCATION
IN JAVASCRIPT?
Memory allocation = Object creation:
... more ways to create objects
varfoo=[1,2,3];
varfoo={bar:"baz"};
varfoo=newThing();
varfoo=function(){};
varfoo=document.createElement("div");](https://image.slidesharecdn.com/pluggingholesjavascriptmemoryleakdebugging-140718083957-phpapp01/85/Plugging-holes-javascript-memory-leak-debugging-5-320.jpg)


![WHAT IS MEMORY ALLOCATION
IN JAVASCRIPT?
Memory allocation = Object creation:
... more ways to create objects
varfoo=[1,2,3];
varfoo={bar:"baz"};
varfoo=newThing();
varfoo=function(){};
varfoo=document.createElement("div");](https://image.slidesharecdn.com/pluggingholesjavascriptmemoryleakdebugging-140718083957-phpapp01/75/Plugging-holes-javascript-memory-leak-debugging-5-2048.jpg)
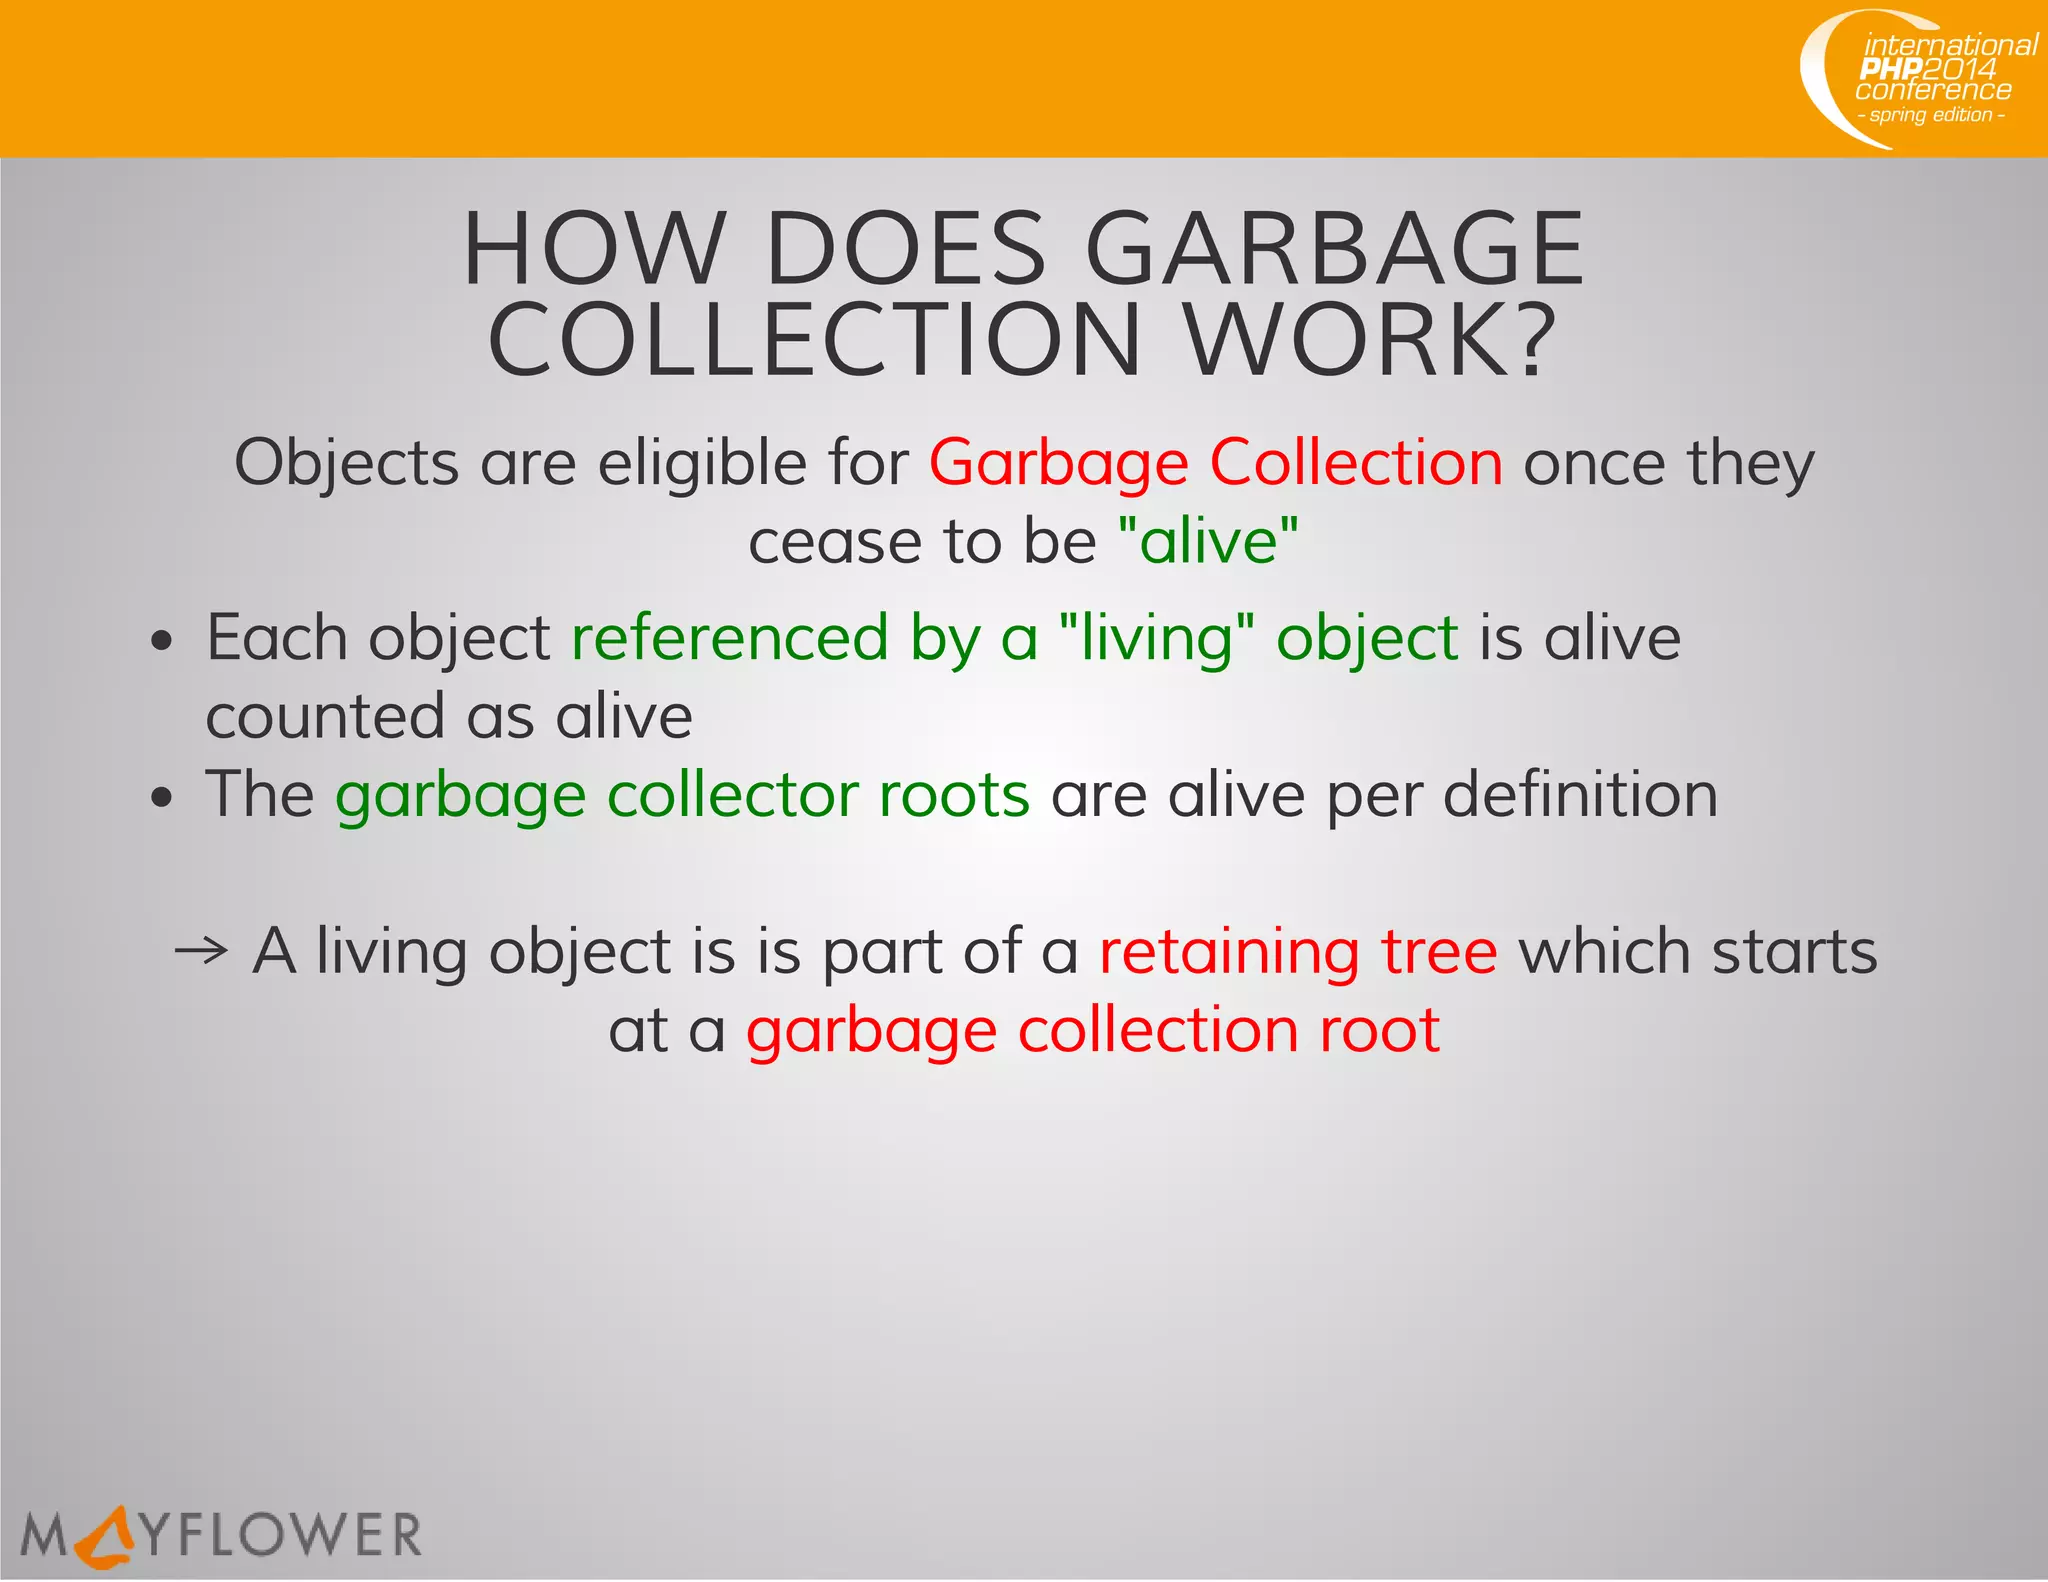
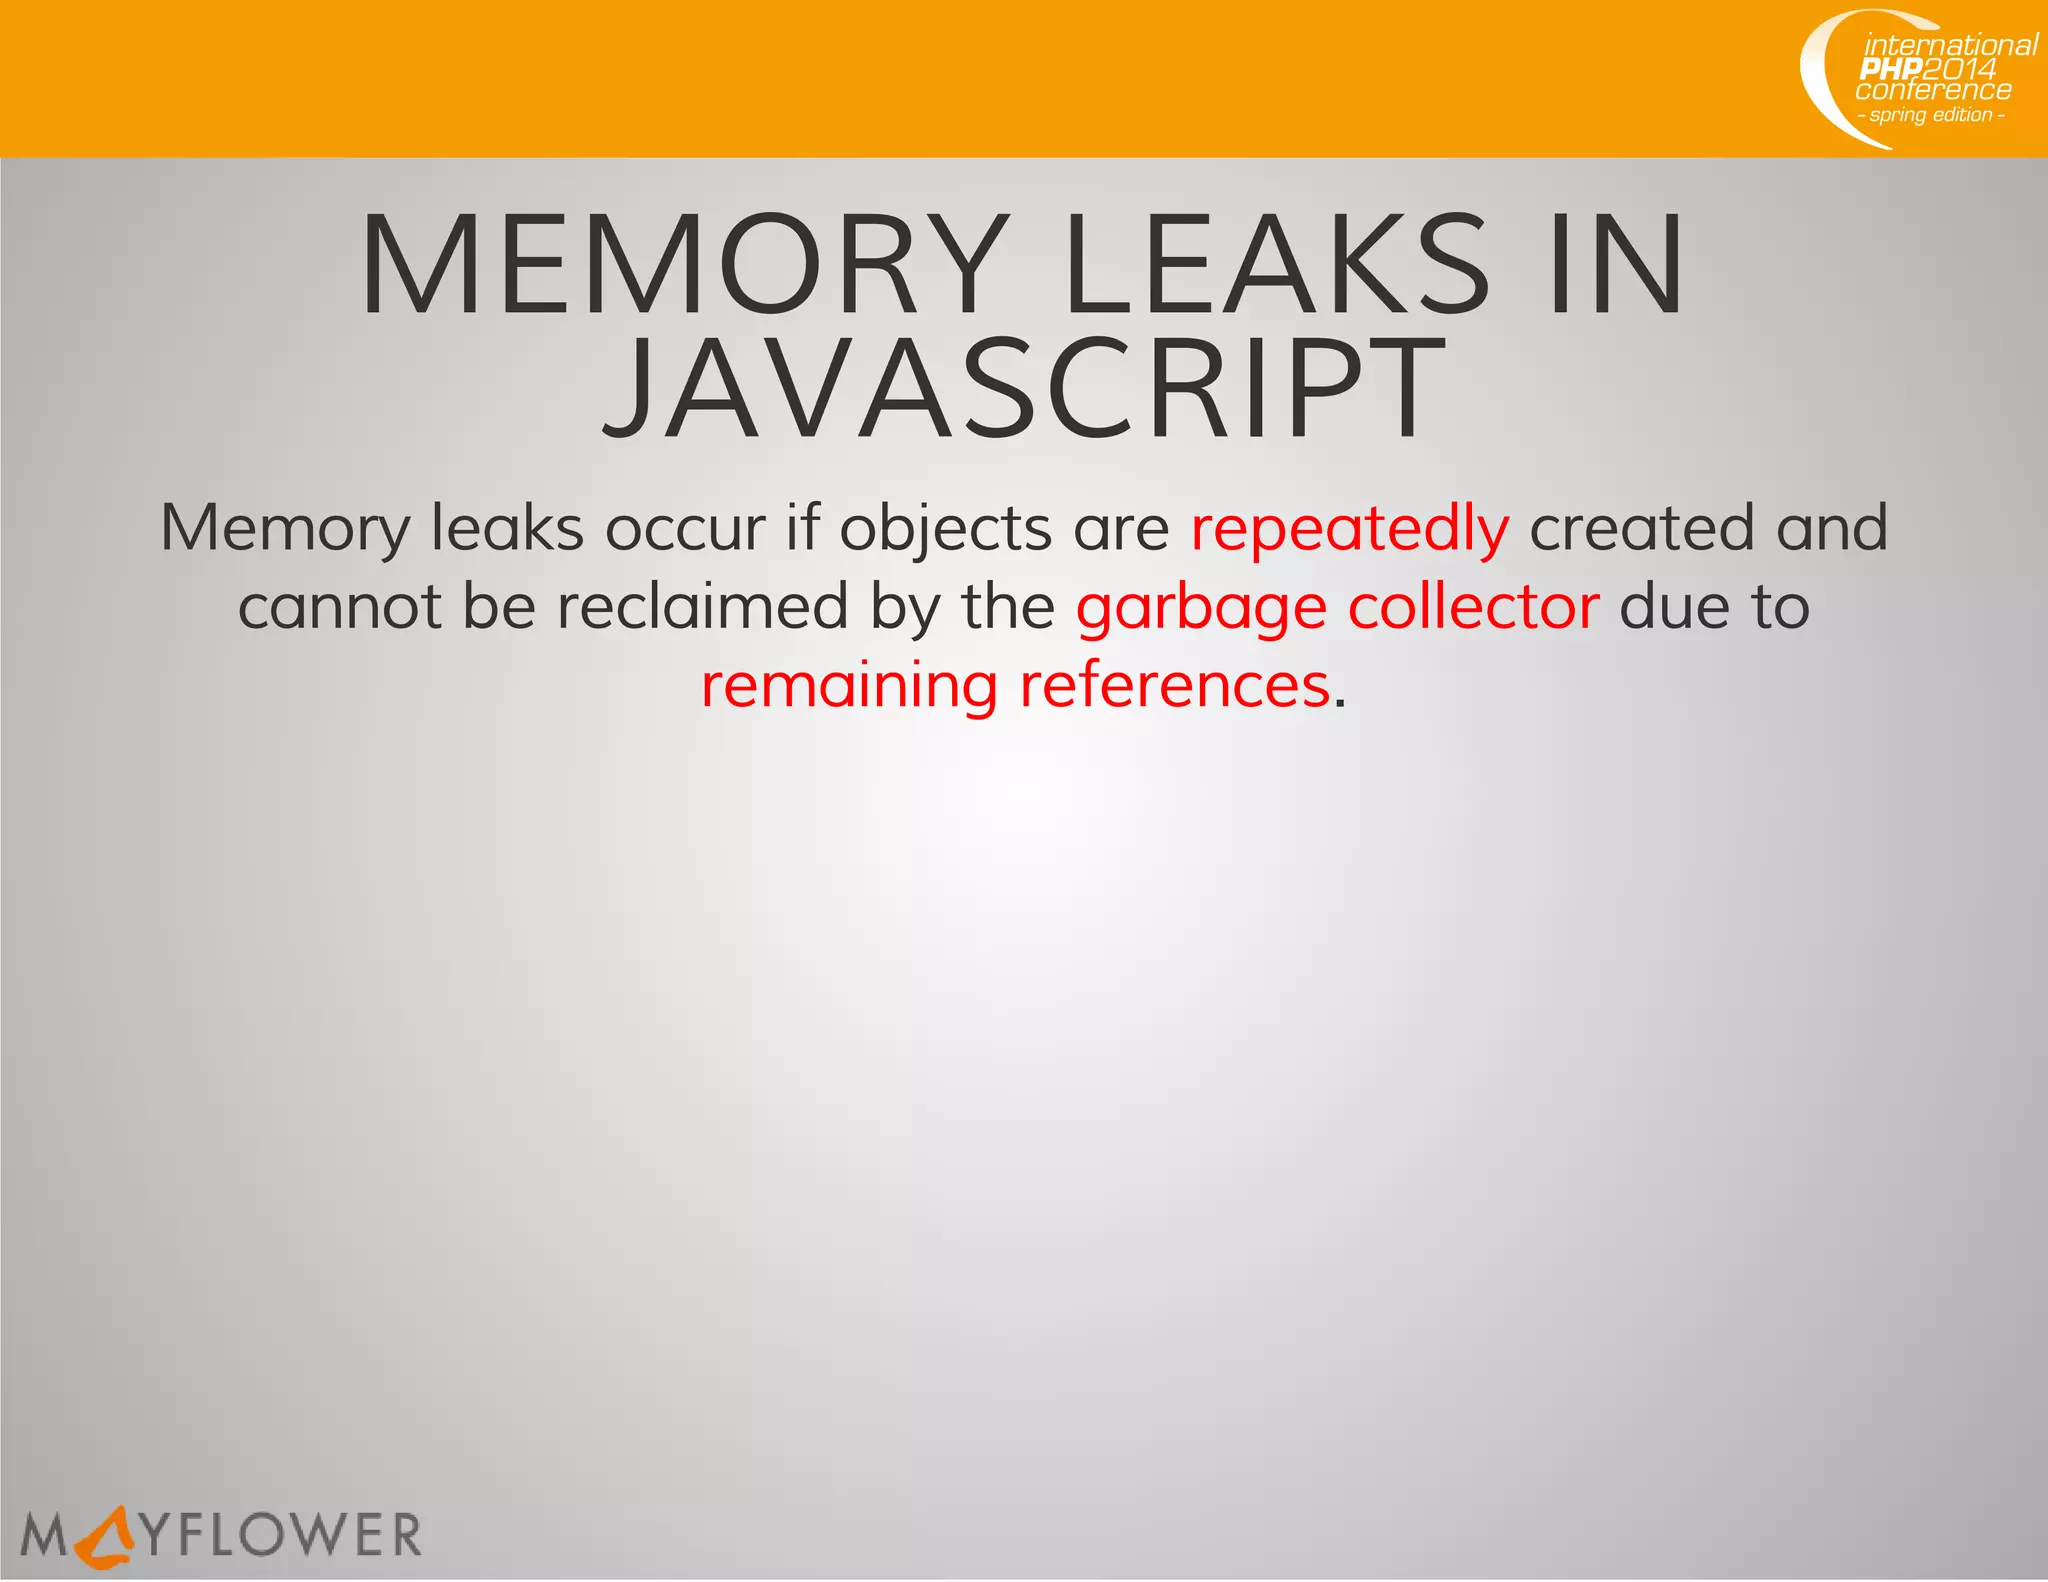


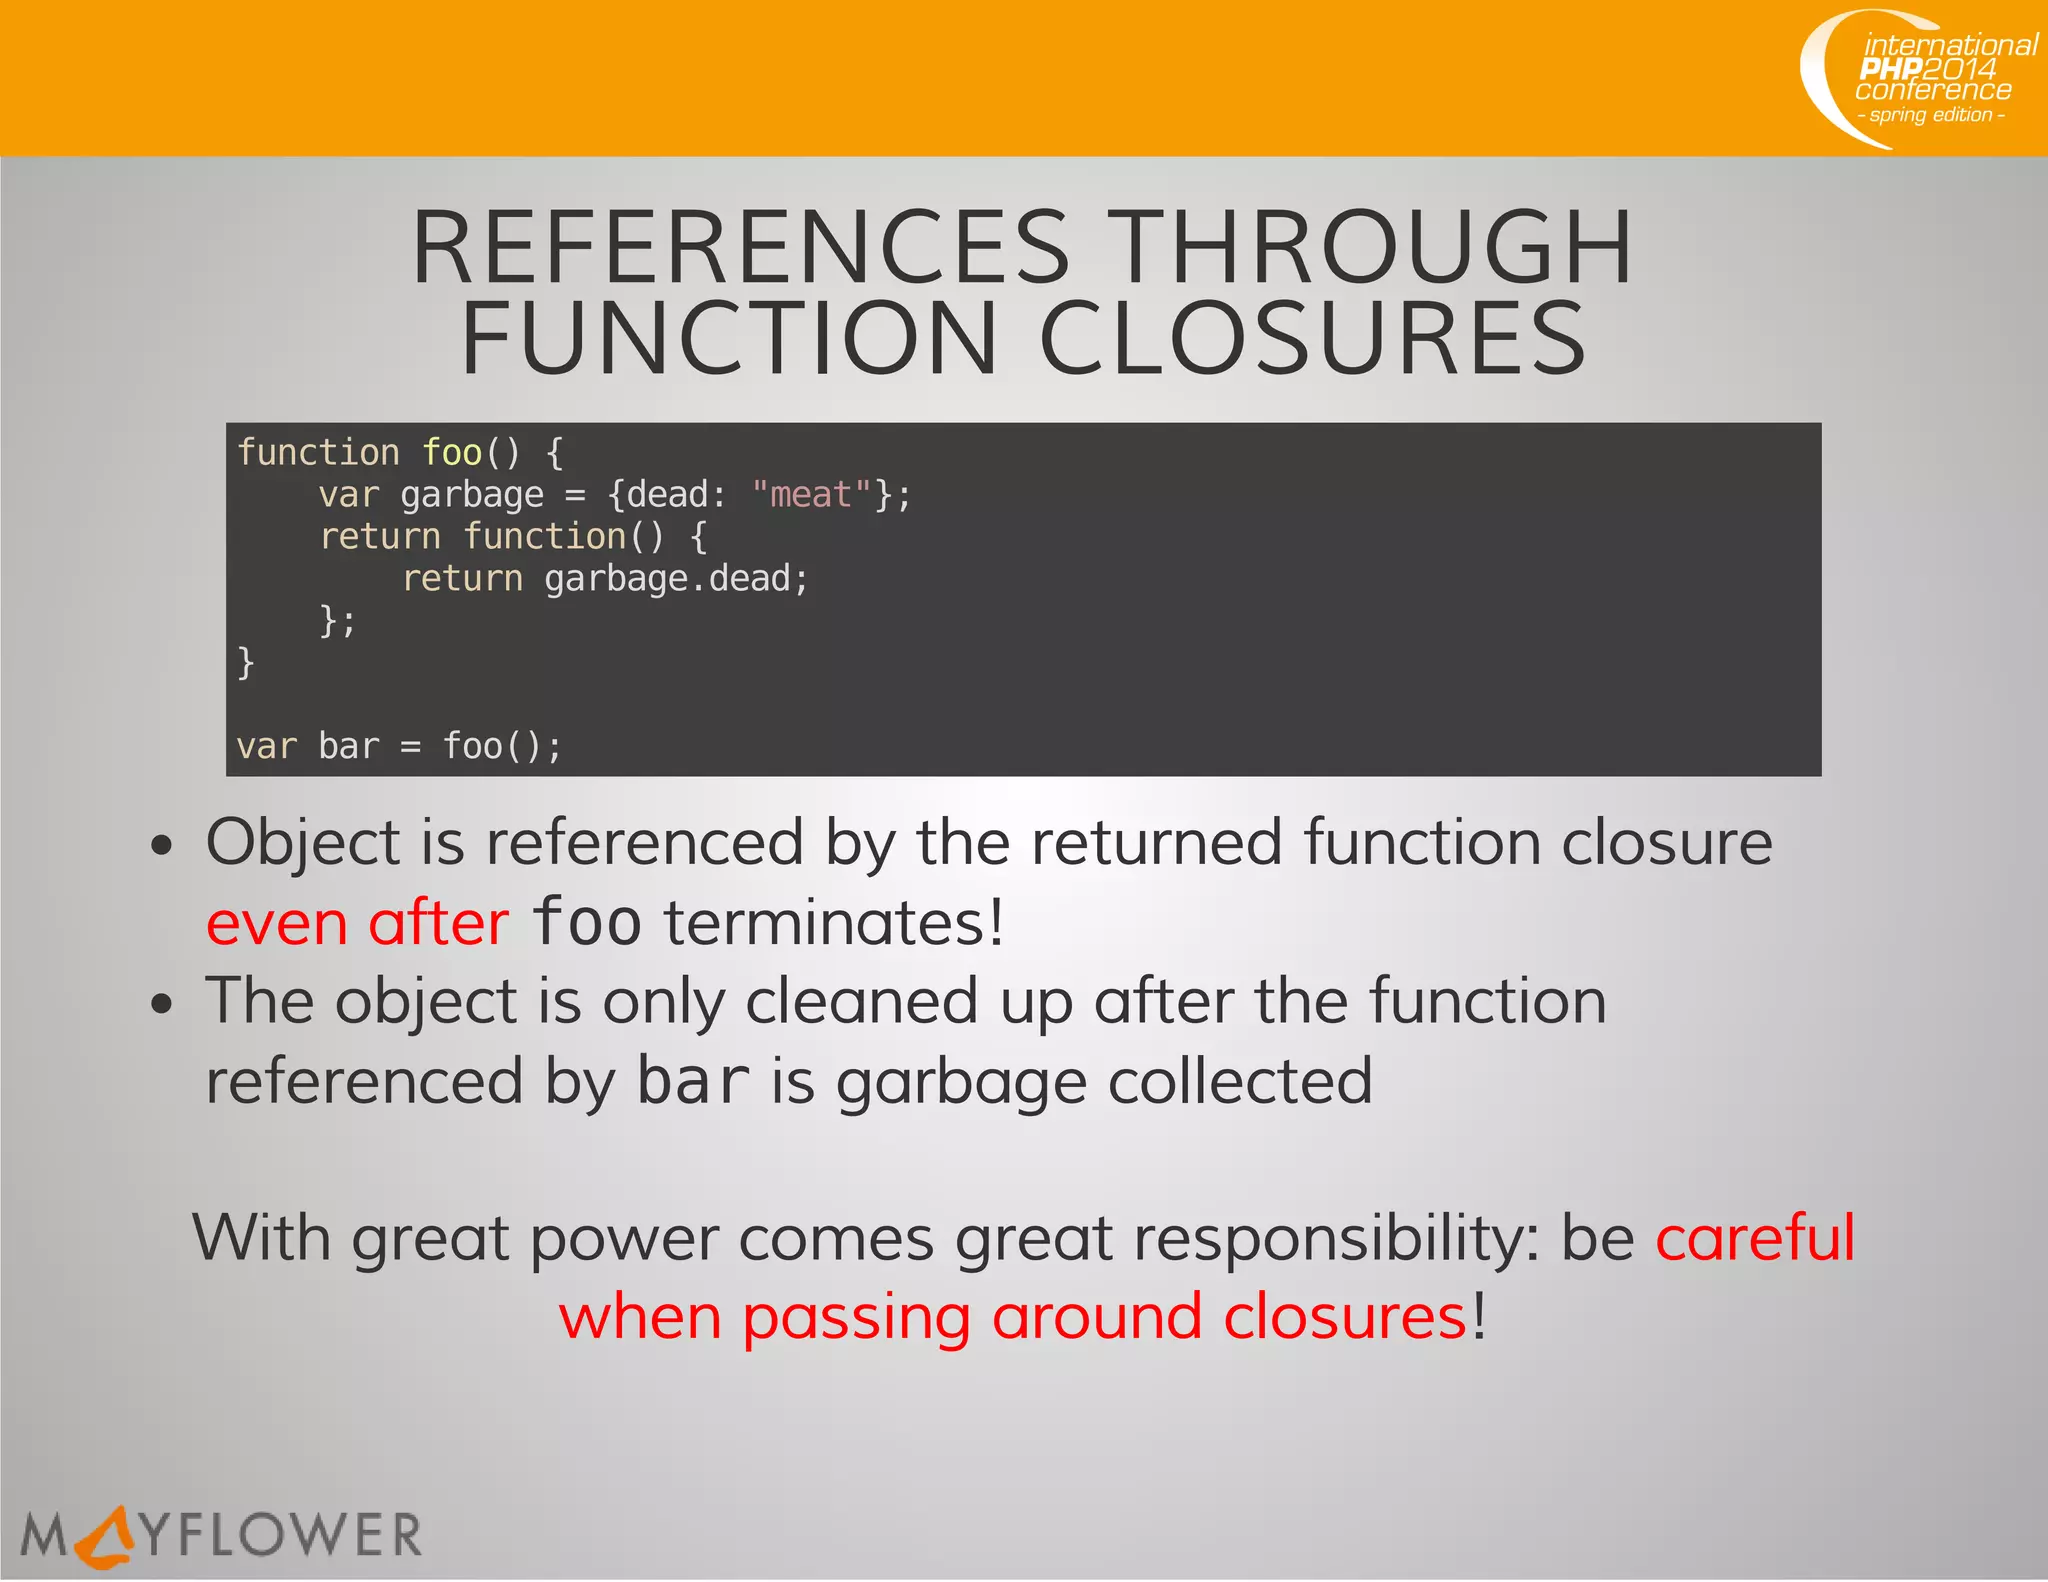
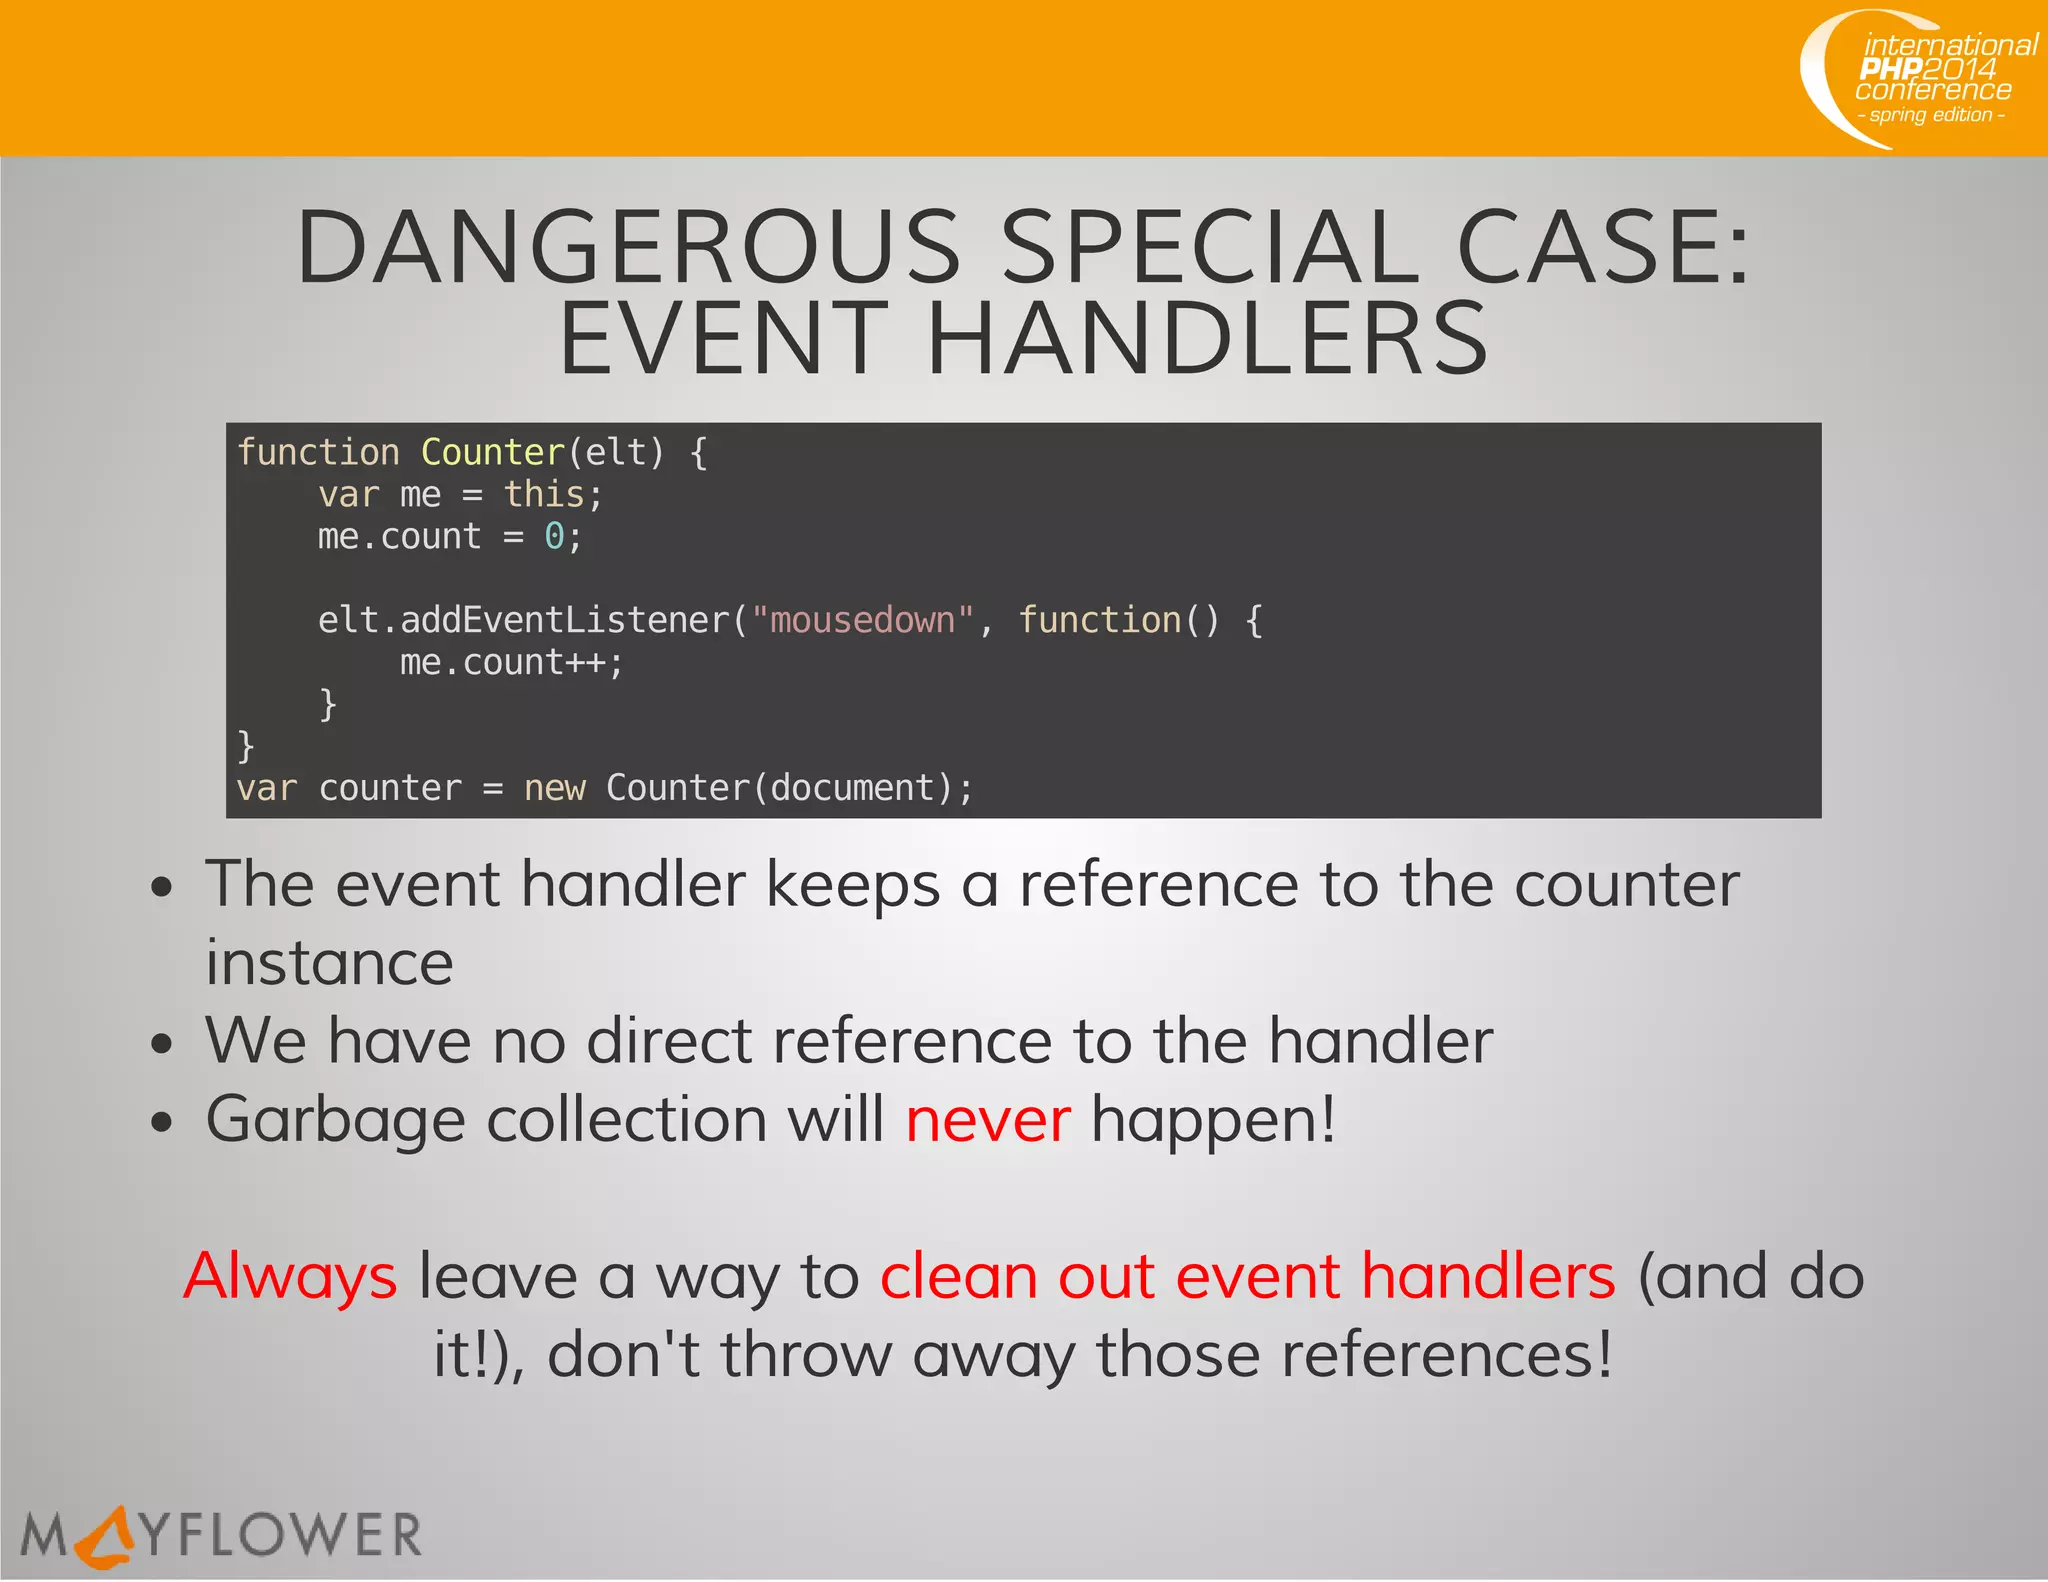
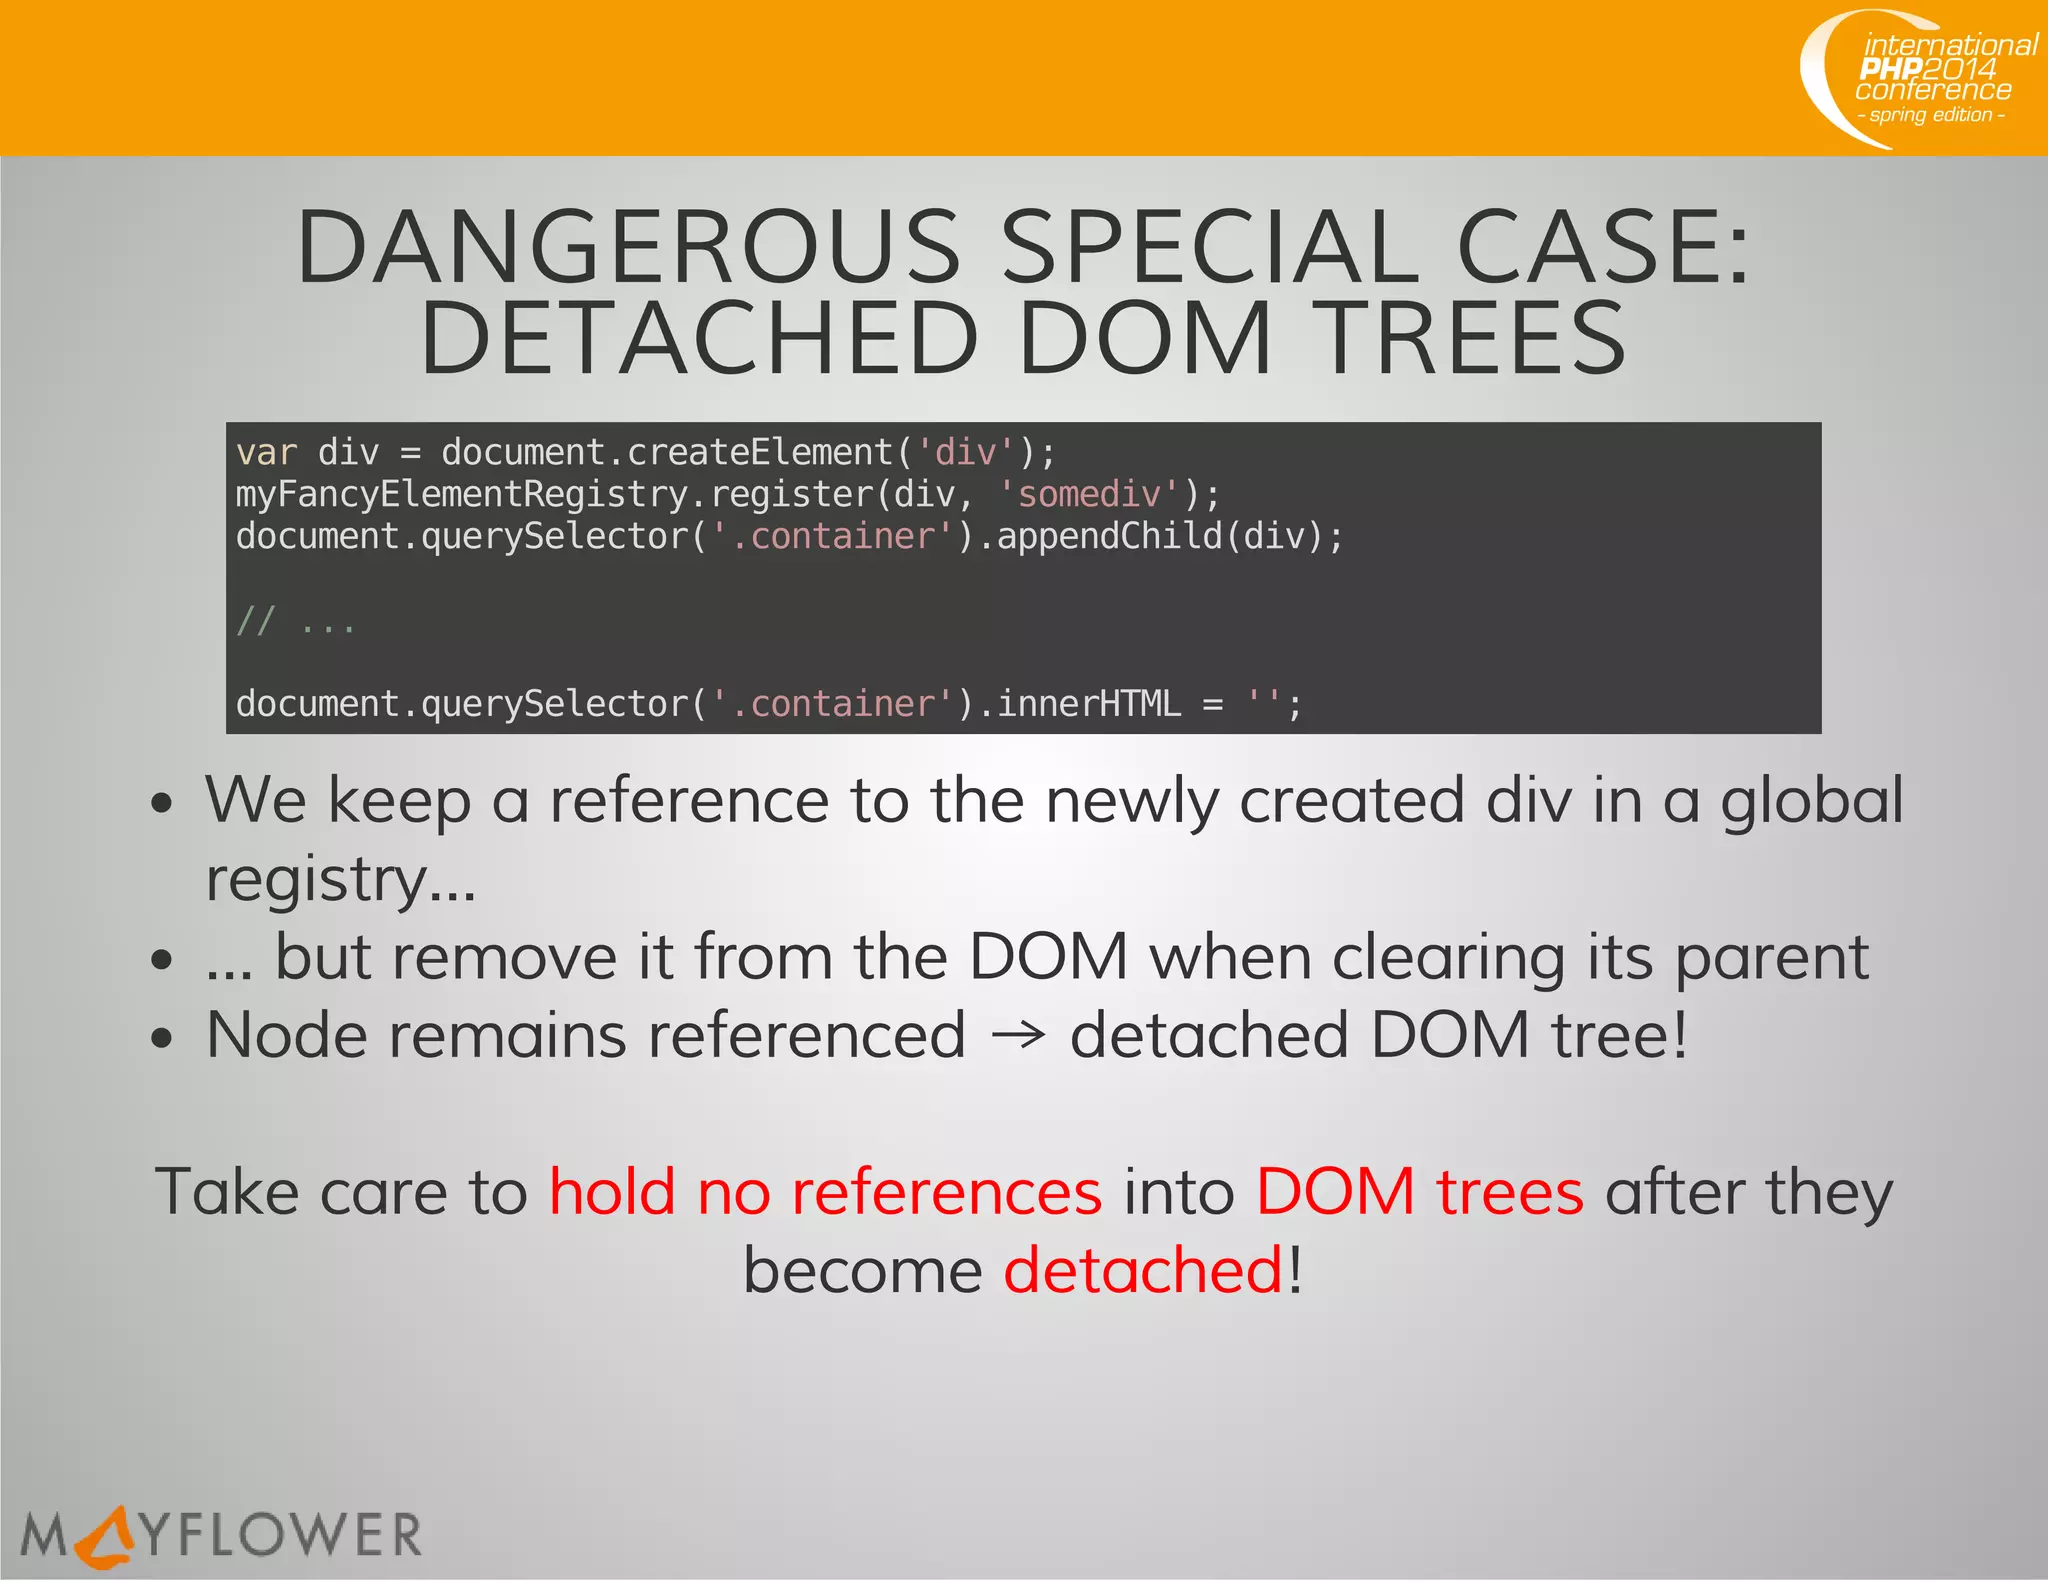


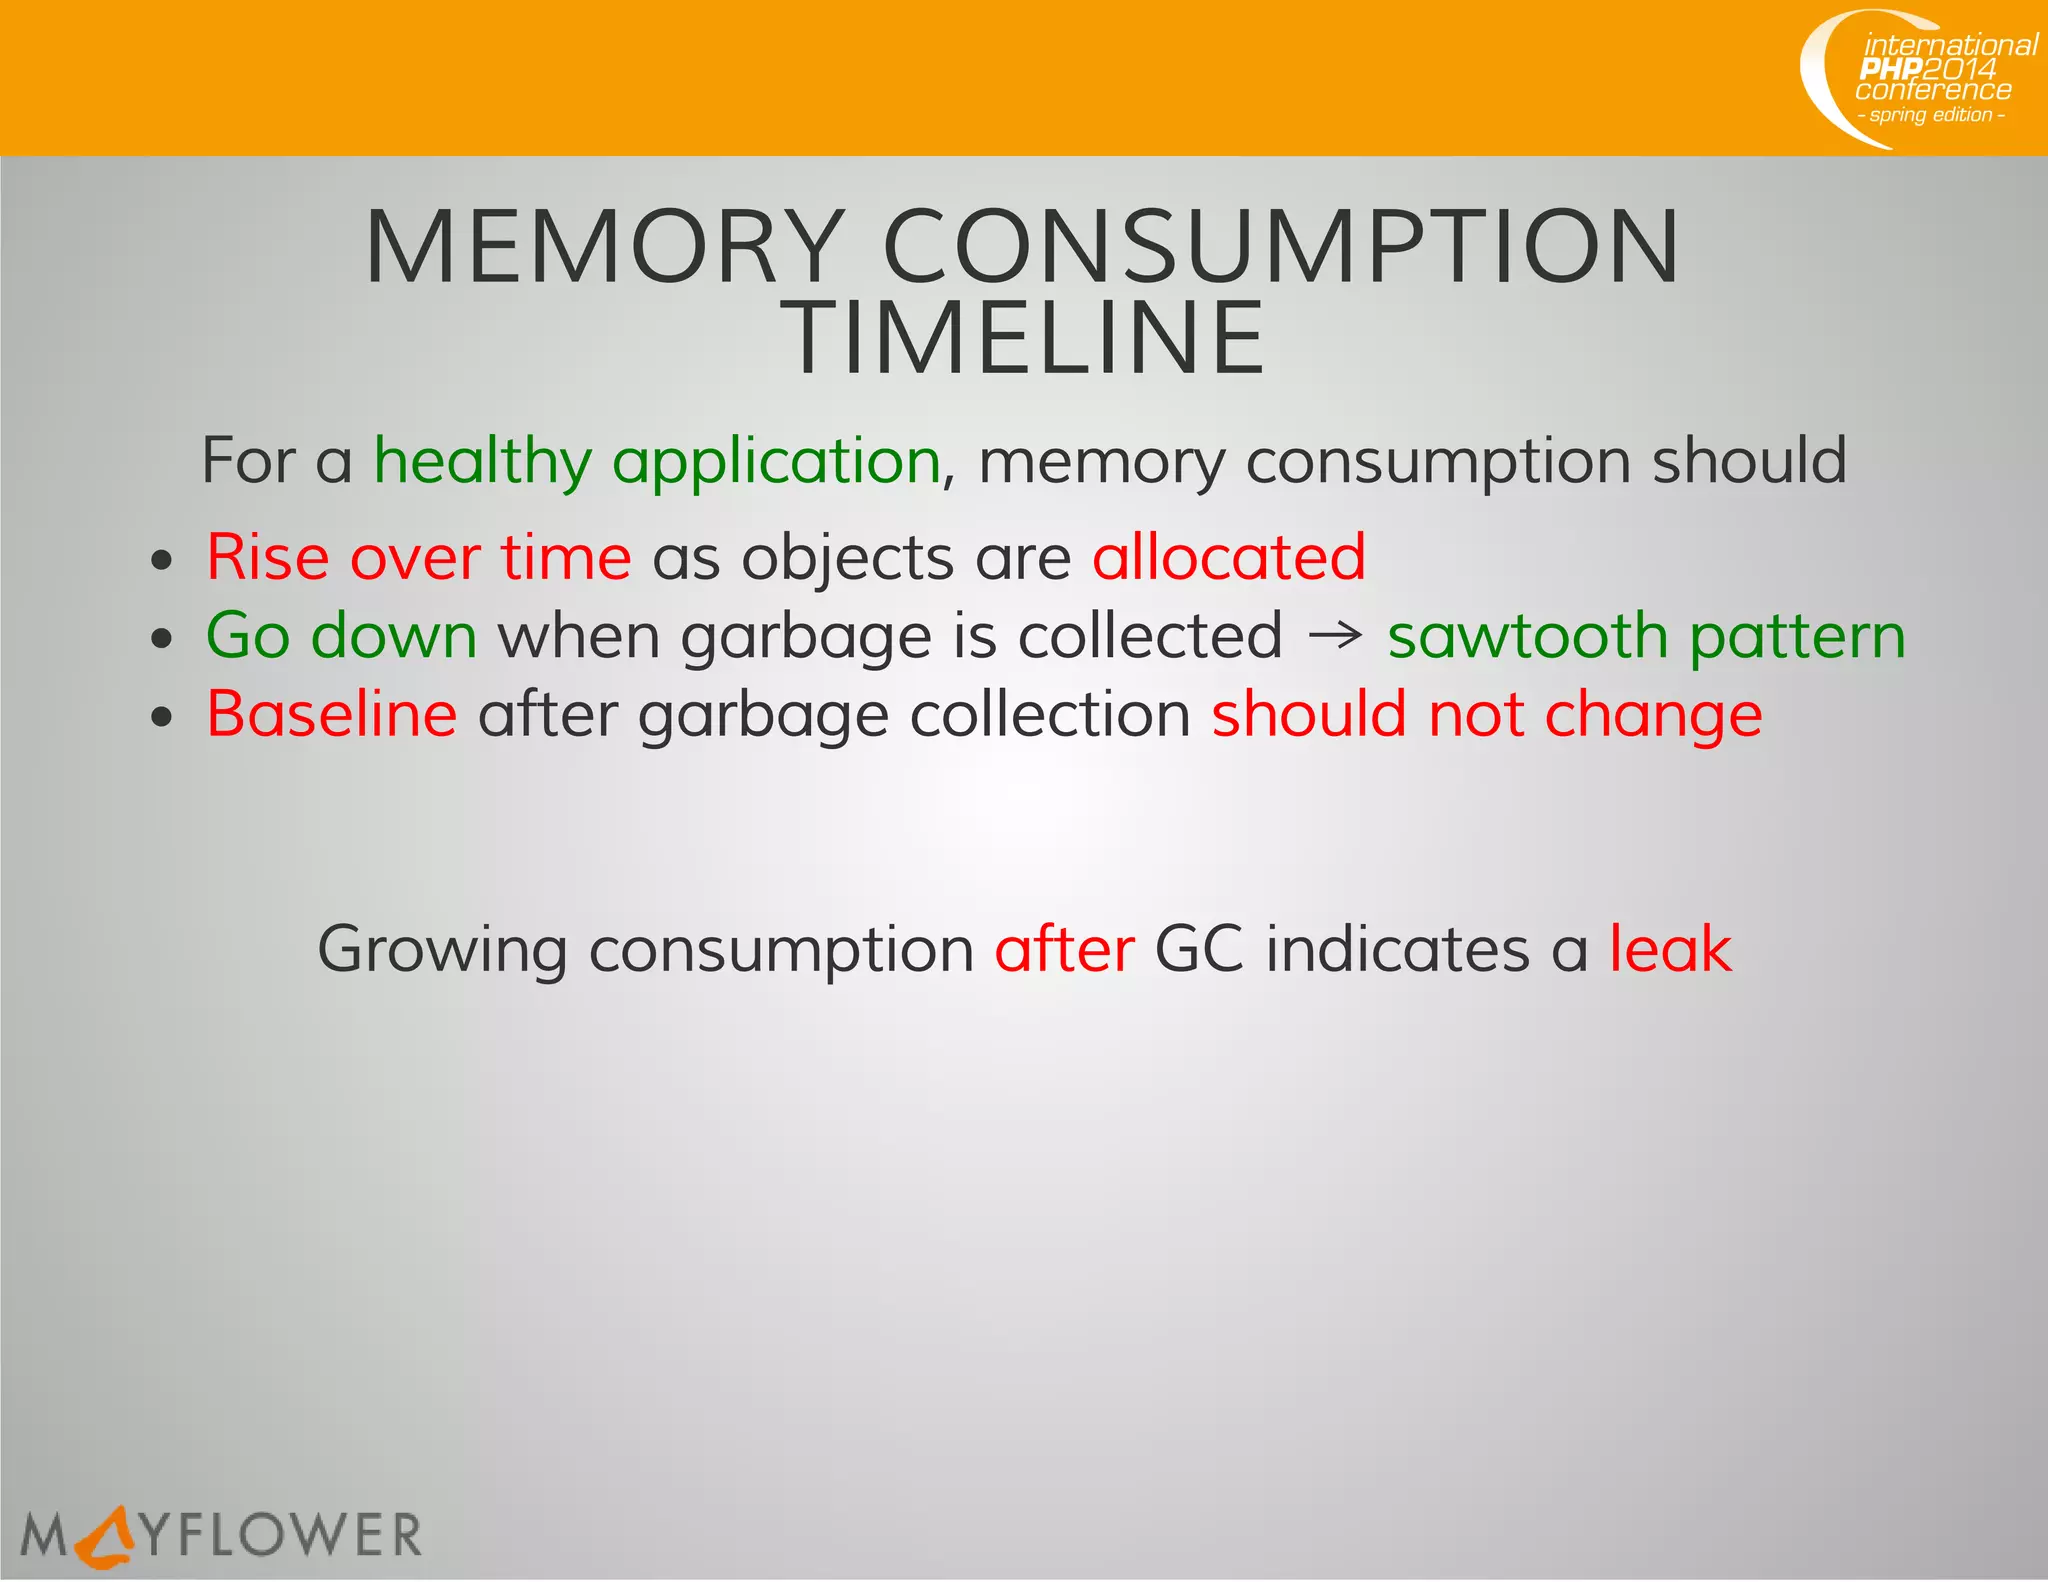
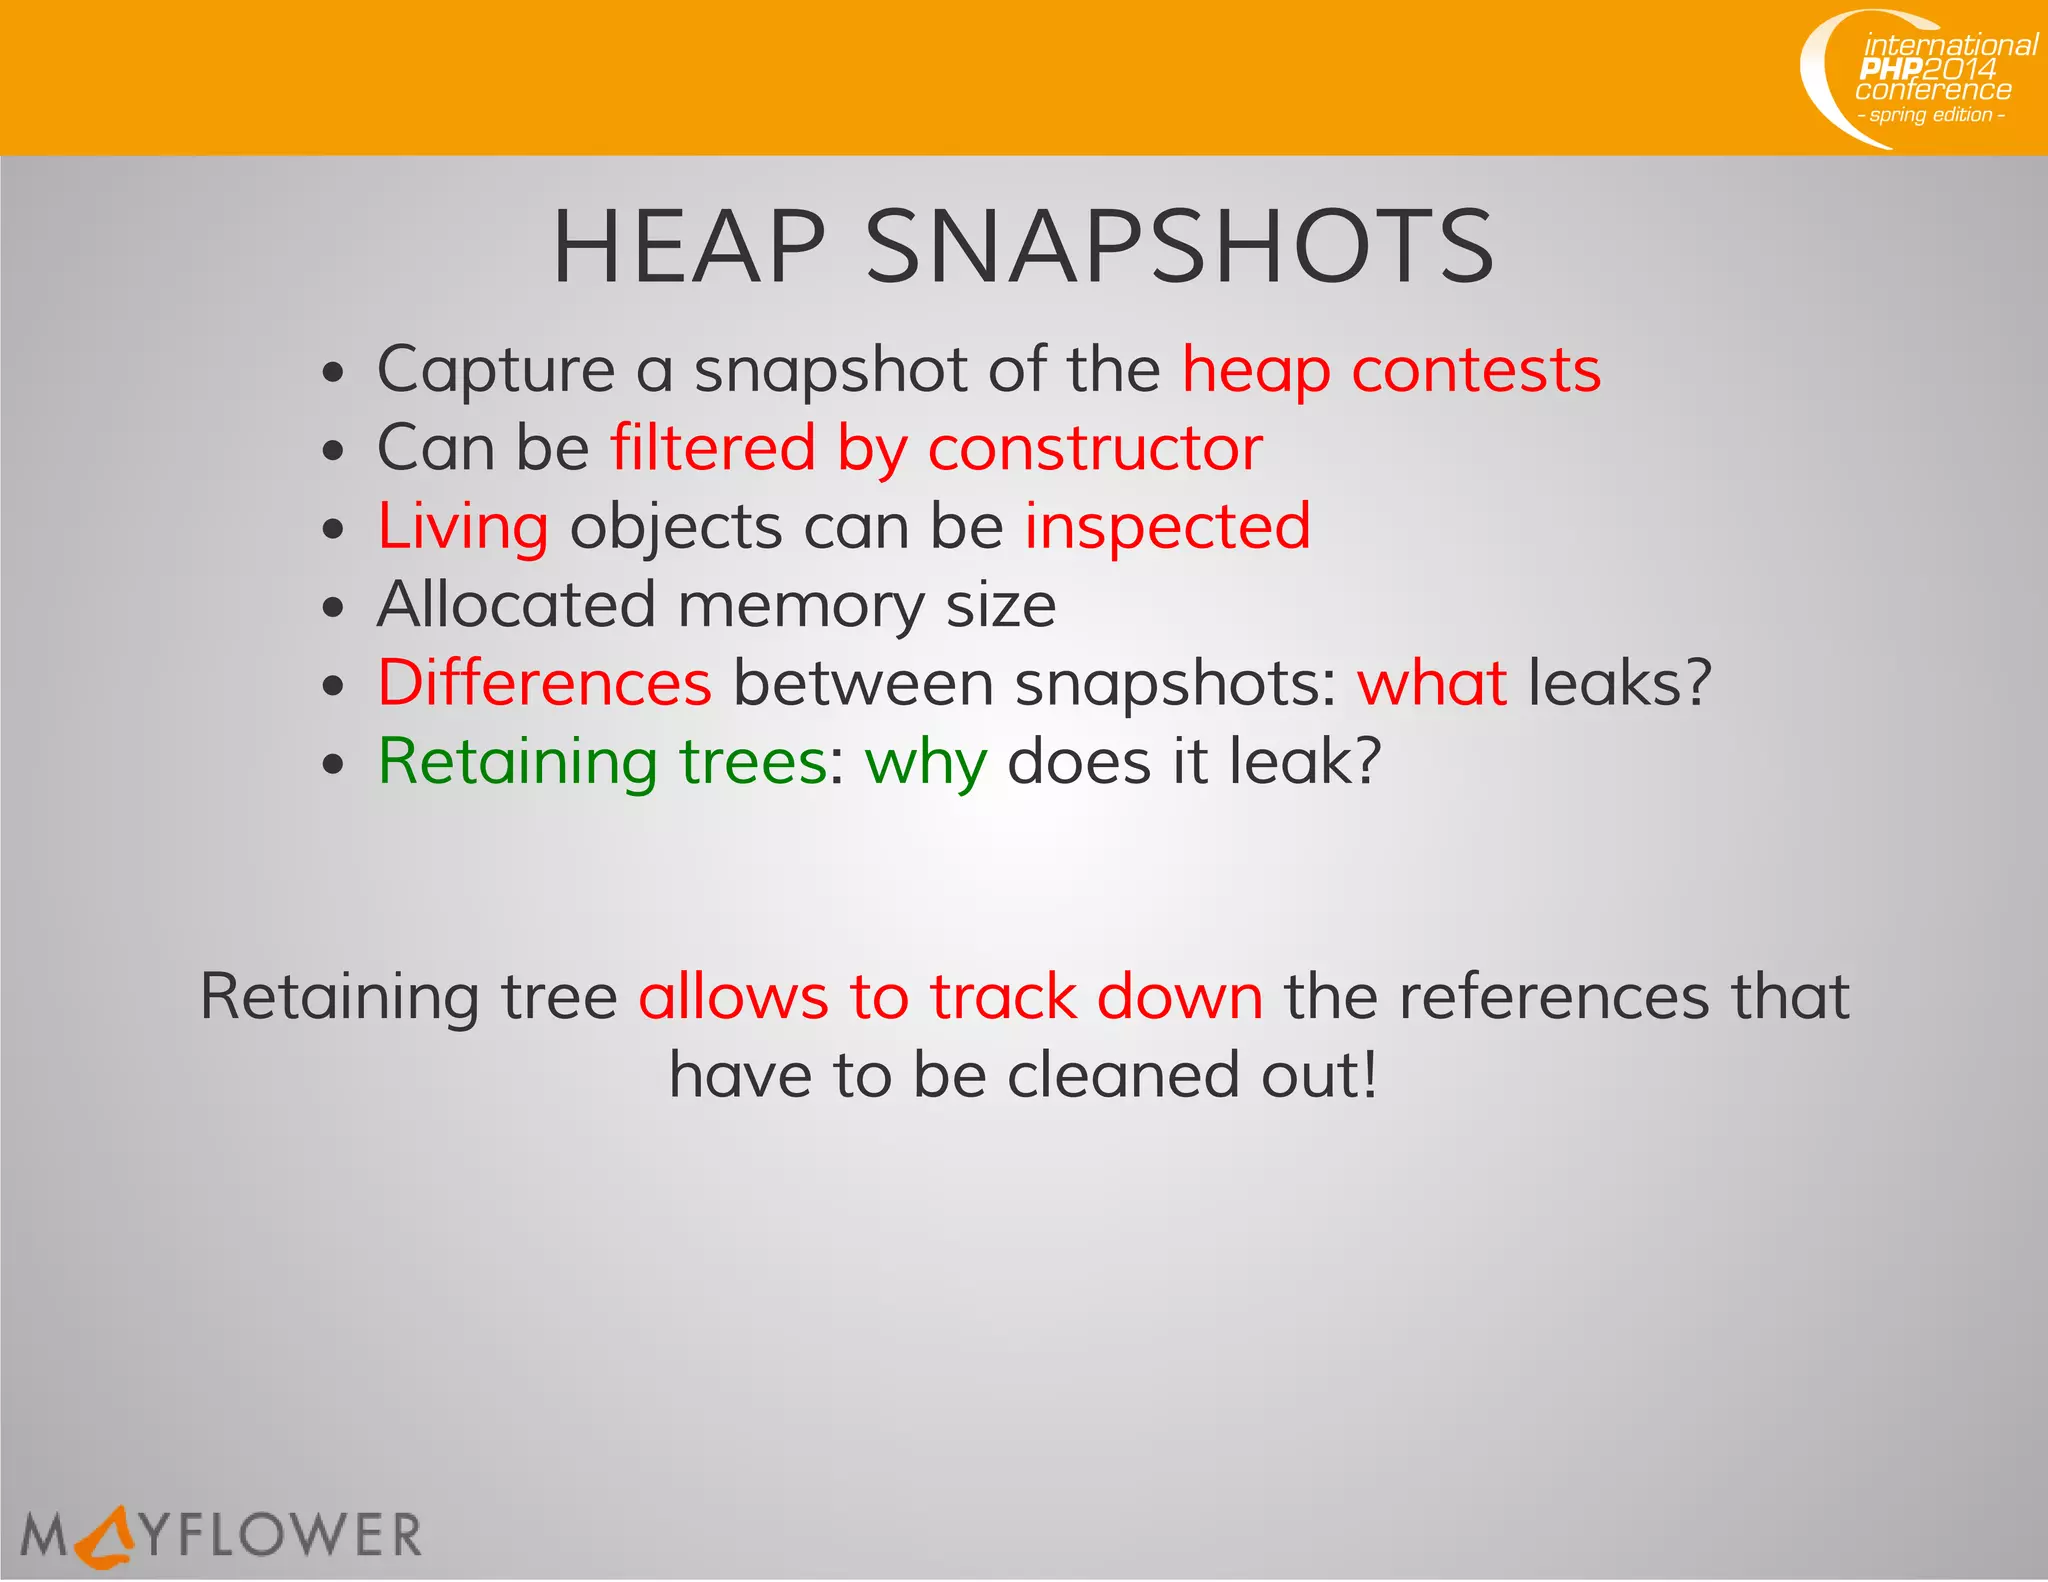
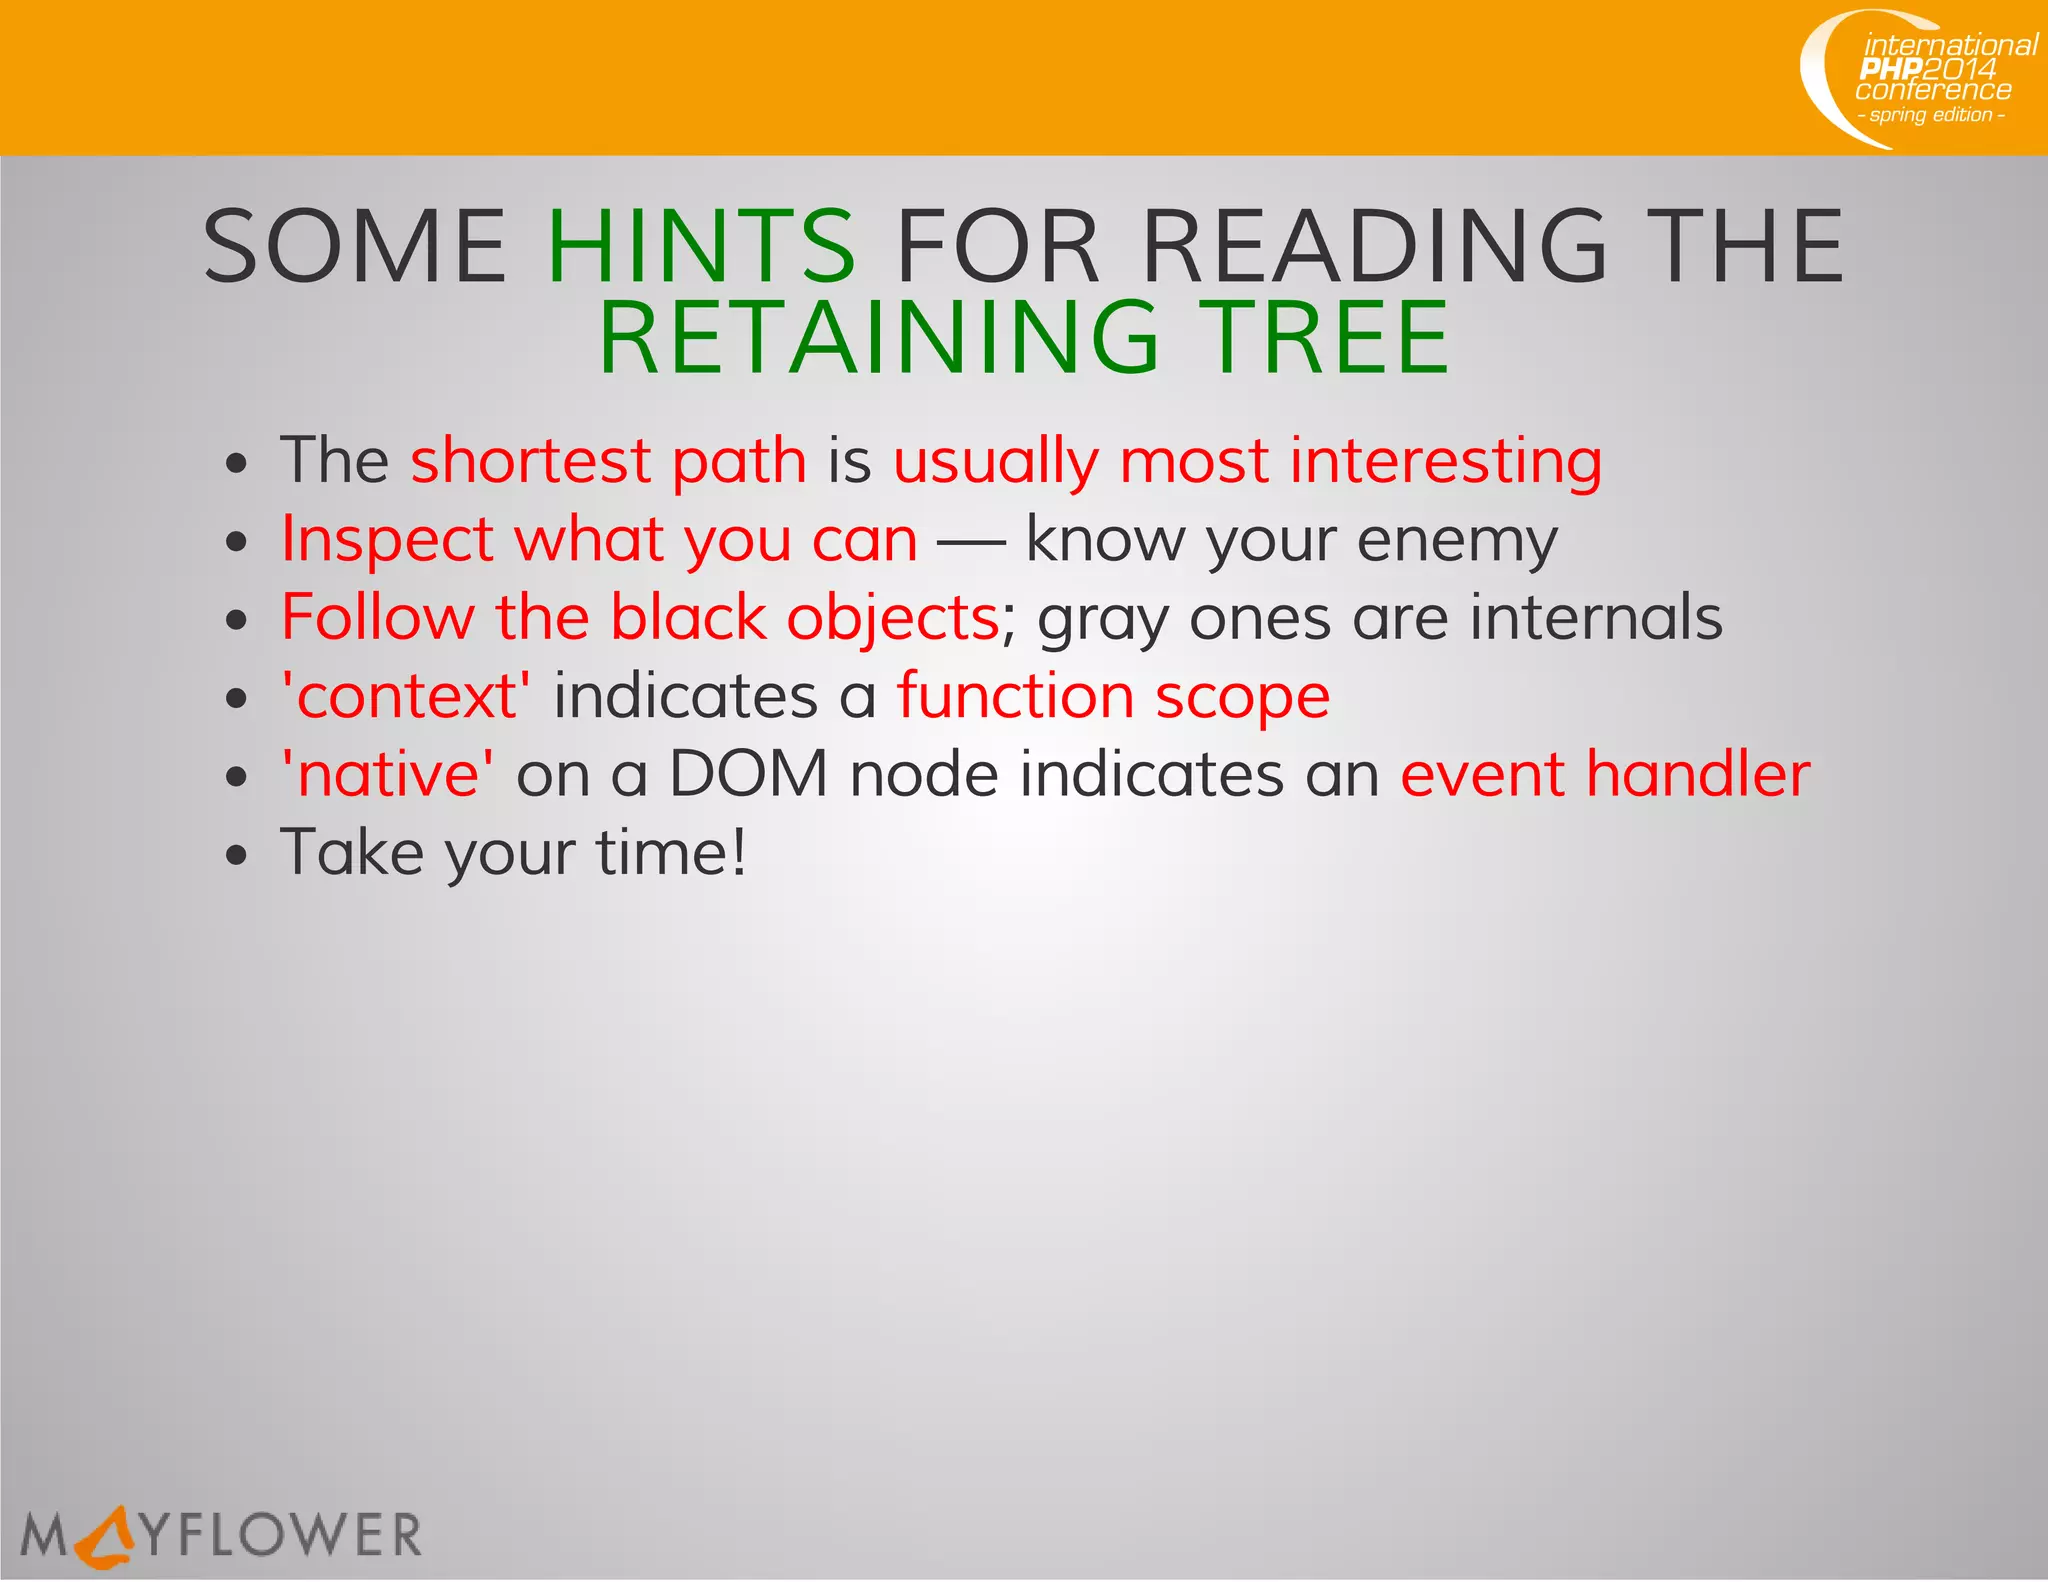


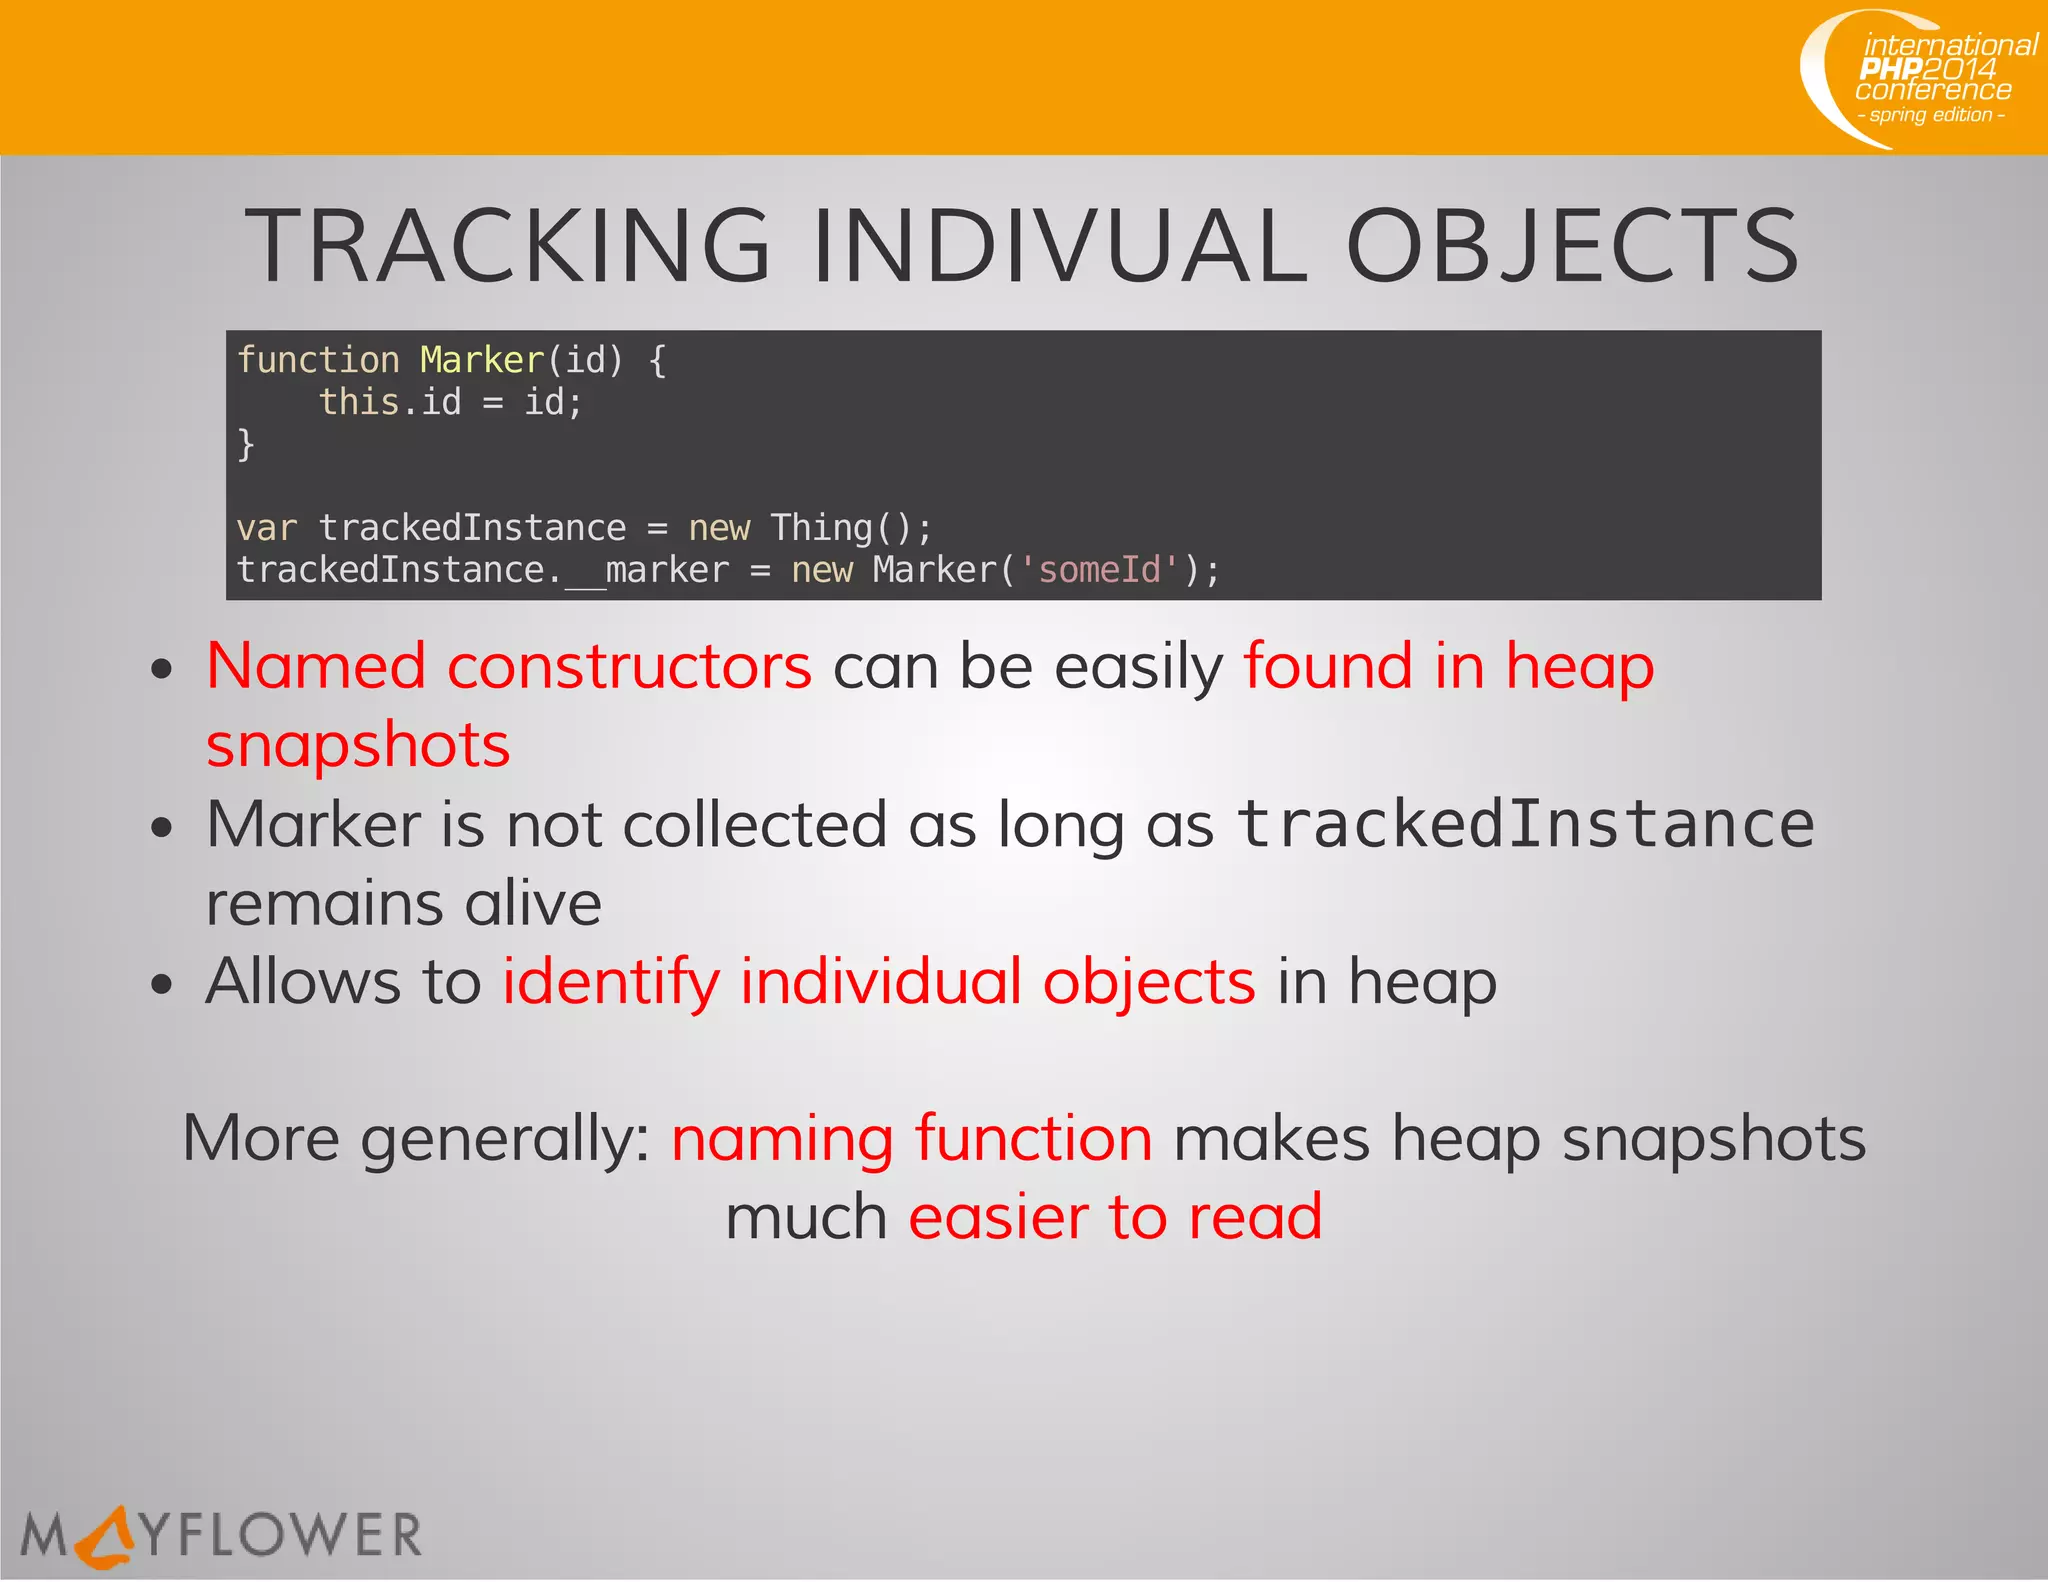
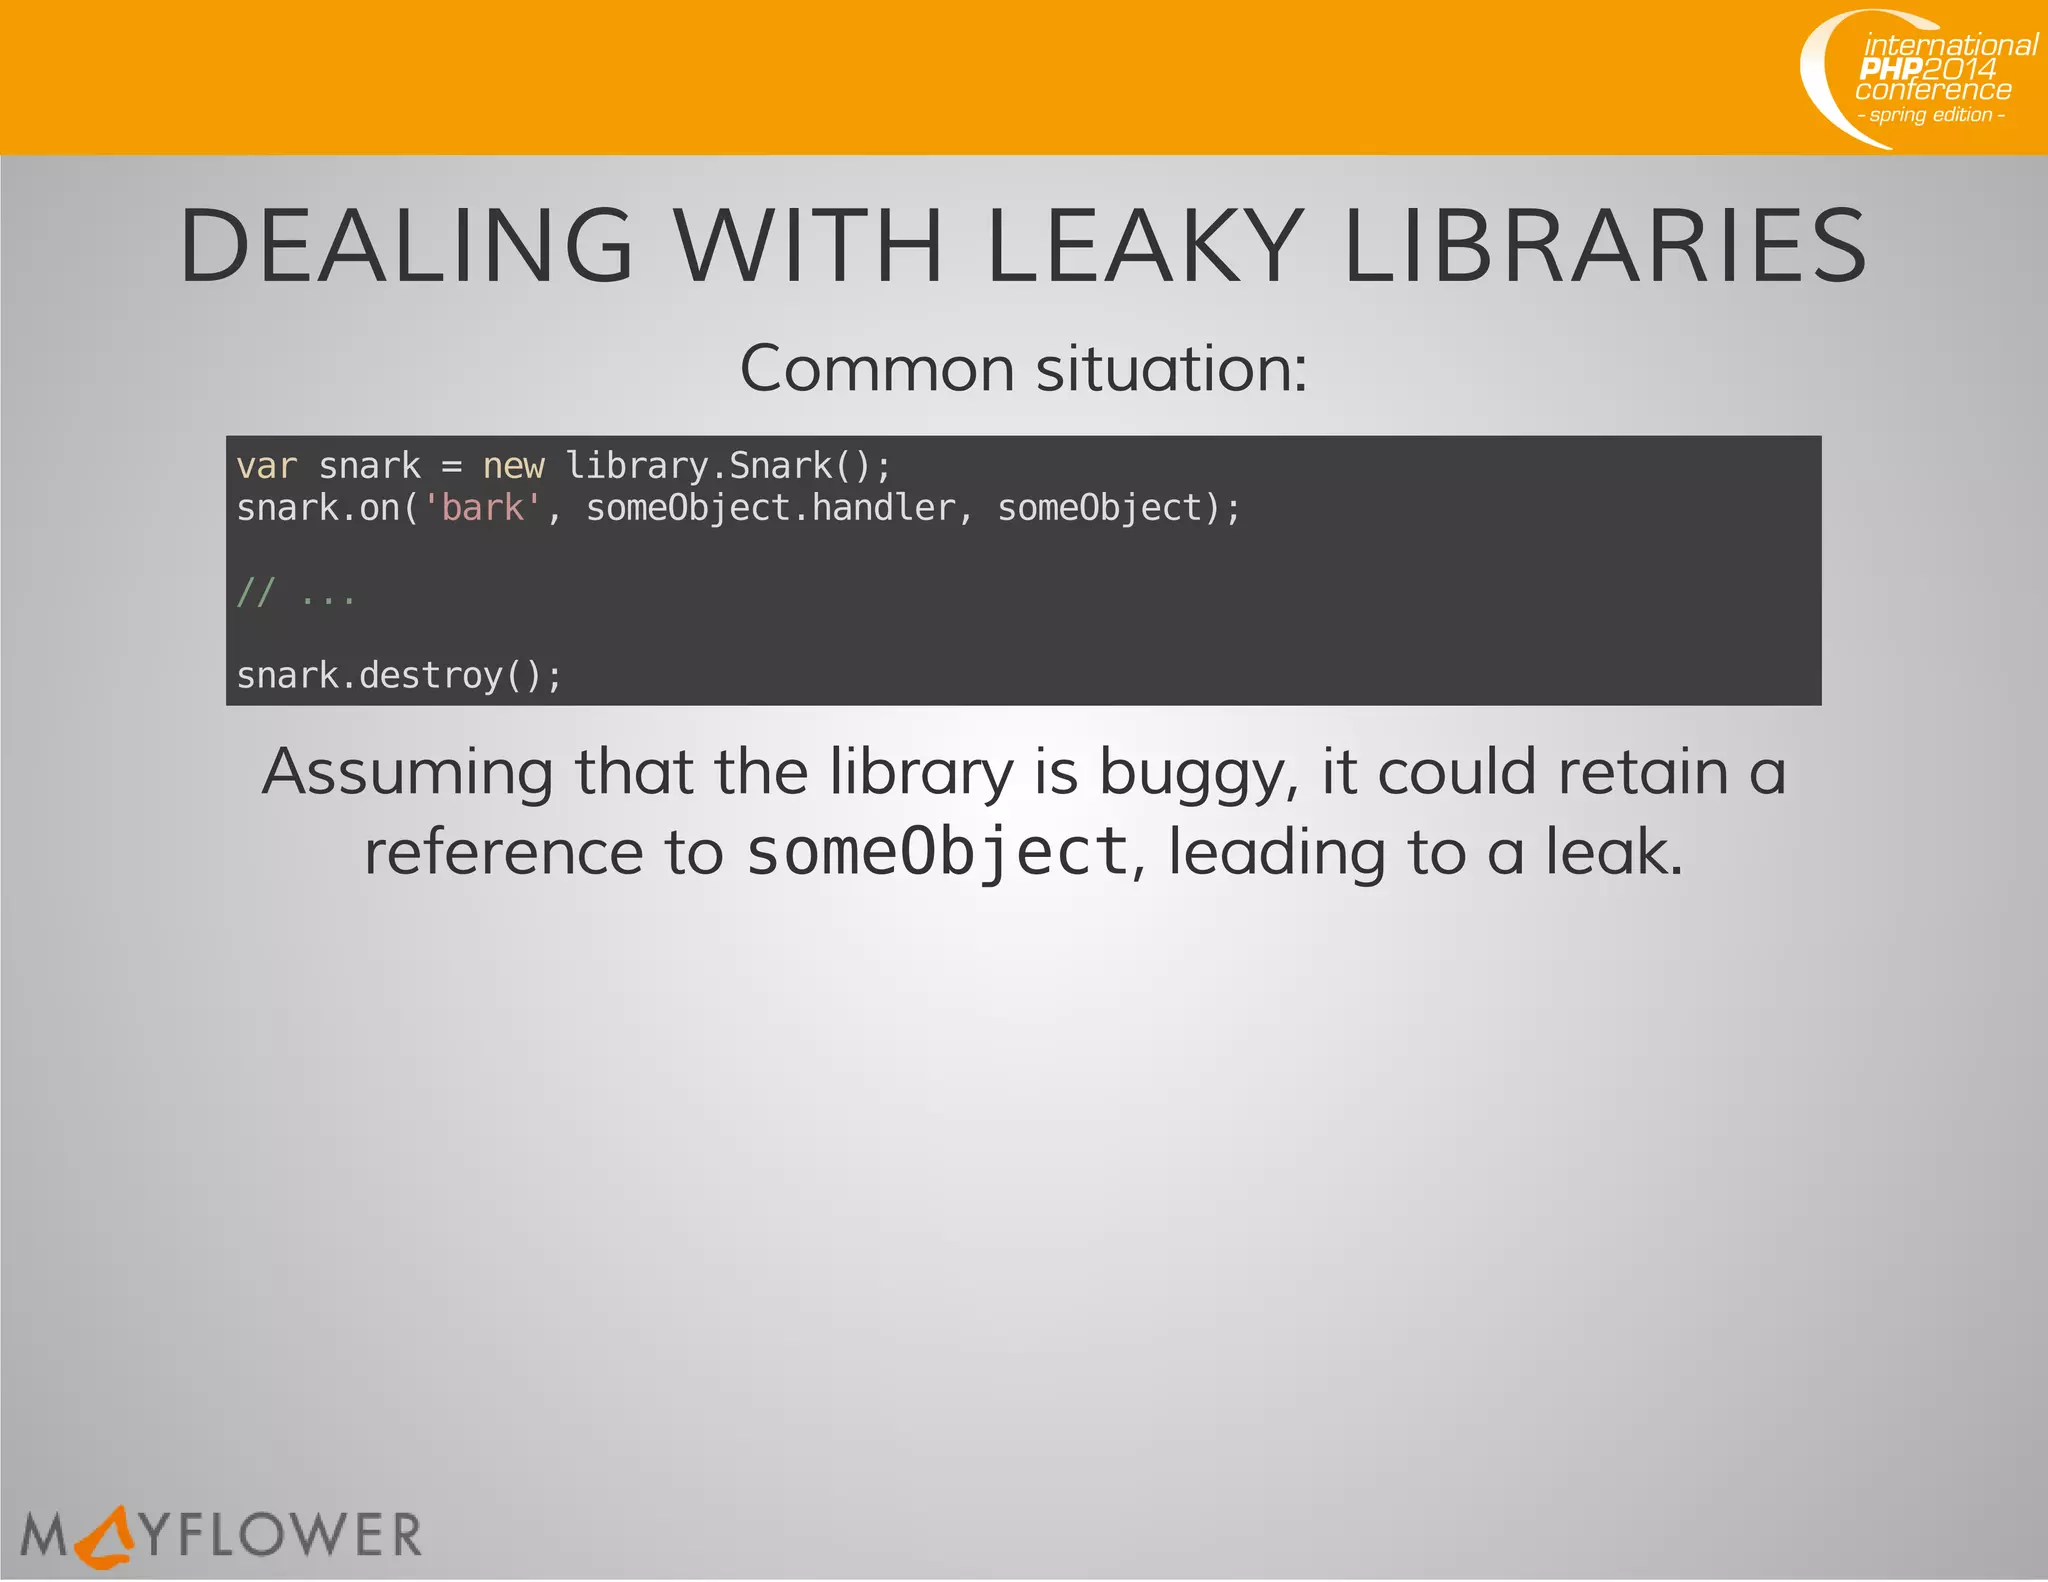
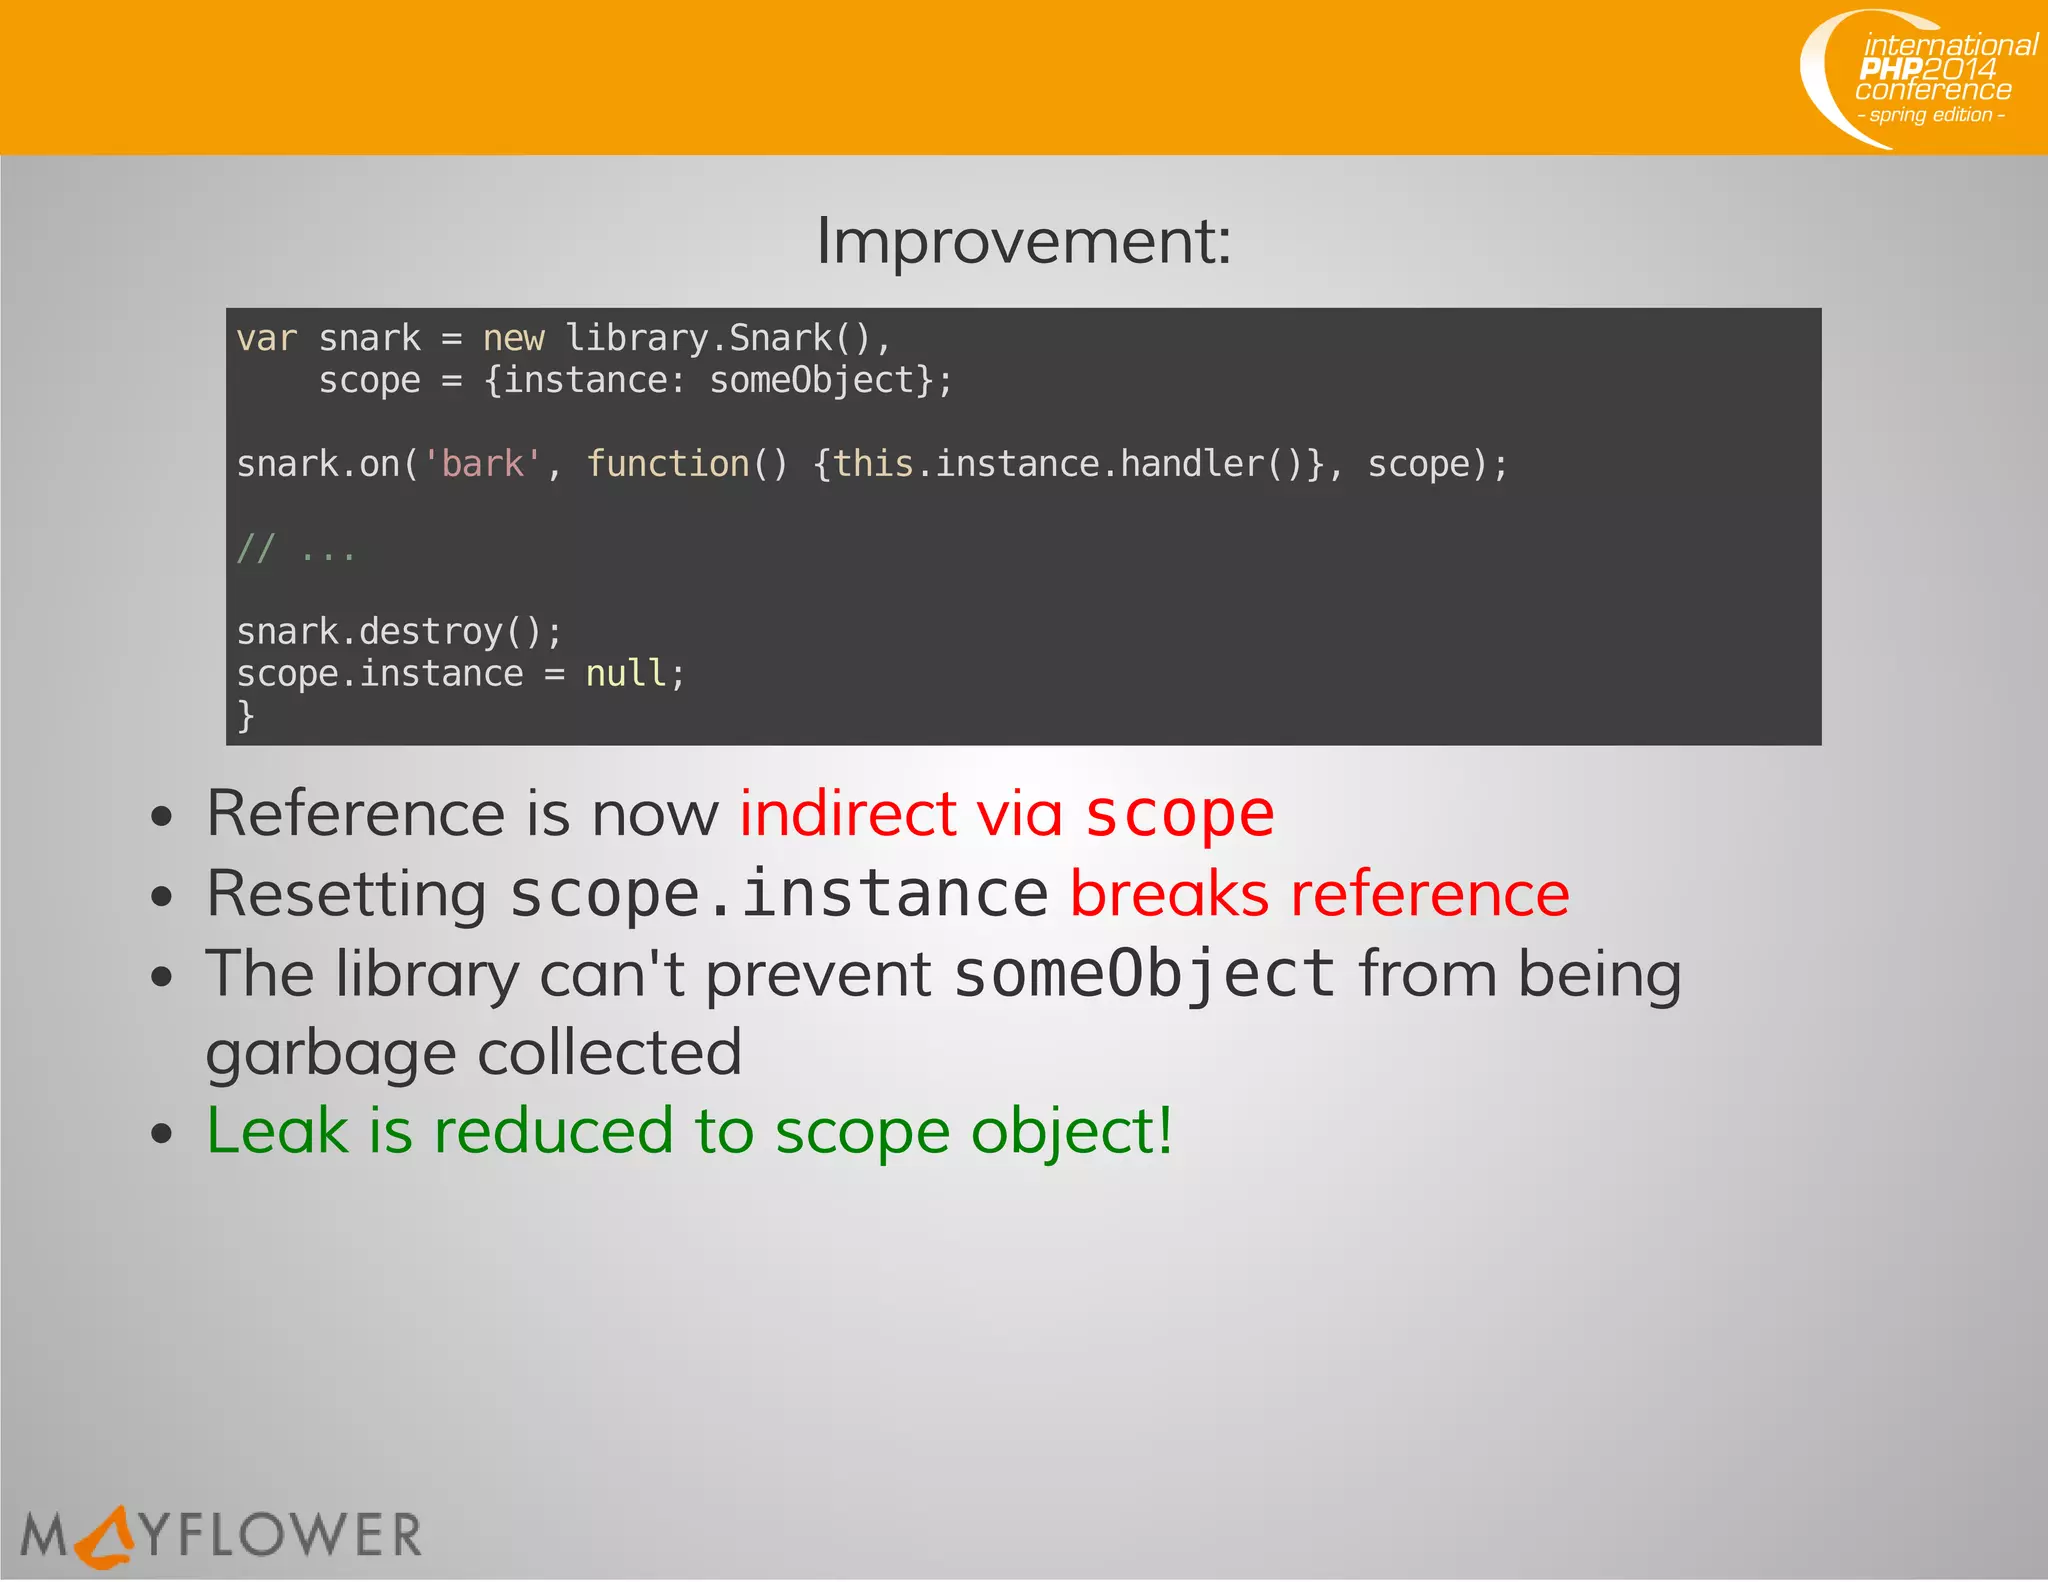


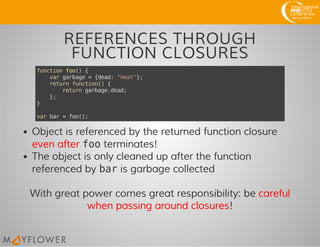
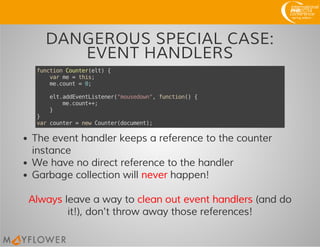
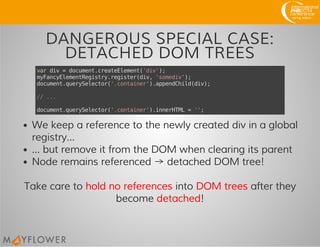
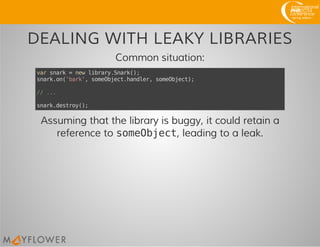
This document discusses JavaScript memory leaks and how to debug them. It defines a memory leak as occurring when memory is allocated but not freed by a program. In JavaScript, memory allocation happens through object creation, and garbage collection frees memory. Memory leaks can happen if objects remain referenced and cannot be collected. The document provides tips on how to use Chrome DevTools to analyze heap snapshots and timelines to find leaks, including cases around scopes, properties, closures, events, and detached DOM trees. It suggests strategies like naming functions, tracking individual objects, and handling leaky libraries.


