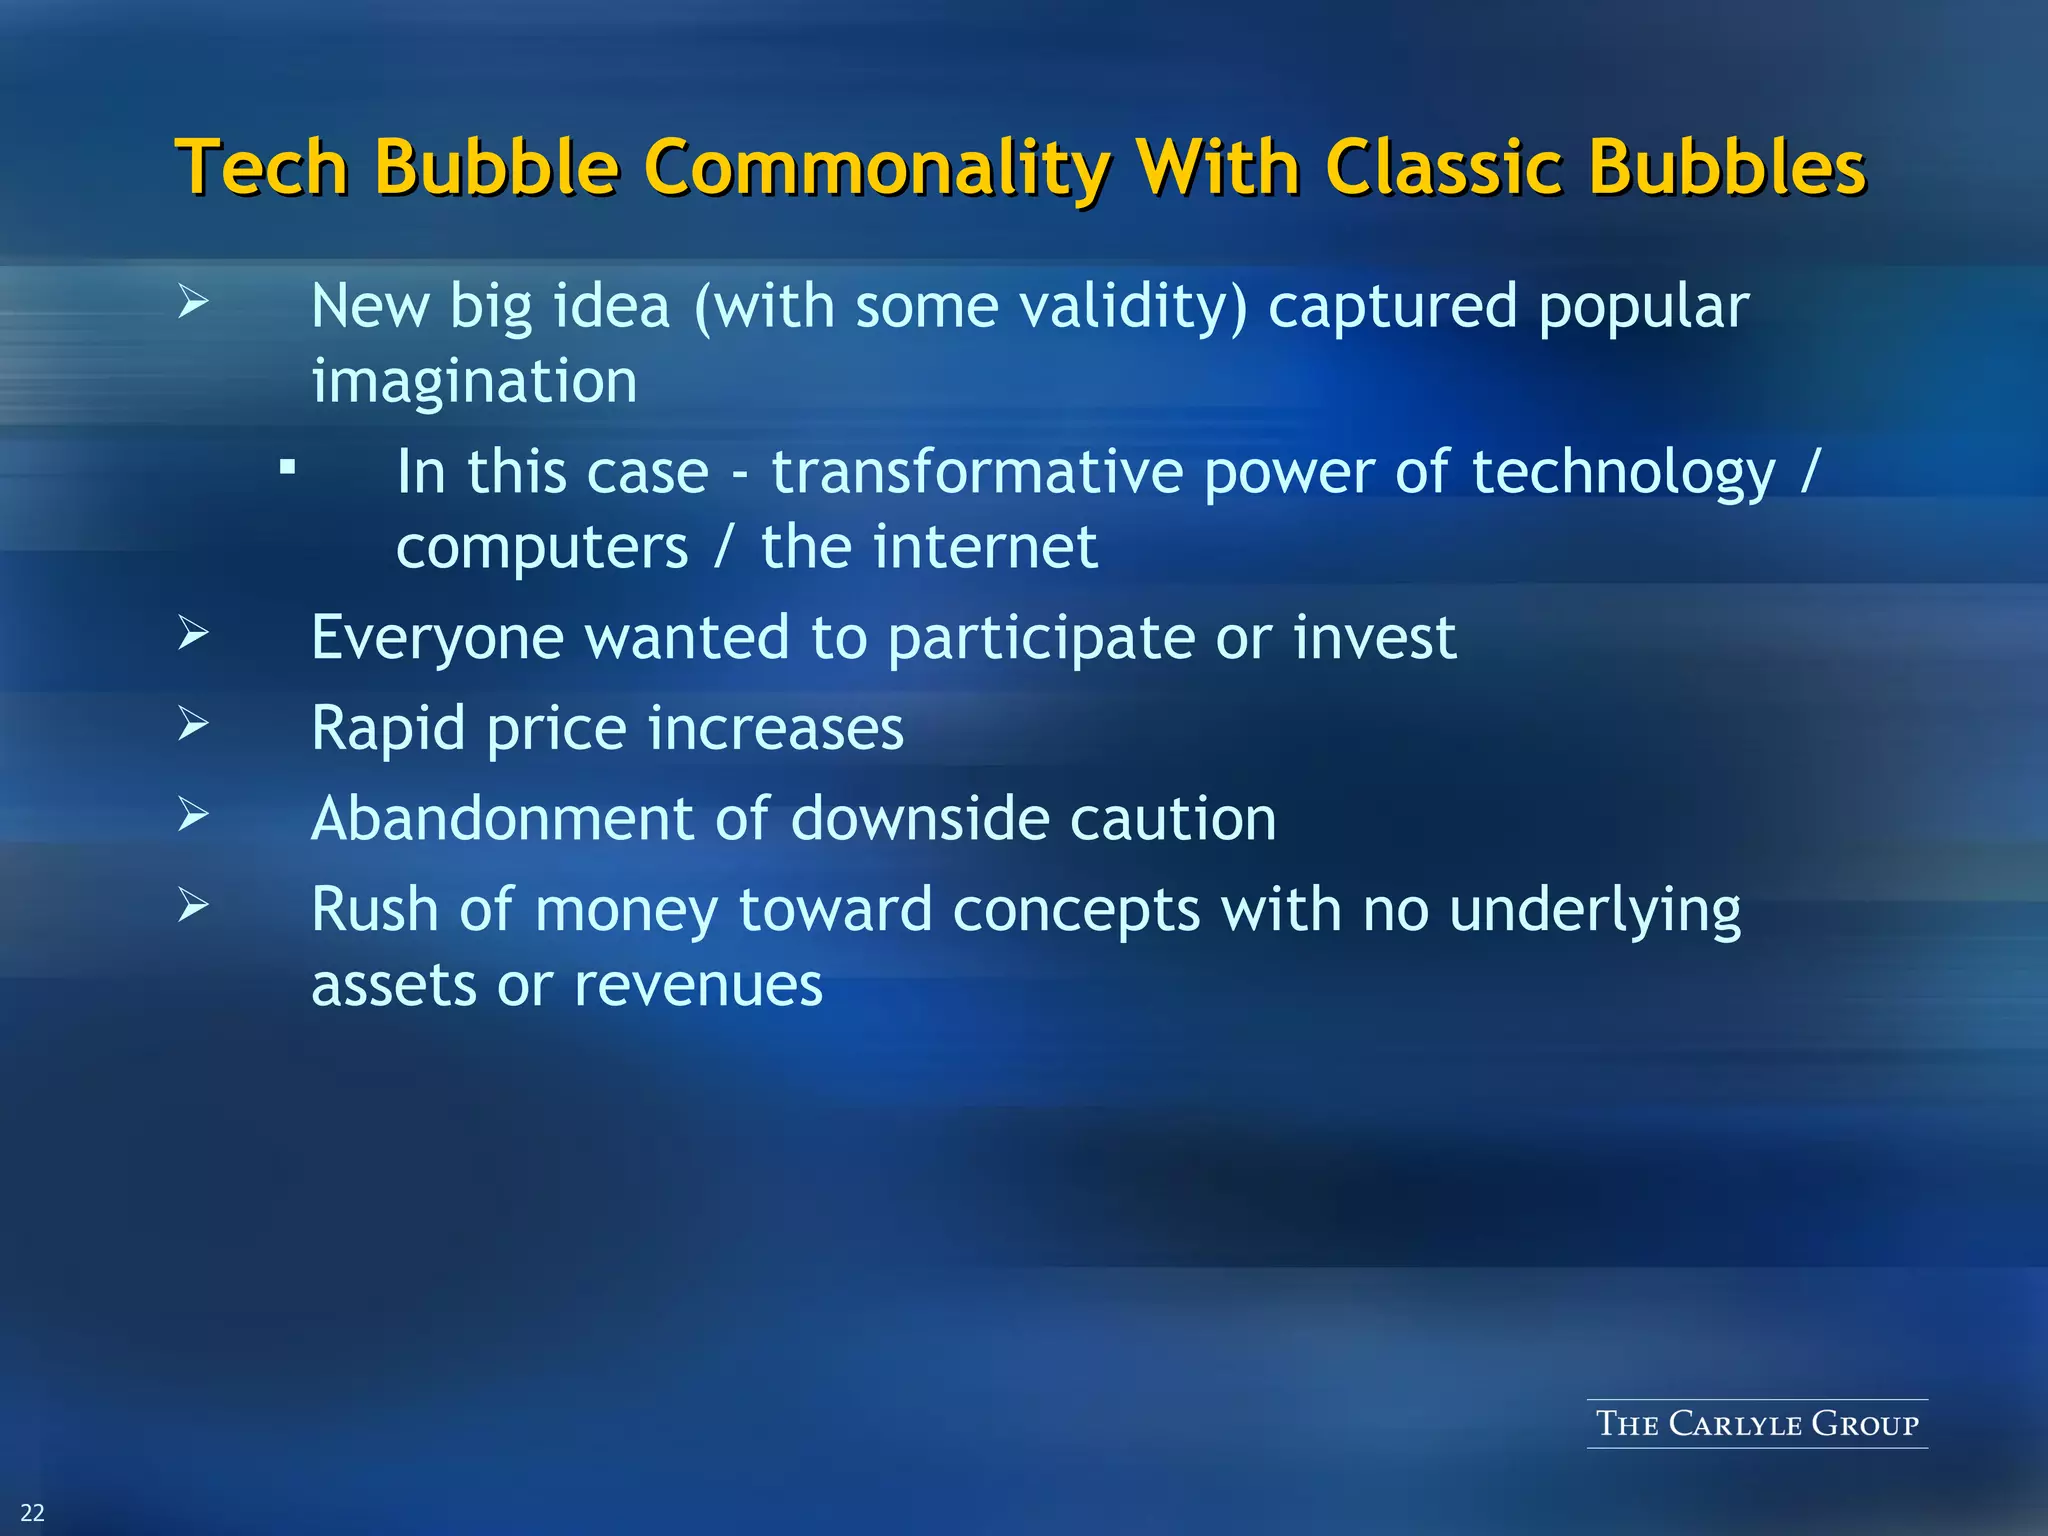
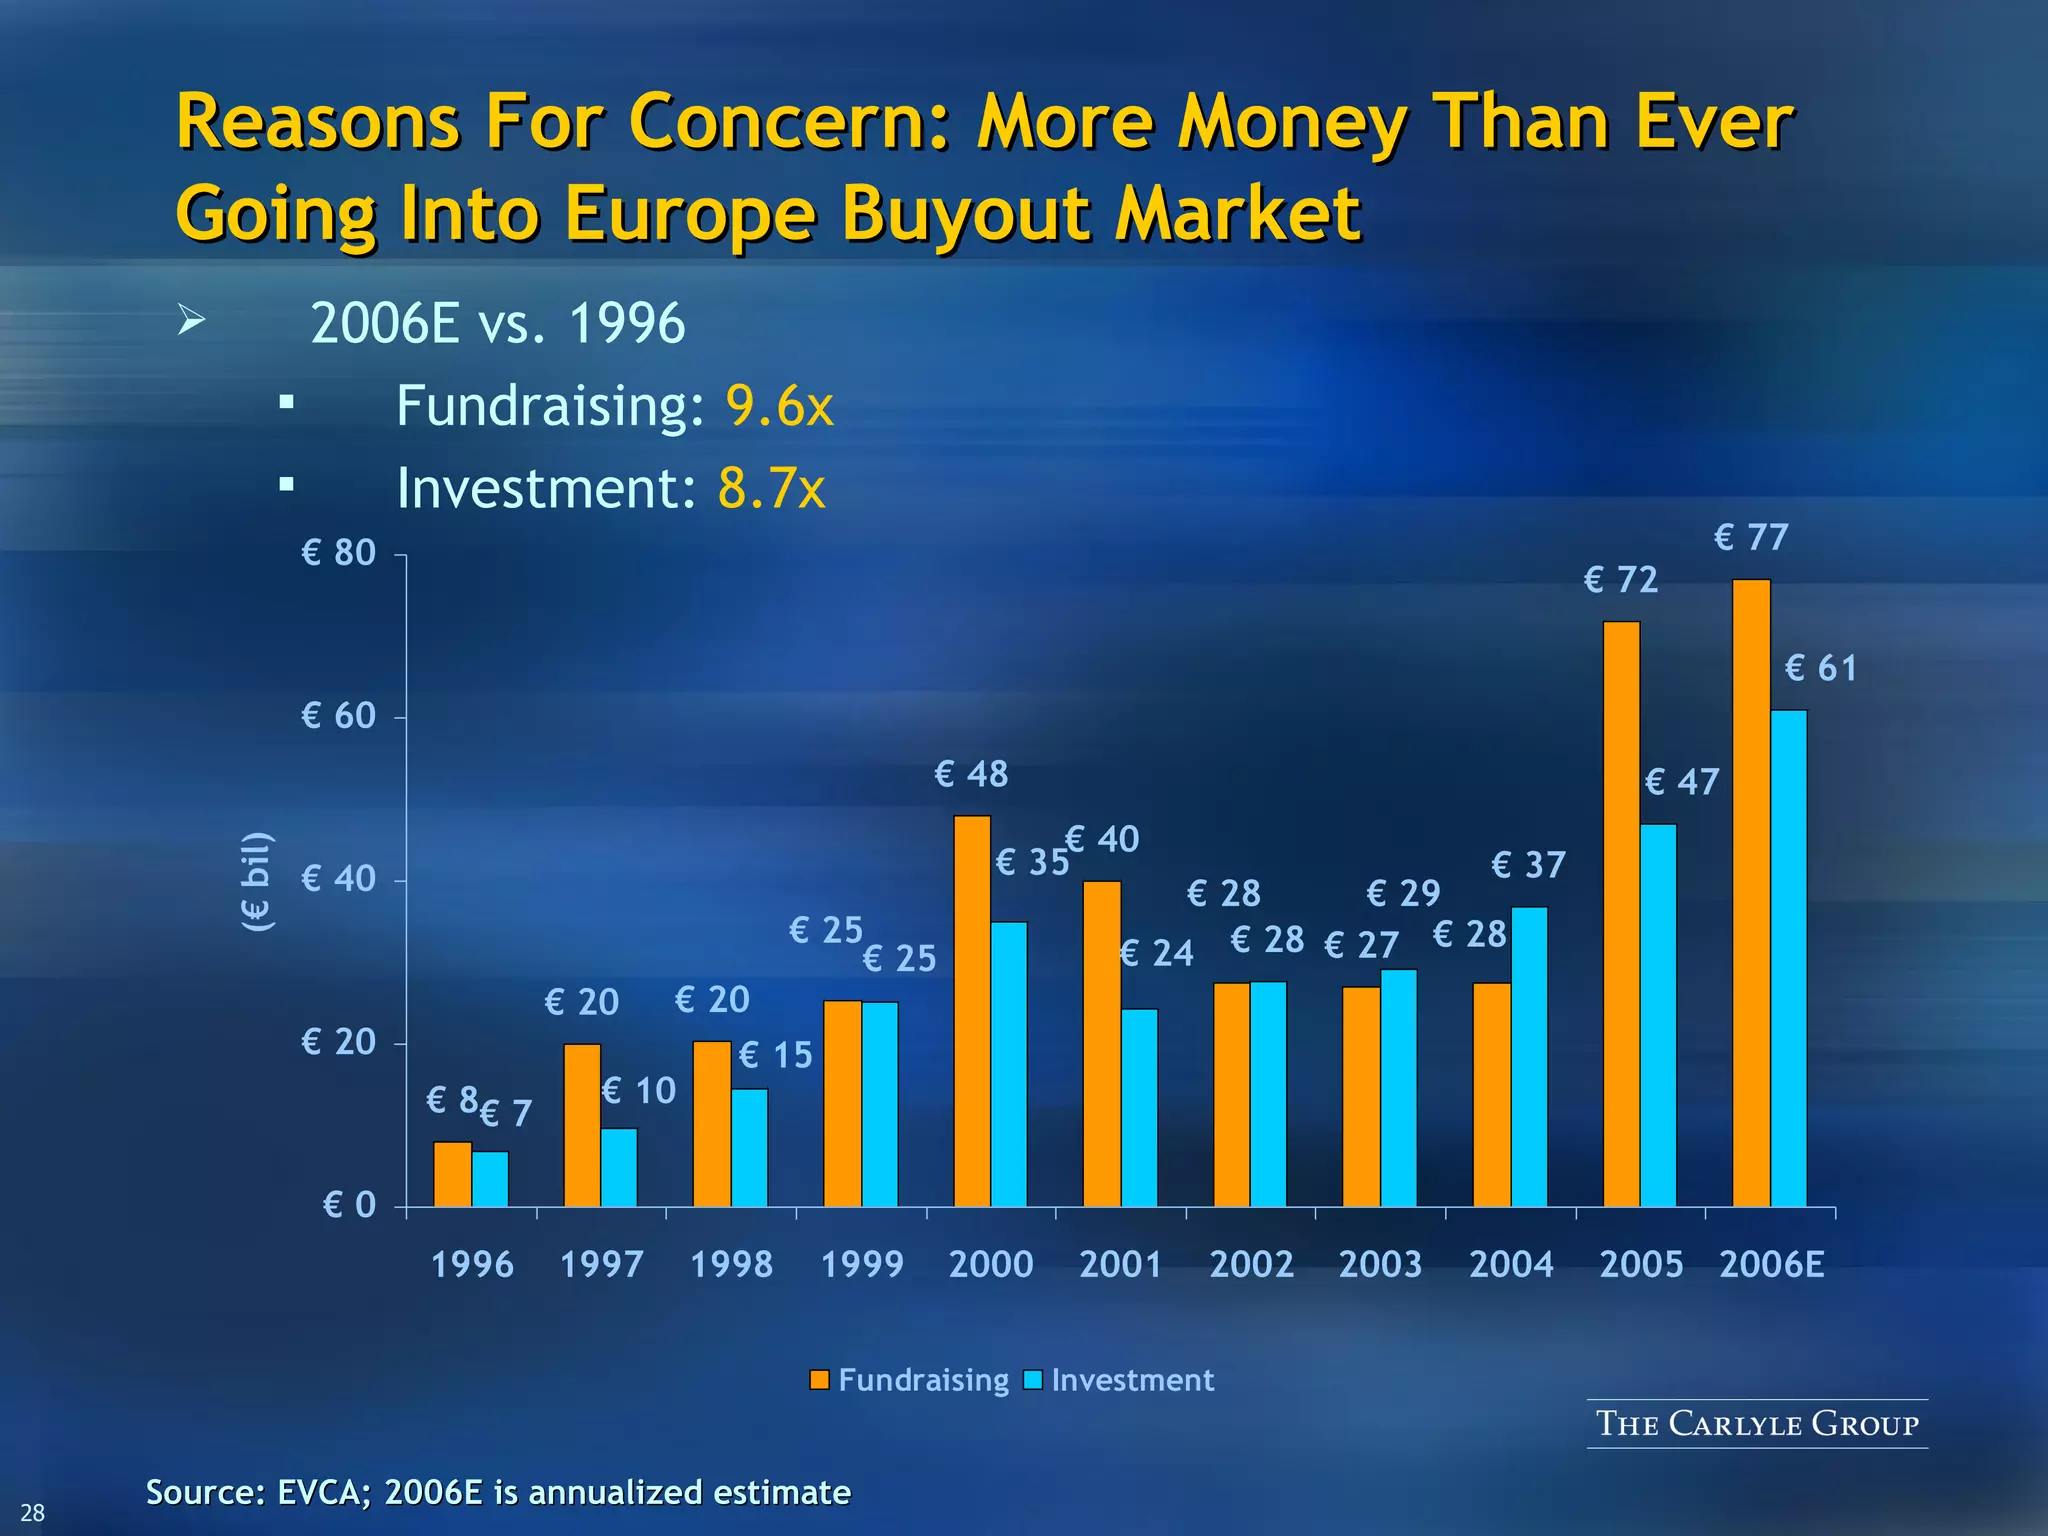
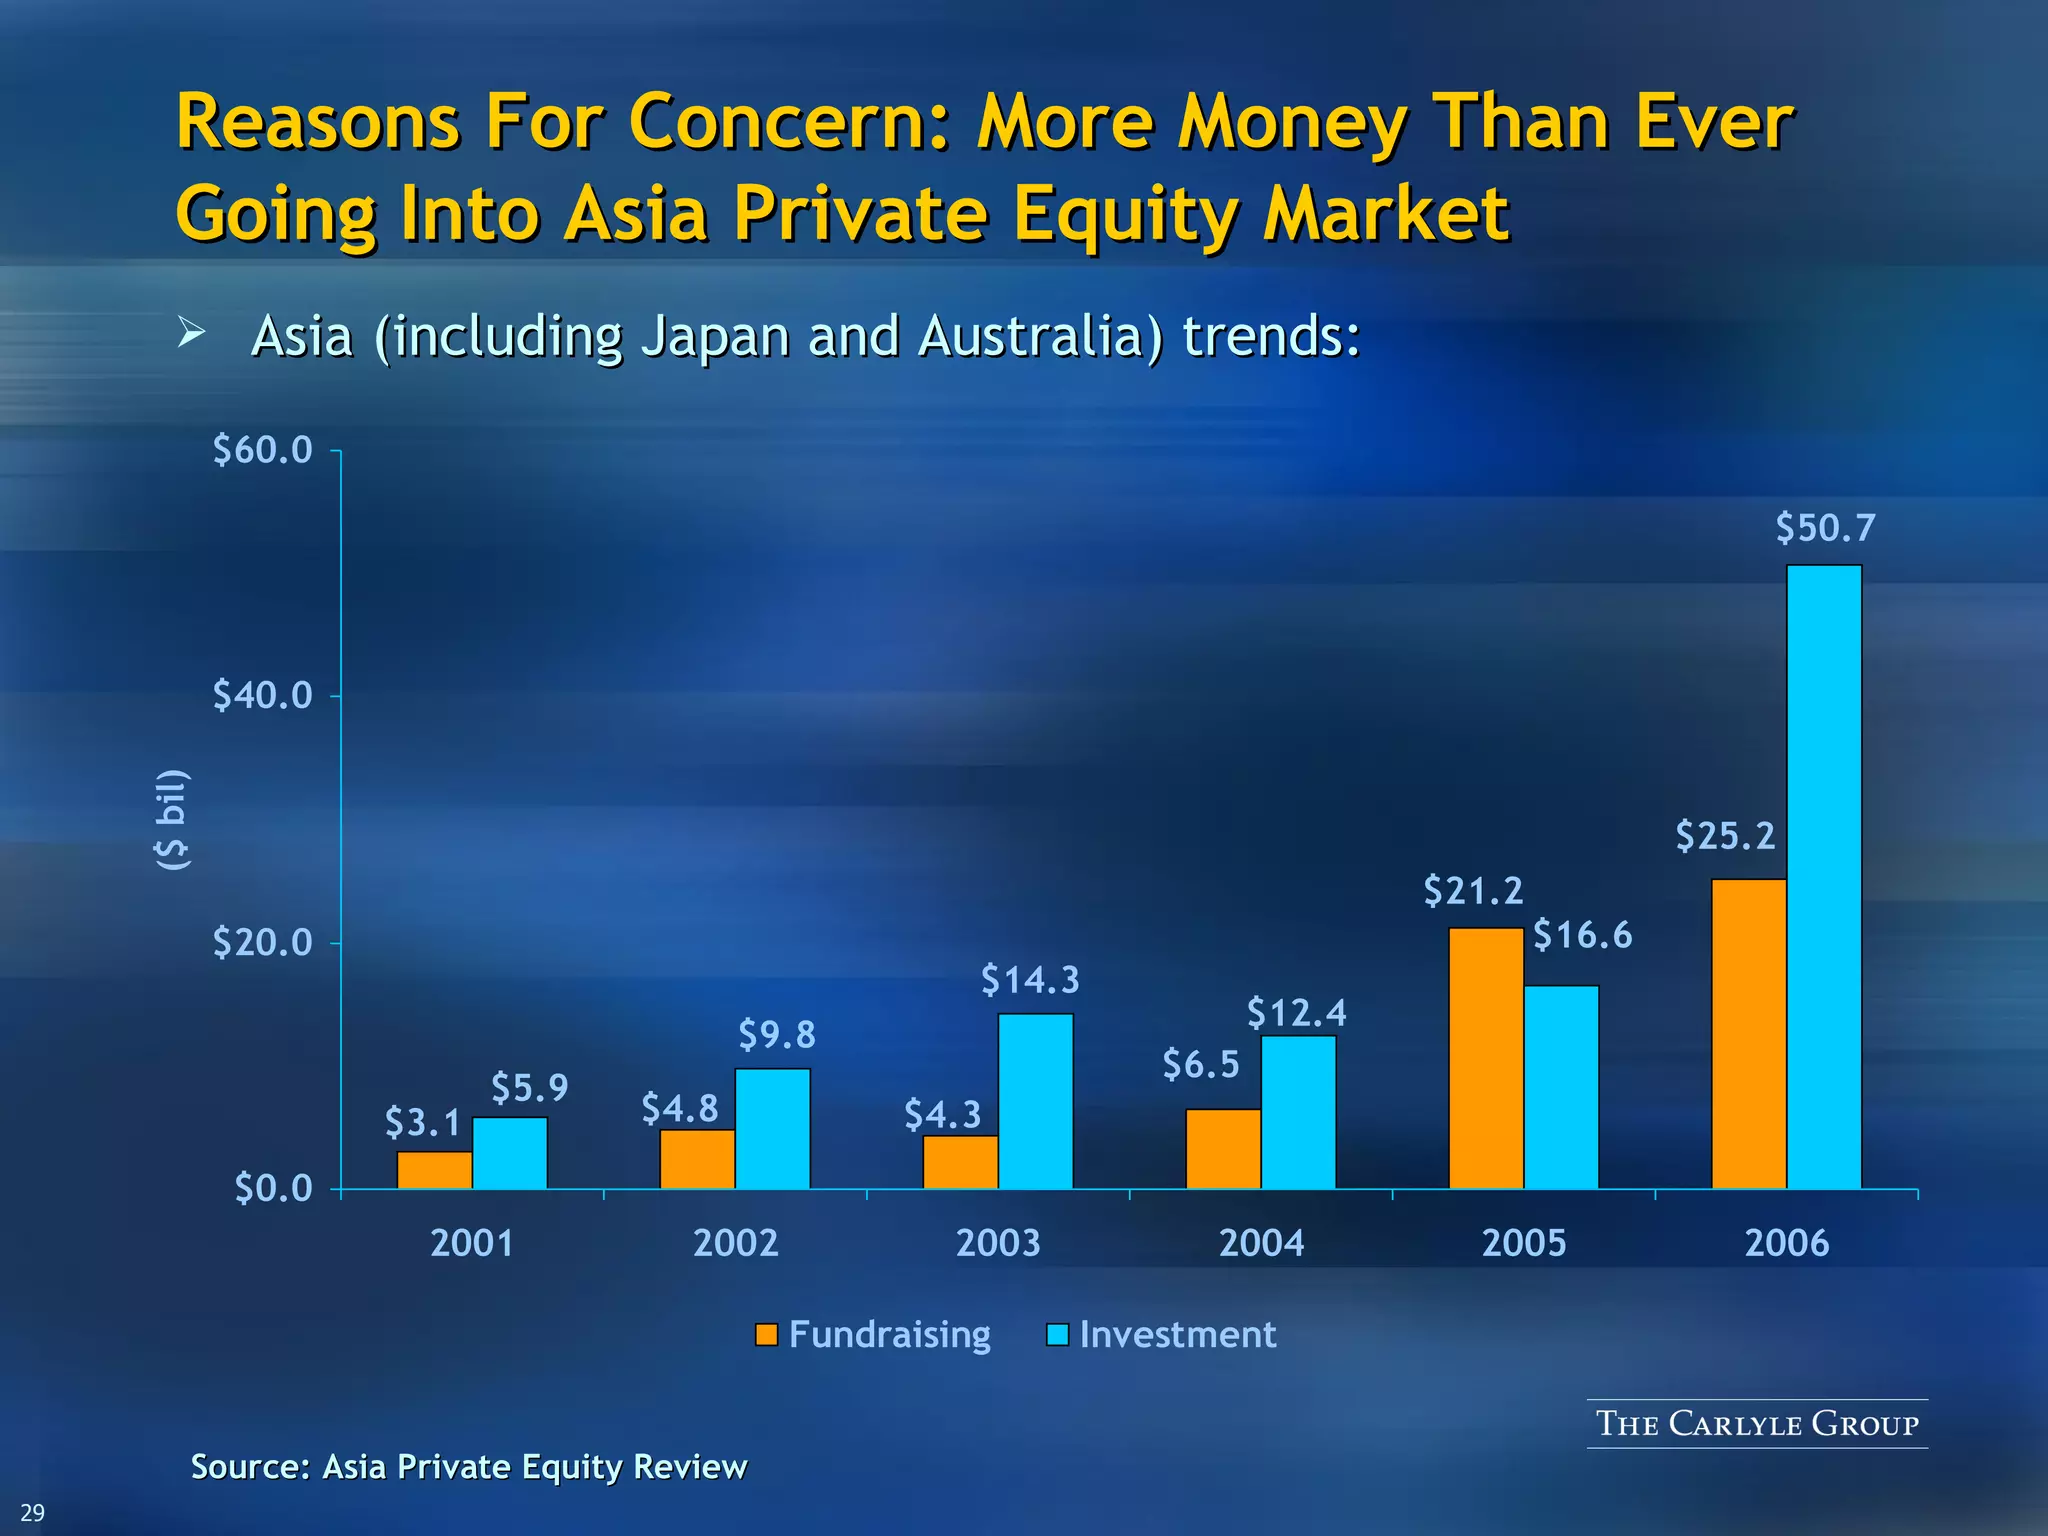
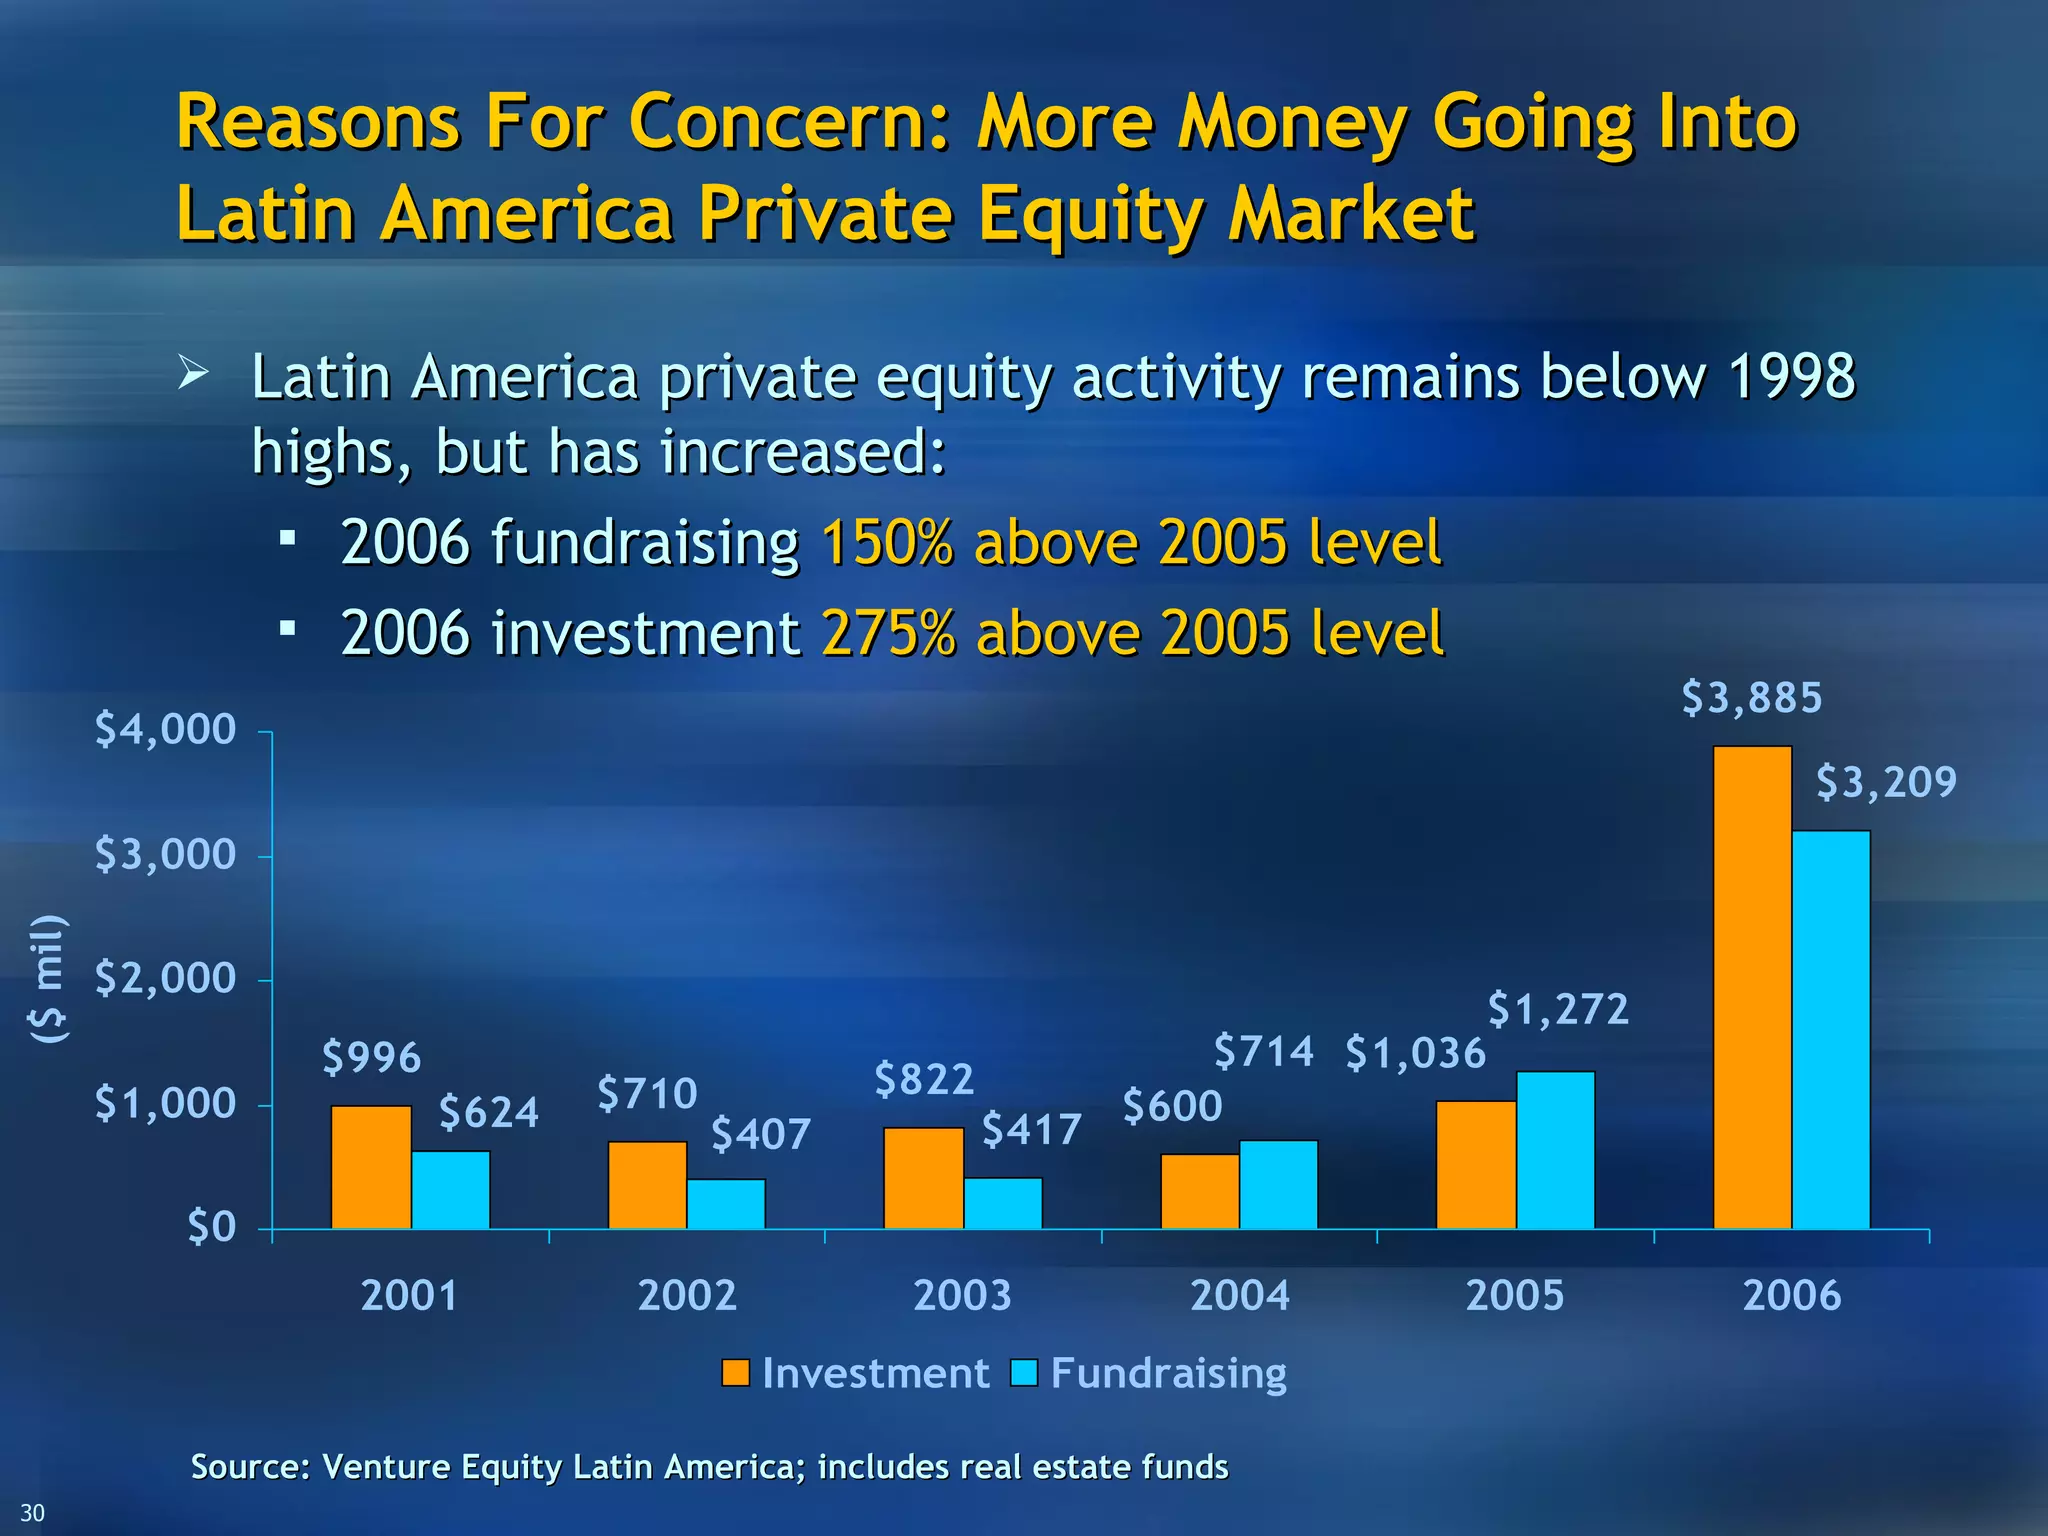
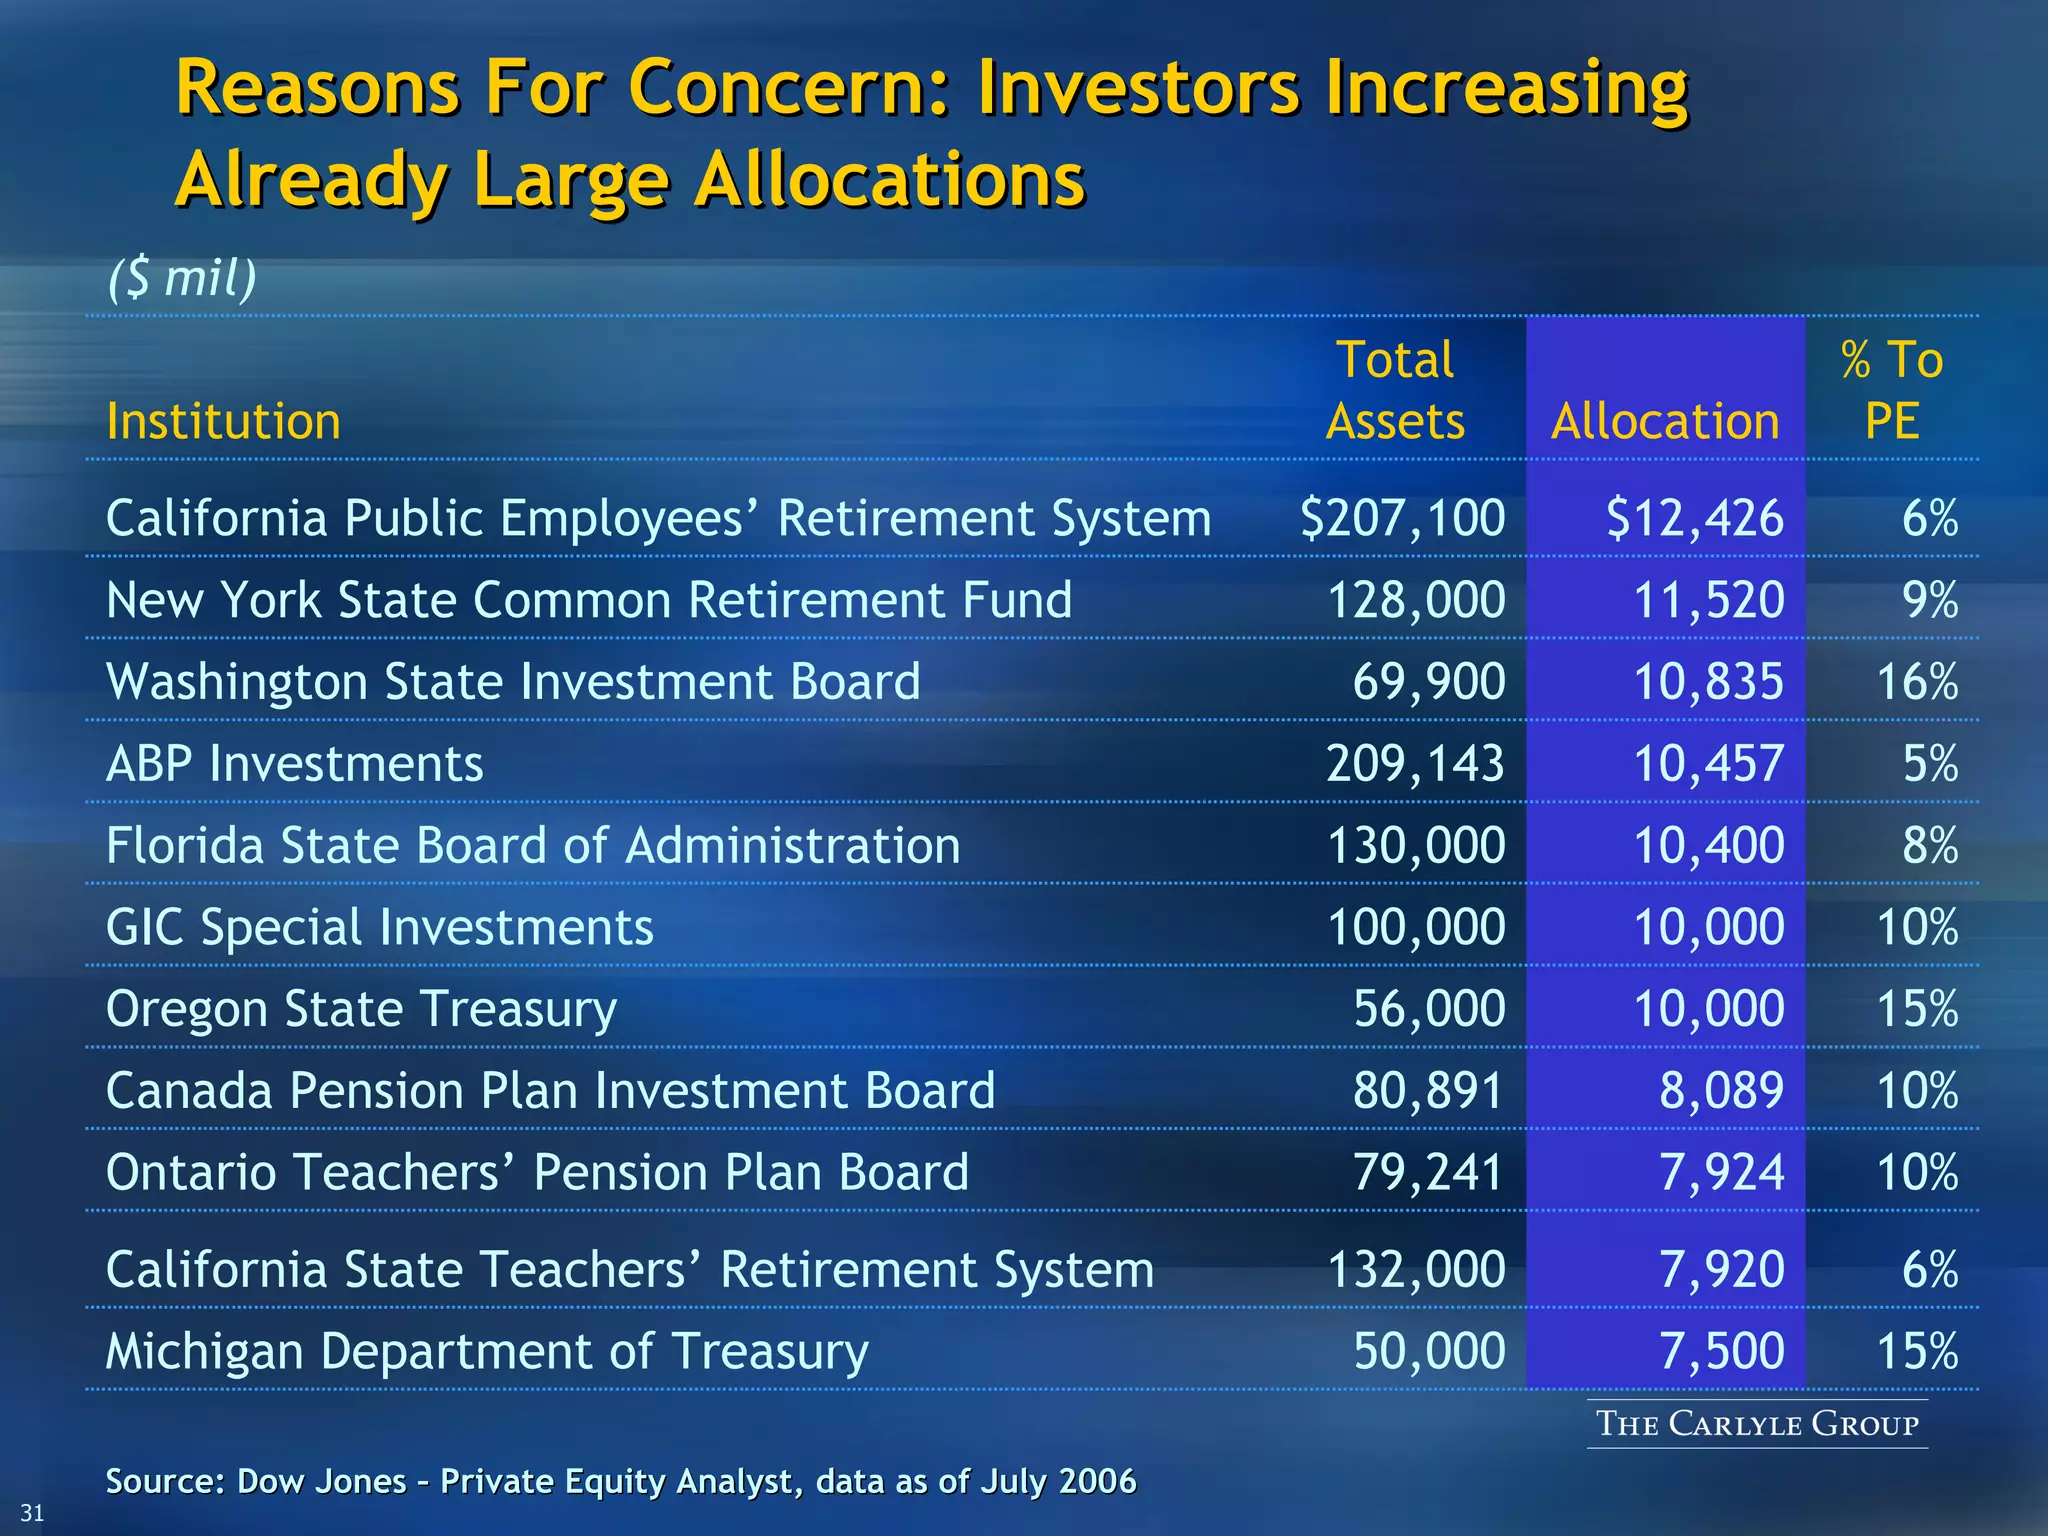
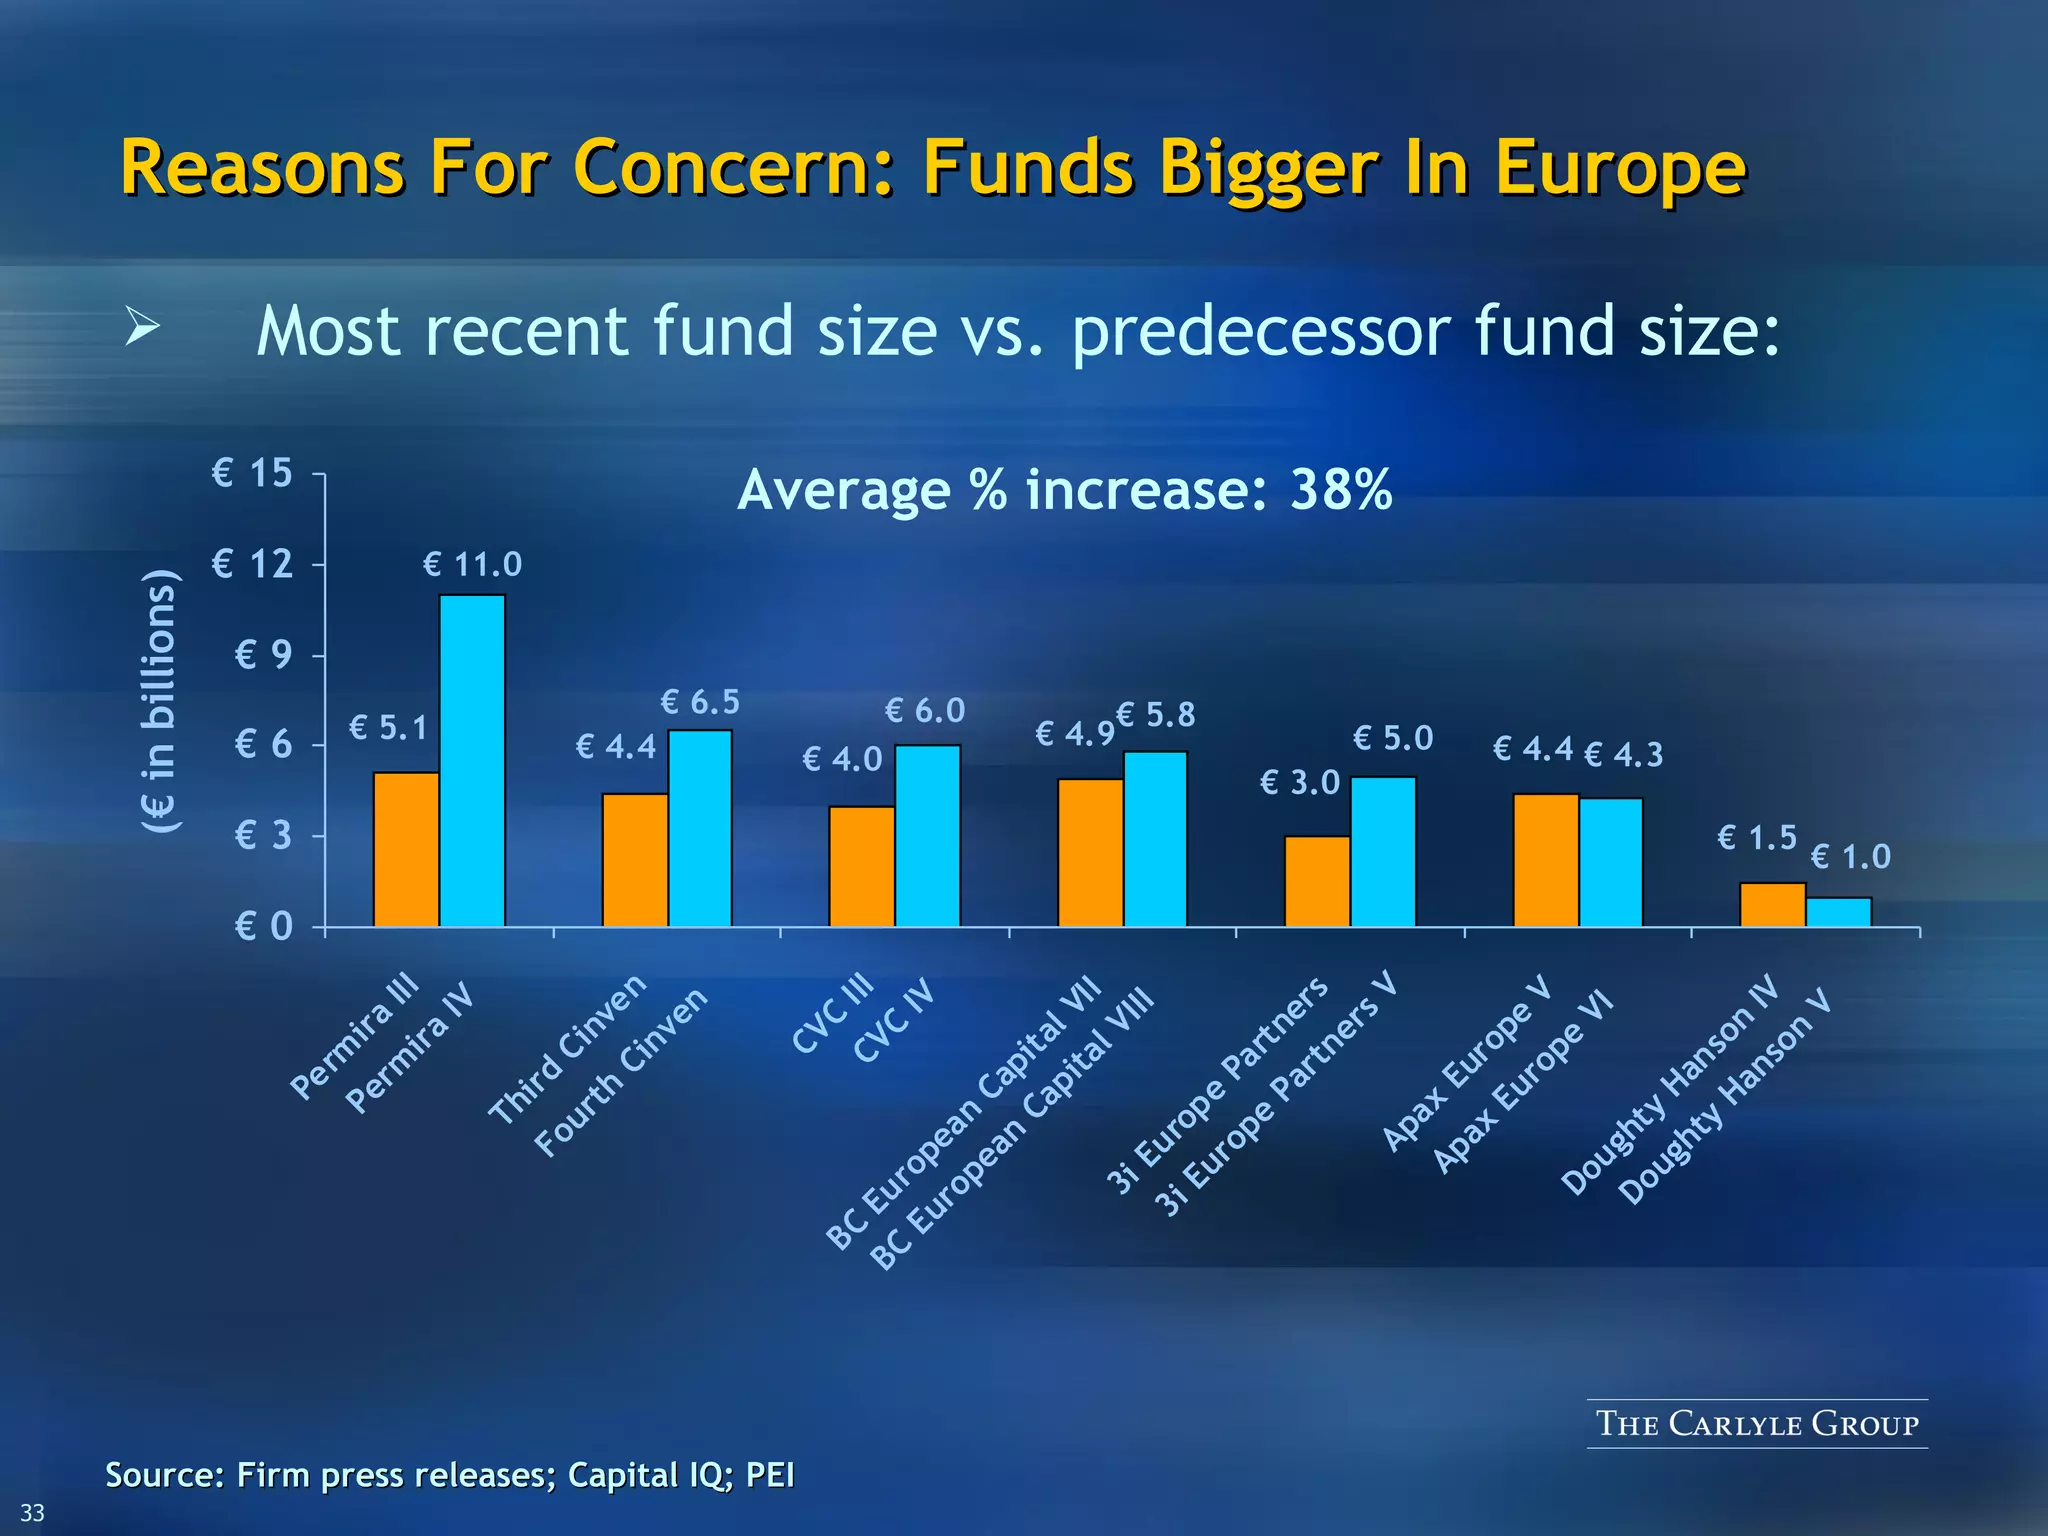
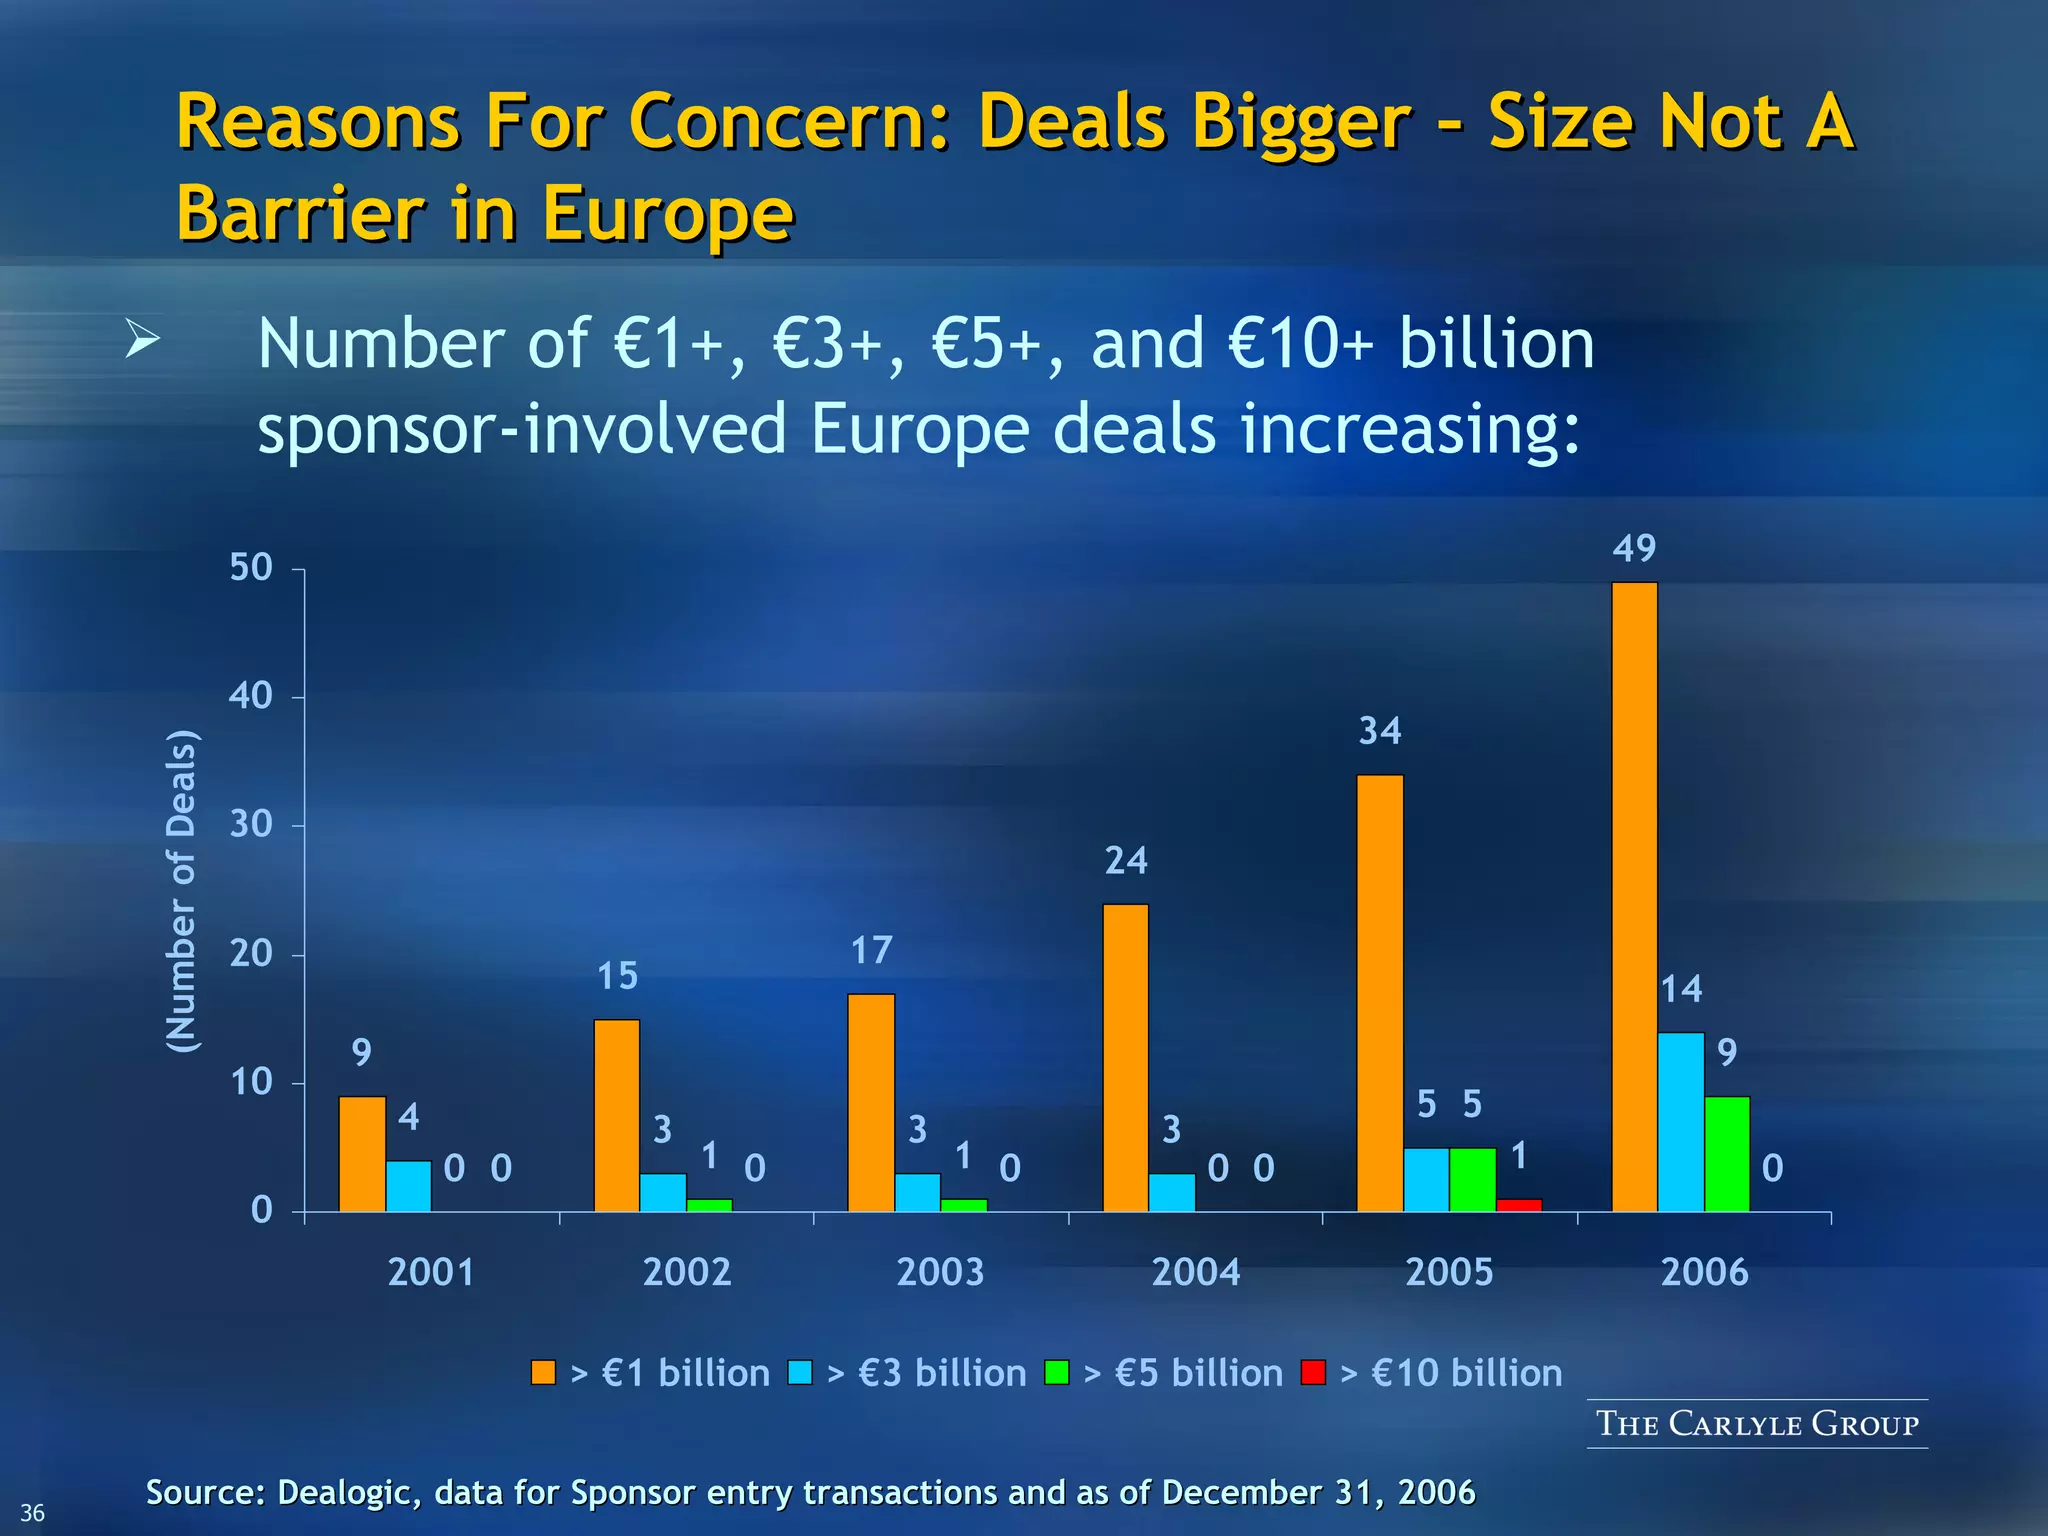
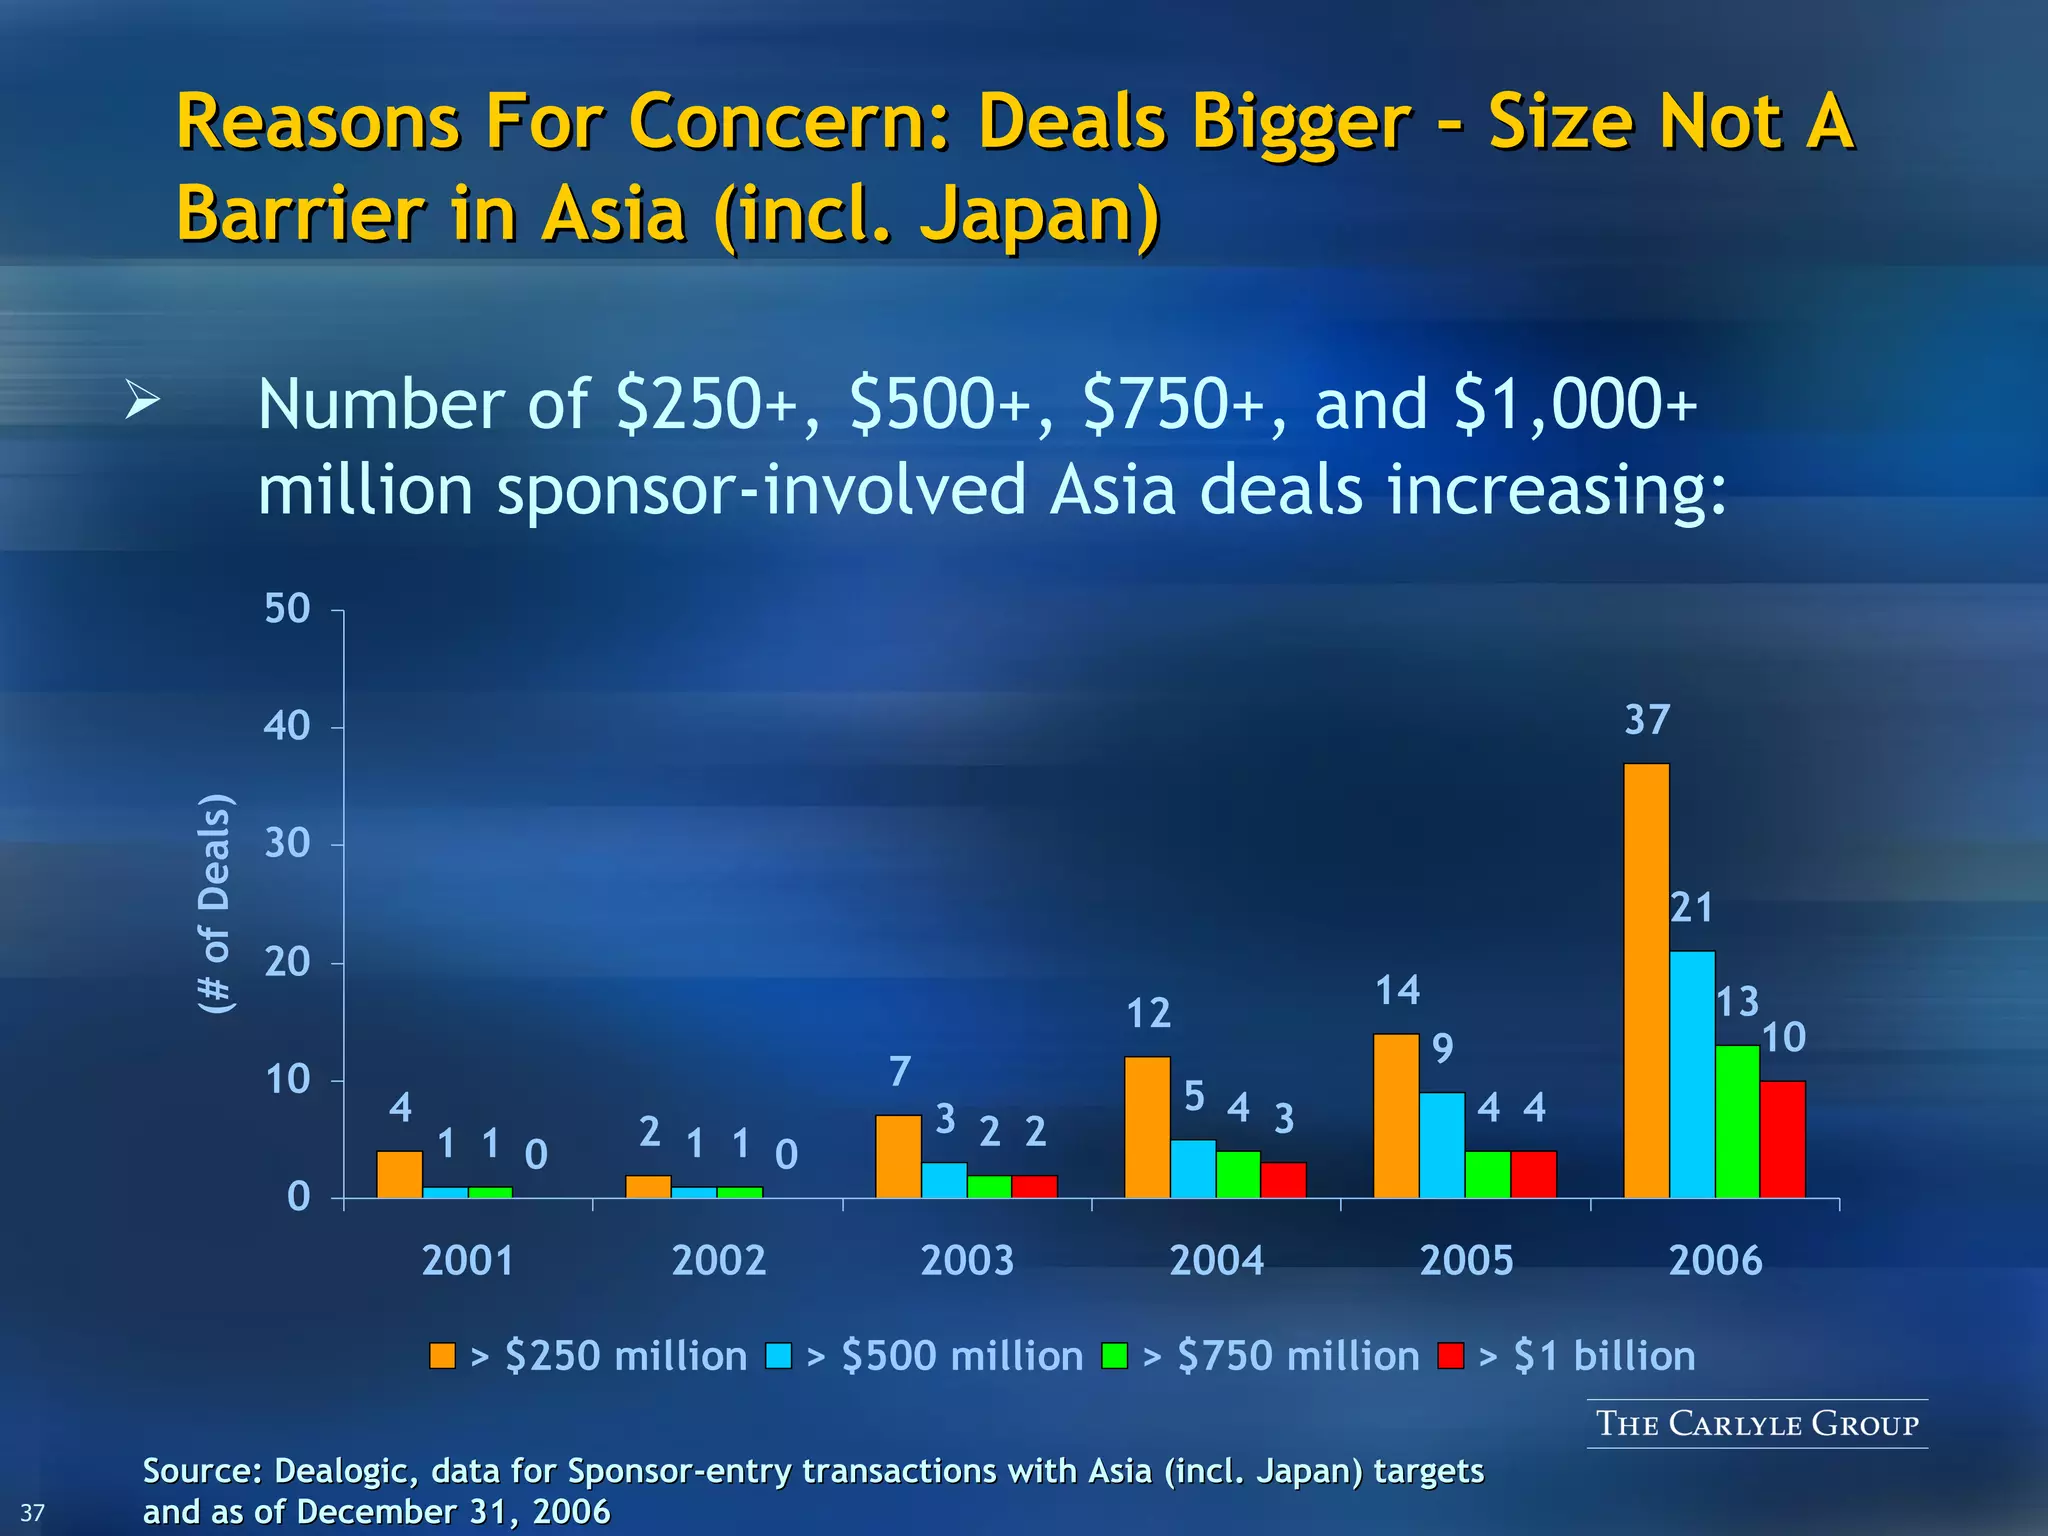
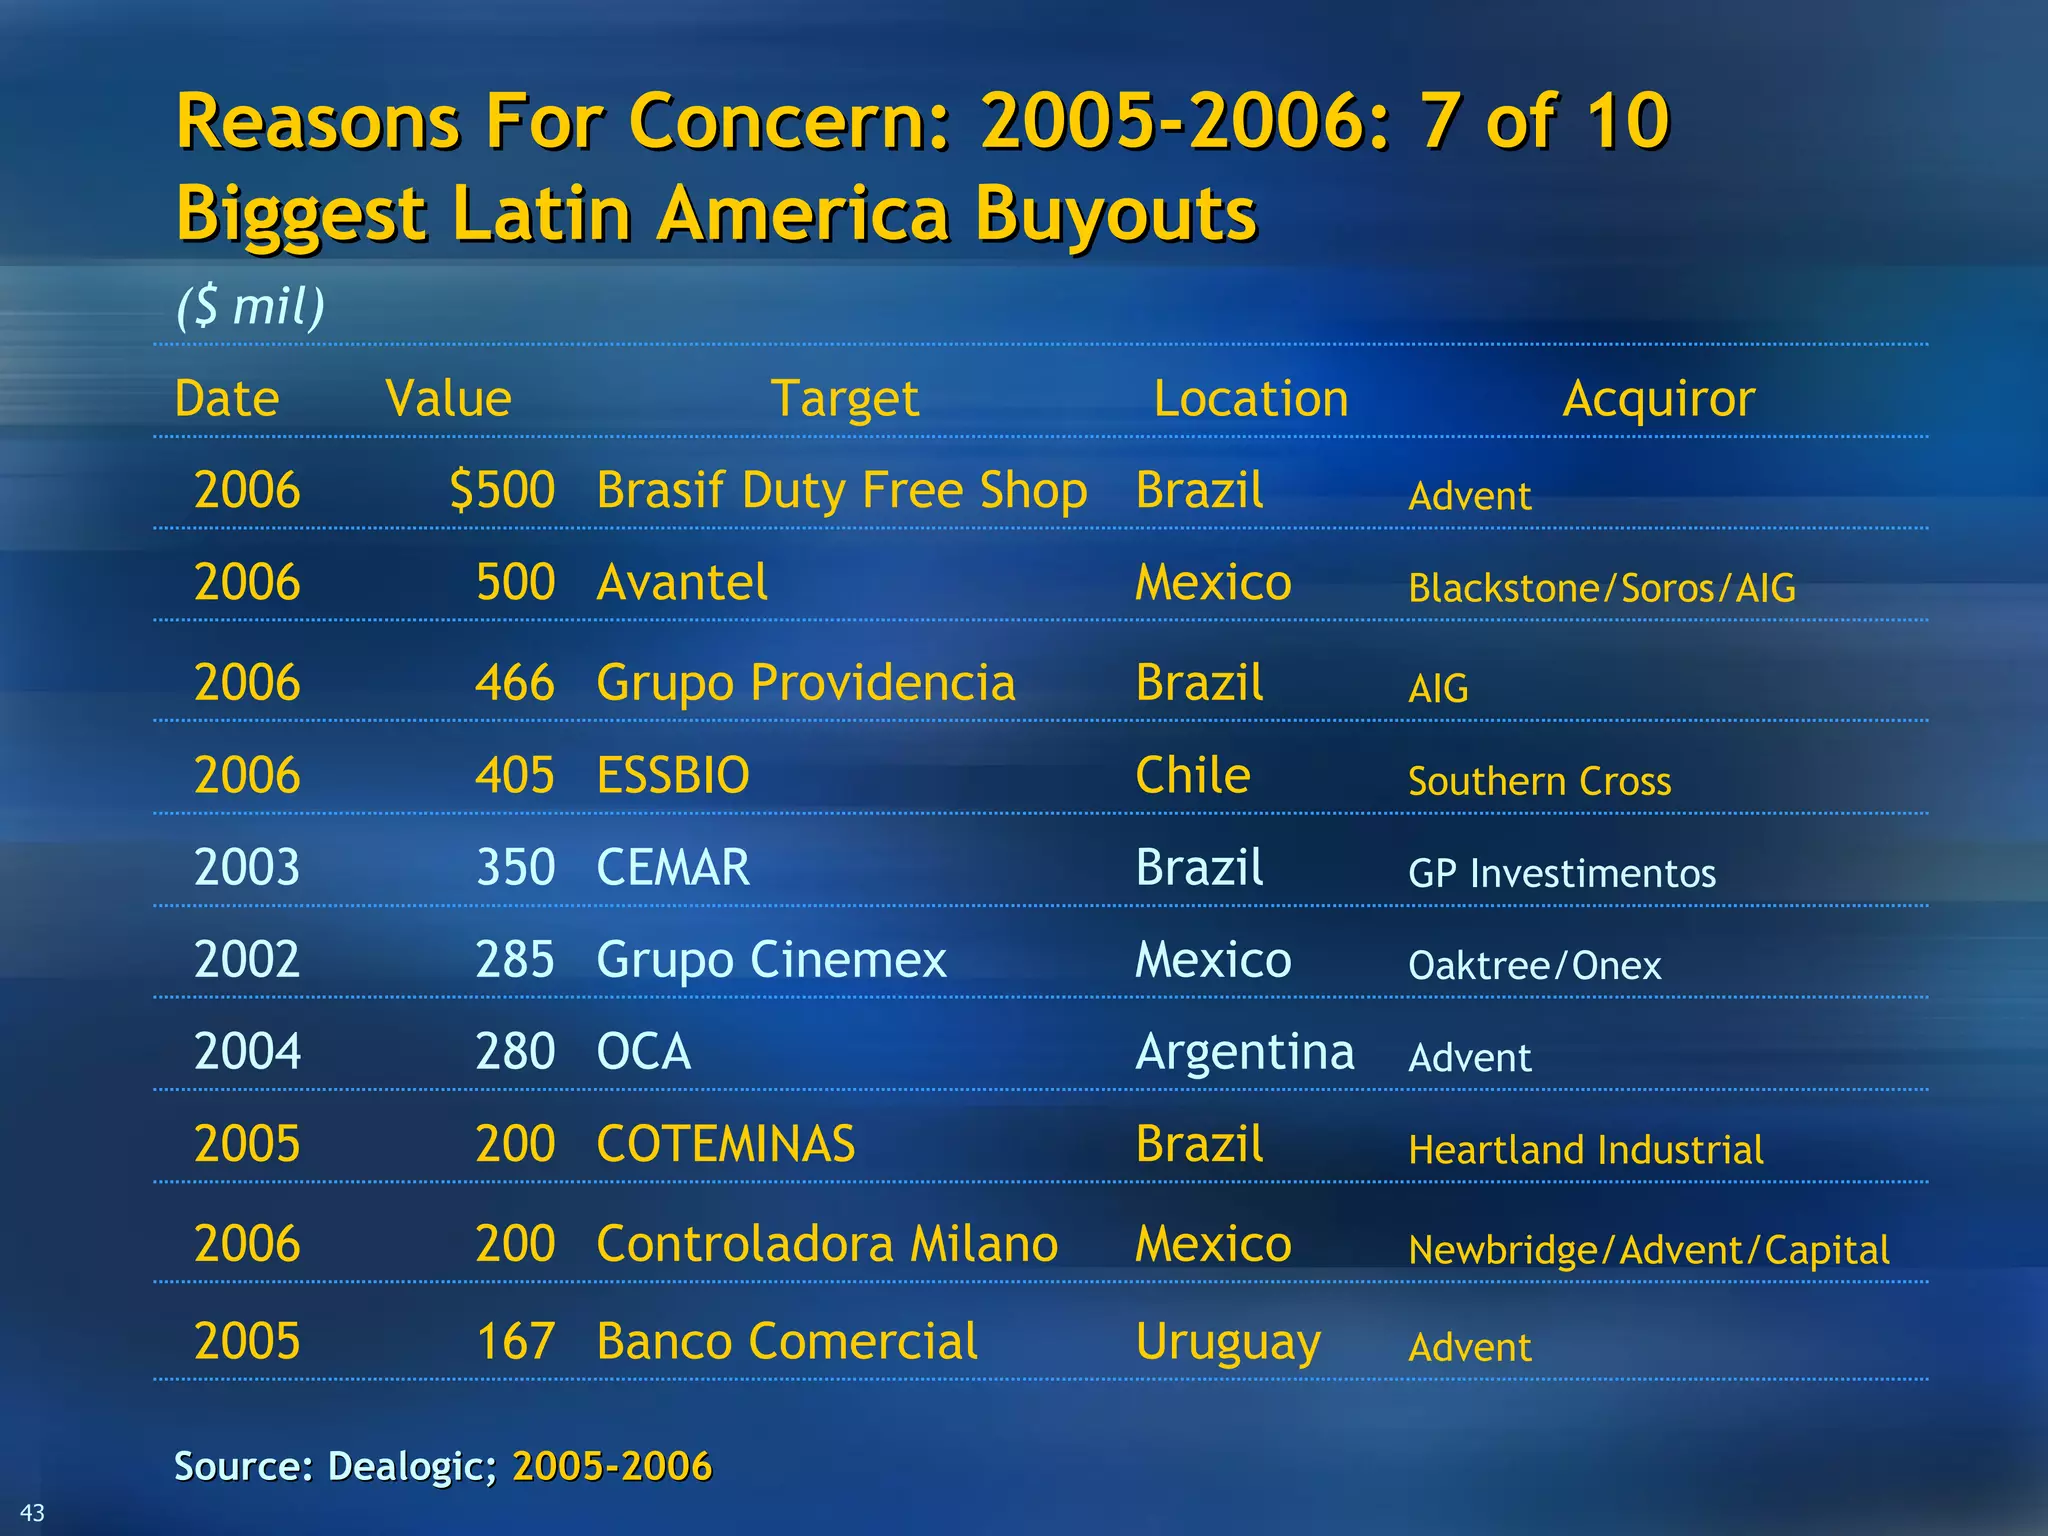
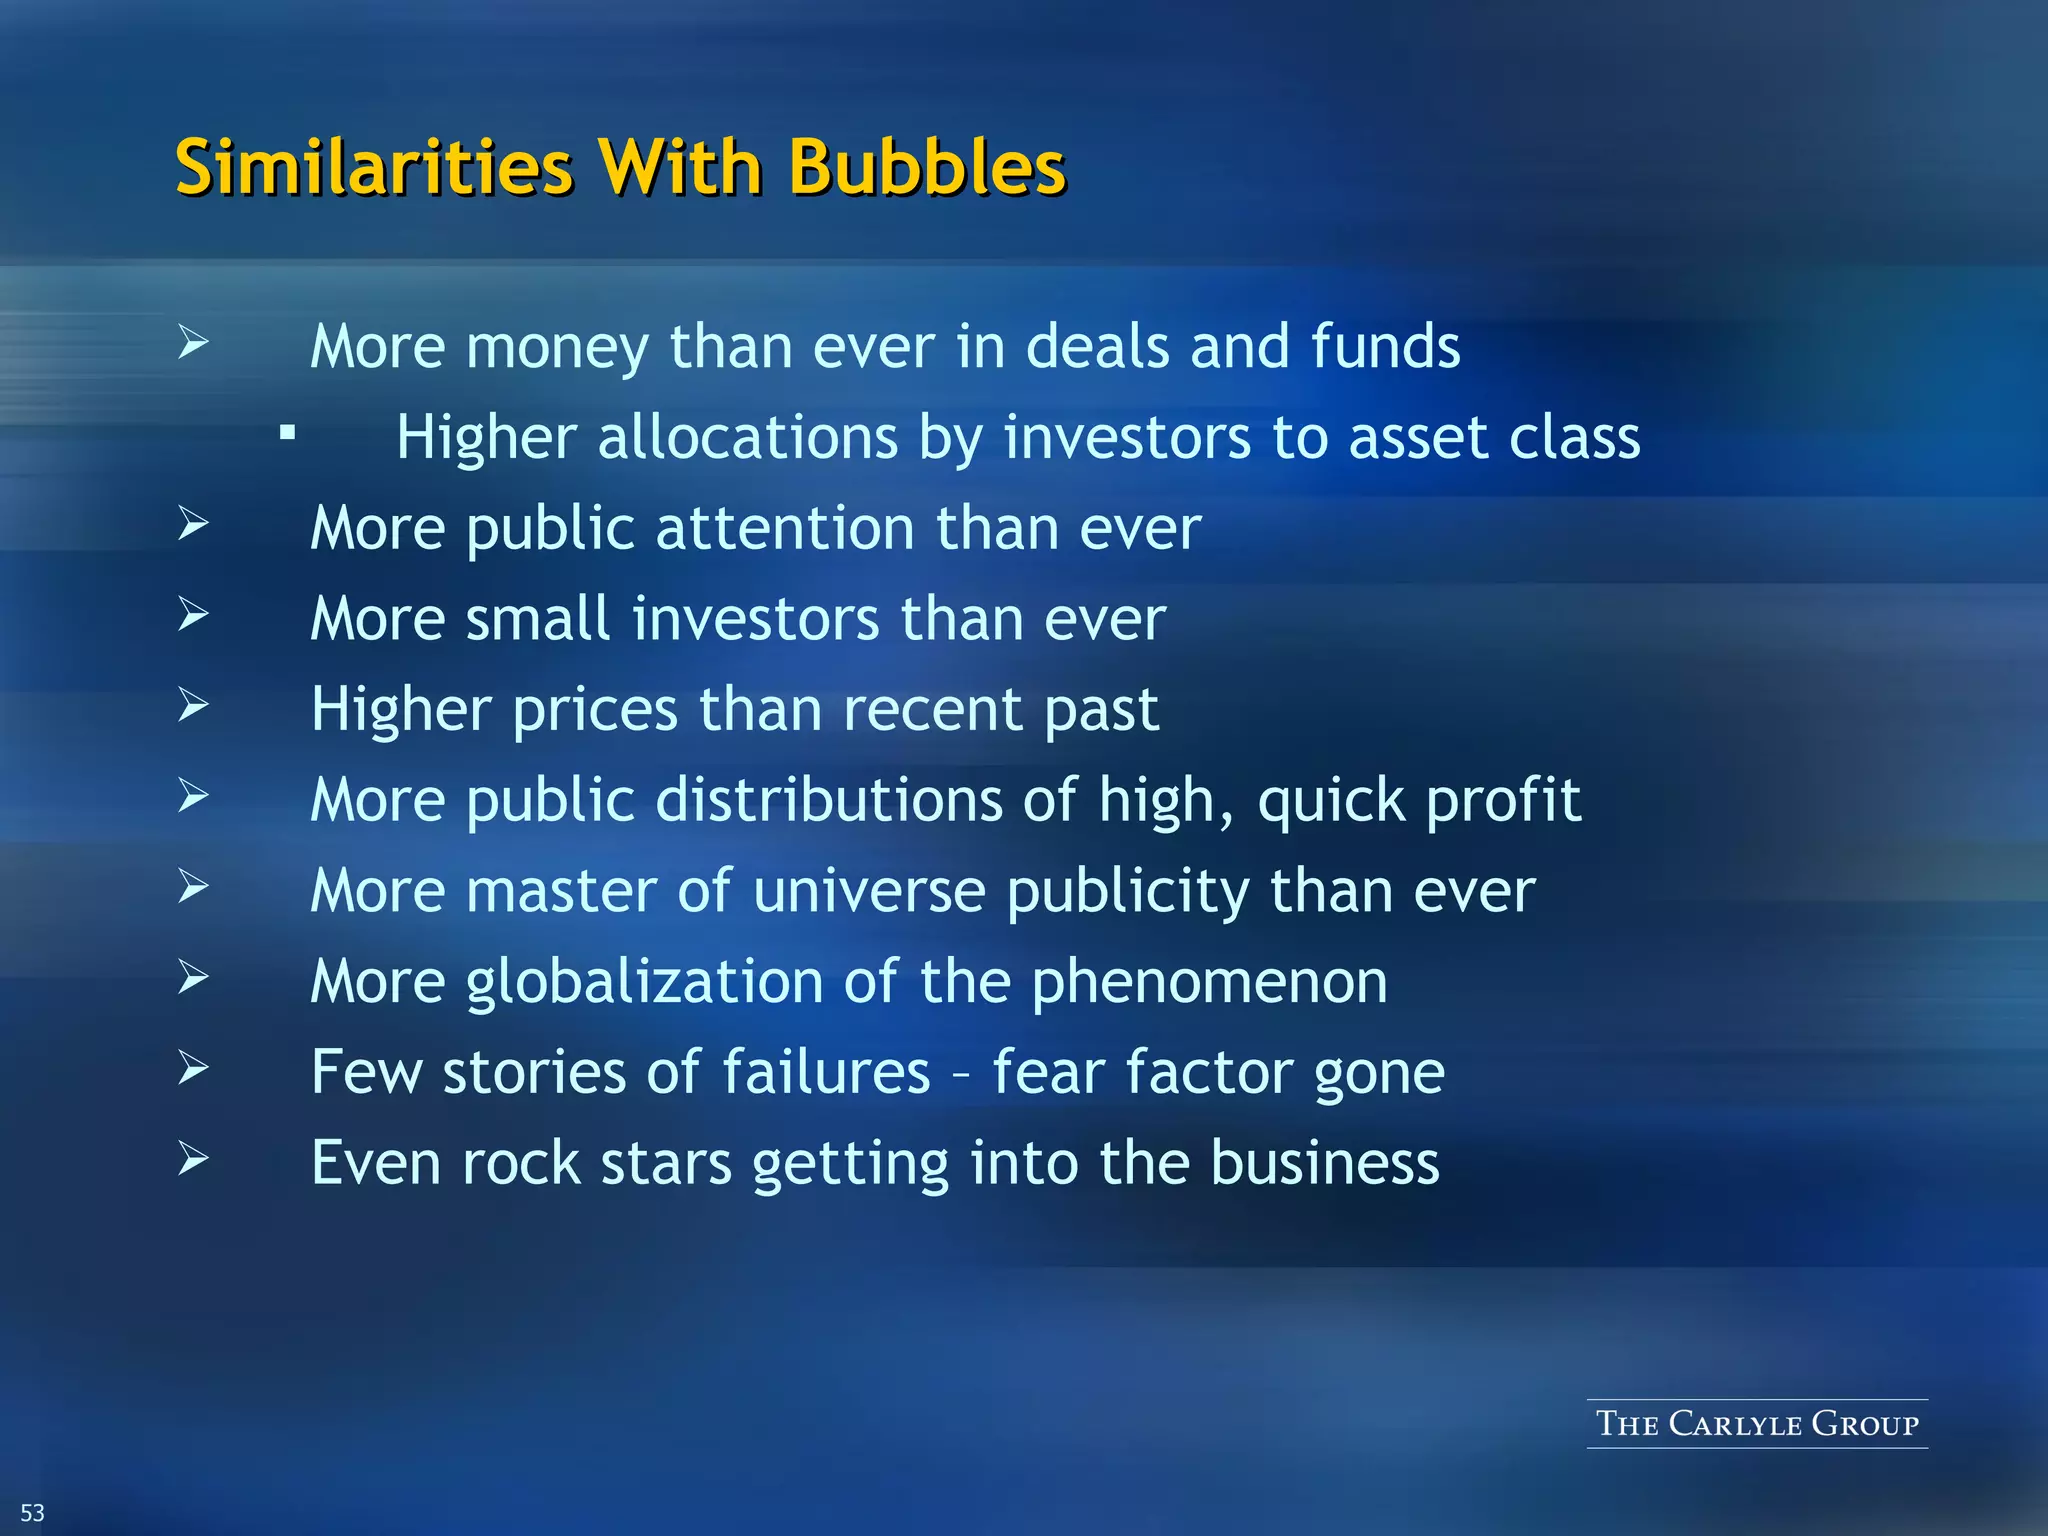
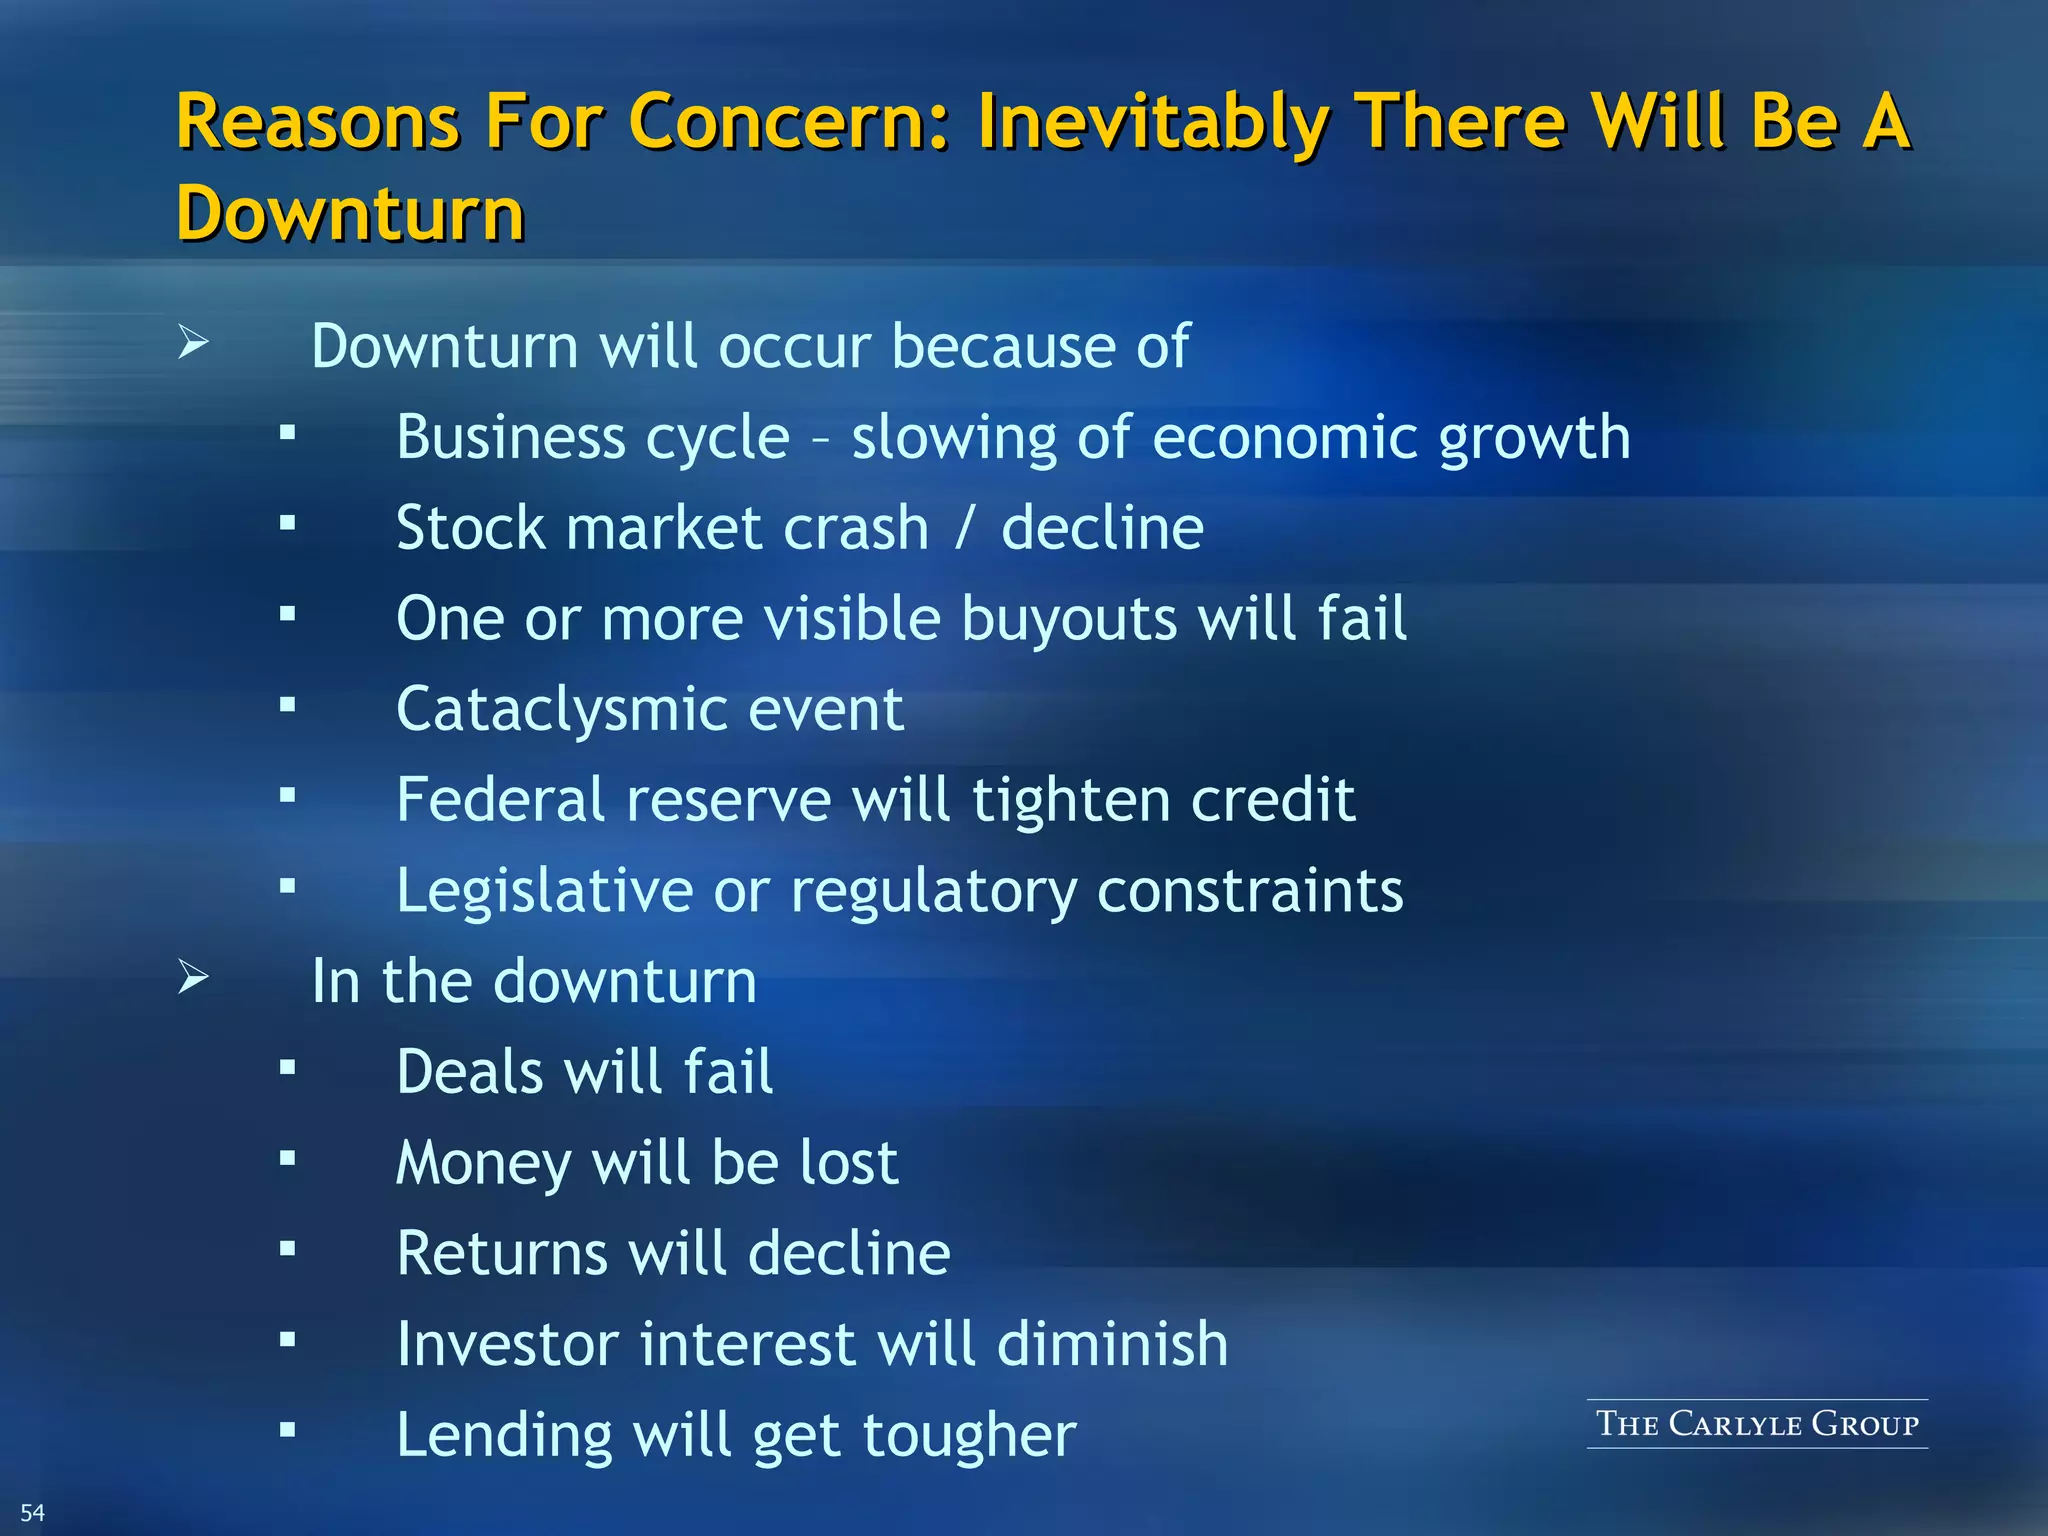
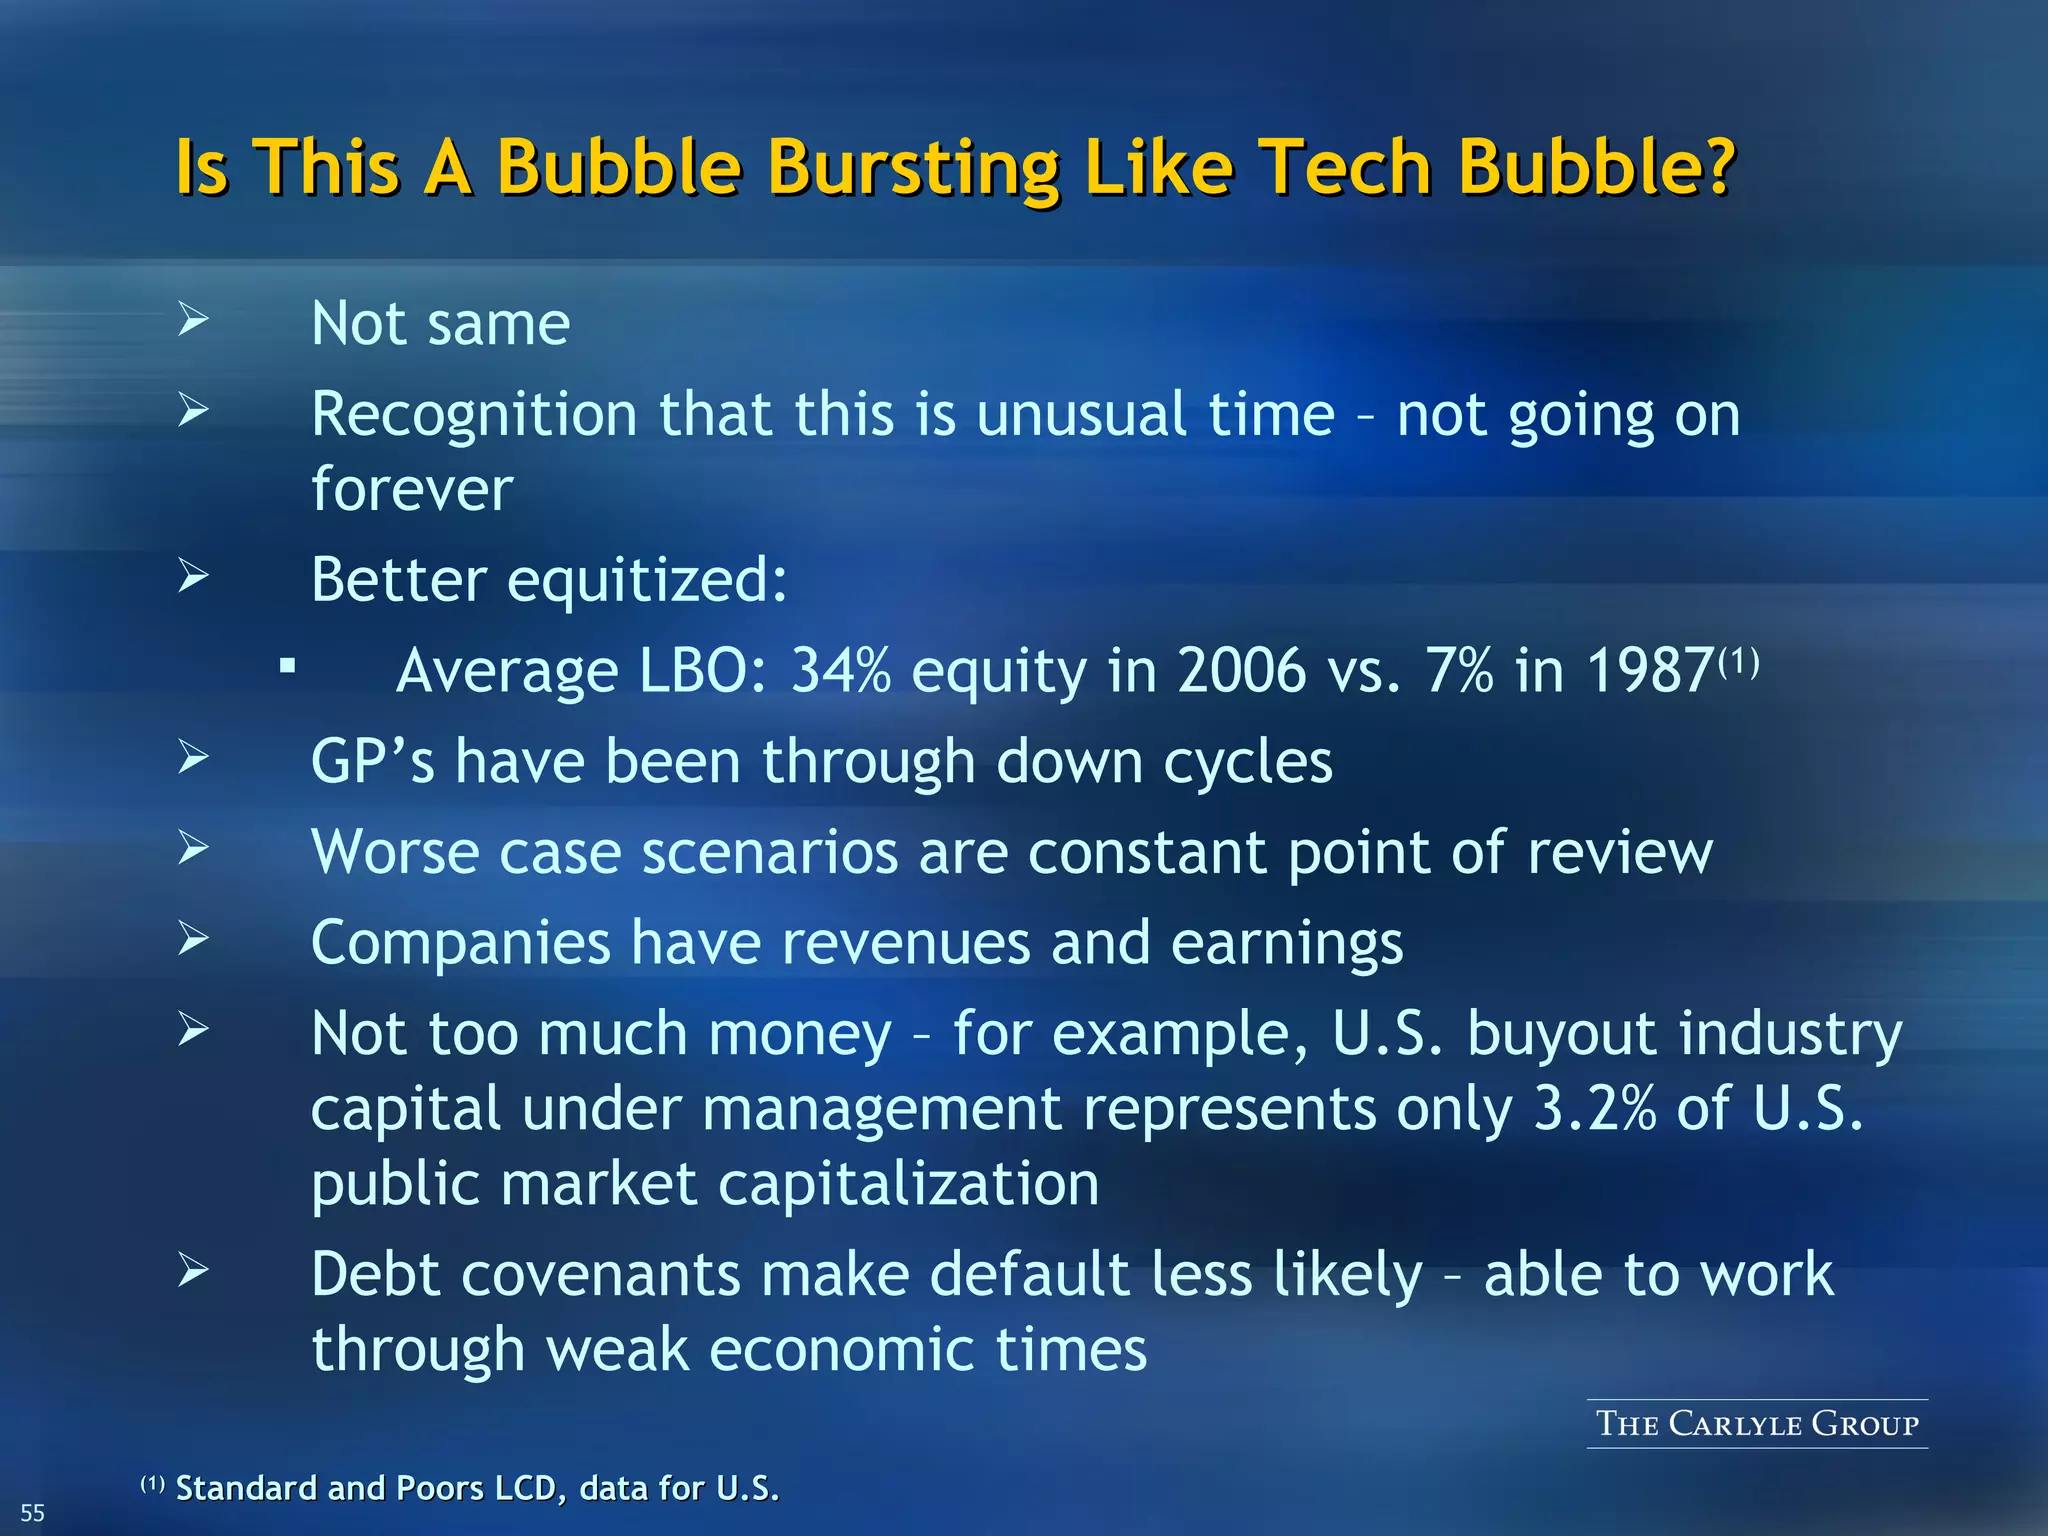
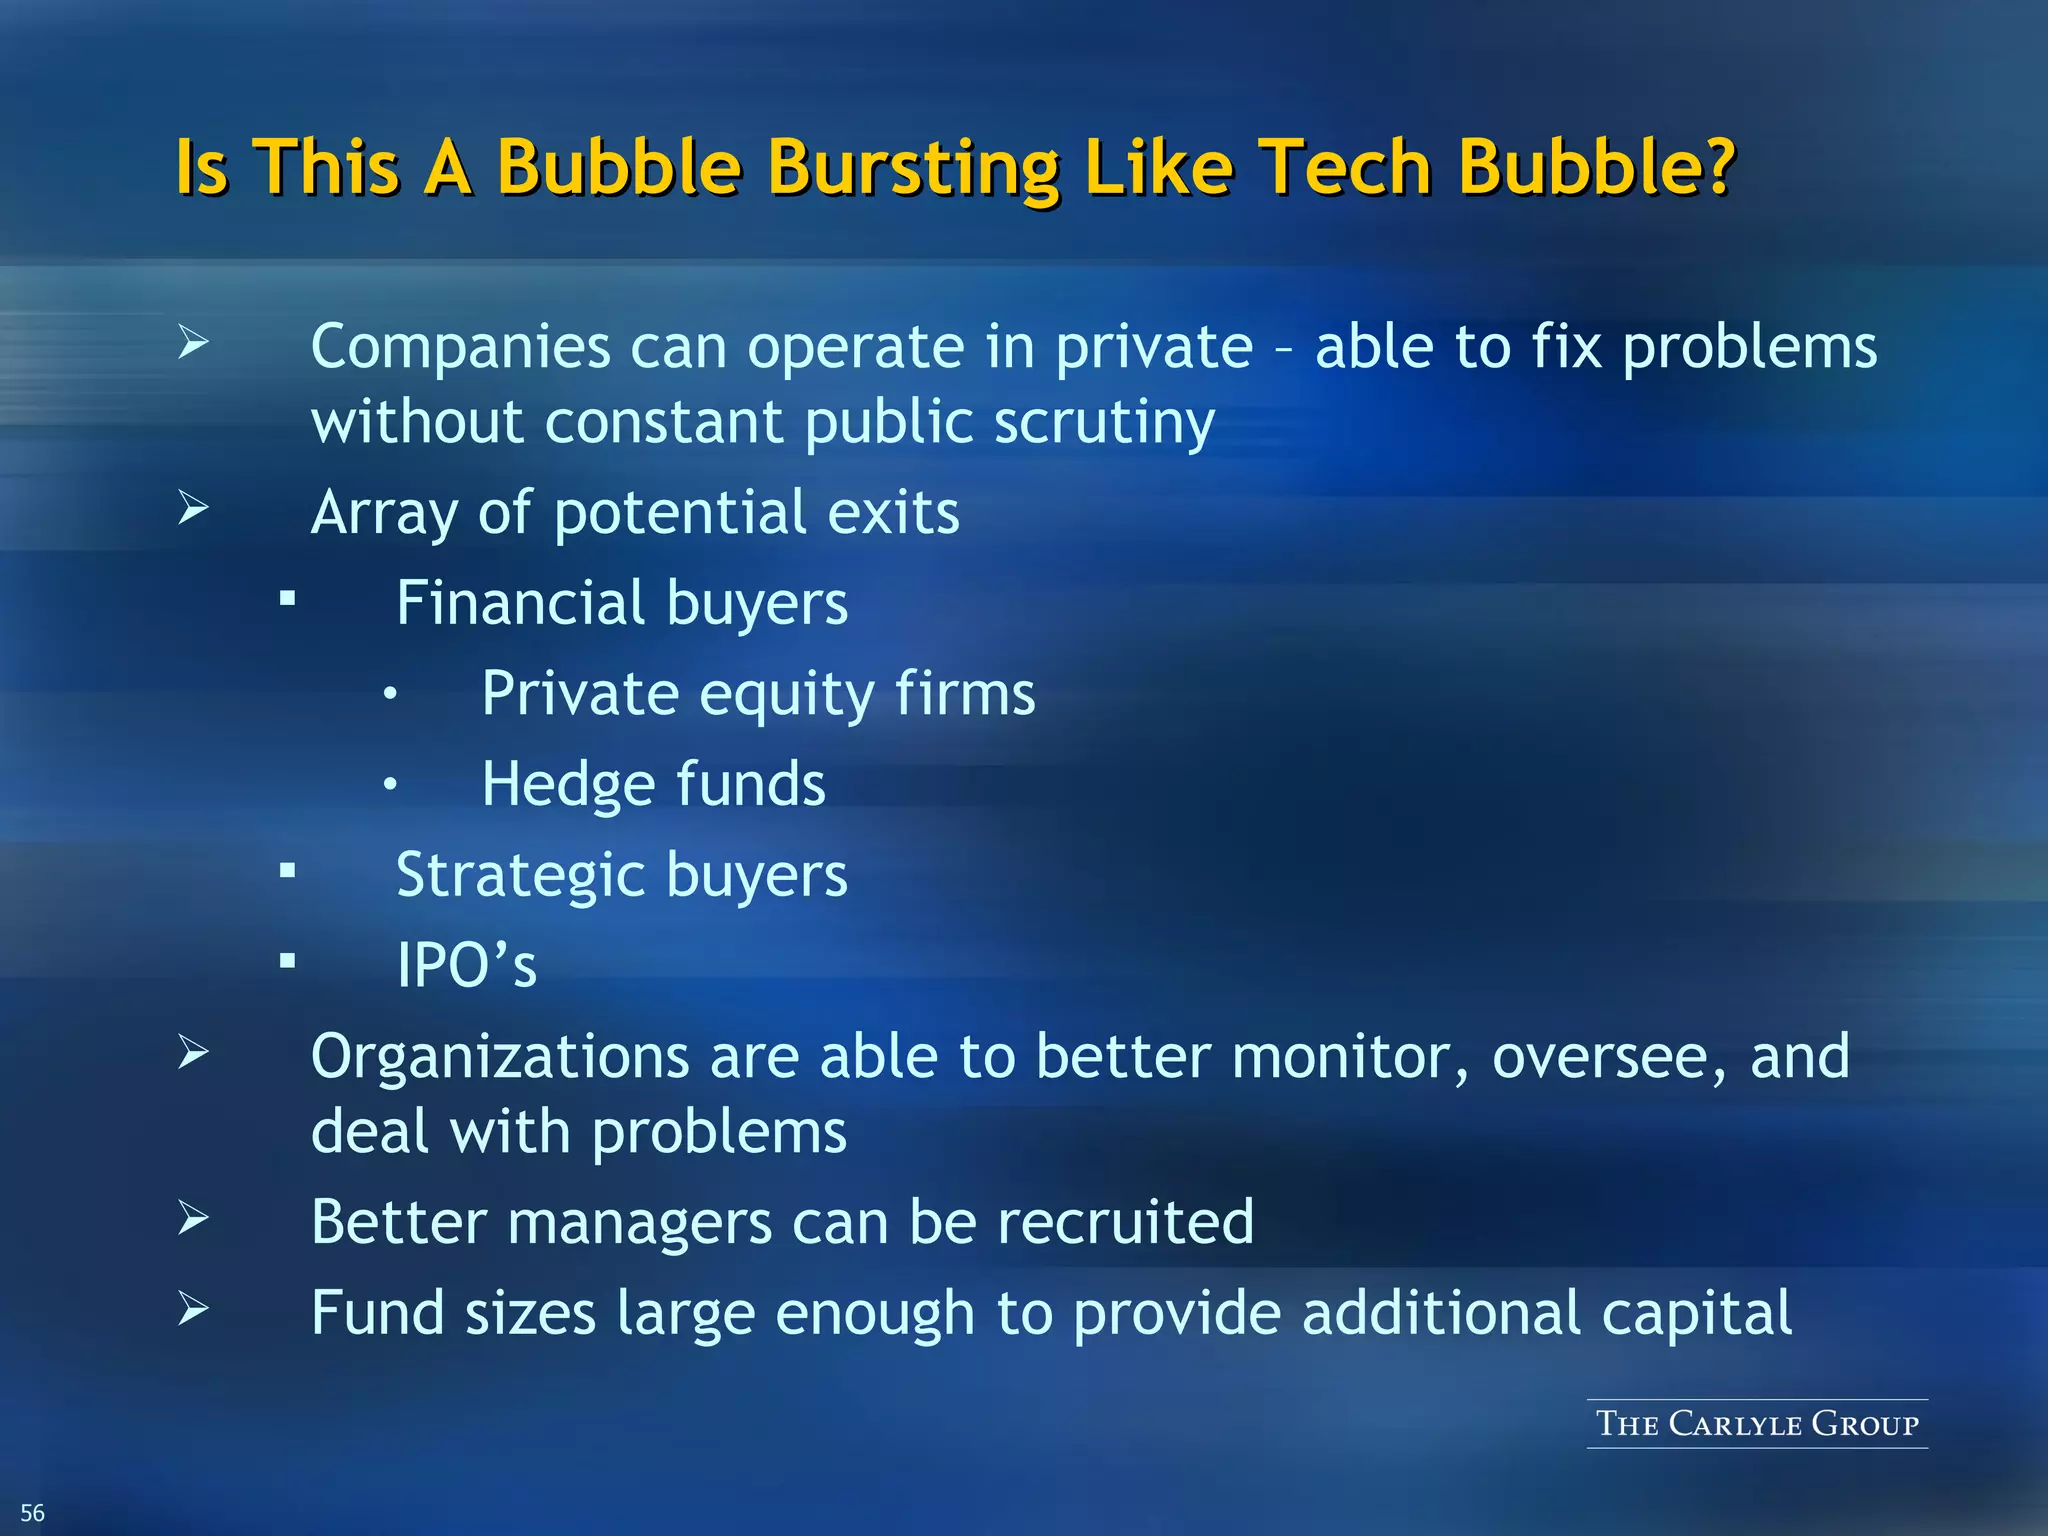
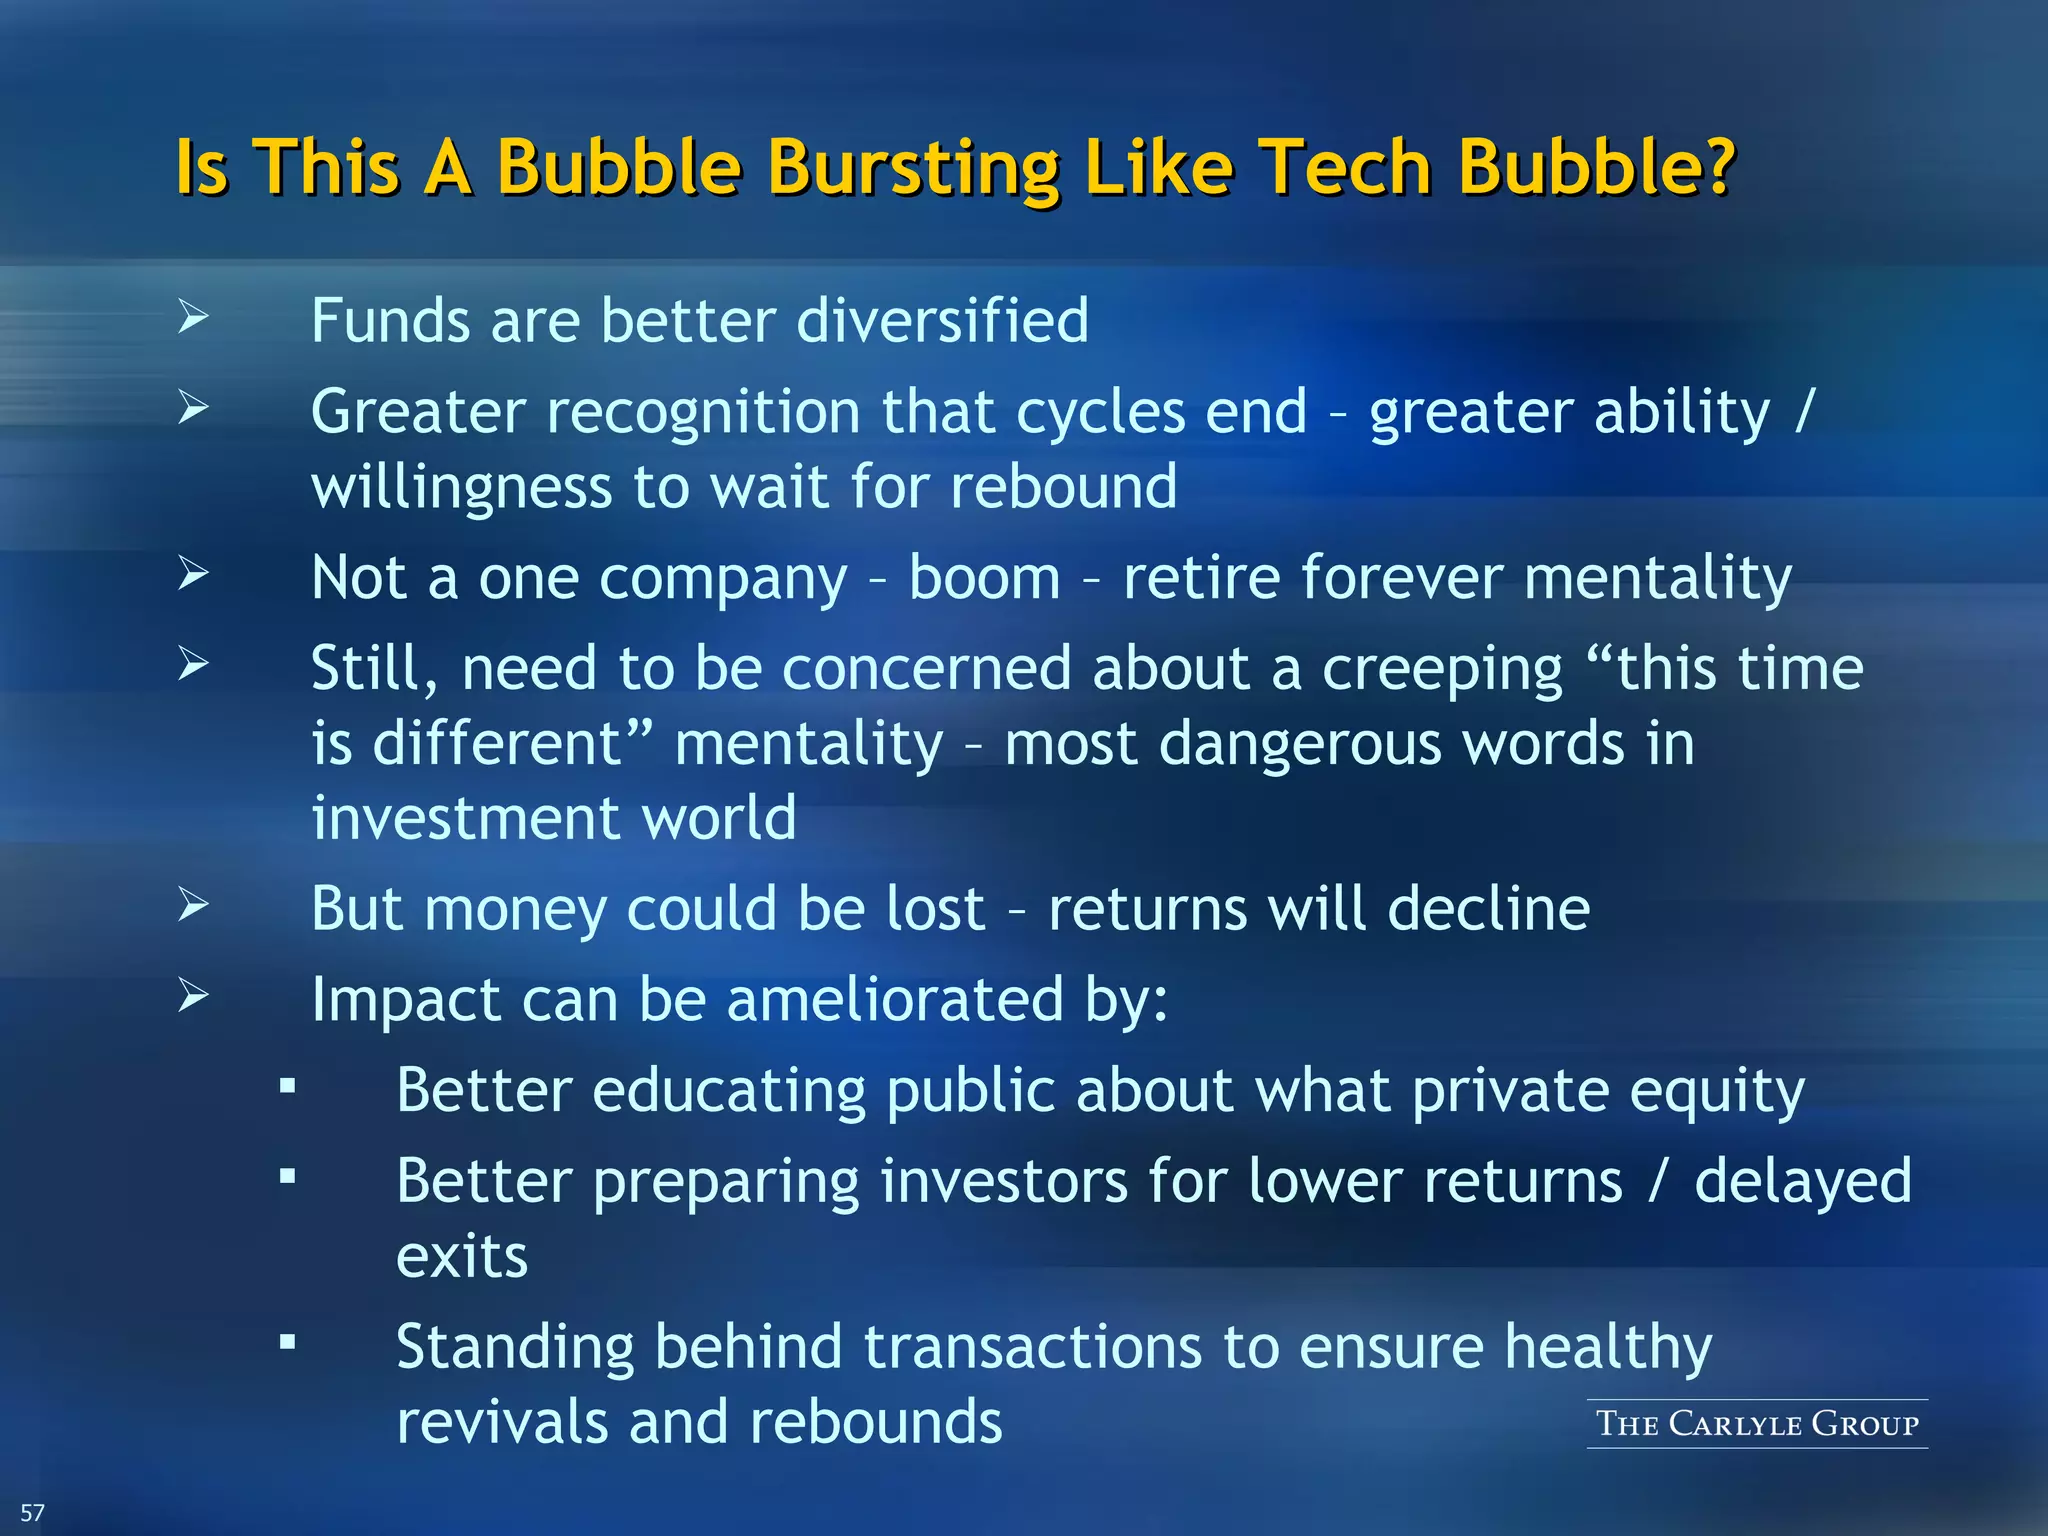
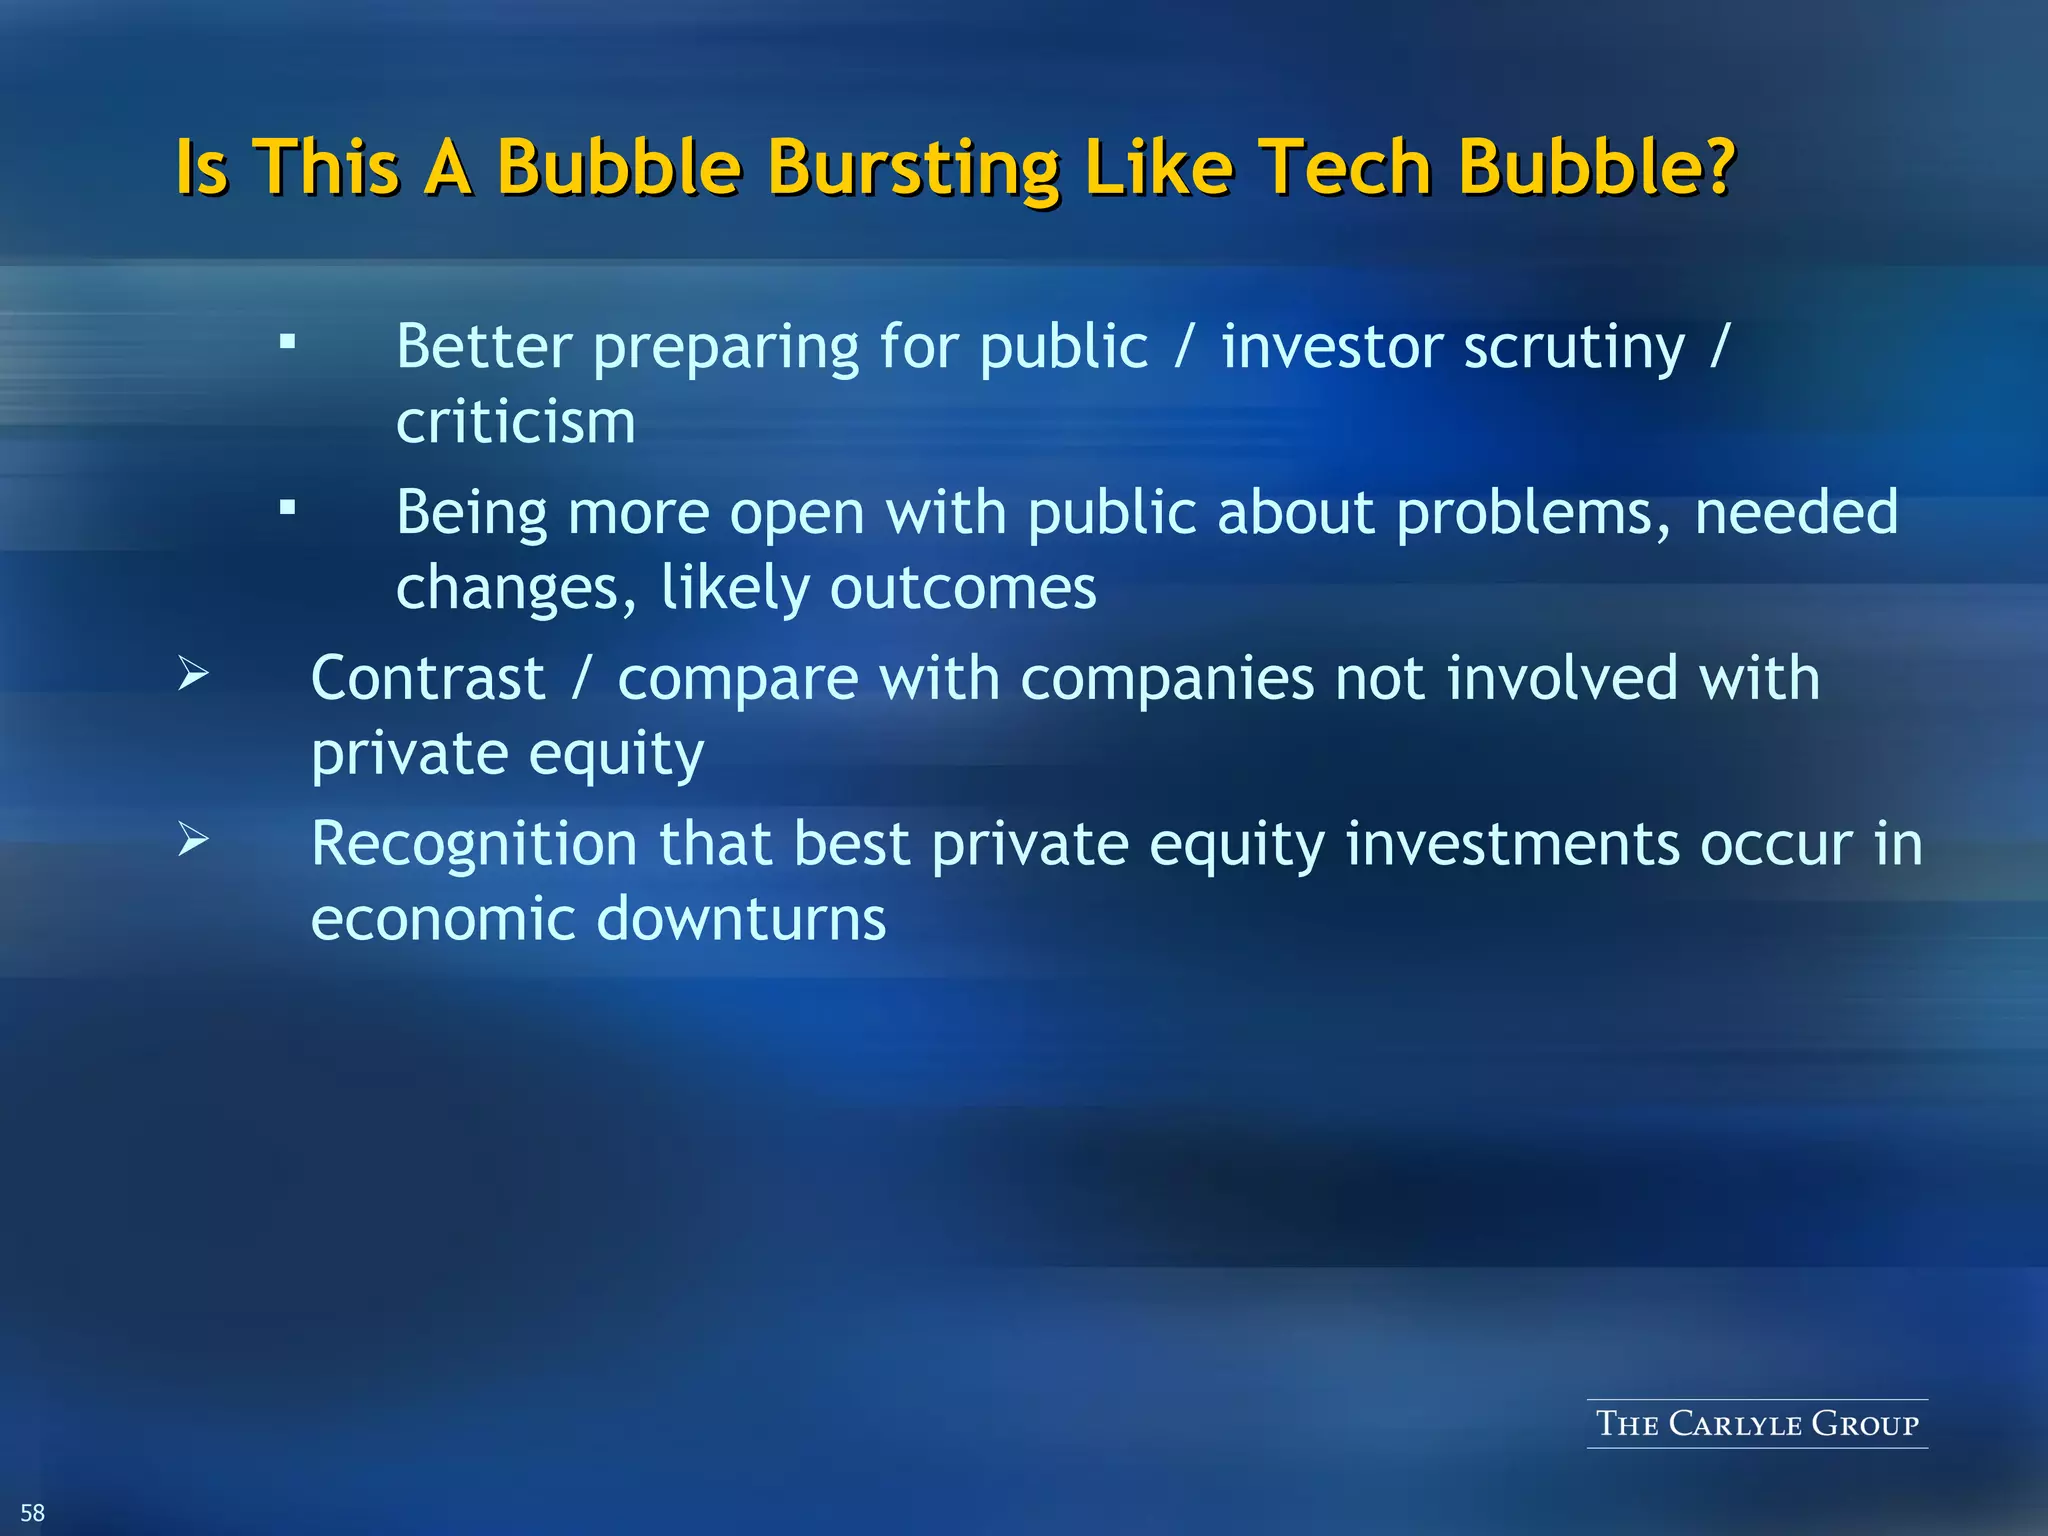
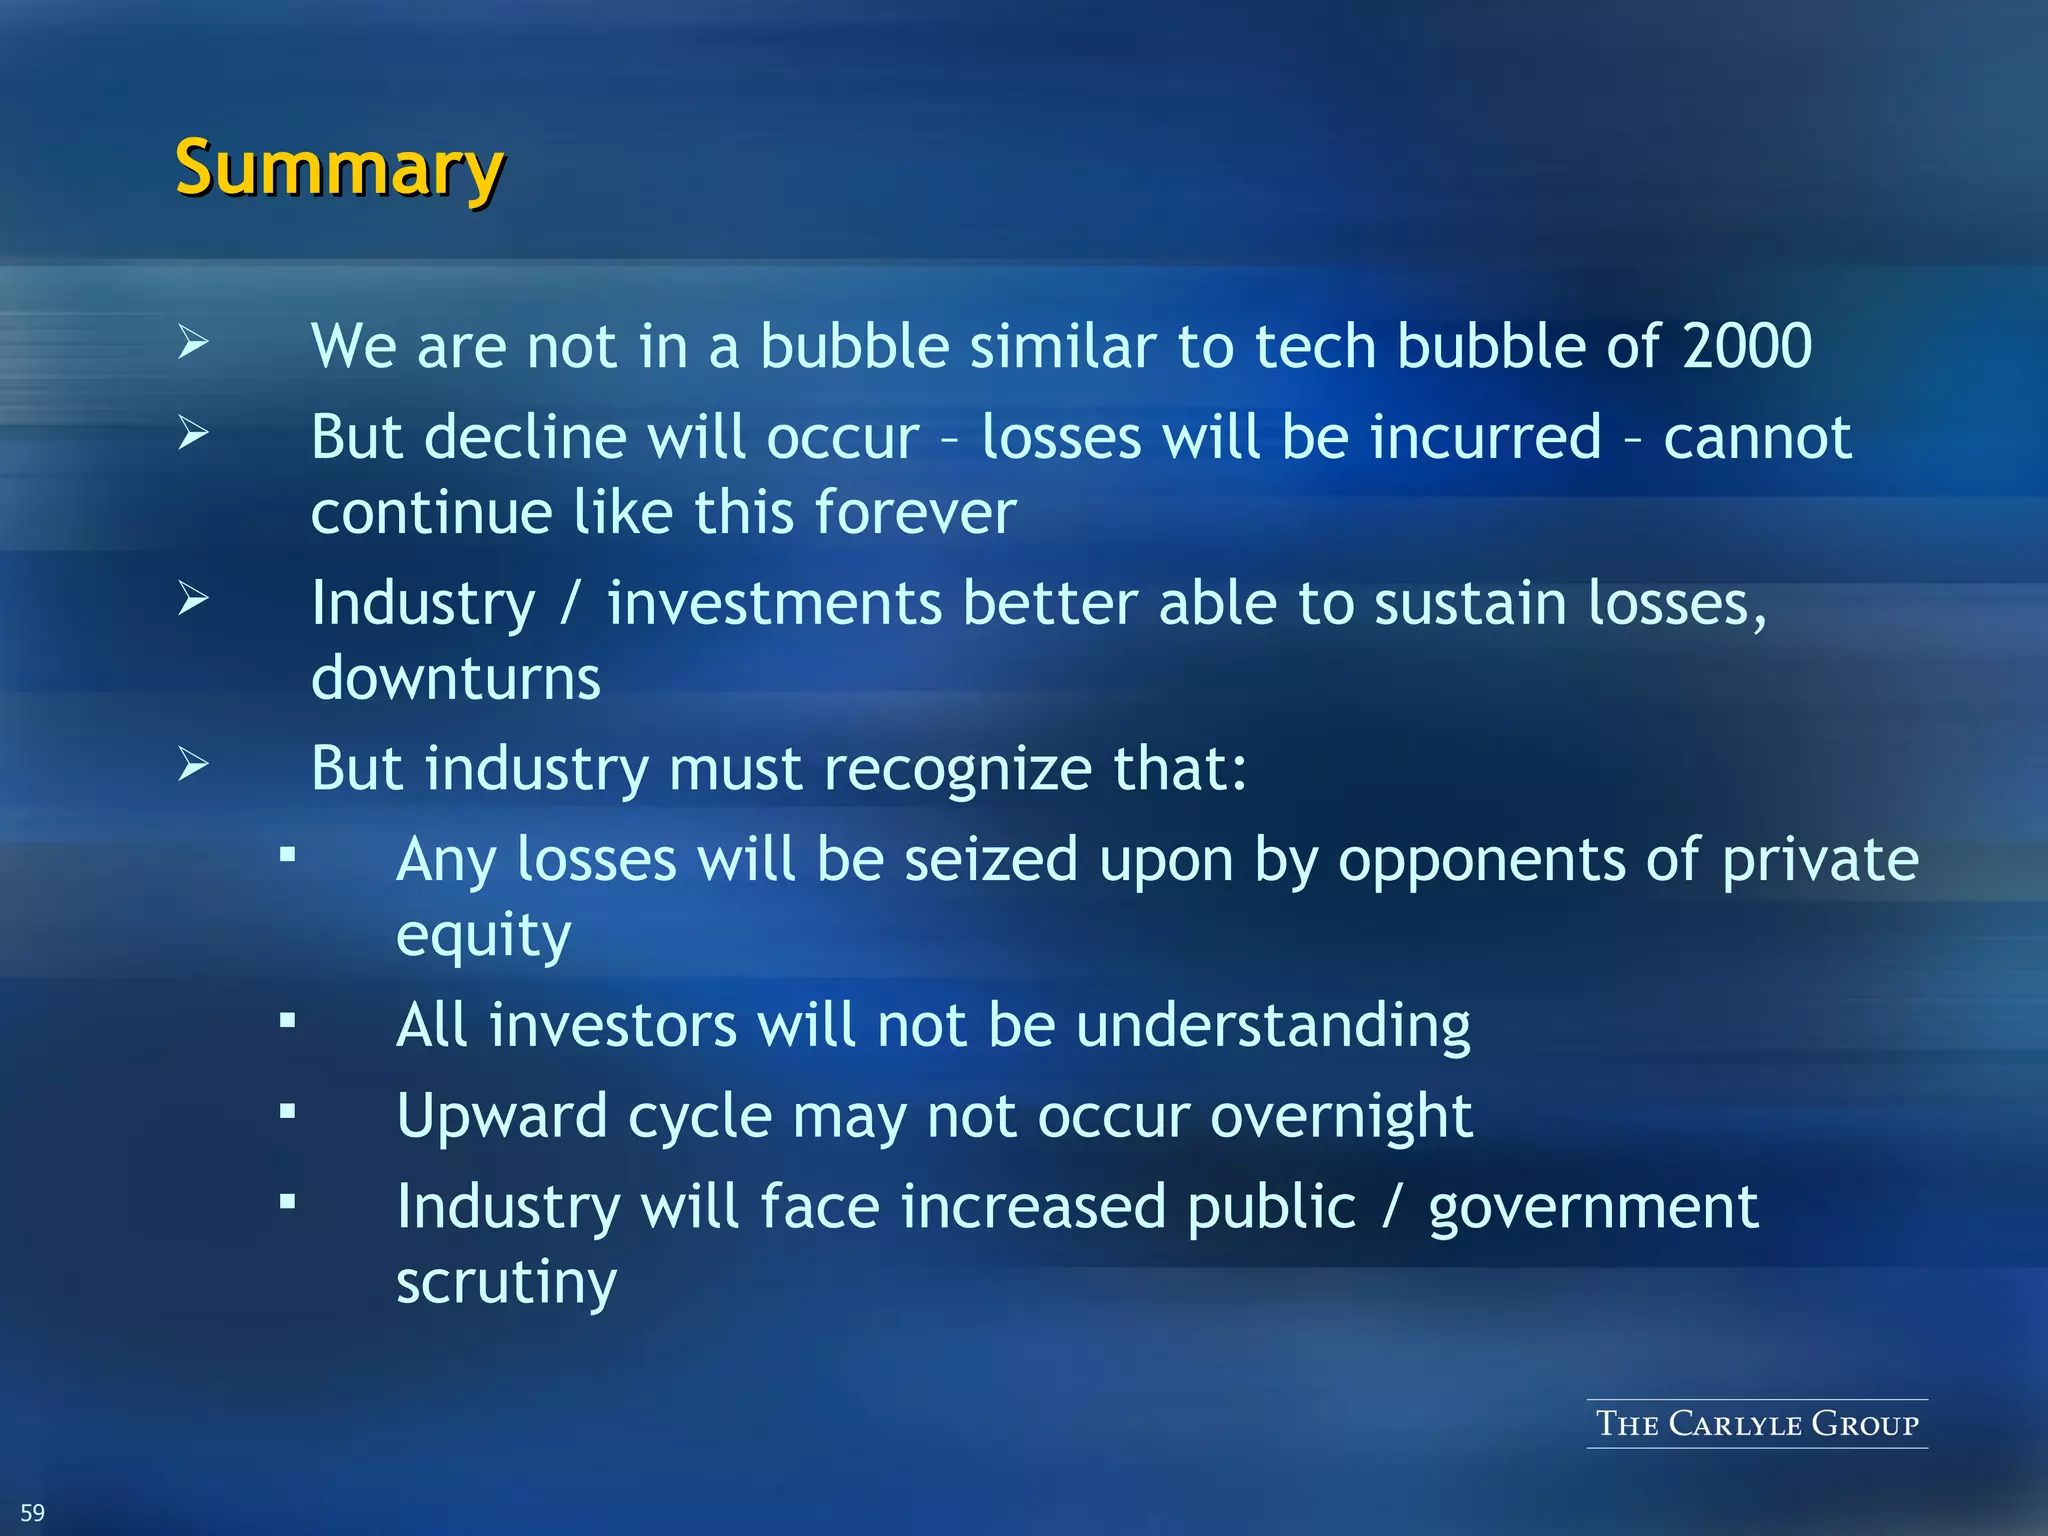
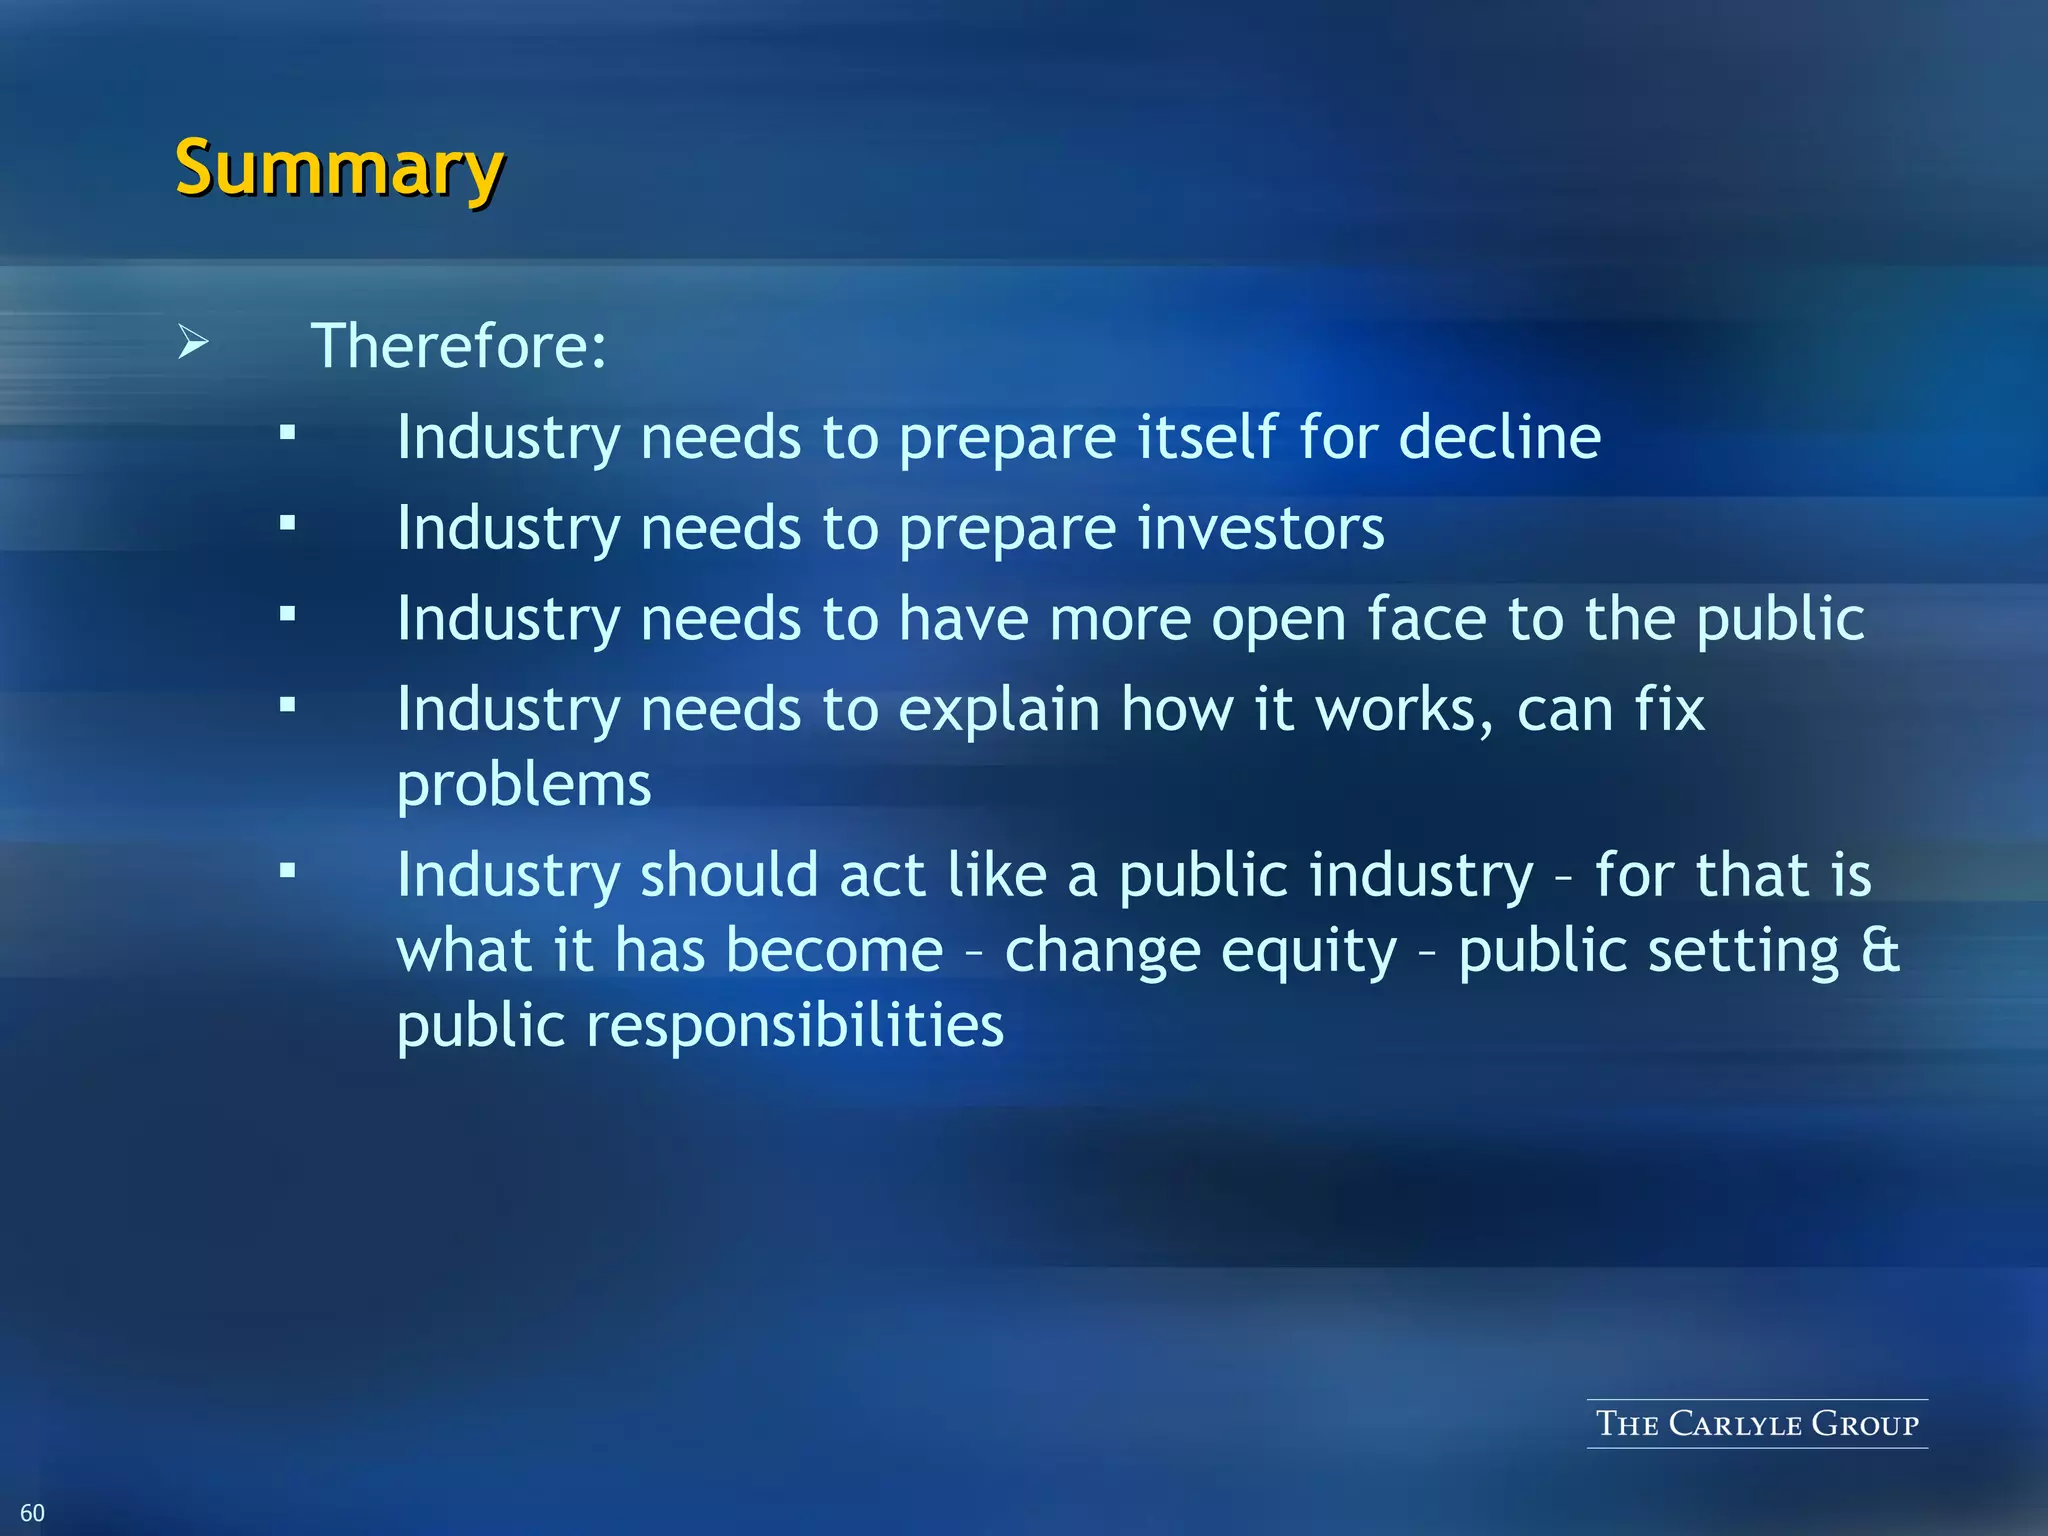
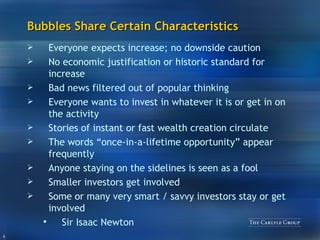
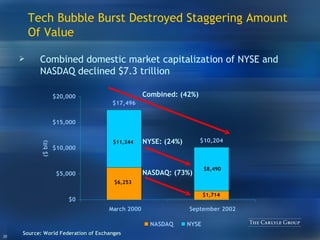
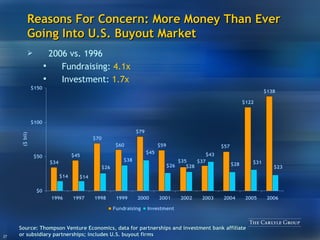
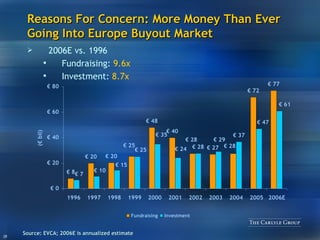
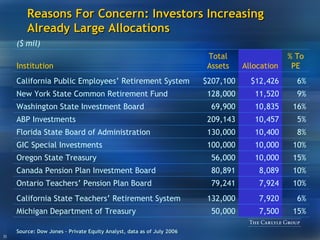
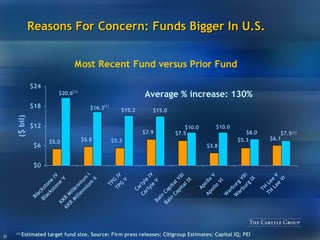
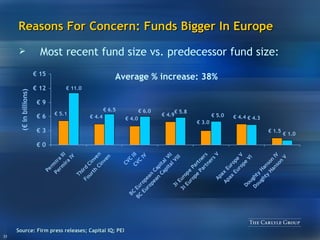
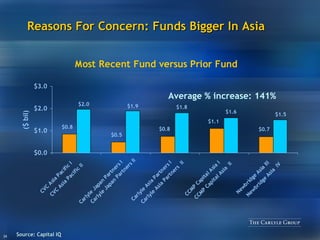
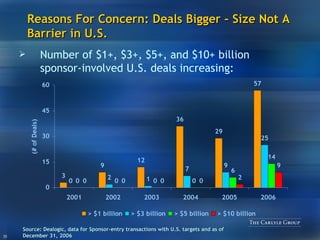
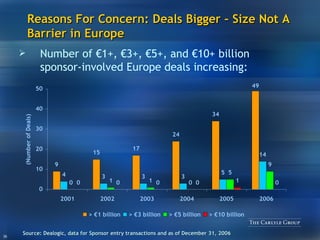
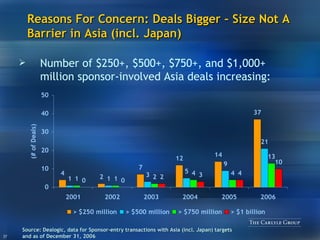
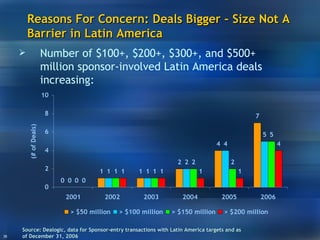
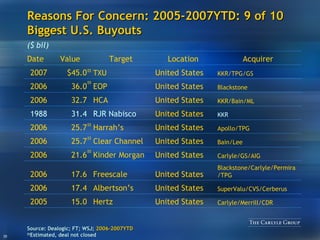
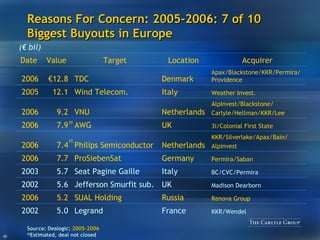
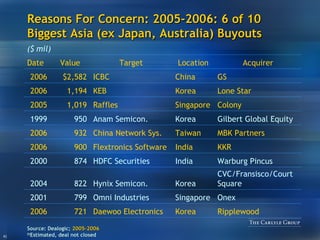
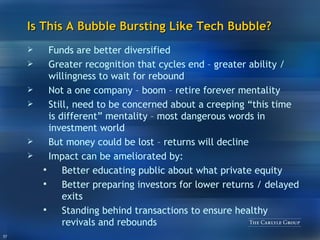
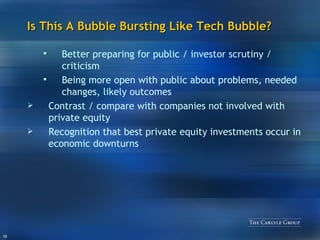
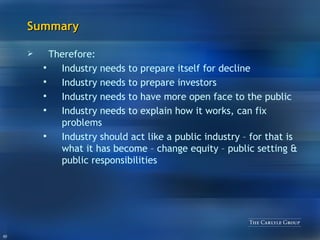
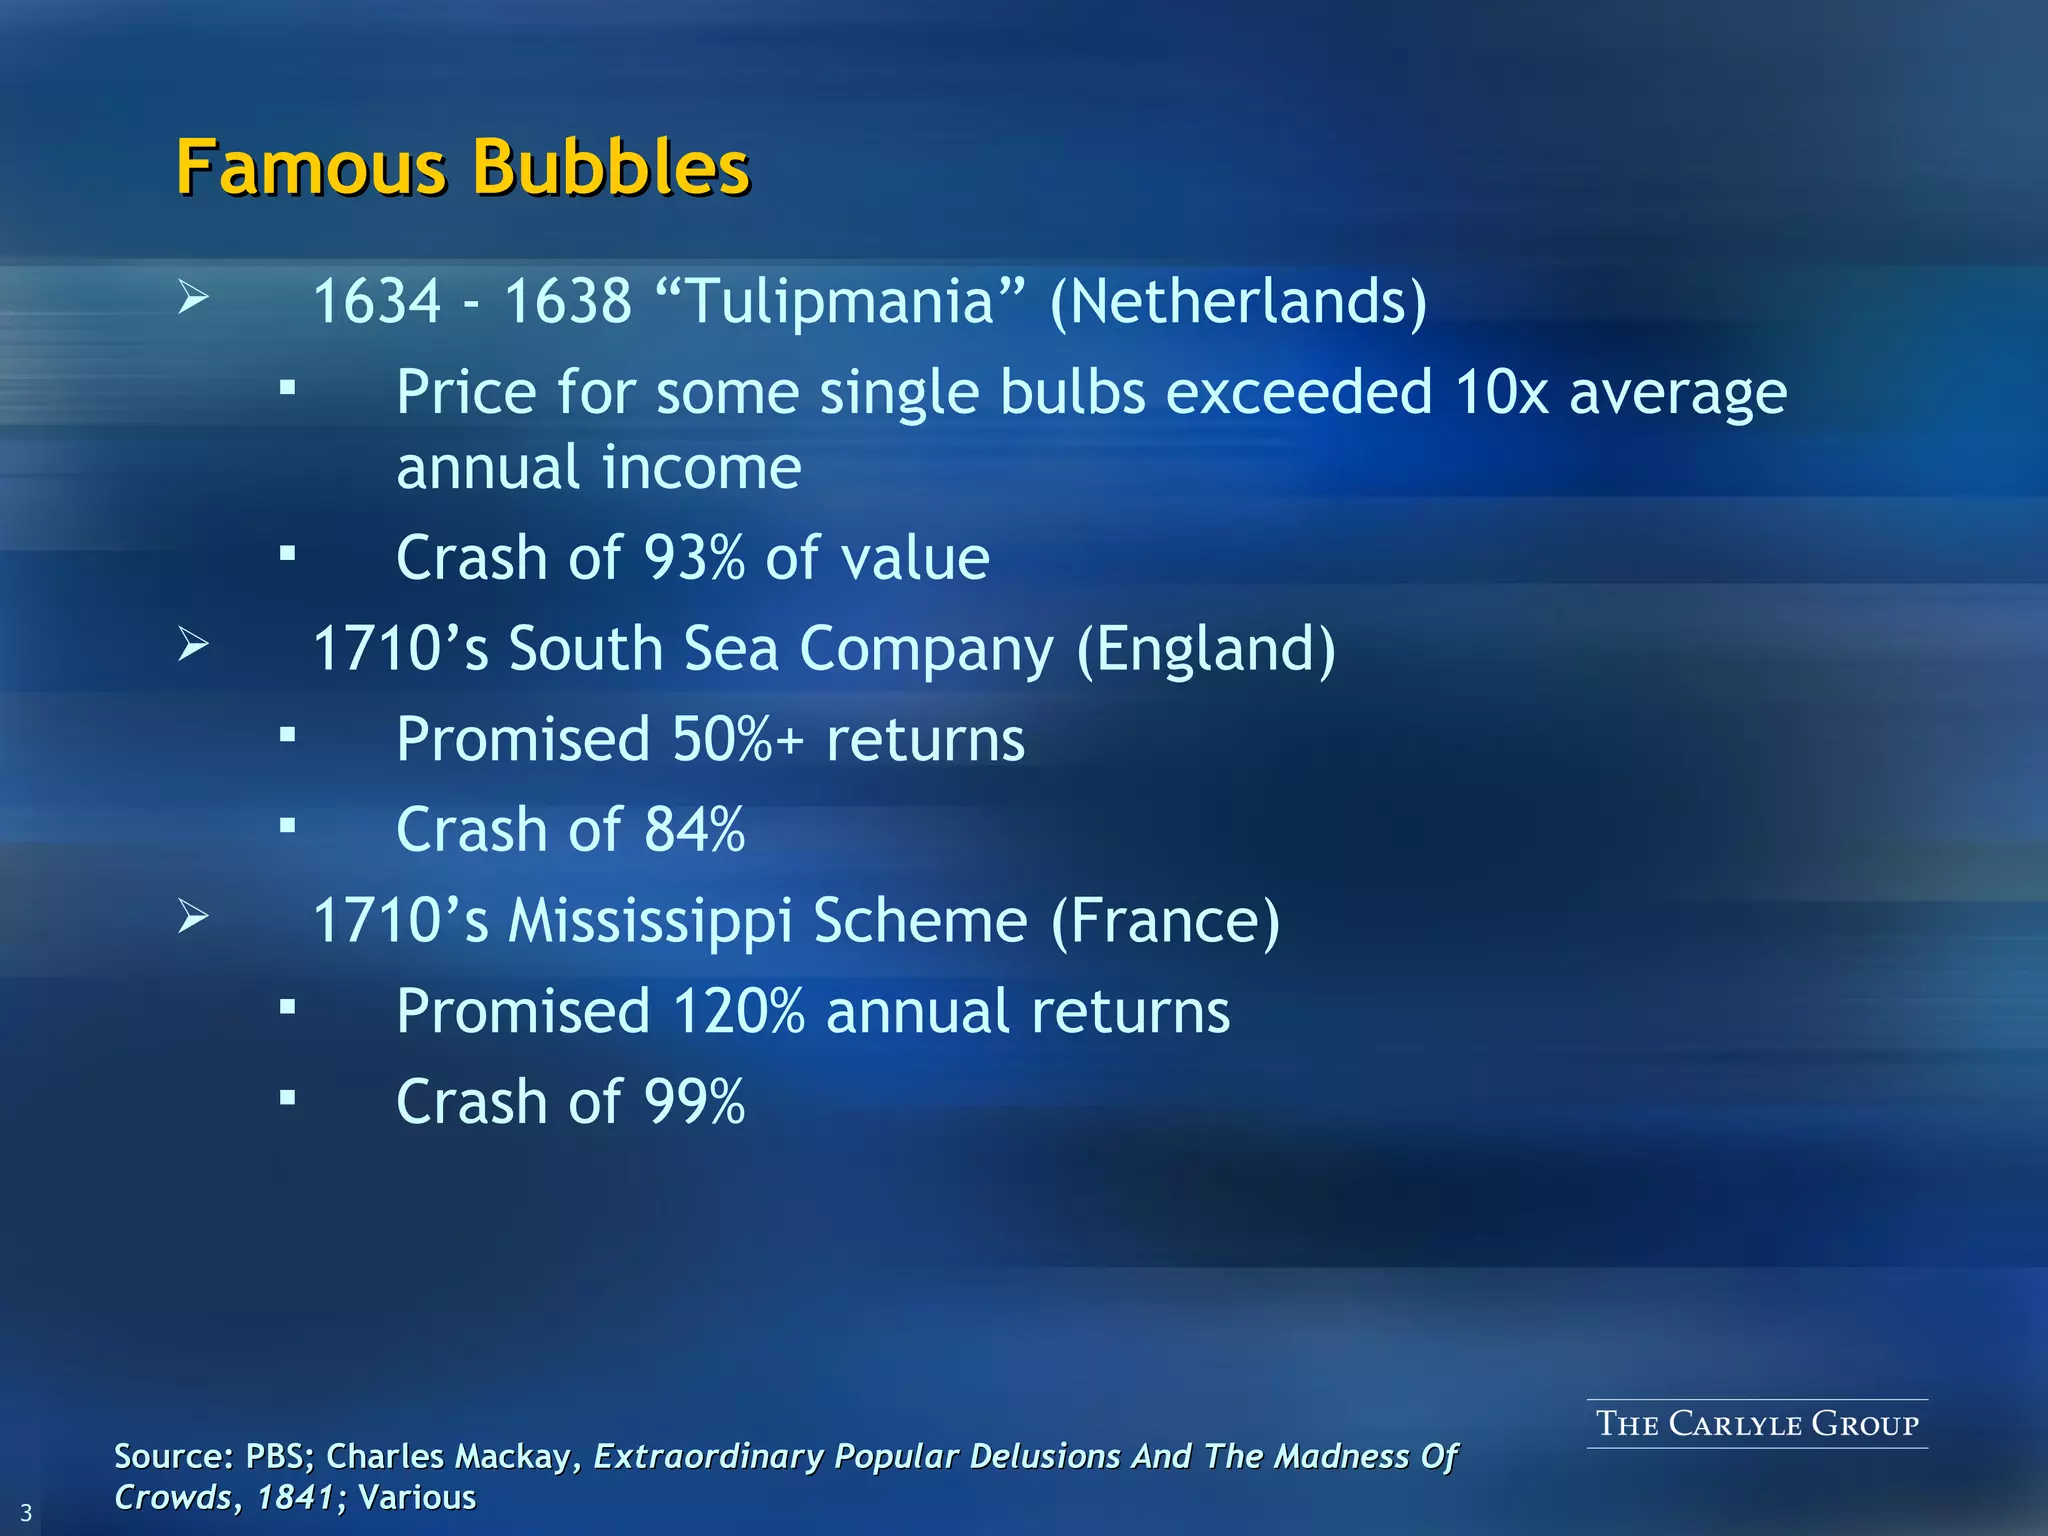
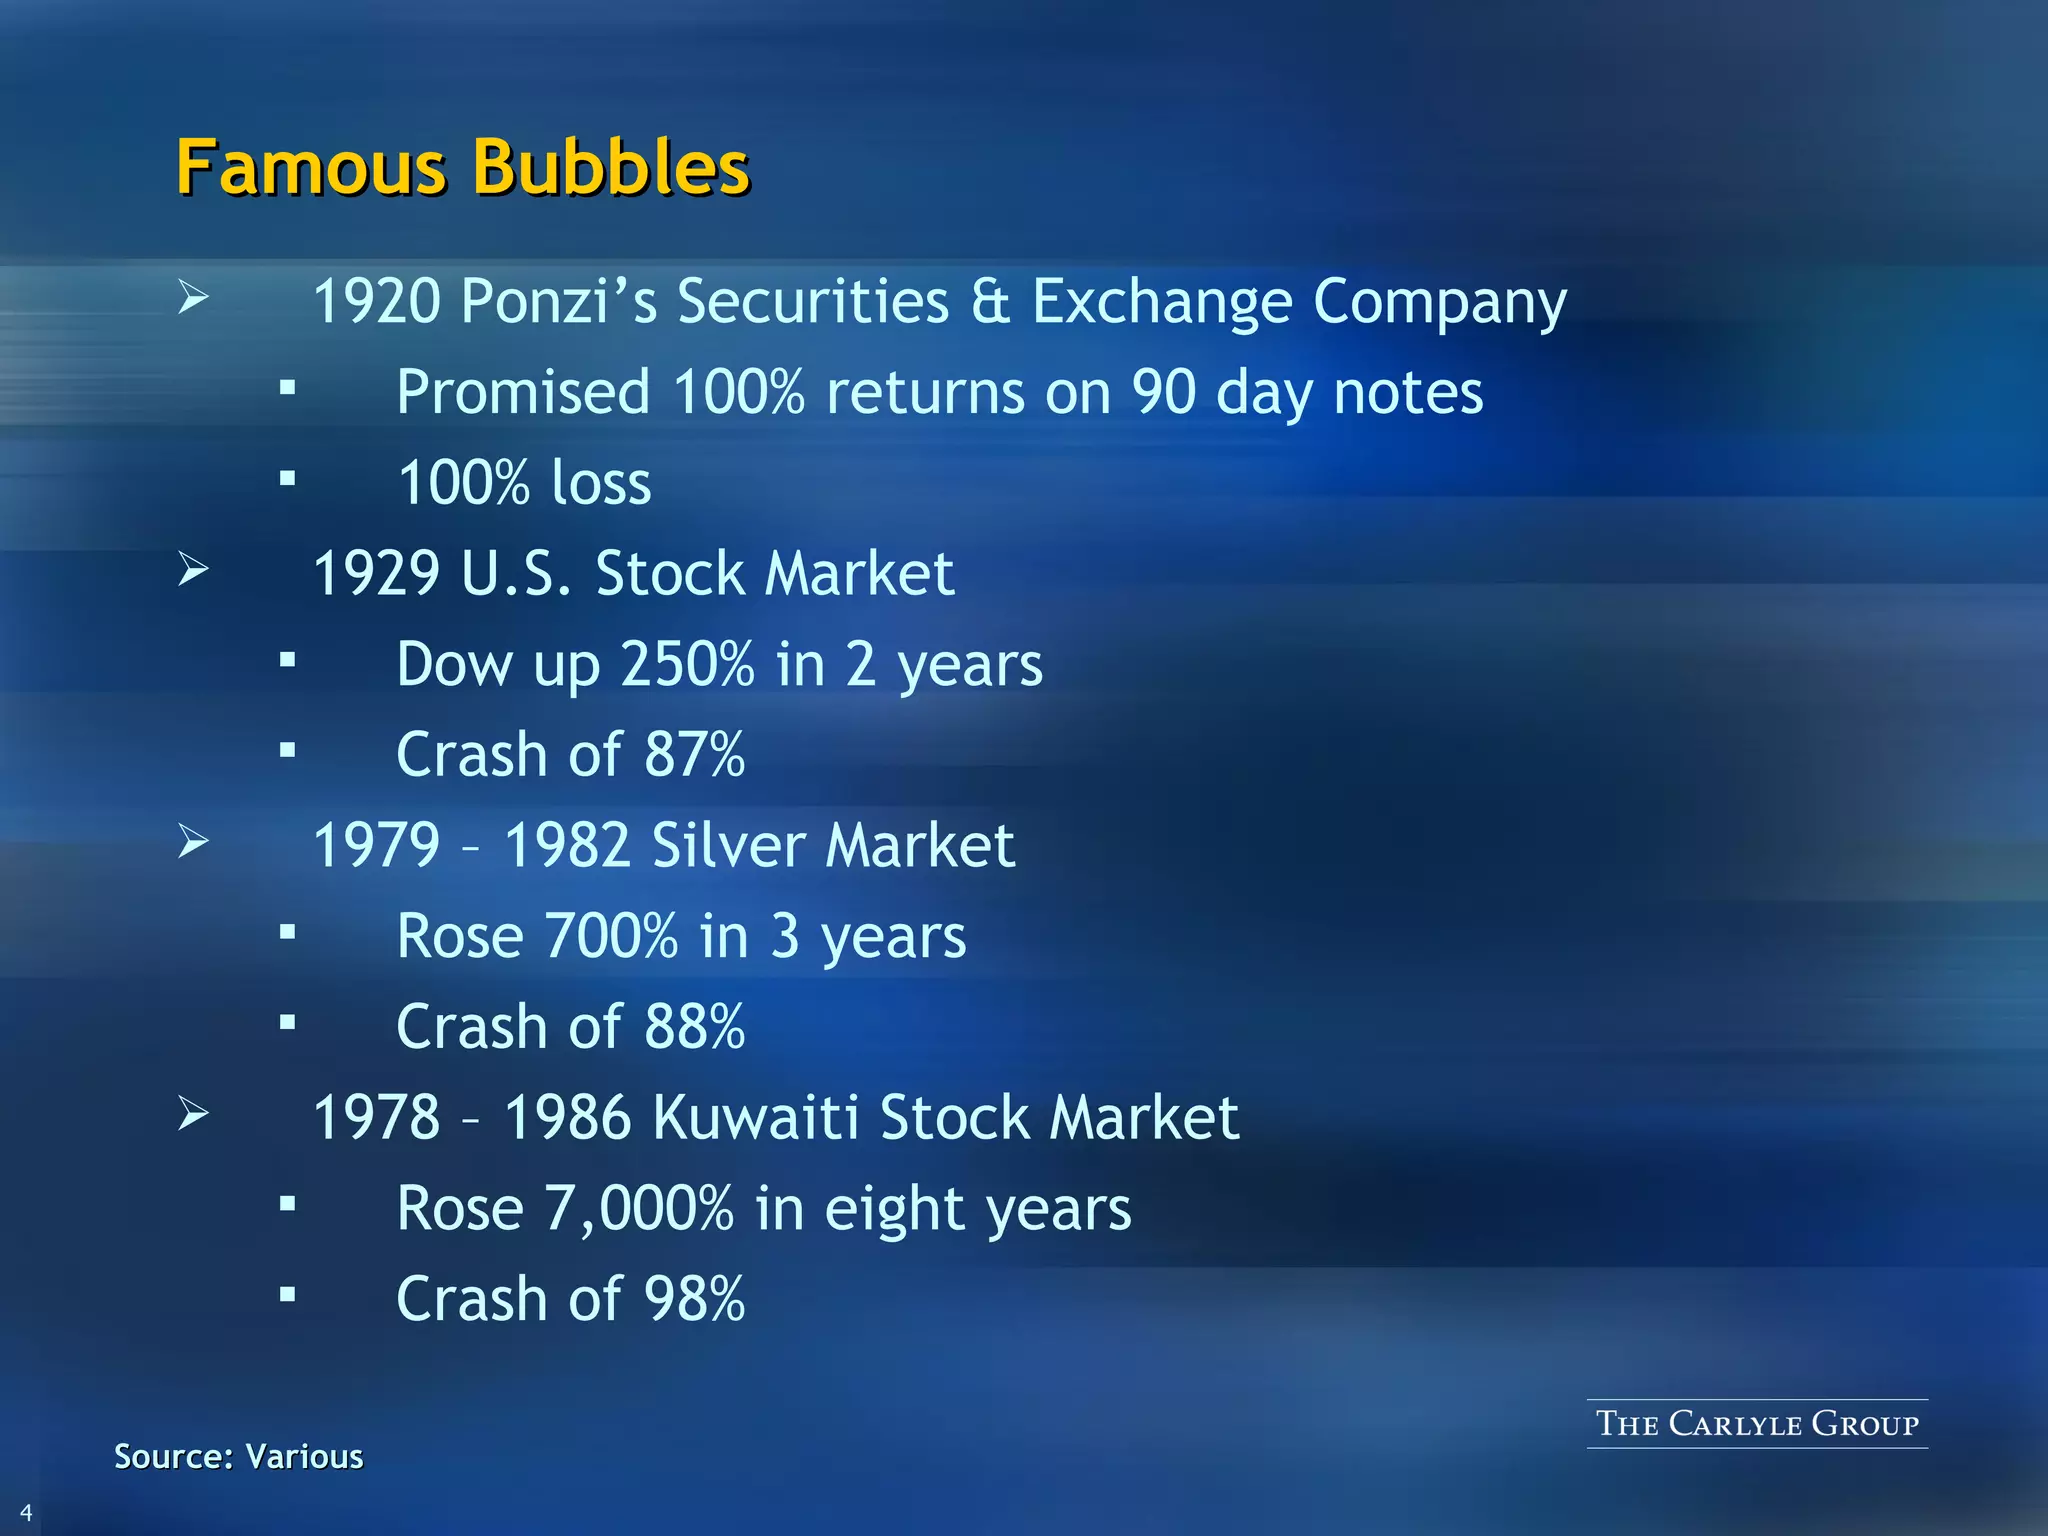
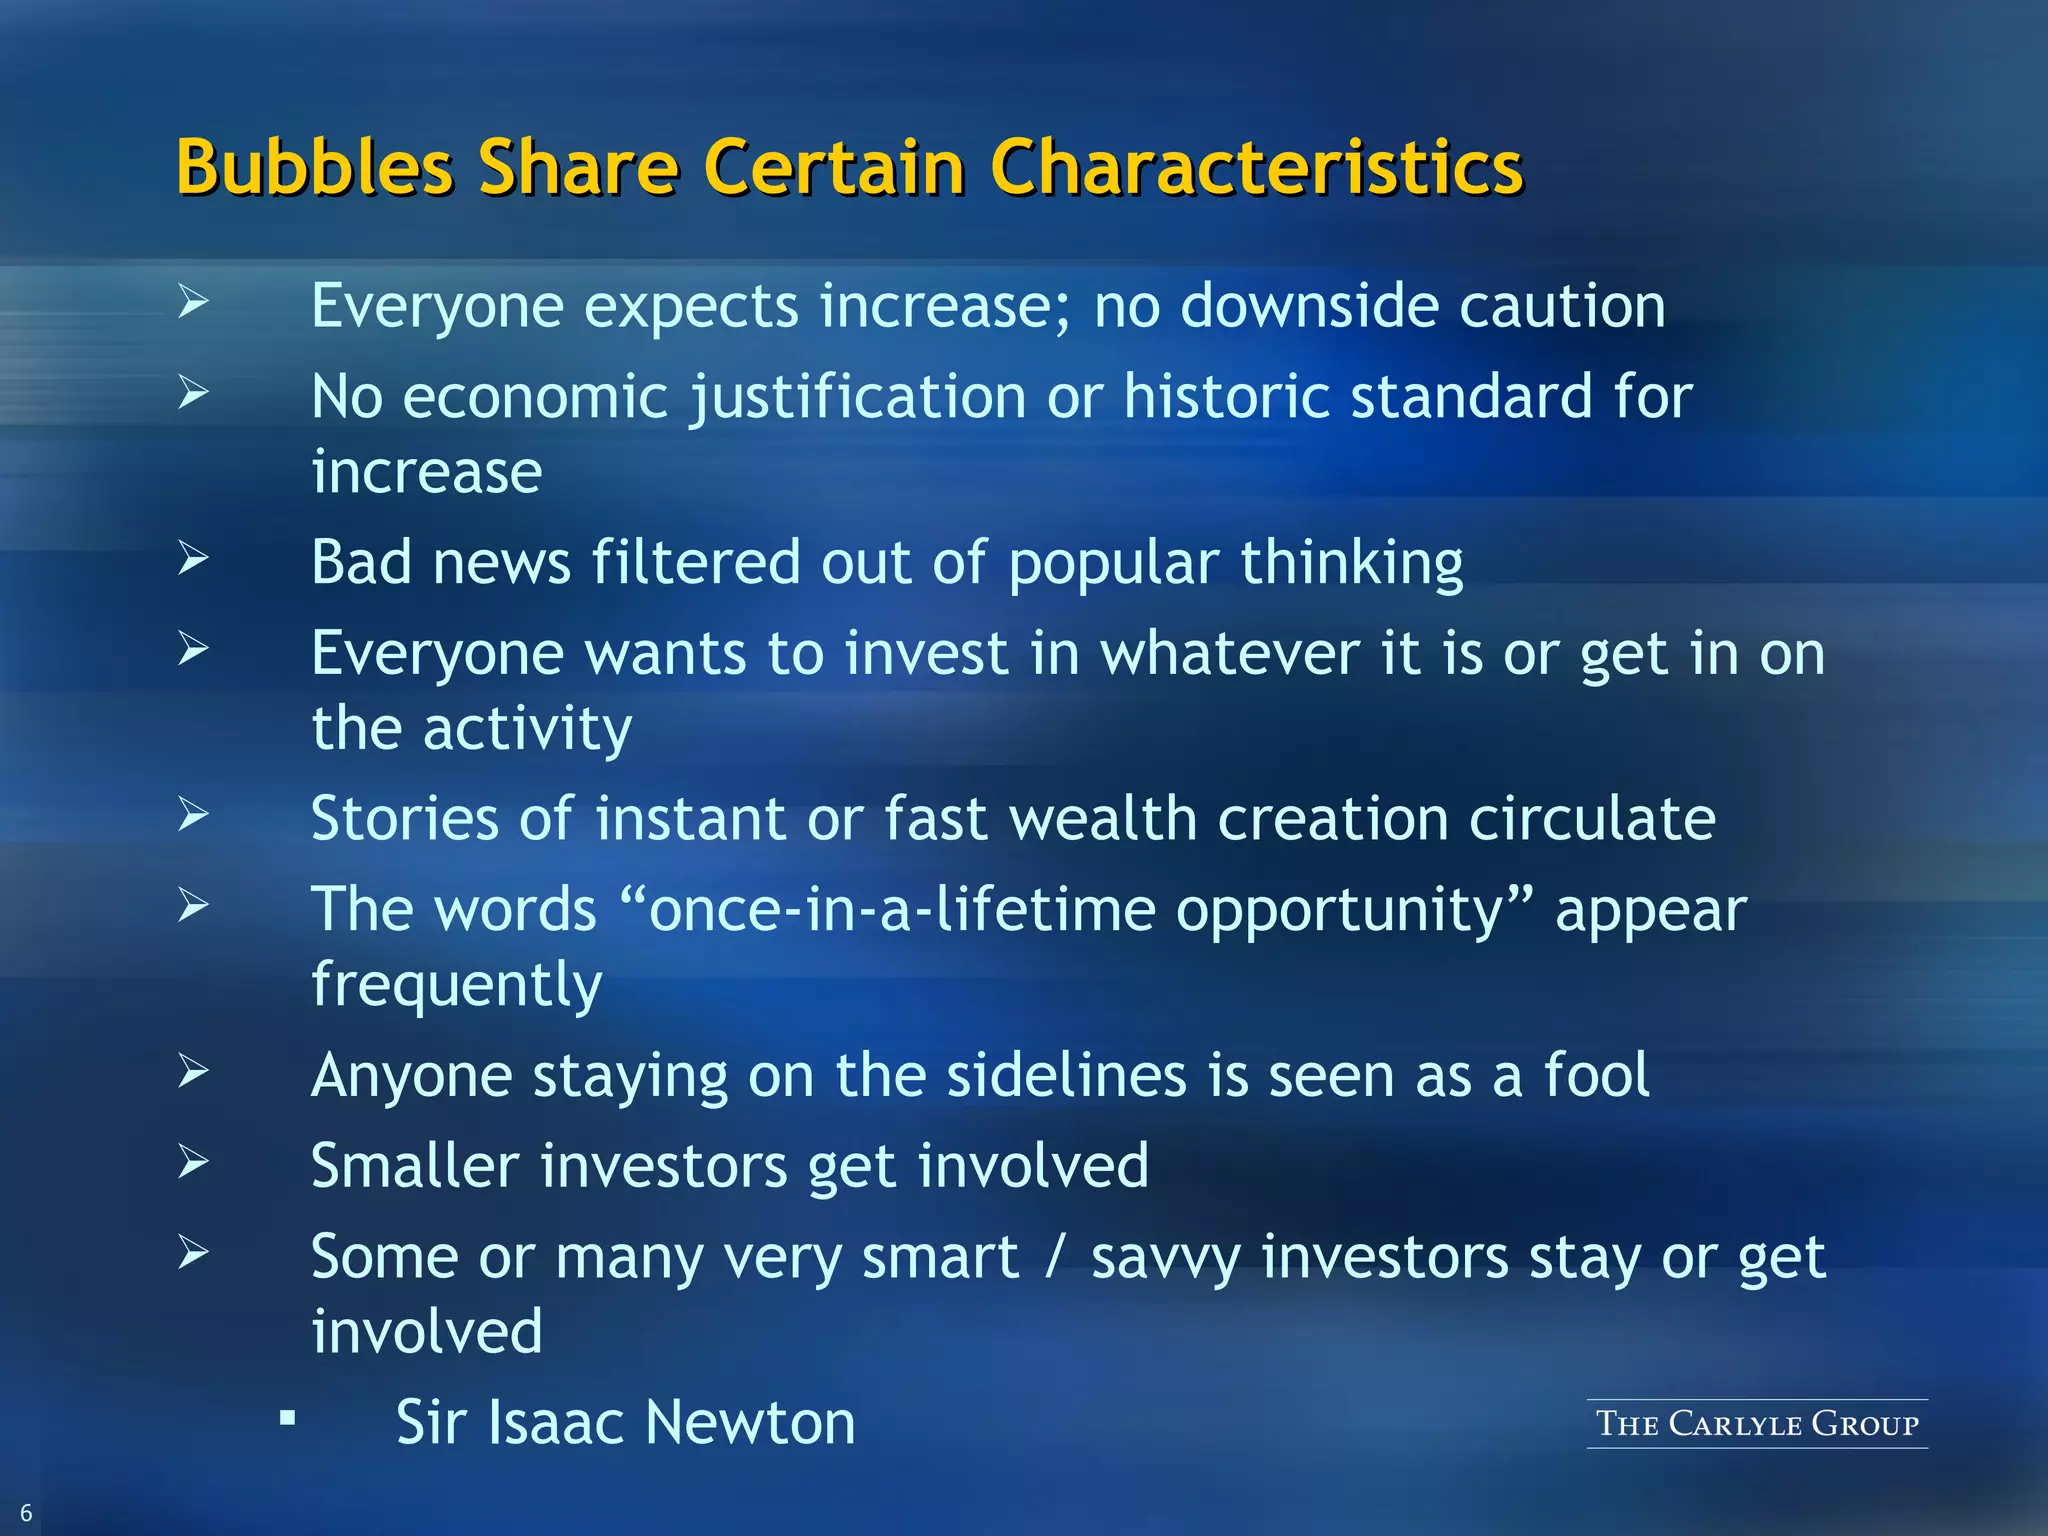
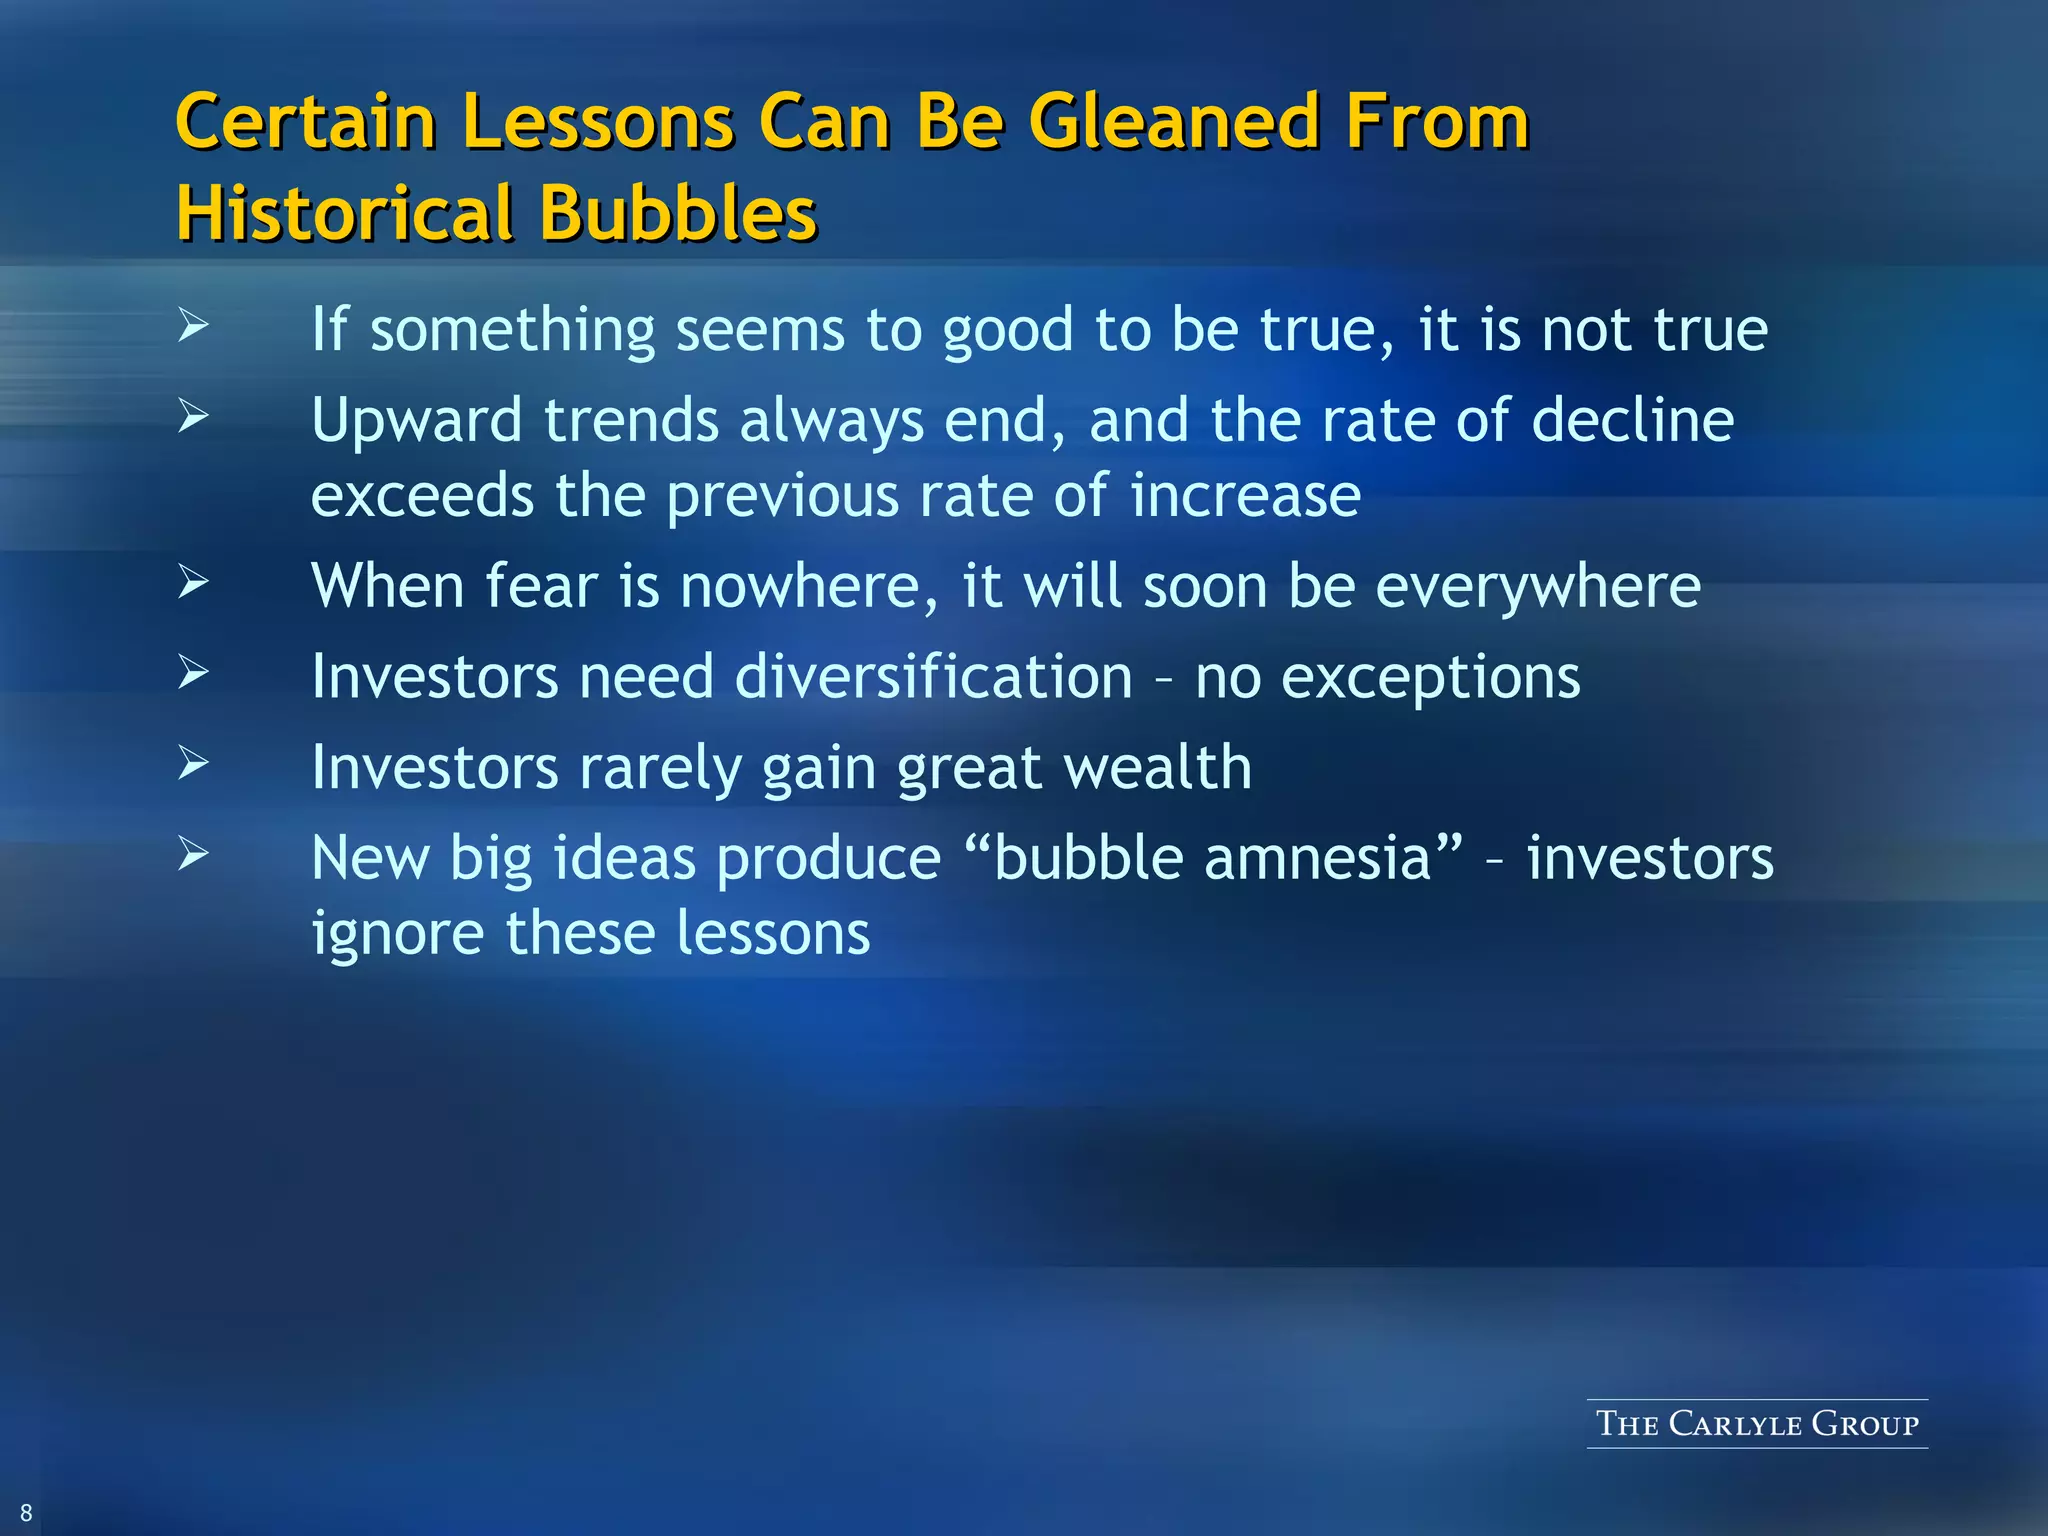
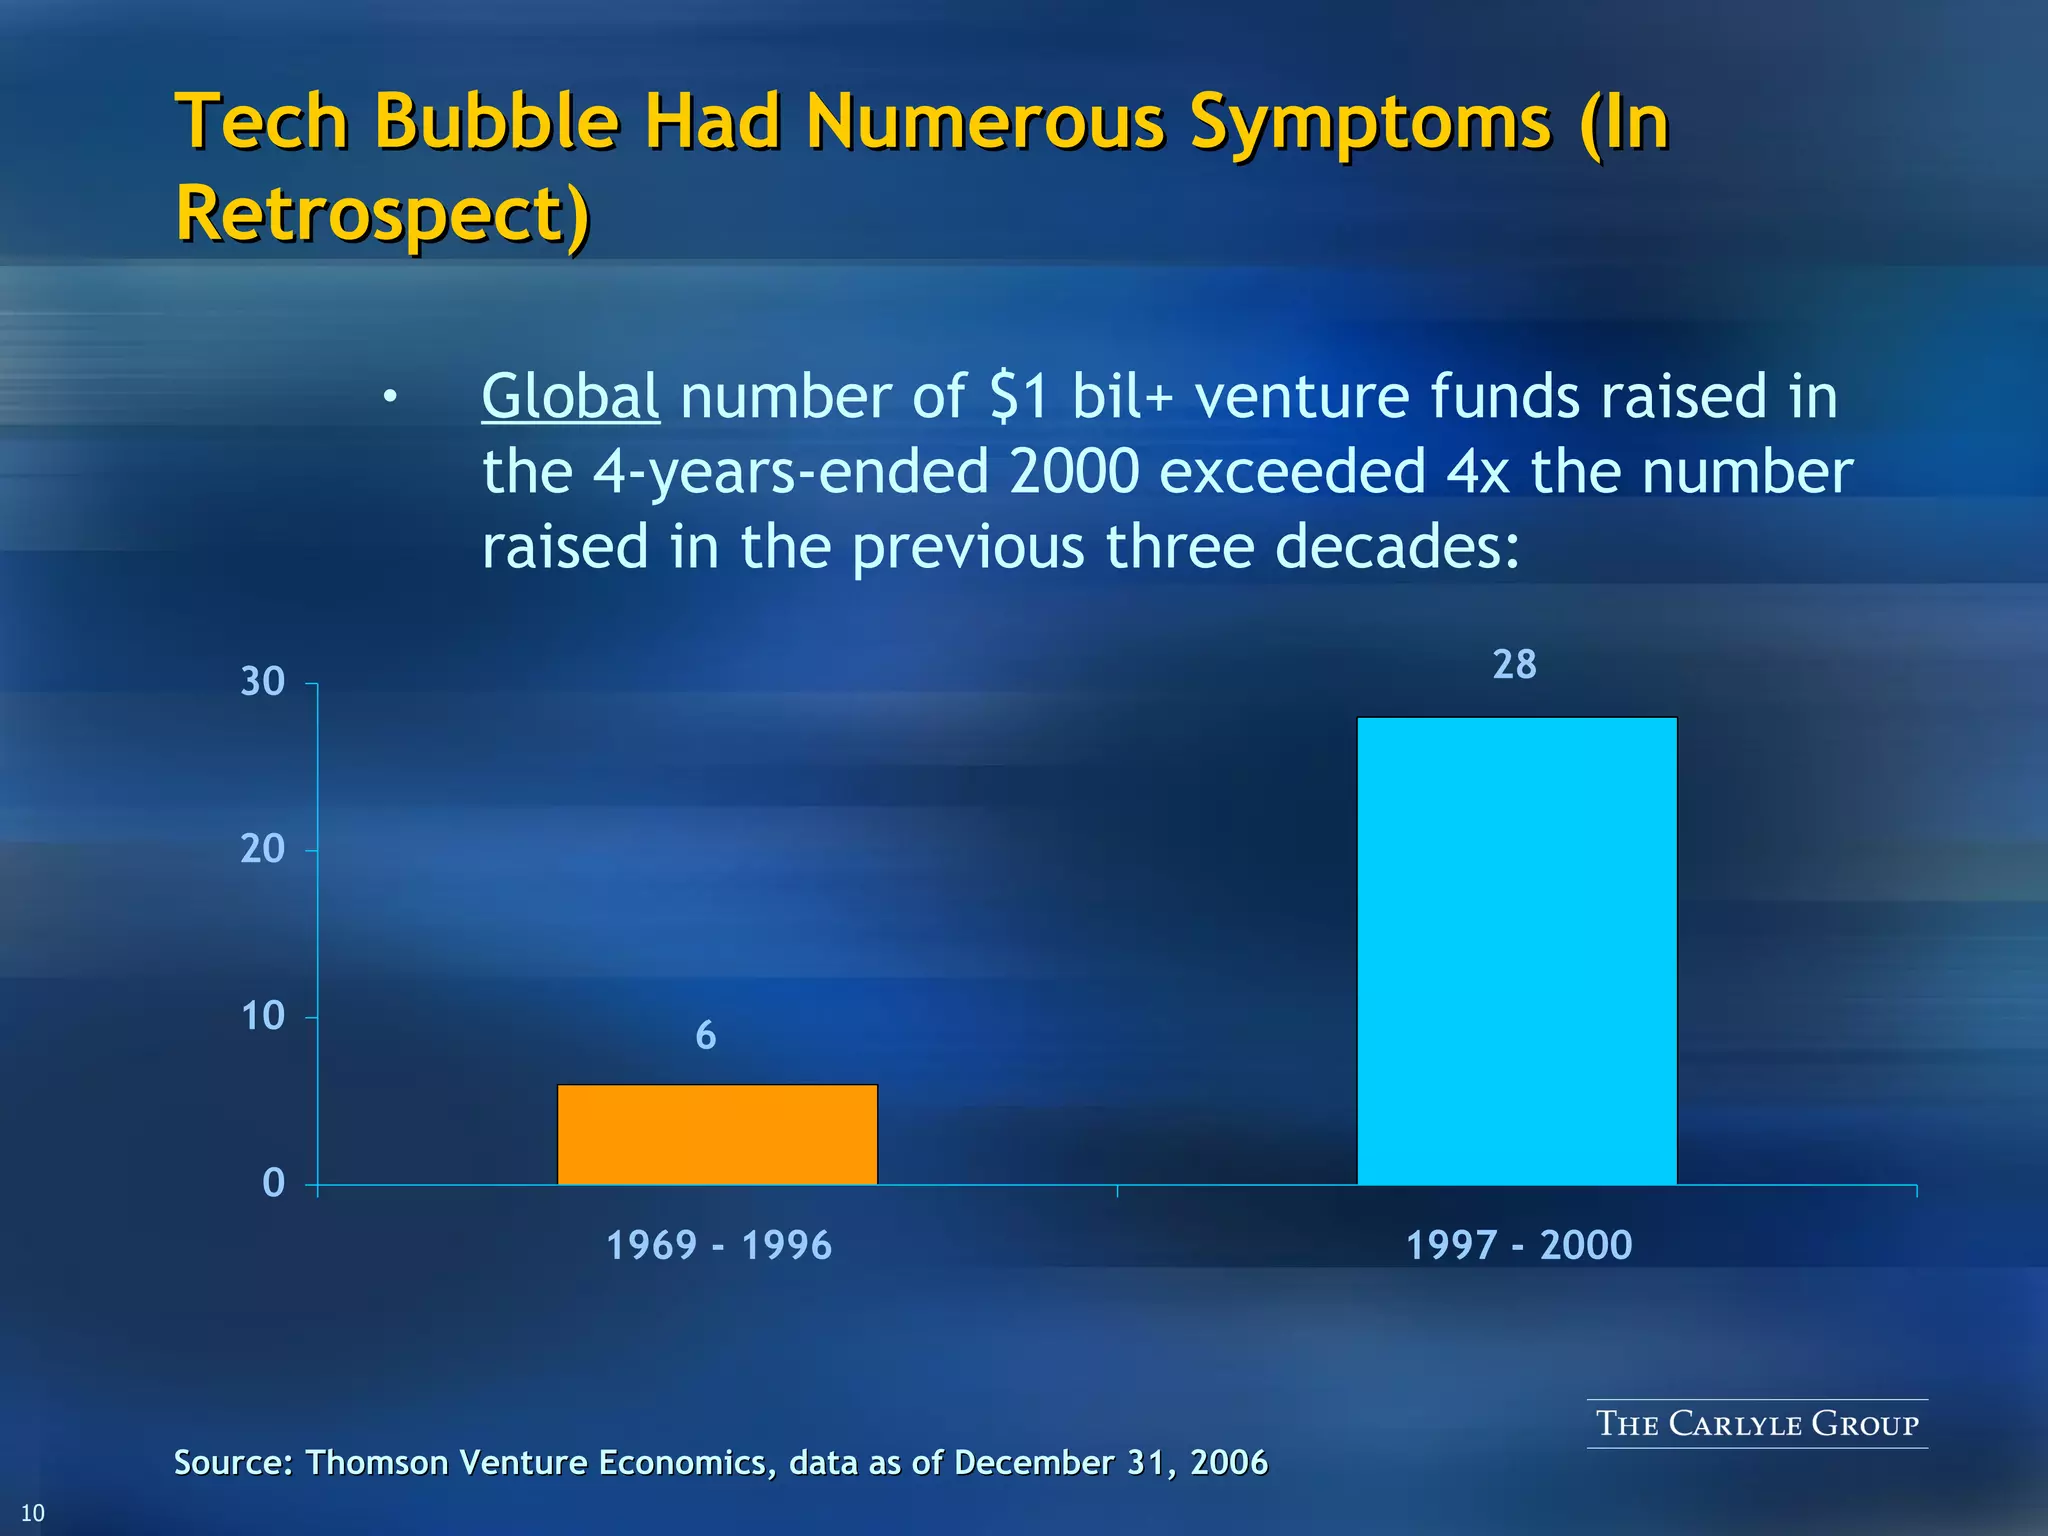
KEMBAR78
Rubenstein SuperReturn Presentation | PPT
The Similarities & Differences Between The Tech Bubble Burst of 2000 & The Current Private Equity Markets: Are We On The Verge Of A PE Bubble Burst? David M. Rubenstein Co-Founder and Managing Director   February 28, 2007
Bubble No one definition – “Know it when I see it” Greater Fool Theory: “…speculation is justified because there are enough fools to push prices further upward” – Barron’s “… whole communities suddenly fix their minds upon one object, and go mad in its pursuit….” – Charles Mackay,  Extraordinary Popular Delusions And The Madness Of Crowds,  1841 Source: Barron’s Dictionary of Finance and Investment Terms; Charles Mackay, Extraordinary Popular Delusions And The Madness Of Crowds, 1841 and preface, 1852
Famous Bubbles 1634 - 1638 “Tulipmania” (Netherlands) Price for some single bulbs exceeded 10x average annual income Crash of 93% of value 1710’s South Sea Company (England) Promised 50%+ returns Crash of 84% 1710’s Mississippi Scheme (France) Promised 120% annual returns Crash of 99% Source: PBS; Charles Mackay,  Extraordinary Popular Delusions And The Madness Of Crowds, 1841;  Various
Famous Bubbles 1920 Ponzi’s Securities & Exchange Company Promised 100% returns on 90 day notes 100% loss 1929 U.S. Stock Market Dow up 250% in 2 years Crash of 87% 1979 – 1982 Silver Market Rose 700% in 3 years Crash of 88% 1978 – 1986 Kuwaiti Stock Market Rose 7,000% in eight years Crash of 98% Source: Various
Famous Bubbles 1987 Dow Jones Industrial Average Dow up 200% in 5 years (real GDP up 20%) October 19 collapse of 508 points (22.6%) 1998 Russian Ruble Ruble went from 6 to 20 per dollar in a 2 week period 1999 Tech Bubble $7 trillion loss of value Source: Various
Bubbles Share Certain Characteristics Everyone expects increase; no downside caution No economic justification or historic standard for increase Bad news filtered out of popular thinking Everyone wants to invest in whatever it is or get in on the activity Stories of instant or fast wealth creation circulate The words “once-in-a-lifetime opportunity” appear frequently Anyone staying on the sidelines is seen as a fool Smaller investors get involved Some or many very smart / savvy investors stay or get involved Sir Isaac Newton
Bubbles Share Certain Characteristics Capital flows to investments with no underlying assets / value Discipline evaporates from the investment process Prices increase far beyond historical norms or reasonably estimable economic value People invest more than they can afford to lose
Certain Lessons Can Be Gleaned From Historical Bubbles If something seems to good to be true, it is not true Upward trends always end, and the rate of decline exceeds the previous rate of increase When fear is nowhere, it will soon be everywhere  Investors need diversification – no exceptions Investors rarely gain great wealth  New big ideas produce “bubble amnesia” – investors ignore these lessons
Tech Bubble Had Numerous Symptoms (In Retrospect) Ease of raising large amounts of capital for untested business models Investors committed almost 3x as much money to venture in the 4-years-ended 2000 than they had in the previous three decades Global  venture fundraising: Source:  Thomson Venture Economics, data as of December 31, 2006 – includes partnerships and investment bank affiliated or subsidiary partnerships
Tech Bubble Had Numerous Symptoms (In Retrospect) Global  number of $1 bil+ venture funds raised in the 4-years-ended 2000 exceeded 4x the number raised in the previous three decades: Source:  Thomson Venture Economics, data as of December 31, 2006
Tech Bubble Had Numerous Symptoms (In Retrospect) Venture capital investors poured $440 million into Webvan, an internet grocery deliver service 15x as much as Kleiner Perkins raised for its first  fund The company went public with $400,000 in revenue and reached a market cap of $1.2 billion Two years later the stock had fallen from 34 dollars to 6 cents Bankrupt two years later
Tech Bubble Had Numerous Symptoms (In Retrospect) Priceline Following 1999 IPO, market cap peaked at $14 billion – more than the combined market cap of Continental, Delta, Northwest, and United – which totaled $12 billion at the time Current (2007) market cap ~ $2 billion eToys Revenue was $250 million or 1/44 th  of Toys “R” Us’s revenue of $11 billion Market value was 3x greater than Toys “R” Us Went bankrupt
Tech Bubble Had Numerous Symptoms (In Retrospect) Internet Capital Group L argest IPO of 1999 Held  investments in  47  e-commerce startups Valuations were 120x earnings Reached market cap $46 billion within 4 months –  more than General Motors   Current (2007) market cap: $487 million Detachment of prices from underlying revenue / economic significance VA Linux Sells computers running Linux operating system Closed up 698% on the first day of trading At one point, trading up 10x IPO price Current (2007) market cap 1/8 of peak
Tech Bubble Had Numerous Symptoms (In Retrospect) Corvis Developer of long haul optical communications equipment Zero trailing revenue at IPO Raised $1.1 billion in IPO proceeds at a $12 billion valuation in August 2000 Acquired in 2006 for $1.4 billion Ariba E-commerce software firm IPO in June 1999 with $1 billion valuation Peak valuation of $42 billion in September 2000 (higher than Boeing, GM or Ford) Current (2007) market cap $759 million 98% decline from peak valuation
Tech Bubble Had Numerous Symptoms (In Retrospect) Kozmo.com Internet delivery service with no service charge Spent $280 million to build service Bankrupt Globe.com Designed by two 23 year olds to sell ads on its website Stock went from $9 / share to $97 / share One of the largest first-day gains of any IPO No longer in business [email_address] $35 billion of market cap at peak Bankrupt
Tech Bubble Had Numerous Symptoms (In Retrospect) Cisco Peak market cap reached $555 billion – highest in the world  Price / earnings multiple reached 160x in March 2000 Lost $400 billion of market cap
Source:  Forbes Tech Bubble Had Numerous Symptoms (In Retrospect) 378% 386% 427% 442% 458% 482% 483% 508% 525% 698% First-Day Return 120 Network Equipment CacheFlow 1999 144 Internet Software webMethods 2000 173 Internet Retailing FreeMarkets 1999 110 Network Equipment Cobalt Networks 1999 234 Internet Services Akamai Technologies 1999 28 Internet Services theglobe.com 1998 284 Network Equipment Sycamore Networks 1999 216 Telecom Products Avanex 2000 125 $132 Offer Value Telecom Products Computer Software Business Foundry Networks 1999 VA Linux Systems 1999 Company Year ($ mil)
Source:  Forbes Tech Bubble Had Numerous Symptoms (In Retrospect) 330% 13 Consulting Services Intgrtd. Sys. Consultg. 1996 357% 155 Telecom Products Finisar 1999 356% 110 Internet Services FirePond 2000 337% 68 Network Equipment Crossroads Systems 1999 331% 160 Internet Services Priceline.com 1999 331% 72 Internet Services Andover.Net 1999 313% 60 Telecom Services Wireless Facilities 1999 303% 91 Internet Services Neoforma.com 2000 42 $120 Offer Value Internet Services Internet Services Business 364% Ask Jeeves 1999 371% Selectical 2000 First-Day Return Company Year ($ mil)
Source: Renaissance Capital; IPO Monitor Number of  IPOs with  first-day  return  of   50 % +, 100%+, 200%+, 300%+, 400%+ : Tech Bubble Had Numerous Symptoms (In Retrospect)
Source: World Federation of Exchanges Tech Bubble Burst Destroyed Staggering Amount Of Value Combined: (42%) Combined domestic market capitalization of NYSE and NASDAQ declined $7.3 trillion NASDAQ: (73%) NYSE: (24%)
Tech Bubble Burst Destroyed Staggering Amount Of Value Europe Neue Market established in 1997 Market value multiplied by 17x by March 2000 Market closed at 4% of peak
Tech Bubble Commonality With Classic Bubbles New big idea (with some validity) captured popular imagination In this case - transformative power of technology / computers / the internet Everyone wanted to participate or invest Rapid price increases Abandonment of downside caution Rush of money toward concepts with no underlying assets or revenues
Are We Repeating Tech-Bubble Situation In Private Equity?
Distributions To LPs from U.S. Buyout Market Remain High Source:  Thompson Venture Economics, data for partnerships and investment bank affiliate or subsidiary partnerships; includes primary U.S. market buyout funds; 2006E is annualized estimate, data as of 9/30/06
U.S. Buyout Has Outperformed Public Markets Source:  Thomson Venture Economics, PE data as of 9/30/06 and for partnerships and investment bank affiliate or subsidiary partnerships; Bloomberg, market data as of 6/30/06 35.7 27.2 41.5 23.2 24.8 20.0 U.S. Buyout Top Quartile 8.3 10.5 8.7 5.0 9.9 9.4 7.1 5.7 8.0 DJIA 9.2 8.6 6.9 5.1 10.3 S&P 500 9.1 8.8 7.0 6.2 11.0 Russell 3000 10.2 9.8 6.3 8.1 8.5 NASDAQ 21.0 11.0 12.7 8.7 14.5 8.8 U.S. Buyout All Quartile 1-year 15-year 20-year 10-year 3-year 5-year (IRR %) 37.2 U.S. $2 bil plus Top Quartile
Europe Buyout Has Outperformed Public Markets Source:  Thomson Venture Economics, PE data as of 6/30/06 and for partnerships and investment bank affiliate or subsidiary partnerships; Bloomberg, market data as of 6/30/06 37.3 23.6 26.8 28.7 22.5 14.7 Europe Buyout Top Quartile 14.1 6.1 6.5 4.6 13.1 0.7 FTSE 22.2 12.5 13.2 13.7 10.9 7.0 Europe Buyout All Quartile 1-year 15-year 20-year 10-year 3-year 5-year (IRR %)
Reasons For Concern: More Money Than Ever Going Into U.S. Buyout Market 200 6  vs. 1996 Fundraising:  4.1x Investment:  1.7 x Source:  Thompson Venture Economics, data for partnerships and investment bank affiliate or subsidiary partnerships; includes U.S. buyout firms
Reasons For Concern: More Money Than Ever Going Into Europe Buyout Market Source: EVCA; 2006E is annualized estimate 2006E vs. 1996 Fundraising:  9.6x Investment:  8.7x
Asia (including Japan and Australia) trends: Reasons For Concern: More Money Than Ever Going Into Asia Private Equity Market Source: Asia Private Equity Review
Latin America private equity activity remains below 1998 highs, but has increased: 2006 fundraising  150% above 2005 level 2006 investment  275% above 2005 level Reasons For Concern: More Money Going Into Latin America Private Equity Market Source: Venture Equity Latin America; includes real estate funds
Reasons For Concern: Investors Increasing Already Large Allocations Source: Dow Jones – Private Equity Analyst, data as of July 2006 15% 7,500 50,000 Michigan Department of Treasury 10% 10,000 100,000 GIC Special Investments 10% 7,924 79,241 Ontario Teachers’ Pension Plan Board 10% 8,089 80,891 Canada Pension Plan Investment Board 5% 10,457 209,143 ABP Investments 7,920 10,000 10,400 10,835 11,520 $12,426 Allocation 132,000 56,000 130,000 69,900 128,000 $207,100 Total Assets 6% 15% 8% 16% 9% 6% % To PE Florida State Board of Administration Washington State Investment Board New York State Common Retirement Fund California Public Employees’ Retirement System California State Teachers’ Retirement System Oregon State Treasury ($ mil) Institution
Reasons For Concern: Funds Bigger In U.S. (1)  Estimated target fund size. Source: Firm press releases; Citigroup Estimates; Capital IQ; PEI Average % increase: 130% Blackstone V KKR Millennium II Apollo VI Bain Capital IX TH Lee VI (1) (1) TPG V Warburg IX (1) Carlyle V
Reasons For Concern: Funds Bigger In Europe Permira IV Fourth Cinven 3i Europe Partners V BC European Capital VIII CVC IV Apax Europe VI Source: Firm press releases; Capital IQ; PEI Average % increase: 38% Most recent fund size vs. predecessor fund size: Doughty Hanson V
Reasons For Concern: Funds Bigger In Asia Source: Capital IQ Average % increase: 141% CVC Asia Pacific II Carlyle Asia Partners  II CCMP Capital Asia  II Newbridge Asia  IV Carlyle Japan Partners II
Reasons For Concern: Deals Bigger – Size Not A Barrier in U.S. Source: Dealogic, data for Sponsor-entry transactions with U.S. targets and as of December 31, 2006 Number of $1+, $3+, $5+, and $10+ billion sponsor-involved U.S. deals increasing:
Reasons For Concern: Deals Bigger – Size Not A Barrier in Europe Source: Dealogic, data for Sponsor entry transactions and as of December 31, 2006 Number of €1+, €3+, €5+, and €10+ billion sponsor-involved Europe deals increasing:
Reasons For Concern: Deals Bigger – Size Not A Barrier in Asia (incl. Japan) Source: Dealogic, data for Sponsor-entry transactions with Asia (incl. Japan) targets and as of December 31, 2006 Number of $250+, $500+, $750+, and $1,000+ million sponsor-involved Asia deals increasing:
Reasons For Concern: Deals Bigger – Size Not A Barrier in Latin America Source: Dealogic, data for Sponsor-entry transactions with Latin America targets and as of December 31, 2006 Number of $100+, $200+, $300+, and $500+ million sponsor-involved Latin America deals increasing:
Reasons For Concern: 2005-2007YTD: 9 of 10 Biggest U.S. Buyouts Source:  Dealogic; FT; WSJ;  2006-2007YTD ‡‡ Estimated, deal not closed ‡‡ ‡‡ ‡‡ ‡‡ ‡‡ KKR/TPG/GS United States TXU $45.0 2007 Bain/Lee United States Clear Channel 25.7 2006 Apollo/TPG United States Harrah’s 25.7 2006 Blackstone United States EOP 36.0 2006 Carlyle/Merrill/CDR SuperValu/CVS/Cerberus Blackstone/Carlyle/Permira/TPG Carlyle/GS/AIG KKR KKR/Bain/ML Acquirer United States United States United States United States United States United States Location Freescale 17.6 2006 HCA 32.7 2006 Albertson’s 17.4 2006 Kinder Morgan 21.6 2006 Hertz 15.0 2005 RJR Nabisco 31.4 1988 Target Value Date ($ bil)
Reasons For Concern: 2005-2006: 7 of 10 Biggest Buyouts in Europe  Source:  Dealogic;  2005-2006 ‡‡ Estimated, deal not closed ‡‡ ‡‡ Renova Group Russia SUAL Holding 5.2 2006 Permira/Saban Germany ProSiebenSat 7.7 2006 3i/Colonial First State UK AWG 7.9 2006 Weather Invest. Italy Wind Telecom. 12.1 2005 KKR/Wendel France Legrand 5.0 2002 KKR/Silverlake/Apax/Bain/ Alpinvest Netherlands Philips Semiconductor 7.4 2006 Apax/Blackstone/KKR/Permira/ Providence Denmark TDC € 12.8 2006 Value (€ bil) AlpInvest/Blackstone/ Carlyle/Hellman/KKR/Lee Netherlands VNU 9.2 2006 BC/CVC/Permira Italy Seat Pagine Gaille 5.7 2003 UK Location 5.6 Madison Dearborn Acquirer Jefferson Smurfit sub. 2002 Target Date
Reasons For Concern: 2005-2006: 6 of 10 Biggest Asia (ex Japan, Australia) Buyouts Source:  Dealogic;  2005-2006 ‡‡ Estimated, deal not closed Ripplewood Korea Daewoo Electronics 721 2006 Onex Singapore Omni Industries 799 2001 CVC/Fransisco/Court Square Warburg Pincus KKR MBK Partners Gilbert Global Equity Colony Lone Star GS Acquirer Korea India India Taiwan Korea Singapore Korea China Location Hynix Semicon. 822 2004 Anam Semicon. 950 1999 ICBC $2,582 2006 HDFC Securities 874 2000 China Network Sys. 932 2006 Raffles 1,019 2005 Flextronics Software 900 2006 KEB 1,194 2006 Target Value Date ($ mil)
Reasons For Concern: 2005-2006: 6 of 10 Biggest Japan Buyouts Source:  Dealogic; AVCJ; APER;  2005-2006 ‡‡ Estimated, deal not closed Cerberus/Nikko Japan Seibu Railway Co. 1,390 2005 Harbor Holdings Japan World Co. 1,900 2005 Colony Capital Ripplewood/ABN/ Bank of Nova Scotia/Citi GS/Mori Trust Unison Capital Carlyle/Kyocera GS/Newbridge/Ripplewood/TVG/PPM GS/Daiwa/Sumitomo Mitsui CVC/Nomura Acquirer Japan Japan Japan Japan Japan Japan Japan Japan Location LTCB/Shinsei Bank 1,149 1999 Fukuoka Hawks Town (from Daiei) 915 2003 DDI Pocket/Willcom 2,023 2004 Skylark $3,155 2006 Recruit Cosmos 1,516 2005 Japan Telecom 2,210 2003 Fujita Corp. 1,349 2005 Sanyo Electric 2,585 2005 Target Value Date ($ mil)
Reasons For Concern: 2005-2006: 7 of 10 Biggest Latin America Buyouts Source:  Dealogic;  2005-2006 Advent Uruguay Banco Comercial 167 2005 Advent Argentina OCA 280 2004 GP Investimentos Brazil CEMAR 350 2003 Newbridge/Advent/Capital Heartland Industrial Oaktree/Onex Southern Cross AIG Blackstone/Soros/AIG Advent Acquiror Mexico Brazil Mexico Chile Brazil Mexico Brazil Location Controladora Milano 200 2006 ESSBIO 405 2006 Brasif Duty Free Shop $500 2006 Grupo Cinemex 285 2002 Grupo Providencia 466 2006 COTEMINAS 200 2005 Avantel 500 2006 Target Value Date ($ mil)
Reasons For Concern: Credit Statistics Tighter in U.S. / Convenants More Favorable Source: Standard & Poor’s LCD; excludes Media and Telecom loans; data as of 4Q06 30% 52% (34%) (36%)
Reasons For Concern: Credit Statistics Tighter in Europe / Covenants More Favorable Source: Standard & Poor’s LCD; data as of 4Q06 29% 26% (13%) (15%)
Reasons For Concern: Strong Debt Markets Fueling Buyouts in U.S. Leverage  for buyouts  remains   near  7 year high Source: Standard & Poor’s LCD; data for U.S., as of 4Q06
Reasons For Concern:  Strong Debt Markets Fueling Buyouts in Europe Leverage  for buyouts   at  7 year high Source: Standard & Poor’s LCD; data for Europe, as of 4Q06
Reasons For Concern: EBITDA Multiples Rising in U.S. Acquisition multiples at a decade high levels Source: Standard and Poor’s M&A Statistics, July 200 6 ; LBOs>$500 million, includes fees/expenses
Reasons For Concern: EBITDA Multiples Rising in Europe Source: Standard and Poor’s M&A Statistics, July 2006; LBOs > €500 million, data for Europe, includes fees/expenses Acquisition multiples at a decade high levels
Reasons For Concern: Defaults Low Source: Bloomberg, Altman – data as of 9/30/06 High yield default rate:
Reasons For Concern: Individuals Getting In High net worths are coming into the market Feeder funds UBS Deutsche Bank Credit Suisse Citi JP Morgan
Public vehicles Are Being Raised And Are Providing Cash Source:  Dealogic, data as of February 2007, includes global IPOs for hedge and private equity firms In 2006-2007YTD, global  hedge and private equity  vehicle IPOs raised nearly 5x as much money as during the previous ten years: # of IPOs: 1 5 5 3 1 0 3 1 1 1 15
Similarities With Bubbles More money than ever in deals and funds  Higher allocations by investors to asset class More public attention than ever More small investors than ever Higher prices than recent past More public distributions of high, quick profit More master of universe publicity than ever More globalization of the phenomenon Few stories of failures – fear factor gone Even rock stars getting into the business
Reasons For Concern: Inevitably There Will Be A Downturn Downturn will occur because of Business cycle – slowing of economic growth Stock market crash / decline One or more visible buyouts will fail Cataclysmic event Federal reserve will tighten credit Legislative or regulatory constraints In the downturn Deals will fail Money will be lost Returns will decline Investor interest will diminish Lending will get tougher
Is This A Bubble Bursting Like Tech Bubble? Not same Recognition that this is unusual time – not going on forever Better equitized:  Average LBO: 34% equity in 2006 vs. 7% in 1987 (1) GP’s have been through down cycles Worse case scenarios are constant point of review Companies have revenues and earnings Not too much money – for example, U.S. buyout industry capital under management represents only 3.2% of U.S. public market capitalization Debt covenants make default less likely – able to work through weak economic times (1)   Standard and Poors LCD, data for U.S.
Is This A Bubble Bursting Like Tech Bubble? Companies can operate in private – able to fix problems without constant public scrutiny Array of potential exits Financial buyers Private equity firms Hedge funds Strategic buyers IPO’s Organizations are able to better monitor, oversee, and deal with problems Better managers can be recruited Fund sizes large enough to provide additional capital
Is This A Bubble Bursting Like Tech Bubble? Funds are better diversified Greater recognition that cycles end – greater ability / willingness to wait for rebound Not a one company – boom – retire forever mentality Still, need to be concerned about a creeping “this time is different” mentality – most dangerous words in investment world But money could be lost – returns will decline Impact can be ameliorated by: Better educating public about what private equity Better preparing investors for lower returns / delayed exits Standing behind transactions to ensure healthy revivals and rebounds
Is This A Bubble Bursting Like Tech Bubble? Better preparing for public / investor scrutiny / criticism Being more open with public about problems, needed changes, likely outcomes Contrast / compare with companies not involved with private equity Recognition that best private equity investments occur in economic downturns
Summary We are not in a bubble similar to tech bubble of 2000 But decline will occur – losses will be incurred – cannot continue like this forever Industry / investments better able to sustain losses, downturns But industry must recognize that: Any losses will be seized upon by opponents of private equity All investors will not be understanding Upward cycle may not occur overnight Industry will face increased public / government scrutiny
Summary Therefore: Industry needs to prepare itself for decline Industry needs to prepare investors Industry needs to have more open face to the public Industry needs to explain how it works, can fix problems Industry should act like a public industry – for that is what it has become – change equity – public setting & public responsibilities
The Similarities & Differences Between The Tech Bubble Burst of 2000 & The Current Private Equity Markets: Are We On The Verge Of A PE Bubble Burst? David M. Rubenstein Co-Founder and Managing Director   February 28, 2007

Rubenstein SuperReturn Presentation

  • 1.
    The Similarities &Differences Between The Tech Bubble Burst of 2000 & The Current Private Equity Markets: Are We On The Verge Of A PE Bubble Burst? David M. Rubenstein Co-Founder and Managing Director February 28, 2007
  • 2.
    Bubble No onedefinition – “Know it when I see it” Greater Fool Theory: “…speculation is justified because there are enough fools to push prices further upward” – Barron’s “… whole communities suddenly fix their minds upon one object, and go mad in its pursuit….” – Charles Mackay, Extraordinary Popular Delusions And The Madness Of Crowds, 1841 Source: Barron’s Dictionary of Finance and Investment Terms; Charles Mackay, Extraordinary Popular Delusions And The Madness Of Crowds, 1841 and preface, 1852
  • 3.
    Famous Bubbles 1634- 1638 “Tulipmania” (Netherlands) Price for some single bulbs exceeded 10x average annual income Crash of 93% of value 1710’s South Sea Company (England) Promised 50%+ returns Crash of 84% 1710’s Mississippi Scheme (France) Promised 120% annual returns Crash of 99% Source: PBS; Charles Mackay, Extraordinary Popular Delusions And The Madness Of Crowds, 1841; Various
  • 4.
    Famous Bubbles 1920Ponzi’s Securities & Exchange Company Promised 100% returns on 90 day notes 100% loss 1929 U.S. Stock Market Dow up 250% in 2 years Crash of 87% 1979 – 1982 Silver Market Rose 700% in 3 years Crash of 88% 1978 – 1986 Kuwaiti Stock Market Rose 7,000% in eight years Crash of 98% Source: Various
  • 5.
    Famous Bubbles 1987Dow Jones Industrial Average Dow up 200% in 5 years (real GDP up 20%) October 19 collapse of 508 points (22.6%) 1998 Russian Ruble Ruble went from 6 to 20 per dollar in a 2 week period 1999 Tech Bubble $7 trillion loss of value Source: Various
  • 6.
    Bubbles Share CertainCharacteristics Everyone expects increase; no downside caution No economic justification or historic standard for increase Bad news filtered out of popular thinking Everyone wants to invest in whatever it is or get in on the activity Stories of instant or fast wealth creation circulate The words “once-in-a-lifetime opportunity” appear frequently Anyone staying on the sidelines is seen as a fool Smaller investors get involved Some or many very smart / savvy investors stay or get involved Sir Isaac Newton
  • 7.
    Bubbles Share CertainCharacteristics Capital flows to investments with no underlying assets / value Discipline evaporates from the investment process Prices increase far beyond historical norms or reasonably estimable economic value People invest more than they can afford to lose
  • 8.
    Certain Lessons CanBe Gleaned From Historical Bubbles If something seems to good to be true, it is not true Upward trends always end, and the rate of decline exceeds the previous rate of increase When fear is nowhere, it will soon be everywhere Investors need diversification – no exceptions Investors rarely gain great wealth New big ideas produce “bubble amnesia” – investors ignore these lessons
  • 9.
    Tech Bubble HadNumerous Symptoms (In Retrospect) Ease of raising large amounts of capital for untested business models Investors committed almost 3x as much money to venture in the 4-years-ended 2000 than they had in the previous three decades Global venture fundraising: Source: Thomson Venture Economics, data as of December 31, 2006 – includes partnerships and investment bank affiliated or subsidiary partnerships
  • 10.
    Tech Bubble HadNumerous Symptoms (In Retrospect) Global number of $1 bil+ venture funds raised in the 4-years-ended 2000 exceeded 4x the number raised in the previous three decades: Source: Thomson Venture Economics, data as of December 31, 2006
  • 11.
    Tech Bubble HadNumerous Symptoms (In Retrospect) Venture capital investors poured $440 million into Webvan, an internet grocery deliver service 15x as much as Kleiner Perkins raised for its first fund The company went public with $400,000 in revenue and reached a market cap of $1.2 billion Two years later the stock had fallen from 34 dollars to 6 cents Bankrupt two years later
  • 12.
    Tech Bubble HadNumerous Symptoms (In Retrospect) Priceline Following 1999 IPO, market cap peaked at $14 billion – more than the combined market cap of Continental, Delta, Northwest, and United – which totaled $12 billion at the time Current (2007) market cap ~ $2 billion eToys Revenue was $250 million or 1/44 th of Toys “R” Us’s revenue of $11 billion Market value was 3x greater than Toys “R” Us Went bankrupt
  • 13.
    Tech Bubble HadNumerous Symptoms (In Retrospect) Internet Capital Group L argest IPO of 1999 Held investments in 47 e-commerce startups Valuations were 120x earnings Reached market cap $46 billion within 4 months – more than General Motors Current (2007) market cap: $487 million Detachment of prices from underlying revenue / economic significance VA Linux Sells computers running Linux operating system Closed up 698% on the first day of trading At one point, trading up 10x IPO price Current (2007) market cap 1/8 of peak
  • 14.
    Tech Bubble HadNumerous Symptoms (In Retrospect) Corvis Developer of long haul optical communications equipment Zero trailing revenue at IPO Raised $1.1 billion in IPO proceeds at a $12 billion valuation in August 2000 Acquired in 2006 for $1.4 billion Ariba E-commerce software firm IPO in June 1999 with $1 billion valuation Peak valuation of $42 billion in September 2000 (higher than Boeing, GM or Ford) Current (2007) market cap $759 million 98% decline from peak valuation
  • 15.
    Tech Bubble HadNumerous Symptoms (In Retrospect) Kozmo.com Internet delivery service with no service charge Spent $280 million to build service Bankrupt Globe.com Designed by two 23 year olds to sell ads on its website Stock went from $9 / share to $97 / share One of the largest first-day gains of any IPO No longer in business [email_address] $35 billion of market cap at peak Bankrupt
  • 16.
    Tech Bubble HadNumerous Symptoms (In Retrospect) Cisco Peak market cap reached $555 billion – highest in the world Price / earnings multiple reached 160x in March 2000 Lost $400 billion of market cap
  • 17.
    Source: ForbesTech Bubble Had Numerous Symptoms (In Retrospect) 378% 386% 427% 442% 458% 482% 483% 508% 525% 698% First-Day Return 120 Network Equipment CacheFlow 1999 144 Internet Software webMethods 2000 173 Internet Retailing FreeMarkets 1999 110 Network Equipment Cobalt Networks 1999 234 Internet Services Akamai Technologies 1999 28 Internet Services theglobe.com 1998 284 Network Equipment Sycamore Networks 1999 216 Telecom Products Avanex 2000 125 $132 Offer Value Telecom Products Computer Software Business Foundry Networks 1999 VA Linux Systems 1999 Company Year ($ mil)
  • 18.
    Source: ForbesTech Bubble Had Numerous Symptoms (In Retrospect) 330% 13 Consulting Services Intgrtd. Sys. Consultg. 1996 357% 155 Telecom Products Finisar 1999 356% 110 Internet Services FirePond 2000 337% 68 Network Equipment Crossroads Systems 1999 331% 160 Internet Services Priceline.com 1999 331% 72 Internet Services Andover.Net 1999 313% 60 Telecom Services Wireless Facilities 1999 303% 91 Internet Services Neoforma.com 2000 42 $120 Offer Value Internet Services Internet Services Business 364% Ask Jeeves 1999 371% Selectical 2000 First-Day Return Company Year ($ mil)
  • 19.
    Source: Renaissance Capital;IPO Monitor Number of IPOs with first-day return of 50 % +, 100%+, 200%+, 300%+, 400%+ : Tech Bubble Had Numerous Symptoms (In Retrospect)
  • 20.
    Source: World Federationof Exchanges Tech Bubble Burst Destroyed Staggering Amount Of Value Combined: (42%) Combined domestic market capitalization of NYSE and NASDAQ declined $7.3 trillion NASDAQ: (73%) NYSE: (24%)
  • 21.
    Tech Bubble BurstDestroyed Staggering Amount Of Value Europe Neue Market established in 1997 Market value multiplied by 17x by March 2000 Market closed at 4% of peak
  • 22.
    Tech Bubble CommonalityWith Classic Bubbles New big idea (with some validity) captured popular imagination In this case - transformative power of technology / computers / the internet Everyone wanted to participate or invest Rapid price increases Abandonment of downside caution Rush of money toward concepts with no underlying assets or revenues
  • 23.
    Are We RepeatingTech-Bubble Situation In Private Equity?
  • 24.
    Distributions To LPsfrom U.S. Buyout Market Remain High Source: Thompson Venture Economics, data for partnerships and investment bank affiliate or subsidiary partnerships; includes primary U.S. market buyout funds; 2006E is annualized estimate, data as of 9/30/06
  • 25.
    U.S. Buyout HasOutperformed Public Markets Source: Thomson Venture Economics, PE data as of 9/30/06 and for partnerships and investment bank affiliate or subsidiary partnerships; Bloomberg, market data as of 6/30/06 35.7 27.2 41.5 23.2 24.8 20.0 U.S. Buyout Top Quartile 8.3 10.5 8.7 5.0 9.9 9.4 7.1 5.7 8.0 DJIA 9.2 8.6 6.9 5.1 10.3 S&P 500 9.1 8.8 7.0 6.2 11.0 Russell 3000 10.2 9.8 6.3 8.1 8.5 NASDAQ 21.0 11.0 12.7 8.7 14.5 8.8 U.S. Buyout All Quartile 1-year 15-year 20-year 10-year 3-year 5-year (IRR %) 37.2 U.S. $2 bil plus Top Quartile
  • 26.
    Europe Buyout HasOutperformed Public Markets Source: Thomson Venture Economics, PE data as of 6/30/06 and for partnerships and investment bank affiliate or subsidiary partnerships; Bloomberg, market data as of 6/30/06 37.3 23.6 26.8 28.7 22.5 14.7 Europe Buyout Top Quartile 14.1 6.1 6.5 4.6 13.1 0.7 FTSE 22.2 12.5 13.2 13.7 10.9 7.0 Europe Buyout All Quartile 1-year 15-year 20-year 10-year 3-year 5-year (IRR %)
  • 27.
    Reasons For Concern:More Money Than Ever Going Into U.S. Buyout Market 200 6 vs. 1996 Fundraising: 4.1x Investment: 1.7 x Source: Thompson Venture Economics, data for partnerships and investment bank affiliate or subsidiary partnerships; includes U.S. buyout firms
  • 28.
    Reasons For Concern:More Money Than Ever Going Into Europe Buyout Market Source: EVCA; 2006E is annualized estimate 2006E vs. 1996 Fundraising: 9.6x Investment: 8.7x
  • 29.
    Asia (including Japanand Australia) trends: Reasons For Concern: More Money Than Ever Going Into Asia Private Equity Market Source: Asia Private Equity Review
  • 30.
    Latin America privateequity activity remains below 1998 highs, but has increased: 2006 fundraising 150% above 2005 level 2006 investment 275% above 2005 level Reasons For Concern: More Money Going Into Latin America Private Equity Market Source: Venture Equity Latin America; includes real estate funds
  • 31.
    Reasons For Concern:Investors Increasing Already Large Allocations Source: Dow Jones – Private Equity Analyst, data as of July 2006 15% 7,500 50,000 Michigan Department of Treasury 10% 10,000 100,000 GIC Special Investments 10% 7,924 79,241 Ontario Teachers’ Pension Plan Board 10% 8,089 80,891 Canada Pension Plan Investment Board 5% 10,457 209,143 ABP Investments 7,920 10,000 10,400 10,835 11,520 $12,426 Allocation 132,000 56,000 130,000 69,900 128,000 $207,100 Total Assets 6% 15% 8% 16% 9% 6% % To PE Florida State Board of Administration Washington State Investment Board New York State Common Retirement Fund California Public Employees’ Retirement System California State Teachers’ Retirement System Oregon State Treasury ($ mil) Institution
  • 32.
    Reasons For Concern:Funds Bigger In U.S. (1) Estimated target fund size. Source: Firm press releases; Citigroup Estimates; Capital IQ; PEI Average % increase: 130% Blackstone V KKR Millennium II Apollo VI Bain Capital IX TH Lee VI (1) (1) TPG V Warburg IX (1) Carlyle V
  • 33.
    Reasons For Concern:Funds Bigger In Europe Permira IV Fourth Cinven 3i Europe Partners V BC European Capital VIII CVC IV Apax Europe VI Source: Firm press releases; Capital IQ; PEI Average % increase: 38% Most recent fund size vs. predecessor fund size: Doughty Hanson V
  • 34.
    Reasons For Concern:Funds Bigger In Asia Source: Capital IQ Average % increase: 141% CVC Asia Pacific II Carlyle Asia Partners II CCMP Capital Asia II Newbridge Asia IV Carlyle Japan Partners II
  • 35.
    Reasons For Concern:Deals Bigger – Size Not A Barrier in U.S. Source: Dealogic, data for Sponsor-entry transactions with U.S. targets and as of December 31, 2006 Number of $1+, $3+, $5+, and $10+ billion sponsor-involved U.S. deals increasing:
  • 36.
    Reasons For Concern:Deals Bigger – Size Not A Barrier in Europe Source: Dealogic, data for Sponsor entry transactions and as of December 31, 2006 Number of €1+, €3+, €5+, and €10+ billion sponsor-involved Europe deals increasing:
  • 37.
    Reasons For Concern:Deals Bigger – Size Not A Barrier in Asia (incl. Japan) Source: Dealogic, data for Sponsor-entry transactions with Asia (incl. Japan) targets and as of December 31, 2006 Number of $250+, $500+, $750+, and $1,000+ million sponsor-involved Asia deals increasing:
  • 38.
    Reasons For Concern:Deals Bigger – Size Not A Barrier in Latin America Source: Dealogic, data for Sponsor-entry transactions with Latin America targets and as of December 31, 2006 Number of $100+, $200+, $300+, and $500+ million sponsor-involved Latin America deals increasing:
  • 39.
    Reasons For Concern:2005-2007YTD: 9 of 10 Biggest U.S. Buyouts Source: Dealogic; FT; WSJ; 2006-2007YTD ‡‡ Estimated, deal not closed ‡‡ ‡‡ ‡‡ ‡‡ ‡‡ KKR/TPG/GS United States TXU $45.0 2007 Bain/Lee United States Clear Channel 25.7 2006 Apollo/TPG United States Harrah’s 25.7 2006 Blackstone United States EOP 36.0 2006 Carlyle/Merrill/CDR SuperValu/CVS/Cerberus Blackstone/Carlyle/Permira/TPG Carlyle/GS/AIG KKR KKR/Bain/ML Acquirer United States United States United States United States United States United States Location Freescale 17.6 2006 HCA 32.7 2006 Albertson’s 17.4 2006 Kinder Morgan 21.6 2006 Hertz 15.0 2005 RJR Nabisco 31.4 1988 Target Value Date ($ bil)
  • 40.
    Reasons For Concern:2005-2006: 7 of 10 Biggest Buyouts in Europe Source: Dealogic; 2005-2006 ‡‡ Estimated, deal not closed ‡‡ ‡‡ Renova Group Russia SUAL Holding 5.2 2006 Permira/Saban Germany ProSiebenSat 7.7 2006 3i/Colonial First State UK AWG 7.9 2006 Weather Invest. Italy Wind Telecom. 12.1 2005 KKR/Wendel France Legrand 5.0 2002 KKR/Silverlake/Apax/Bain/ Alpinvest Netherlands Philips Semiconductor 7.4 2006 Apax/Blackstone/KKR/Permira/ Providence Denmark TDC € 12.8 2006 Value (€ bil) AlpInvest/Blackstone/ Carlyle/Hellman/KKR/Lee Netherlands VNU 9.2 2006 BC/CVC/Permira Italy Seat Pagine Gaille 5.7 2003 UK Location 5.6 Madison Dearborn Acquirer Jefferson Smurfit sub. 2002 Target Date
  • 41.
    Reasons For Concern:2005-2006: 6 of 10 Biggest Asia (ex Japan, Australia) Buyouts Source: Dealogic; 2005-2006 ‡‡ Estimated, deal not closed Ripplewood Korea Daewoo Electronics 721 2006 Onex Singapore Omni Industries 799 2001 CVC/Fransisco/Court Square Warburg Pincus KKR MBK Partners Gilbert Global Equity Colony Lone Star GS Acquirer Korea India India Taiwan Korea Singapore Korea China Location Hynix Semicon. 822 2004 Anam Semicon. 950 1999 ICBC $2,582 2006 HDFC Securities 874 2000 China Network Sys. 932 2006 Raffles 1,019 2005 Flextronics Software 900 2006 KEB 1,194 2006 Target Value Date ($ mil)
  • 42.
    Reasons For Concern:2005-2006: 6 of 10 Biggest Japan Buyouts Source: Dealogic; AVCJ; APER; 2005-2006 ‡‡ Estimated, deal not closed Cerberus/Nikko Japan Seibu Railway Co. 1,390 2005 Harbor Holdings Japan World Co. 1,900 2005 Colony Capital Ripplewood/ABN/ Bank of Nova Scotia/Citi GS/Mori Trust Unison Capital Carlyle/Kyocera GS/Newbridge/Ripplewood/TVG/PPM GS/Daiwa/Sumitomo Mitsui CVC/Nomura Acquirer Japan Japan Japan Japan Japan Japan Japan Japan Location LTCB/Shinsei Bank 1,149 1999 Fukuoka Hawks Town (from Daiei) 915 2003 DDI Pocket/Willcom 2,023 2004 Skylark $3,155 2006 Recruit Cosmos 1,516 2005 Japan Telecom 2,210 2003 Fujita Corp. 1,349 2005 Sanyo Electric 2,585 2005 Target Value Date ($ mil)
  • 43.
    Reasons For Concern:2005-2006: 7 of 10 Biggest Latin America Buyouts Source: Dealogic; 2005-2006 Advent Uruguay Banco Comercial 167 2005 Advent Argentina OCA 280 2004 GP Investimentos Brazil CEMAR 350 2003 Newbridge/Advent/Capital Heartland Industrial Oaktree/Onex Southern Cross AIG Blackstone/Soros/AIG Advent Acquiror Mexico Brazil Mexico Chile Brazil Mexico Brazil Location Controladora Milano 200 2006 ESSBIO 405 2006 Brasif Duty Free Shop $500 2006 Grupo Cinemex 285 2002 Grupo Providencia 466 2006 COTEMINAS 200 2005 Avantel 500 2006 Target Value Date ($ mil)
  • 44.
    Reasons For Concern:Credit Statistics Tighter in U.S. / Convenants More Favorable Source: Standard & Poor’s LCD; excludes Media and Telecom loans; data as of 4Q06 30% 52% (34%) (36%)
  • 45.
    Reasons For Concern:Credit Statistics Tighter in Europe / Covenants More Favorable Source: Standard & Poor’s LCD; data as of 4Q06 29% 26% (13%) (15%)
  • 46.
    Reasons For Concern:Strong Debt Markets Fueling Buyouts in U.S. Leverage for buyouts remains near 7 year high Source: Standard & Poor’s LCD; data for U.S., as of 4Q06
  • 47.
    Reasons For Concern: Strong Debt Markets Fueling Buyouts in Europe Leverage for buyouts at 7 year high Source: Standard & Poor’s LCD; data for Europe, as of 4Q06
  • 48.
    Reasons For Concern:EBITDA Multiples Rising in U.S. Acquisition multiples at a decade high levels Source: Standard and Poor’s M&A Statistics, July 200 6 ; LBOs>$500 million, includes fees/expenses
  • 49.
    Reasons For Concern:EBITDA Multiples Rising in Europe Source: Standard and Poor’s M&A Statistics, July 2006; LBOs > €500 million, data for Europe, includes fees/expenses Acquisition multiples at a decade high levels
  • 50.
    Reasons For Concern:Defaults Low Source: Bloomberg, Altman – data as of 9/30/06 High yield default rate:
  • 51.
    Reasons For Concern:Individuals Getting In High net worths are coming into the market Feeder funds UBS Deutsche Bank Credit Suisse Citi JP Morgan
  • 52.
    Public vehicles AreBeing Raised And Are Providing Cash Source: Dealogic, data as of February 2007, includes global IPOs for hedge and private equity firms In 2006-2007YTD, global hedge and private equity vehicle IPOs raised nearly 5x as much money as during the previous ten years: # of IPOs: 1 5 5 3 1 0 3 1 1 1 15
  • 53.
    Similarities With BubblesMore money than ever in deals and funds Higher allocations by investors to asset class More public attention than ever More small investors than ever Higher prices than recent past More public distributions of high, quick profit More master of universe publicity than ever More globalization of the phenomenon Few stories of failures – fear factor gone Even rock stars getting into the business
  • 54.
    Reasons For Concern:Inevitably There Will Be A Downturn Downturn will occur because of Business cycle – slowing of economic growth Stock market crash / decline One or more visible buyouts will fail Cataclysmic event Federal reserve will tighten credit Legislative or regulatory constraints In the downturn Deals will fail Money will be lost Returns will decline Investor interest will diminish Lending will get tougher
  • 55.
    Is This ABubble Bursting Like Tech Bubble? Not same Recognition that this is unusual time – not going on forever Better equitized: Average LBO: 34% equity in 2006 vs. 7% in 1987 (1) GP’s have been through down cycles Worse case scenarios are constant point of review Companies have revenues and earnings Not too much money – for example, U.S. buyout industry capital under management represents only 3.2% of U.S. public market capitalization Debt covenants make default less likely – able to work through weak economic times (1) Standard and Poors LCD, data for U.S.
  • 56.
    Is This ABubble Bursting Like Tech Bubble? Companies can operate in private – able to fix problems without constant public scrutiny Array of potential exits Financial buyers Private equity firms Hedge funds Strategic buyers IPO’s Organizations are able to better monitor, oversee, and deal with problems Better managers can be recruited Fund sizes large enough to provide additional capital
  • 57.
    Is This ABubble Bursting Like Tech Bubble? Funds are better diversified Greater recognition that cycles end – greater ability / willingness to wait for rebound Not a one company – boom – retire forever mentality Still, need to be concerned about a creeping “this time is different” mentality – most dangerous words in investment world But money could be lost – returns will decline Impact can be ameliorated by: Better educating public about what private equity Better preparing investors for lower returns / delayed exits Standing behind transactions to ensure healthy revivals and rebounds
  • 58.
    Is This ABubble Bursting Like Tech Bubble? Better preparing for public / investor scrutiny / criticism Being more open with public about problems, needed changes, likely outcomes Contrast / compare with companies not involved with private equity Recognition that best private equity investments occur in economic downturns
  • 59.
    Summary We arenot in a bubble similar to tech bubble of 2000 But decline will occur – losses will be incurred – cannot continue like this forever Industry / investments better able to sustain losses, downturns But industry must recognize that: Any losses will be seized upon by opponents of private equity All investors will not be understanding Upward cycle may not occur overnight Industry will face increased public / government scrutiny
  • 60.
    Summary Therefore: Industryneeds to prepare itself for decline Industry needs to prepare investors Industry needs to have more open face to the public Industry needs to explain how it works, can fix problems Industry should act like a public industry – for that is what it has become – change equity – public setting & public responsibilities
  • 61.
    The Similarities &Differences Between The Tech Bubble Burst of 2000 & The Current Private Equity Markets: Are We On The Verge Of A PE Bubble Burst? David M. Rubenstein Co-Founder and Managing Director February 28, 2007