Download as PDF, PPTX
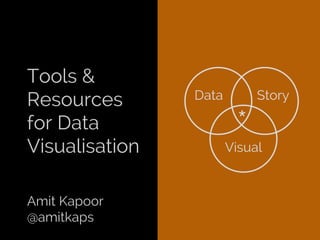

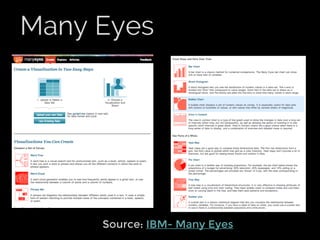
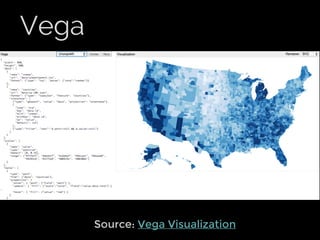
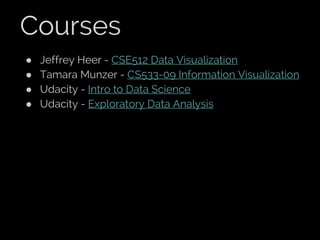
![Processing - Pie Chart
size(400, 400);
background(255);
smooth();
noStroke();
int diameter = 200;
float[] data = {5, 25, 15, 20, 10};
int[] sat = {25, 75, 125, 175, 225};
float lastAngle = 0, sum = 0;
for (int i = 0; i < data.length; i++)
sum += data[i];
for (int i = 0; i < data.length; i++) {
fill(sat[i]);
float angle = data[i] / sum * 2 * PI;
arc(width / 2, height / 2, diameter,
diameter,
lastAngle, lastAngle + angle);
lastAngle += angle;
}
Source: Processing](https://image.slidesharecdn.com/toolsresourcesfordatavisualisation-150208230909-conversion-gate01/85/Tools-Resources-for-Data-Visualisation-5-320.jpg)


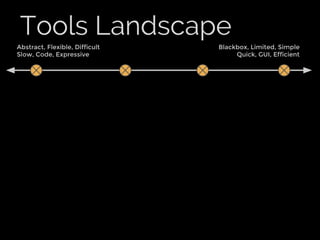
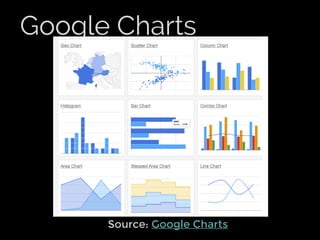
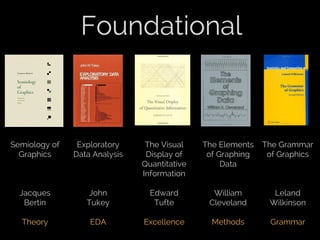
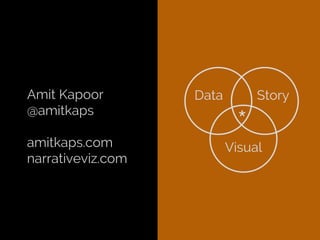
![Google Charts - Pie
Source: Google Charts Playground
function drawVisualization() {
// Create and populate the data table.
var data = google.visualization.
arrayToDataTable([
['Areas', 'Sales'],
['North', 5],
['East', 25],
['West', 15],
['South', 20],
['Central', 10]
]);
// Create and draw the visualization.
new google.visualization.PieChart
(document.getElementById
('visualization')).
draw(data, {title:"Sales by
Area"});
}](https://image.slidesharecdn.com/toolsresourcesfordatavisualisation-150208230909-conversion-gate01/85/Tools-Resources-for-Data-Visualisation-14-320.jpg)
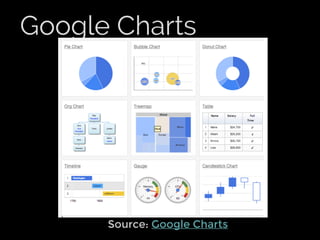


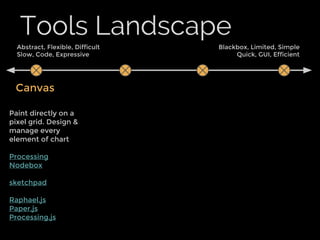
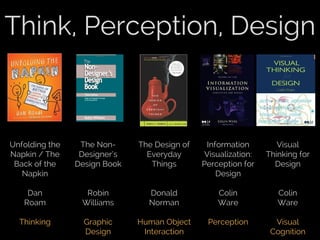
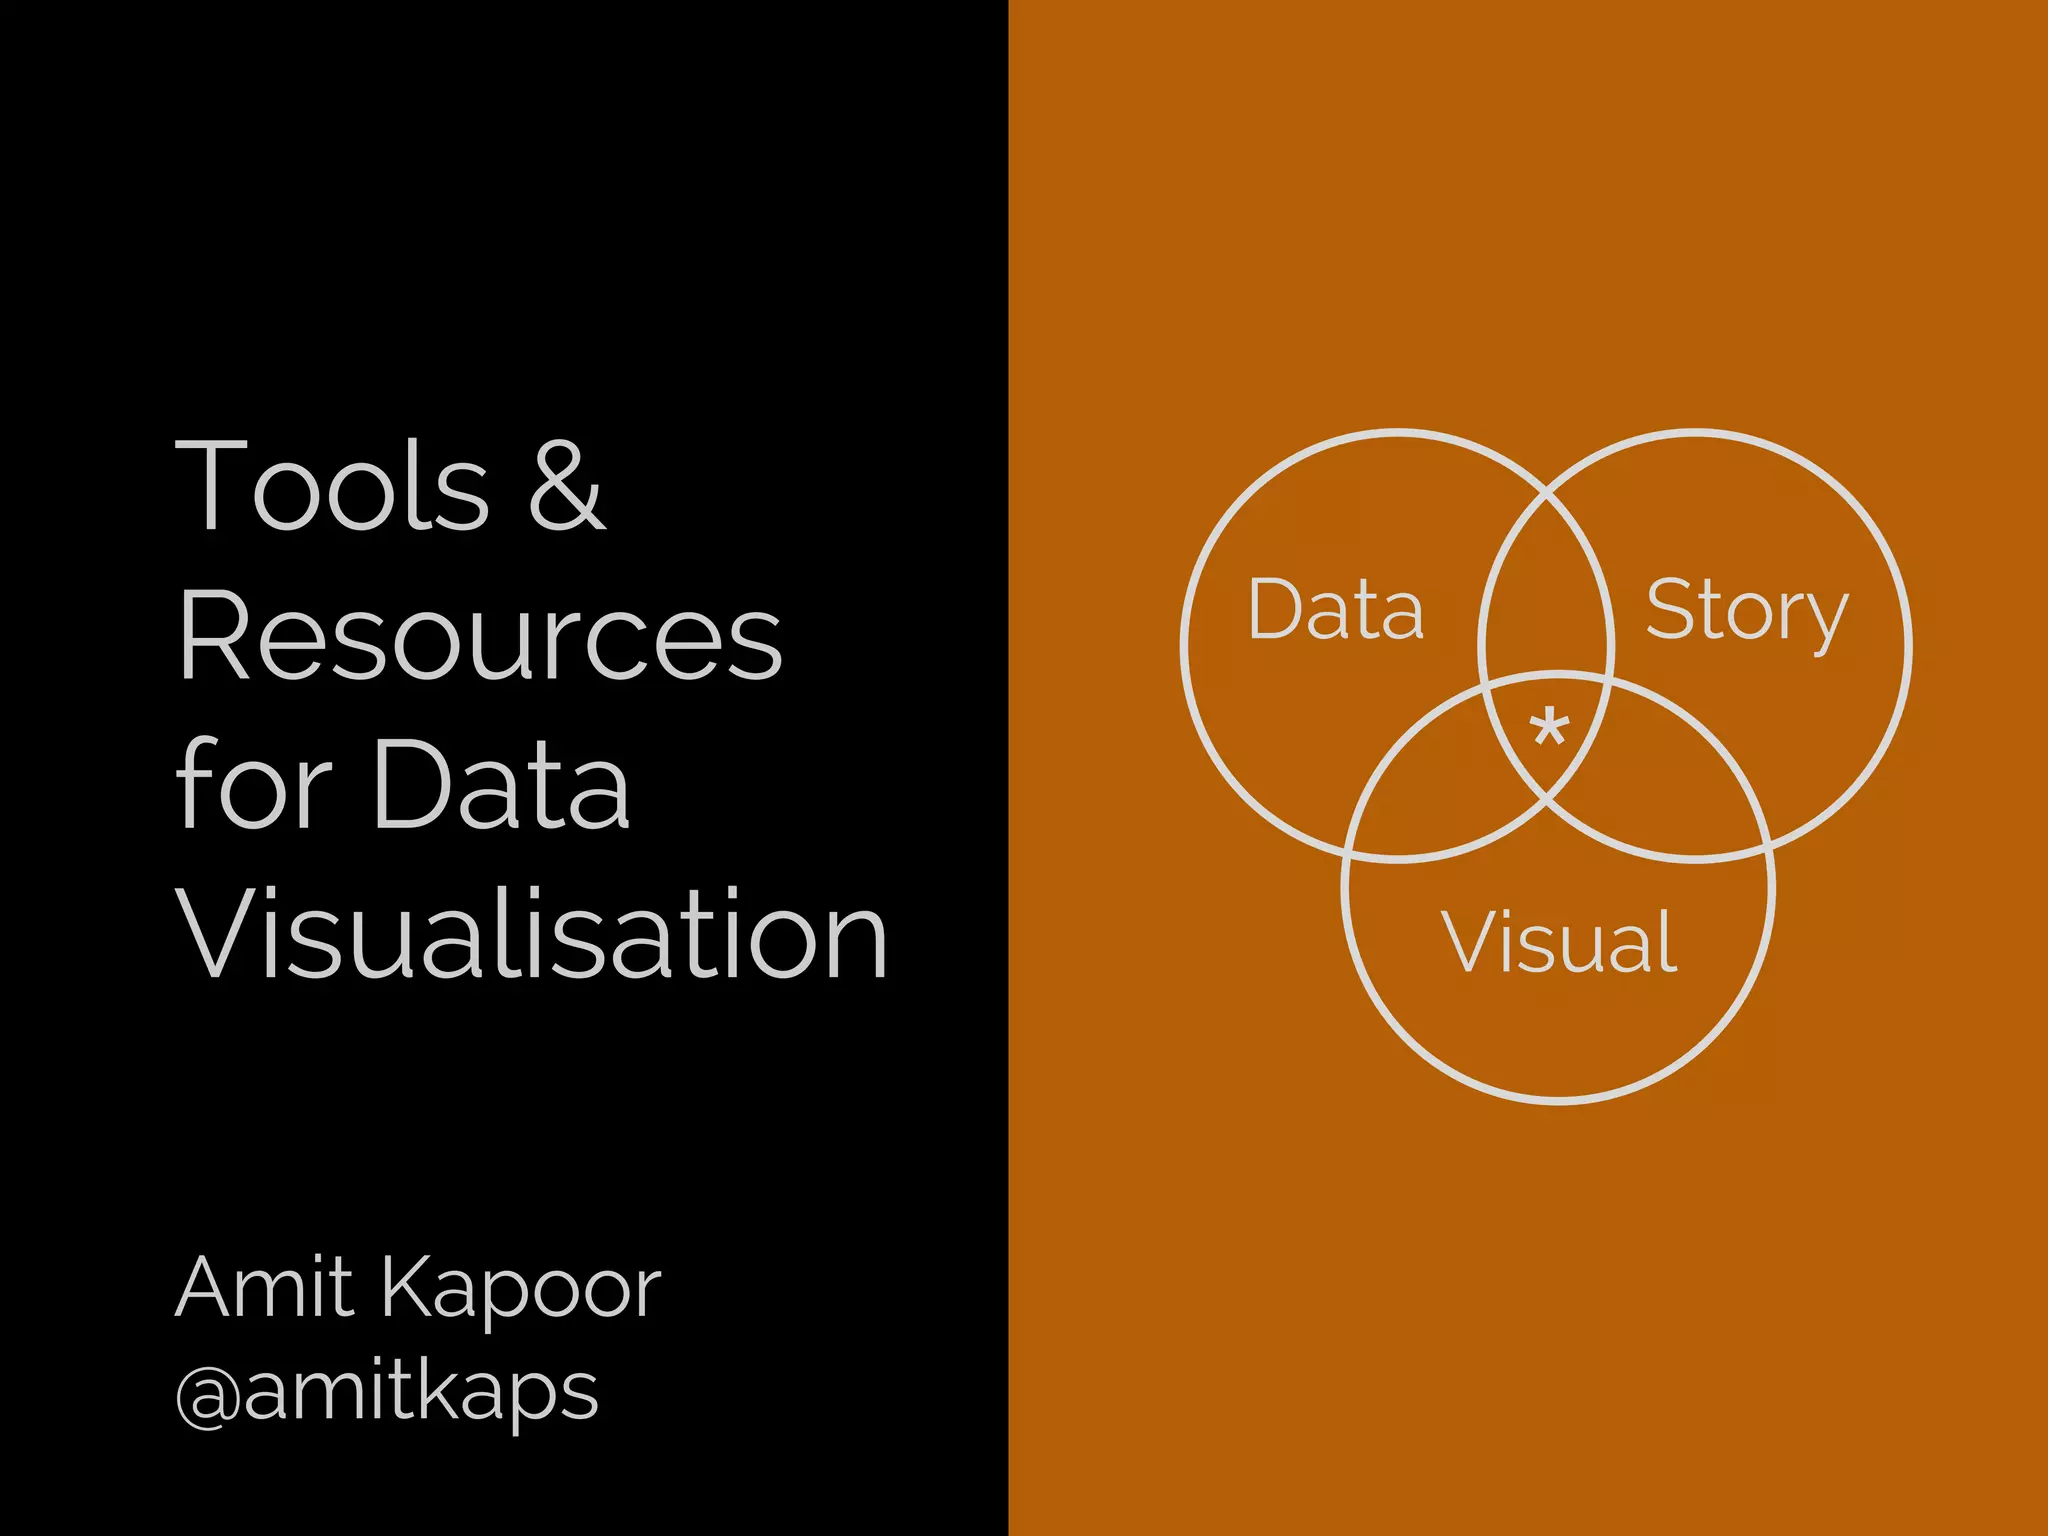
![d3.js
Source: Data-Driven Documents
var data = [5, 25, 15, 20, 10];
var color = d3.scale.category20();
var svg = d3.select("body").append("svg")
.attr("width", 150)
.attr("height", 150);
var g = svg.append("g")
.attr("transform", "translate(75,
75)");
var arcs = g.selectAll("path")
.data(d3.layout.pie().sort(null)
(data)) .enter().append("path")
.style("fill", function(d,i) {
return color(i); })
.attr("d",d3.svg.arc()
.innerRadius(0)
.outerRadius(70));](https://image.slidesharecdn.com/toolsresourcesfordatavisualisation-150208230909-conversion-gate01/85/Tools-Resources-for-Data-Visualisation-25-320.jpg)


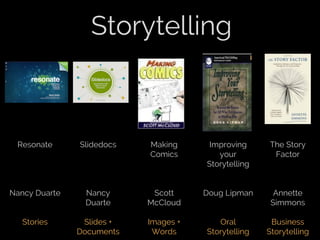
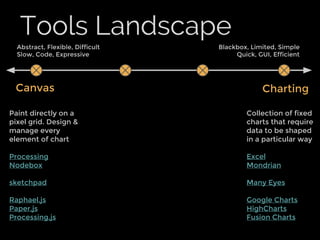
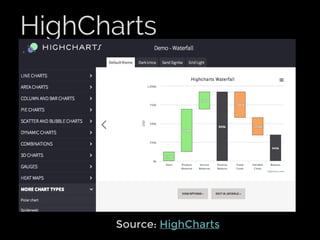
![Processing - Pie Chart
size(400, 400);
background(255);
smooth();
noStroke();
int diameter = 200;
float[] data = {5, 25, 15, 20, 10};
int[] sat = {25, 75, 125, 175, 225};
float lastAngle = 0, sum = 0;
for (int i = 0; i < data.length; i++)
sum += data[i];
for (int i = 0; i < data.length; i++) {
fill(sat[i]);
float angle = data[i] / sum * 2 * PI;
arc(width / 2, height / 2, diameter,
diameter,
lastAngle, lastAngle + angle);
lastAngle += angle;
}
Source: Processing](https://image.slidesharecdn.com/toolsresourcesfordatavisualisation-150208230909-conversion-gate01/75/Tools-Resources-for-Data-Visualisation-5-2048.jpg)
![Google Charts - Pie
Source: Google Charts Playground
function drawVisualization() {
// Create and populate the data table.
var data = google.visualization.
arrayToDataTable([
['Areas', 'Sales'],
['North', 5],
['East', 25],
['West', 15],
['South', 20],
['Central', 10]
]);
// Create and draw the visualization.
new google.visualization.PieChart
(document.getElementById
('visualization')).
draw(data, {title:"Sales by
Area"});
}](https://image.slidesharecdn.com/toolsresourcesfordatavisualisation-150208230909-conversion-gate01/75/Tools-Resources-for-Data-Visualisation-14-2048.jpg)


![d3.js
Source: Data-Driven Documents
var data = [5, 25, 15, 20, 10];
var color = d3.scale.category20();
var svg = d3.select("body").append("svg")
.attr("width", 150)
.attr("height", 150);
var g = svg.append("g")
.attr("transform", "translate(75,
75)");
var arcs = g.selectAll("path")
.data(d3.layout.pie().sort(null)
(data)) .enter().append("path")
.style("fill", function(d,i) {
return color(i); })
.attr("d",d3.svg.arc()
.innerRadius(0)
.outerRadius(70));](https://image.slidesharecdn.com/toolsresourcesfordatavisualisation-150208230909-conversion-gate01/75/Tools-Resources-for-Data-Visualisation-25-2048.jpg)
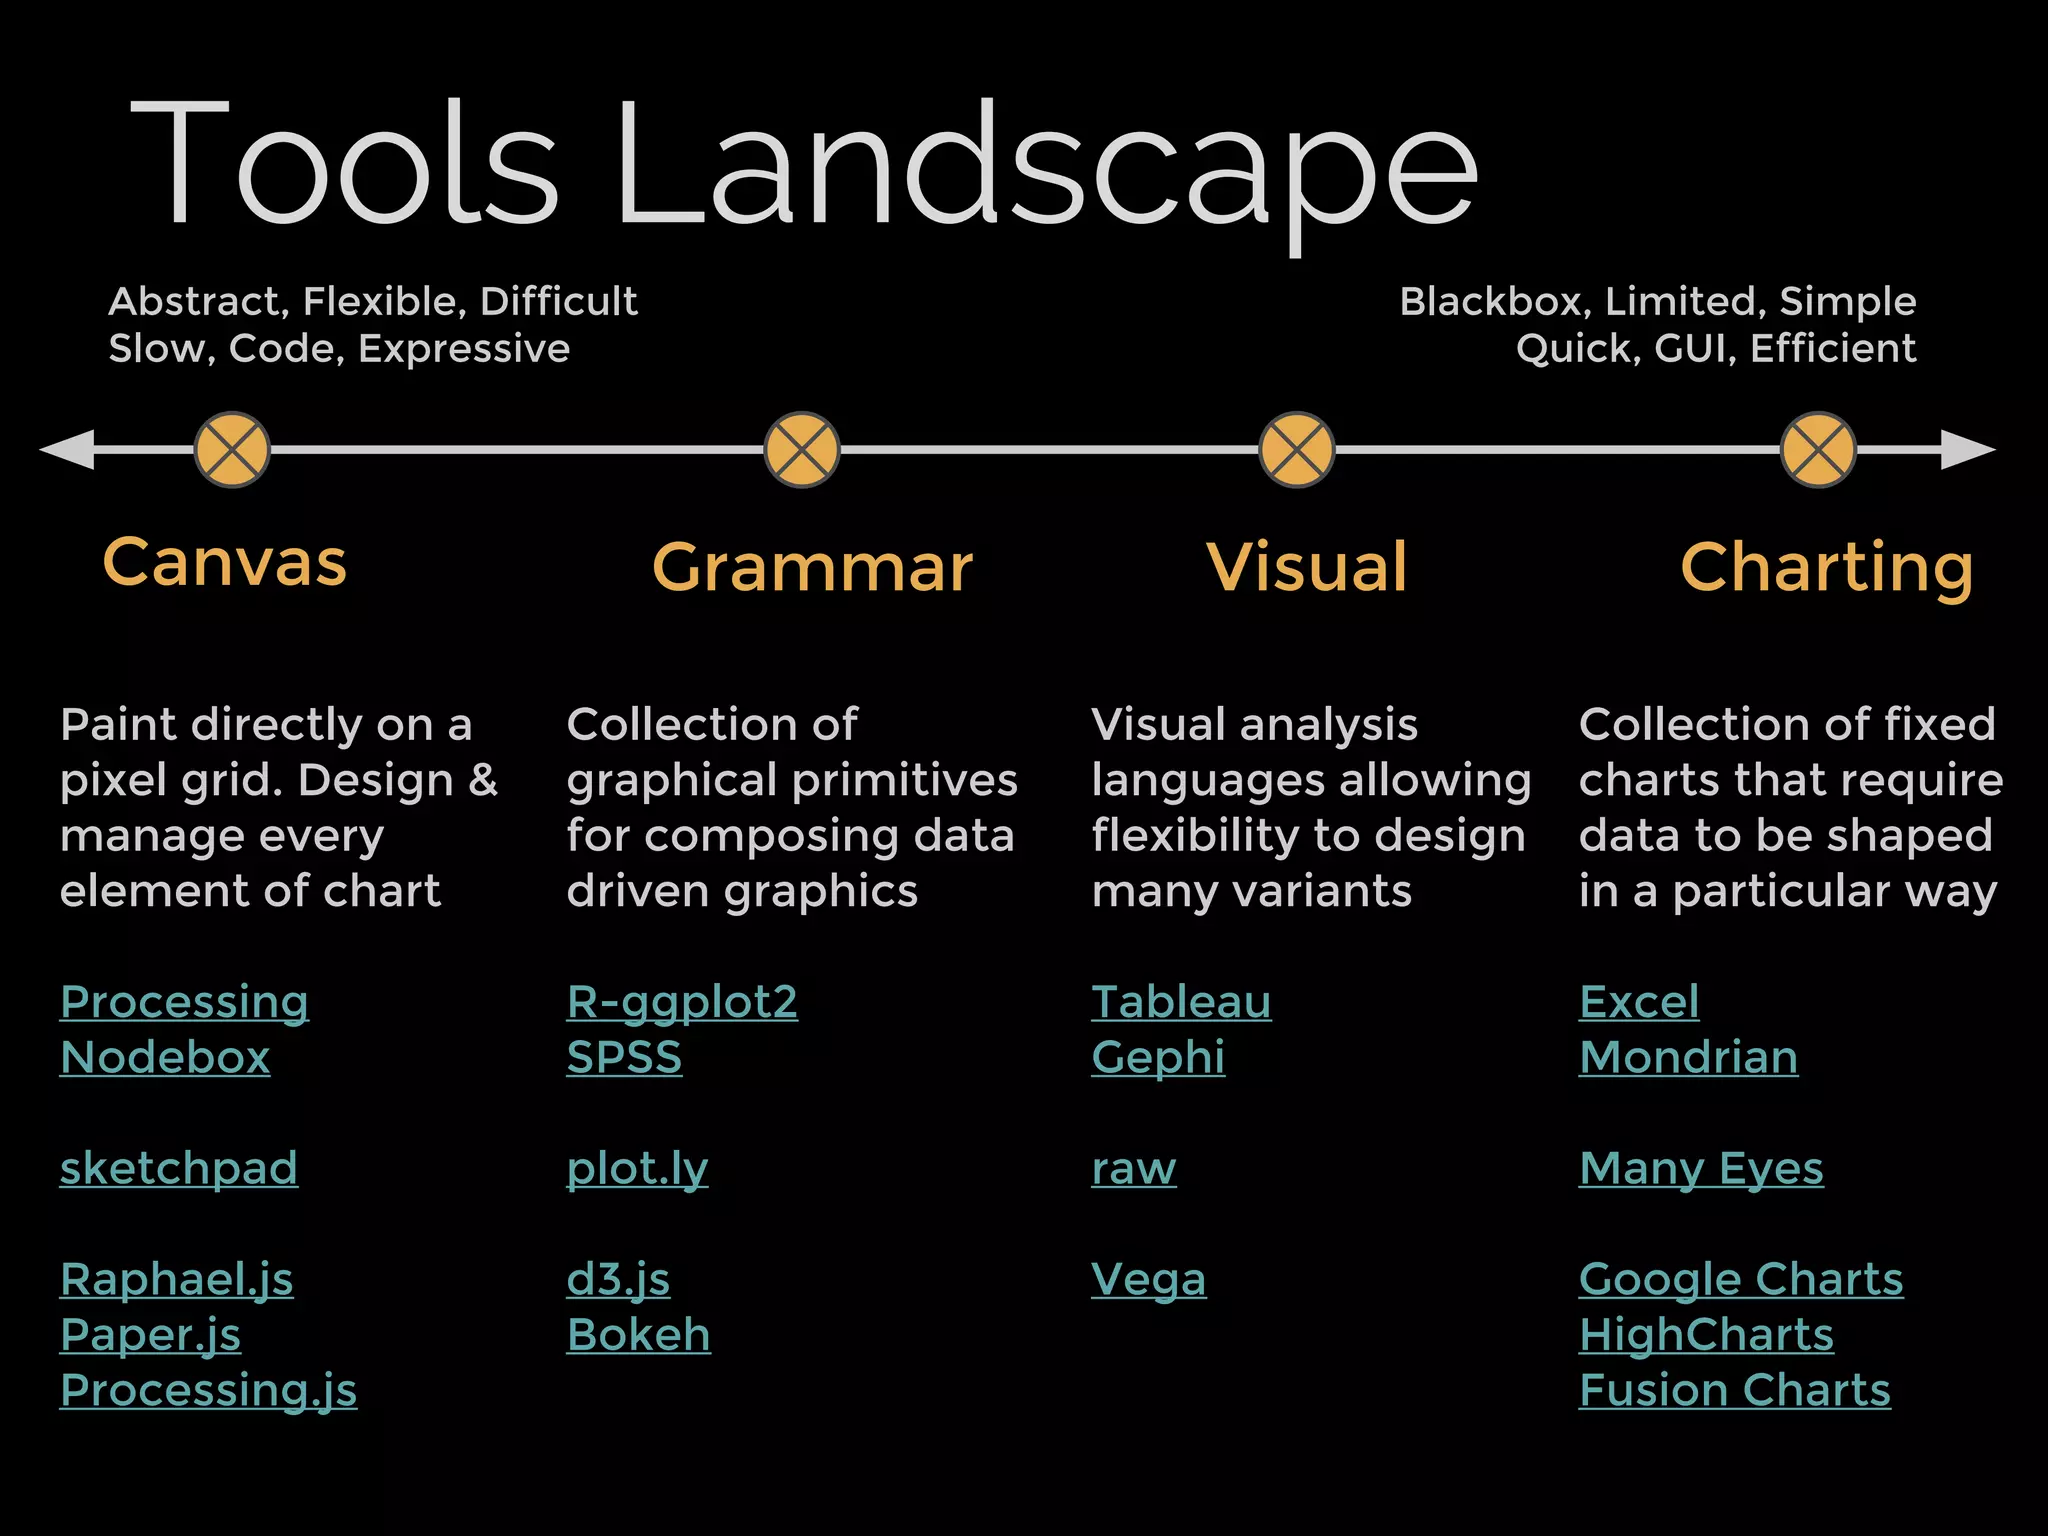

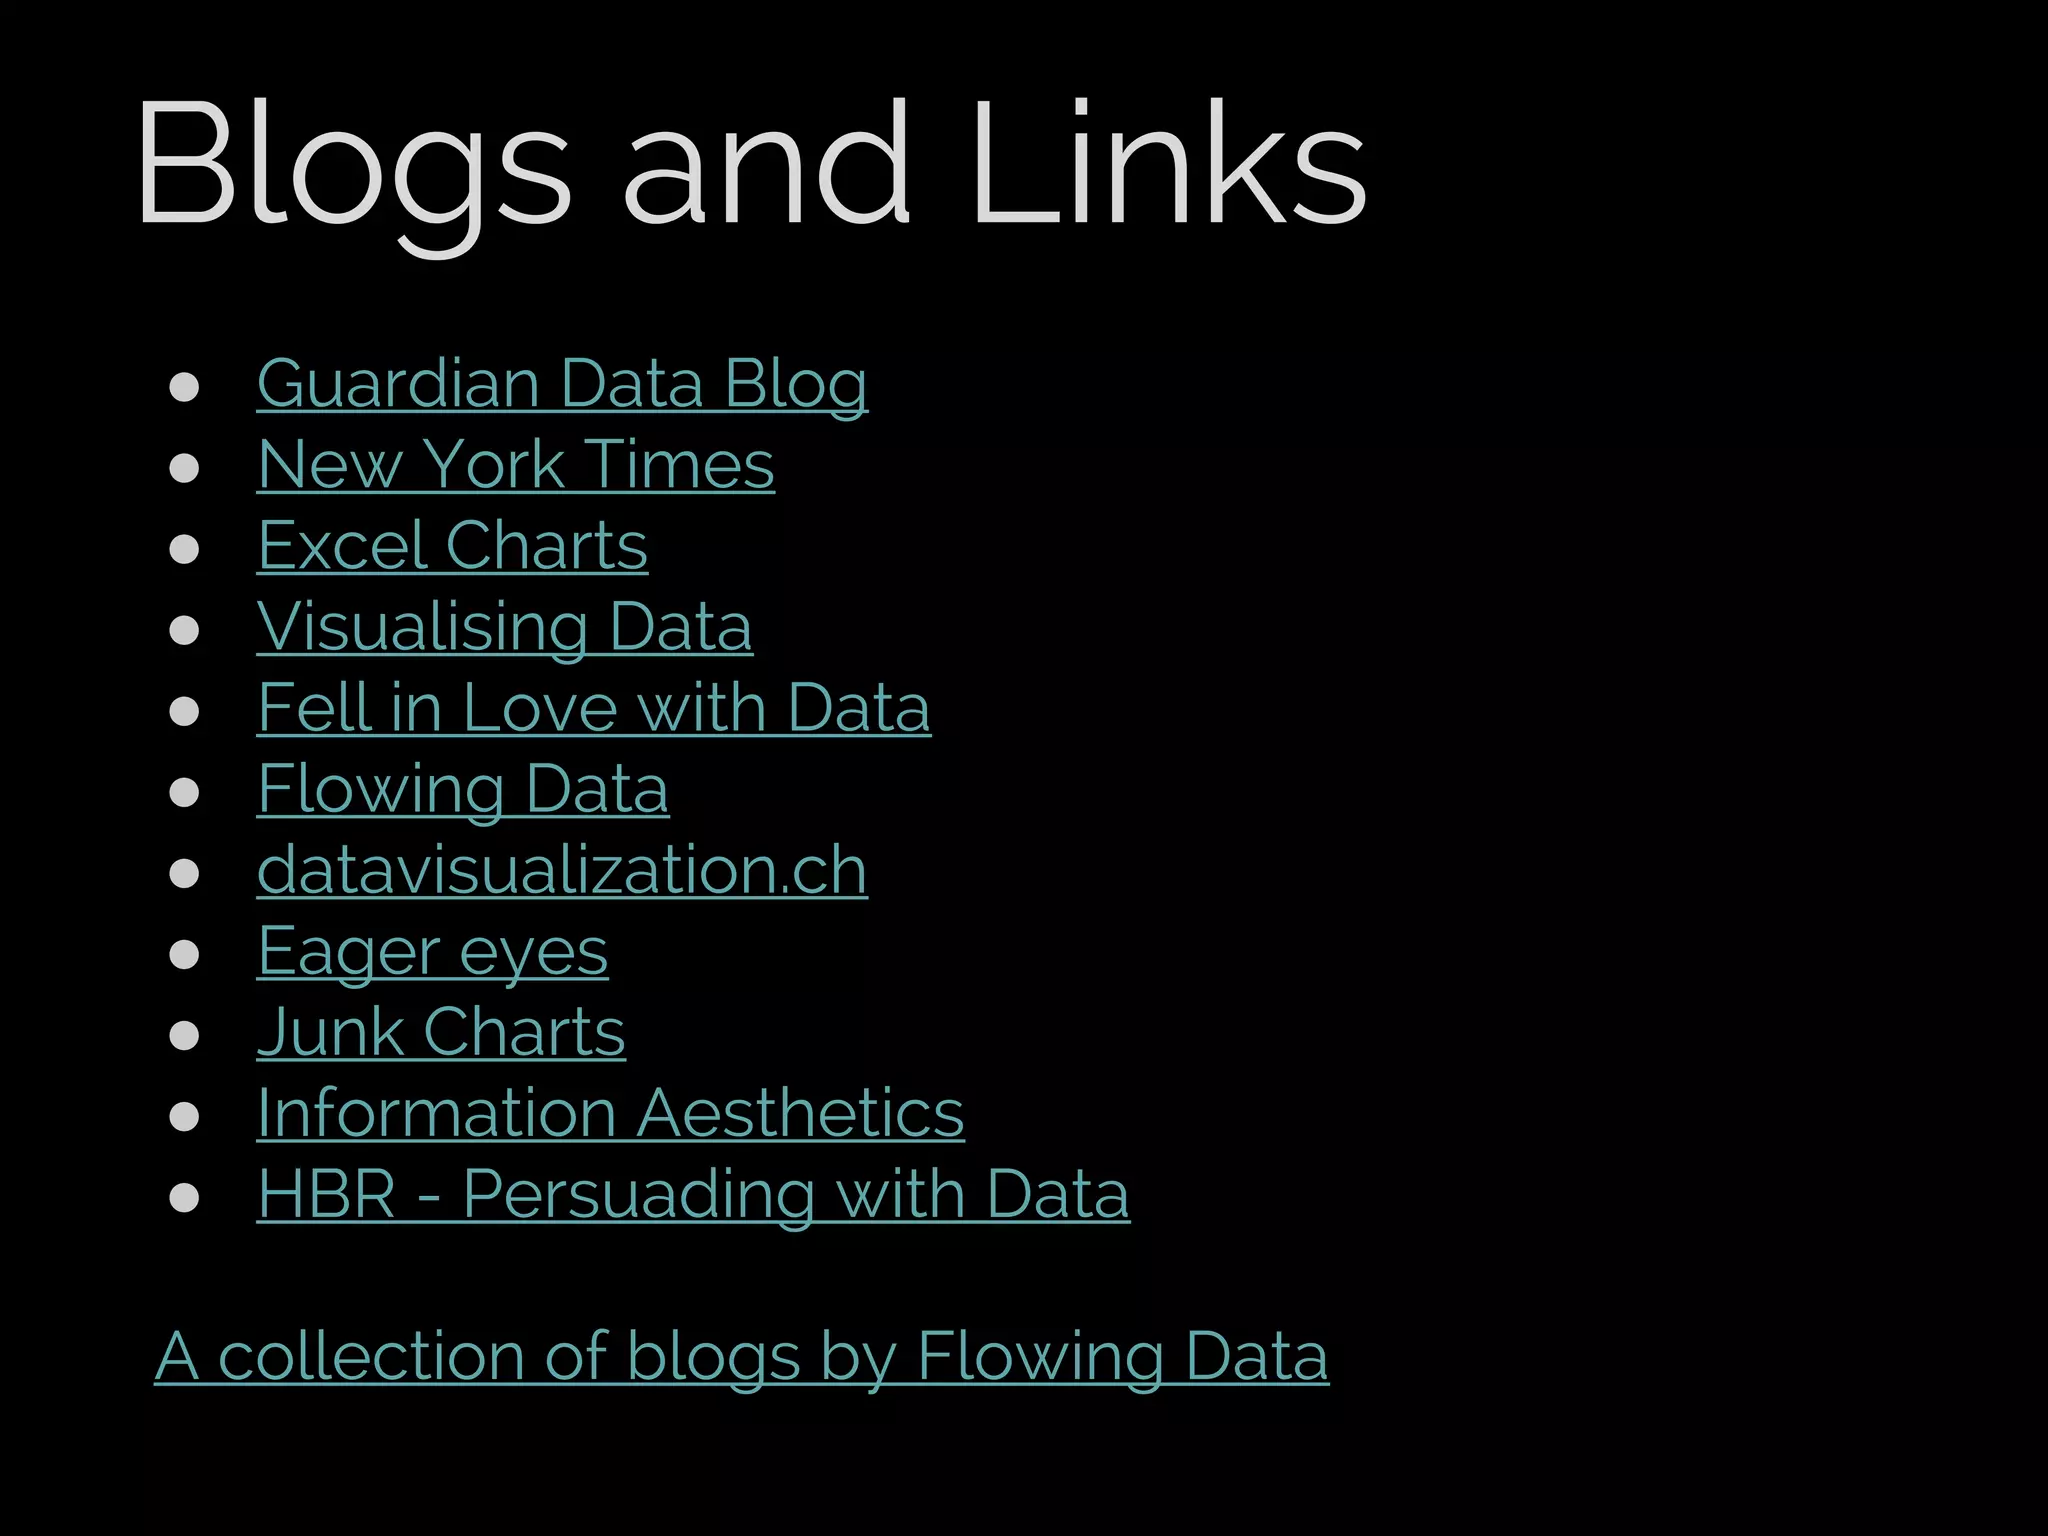
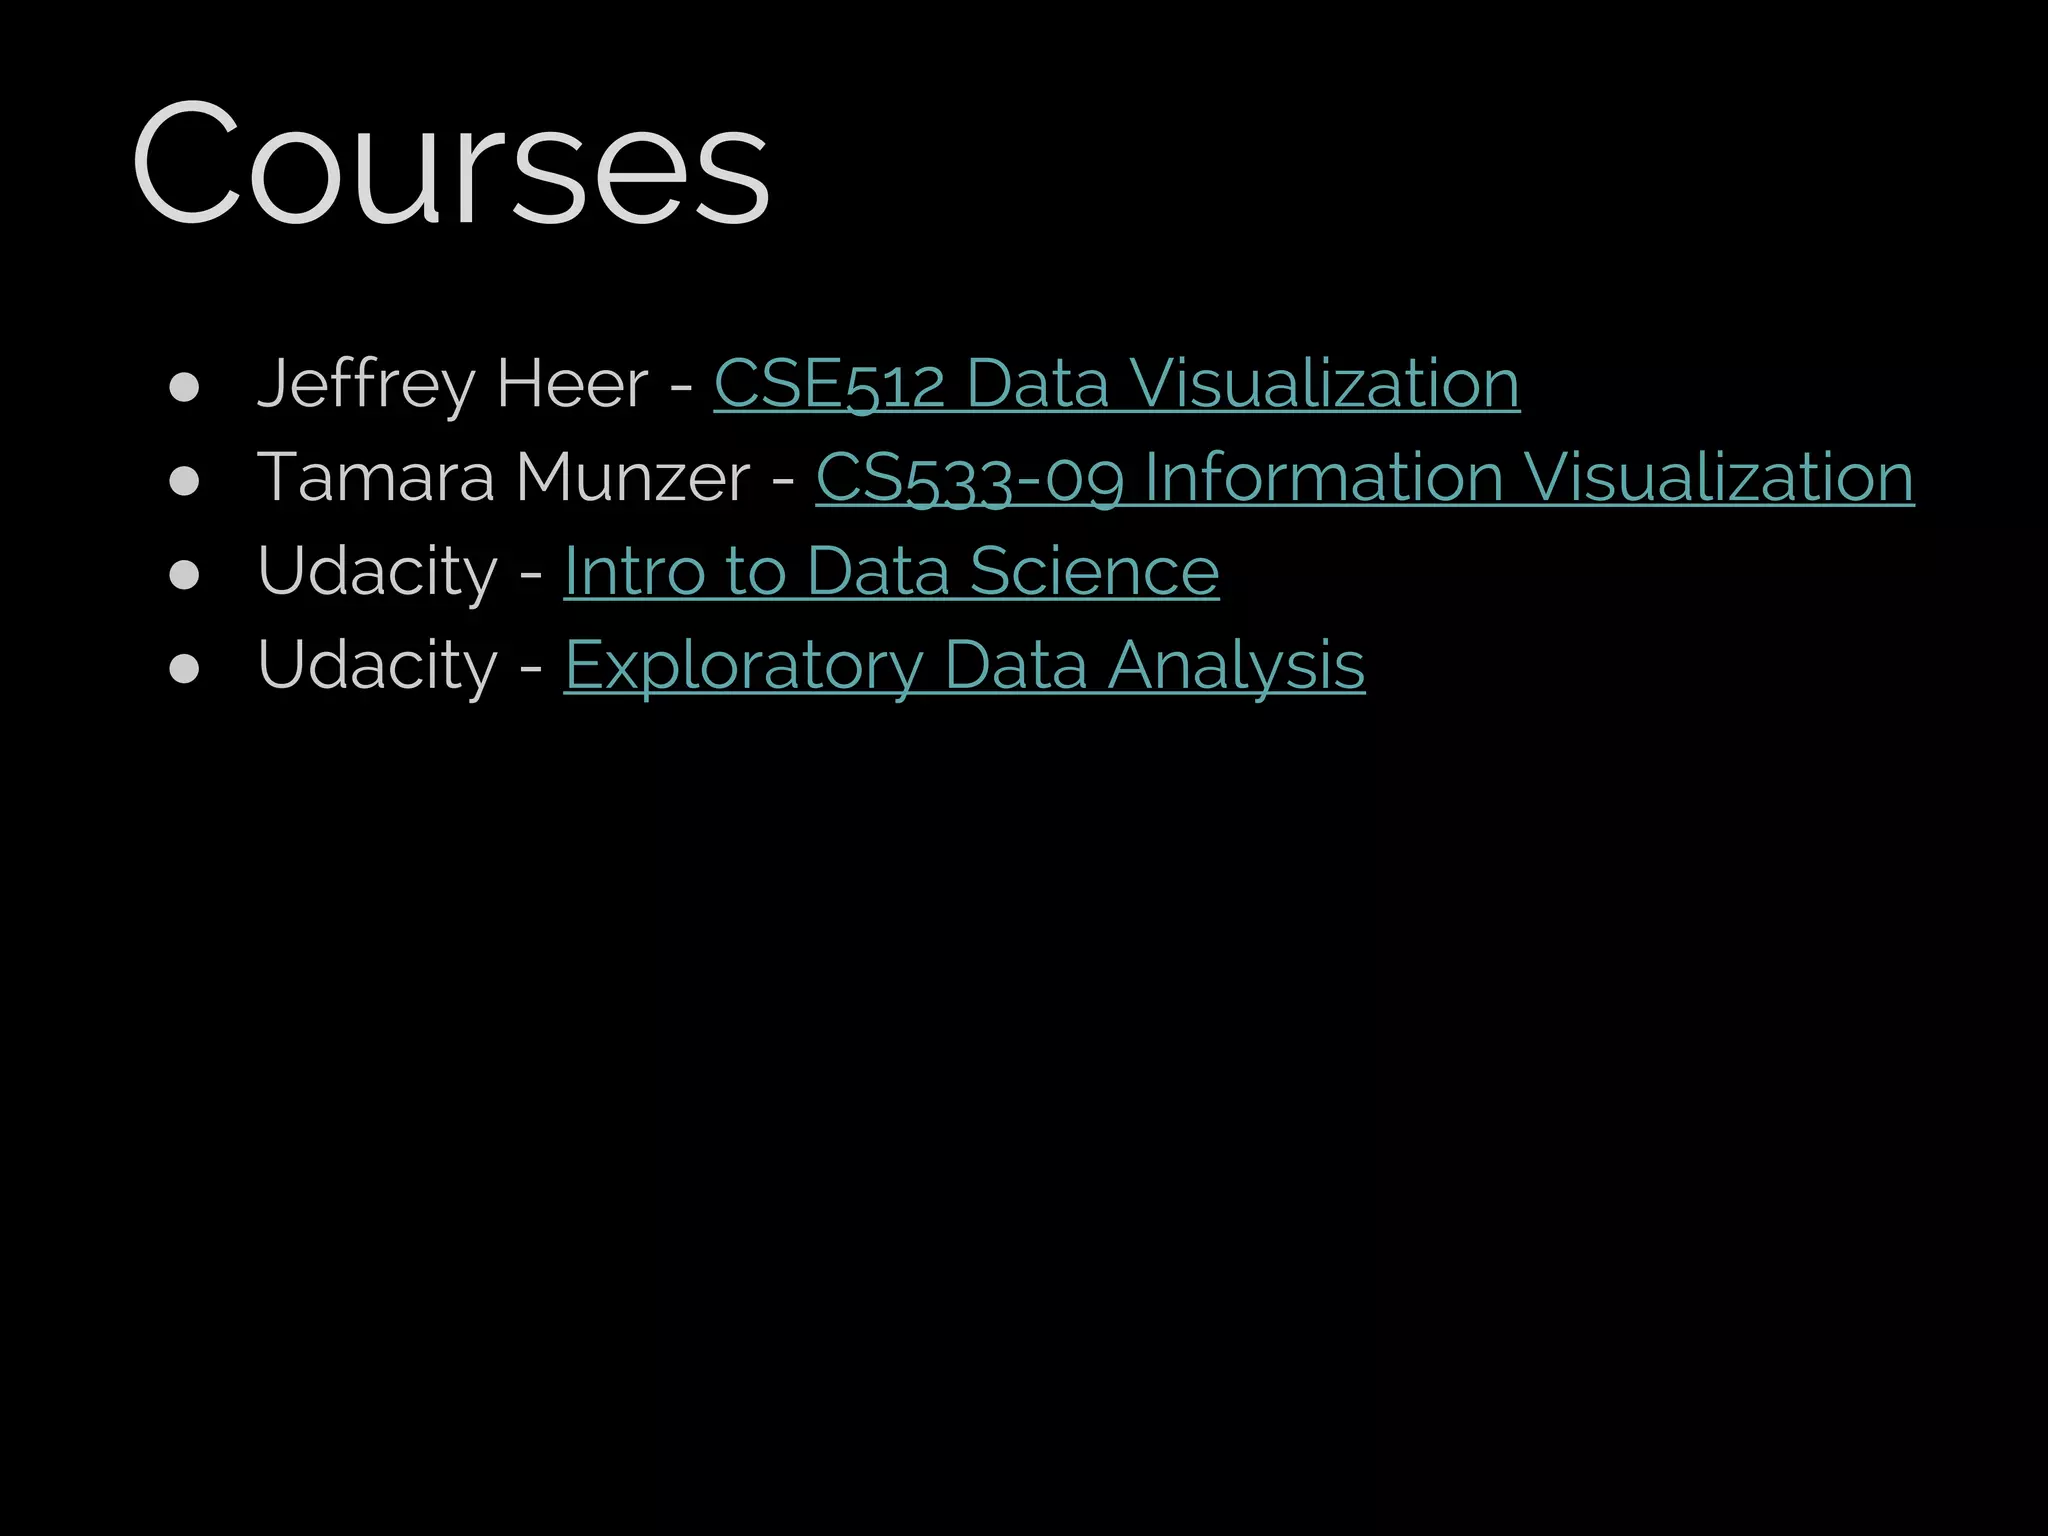

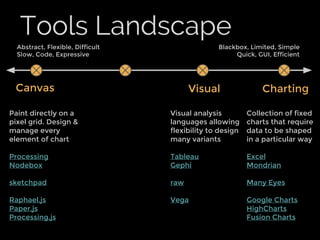
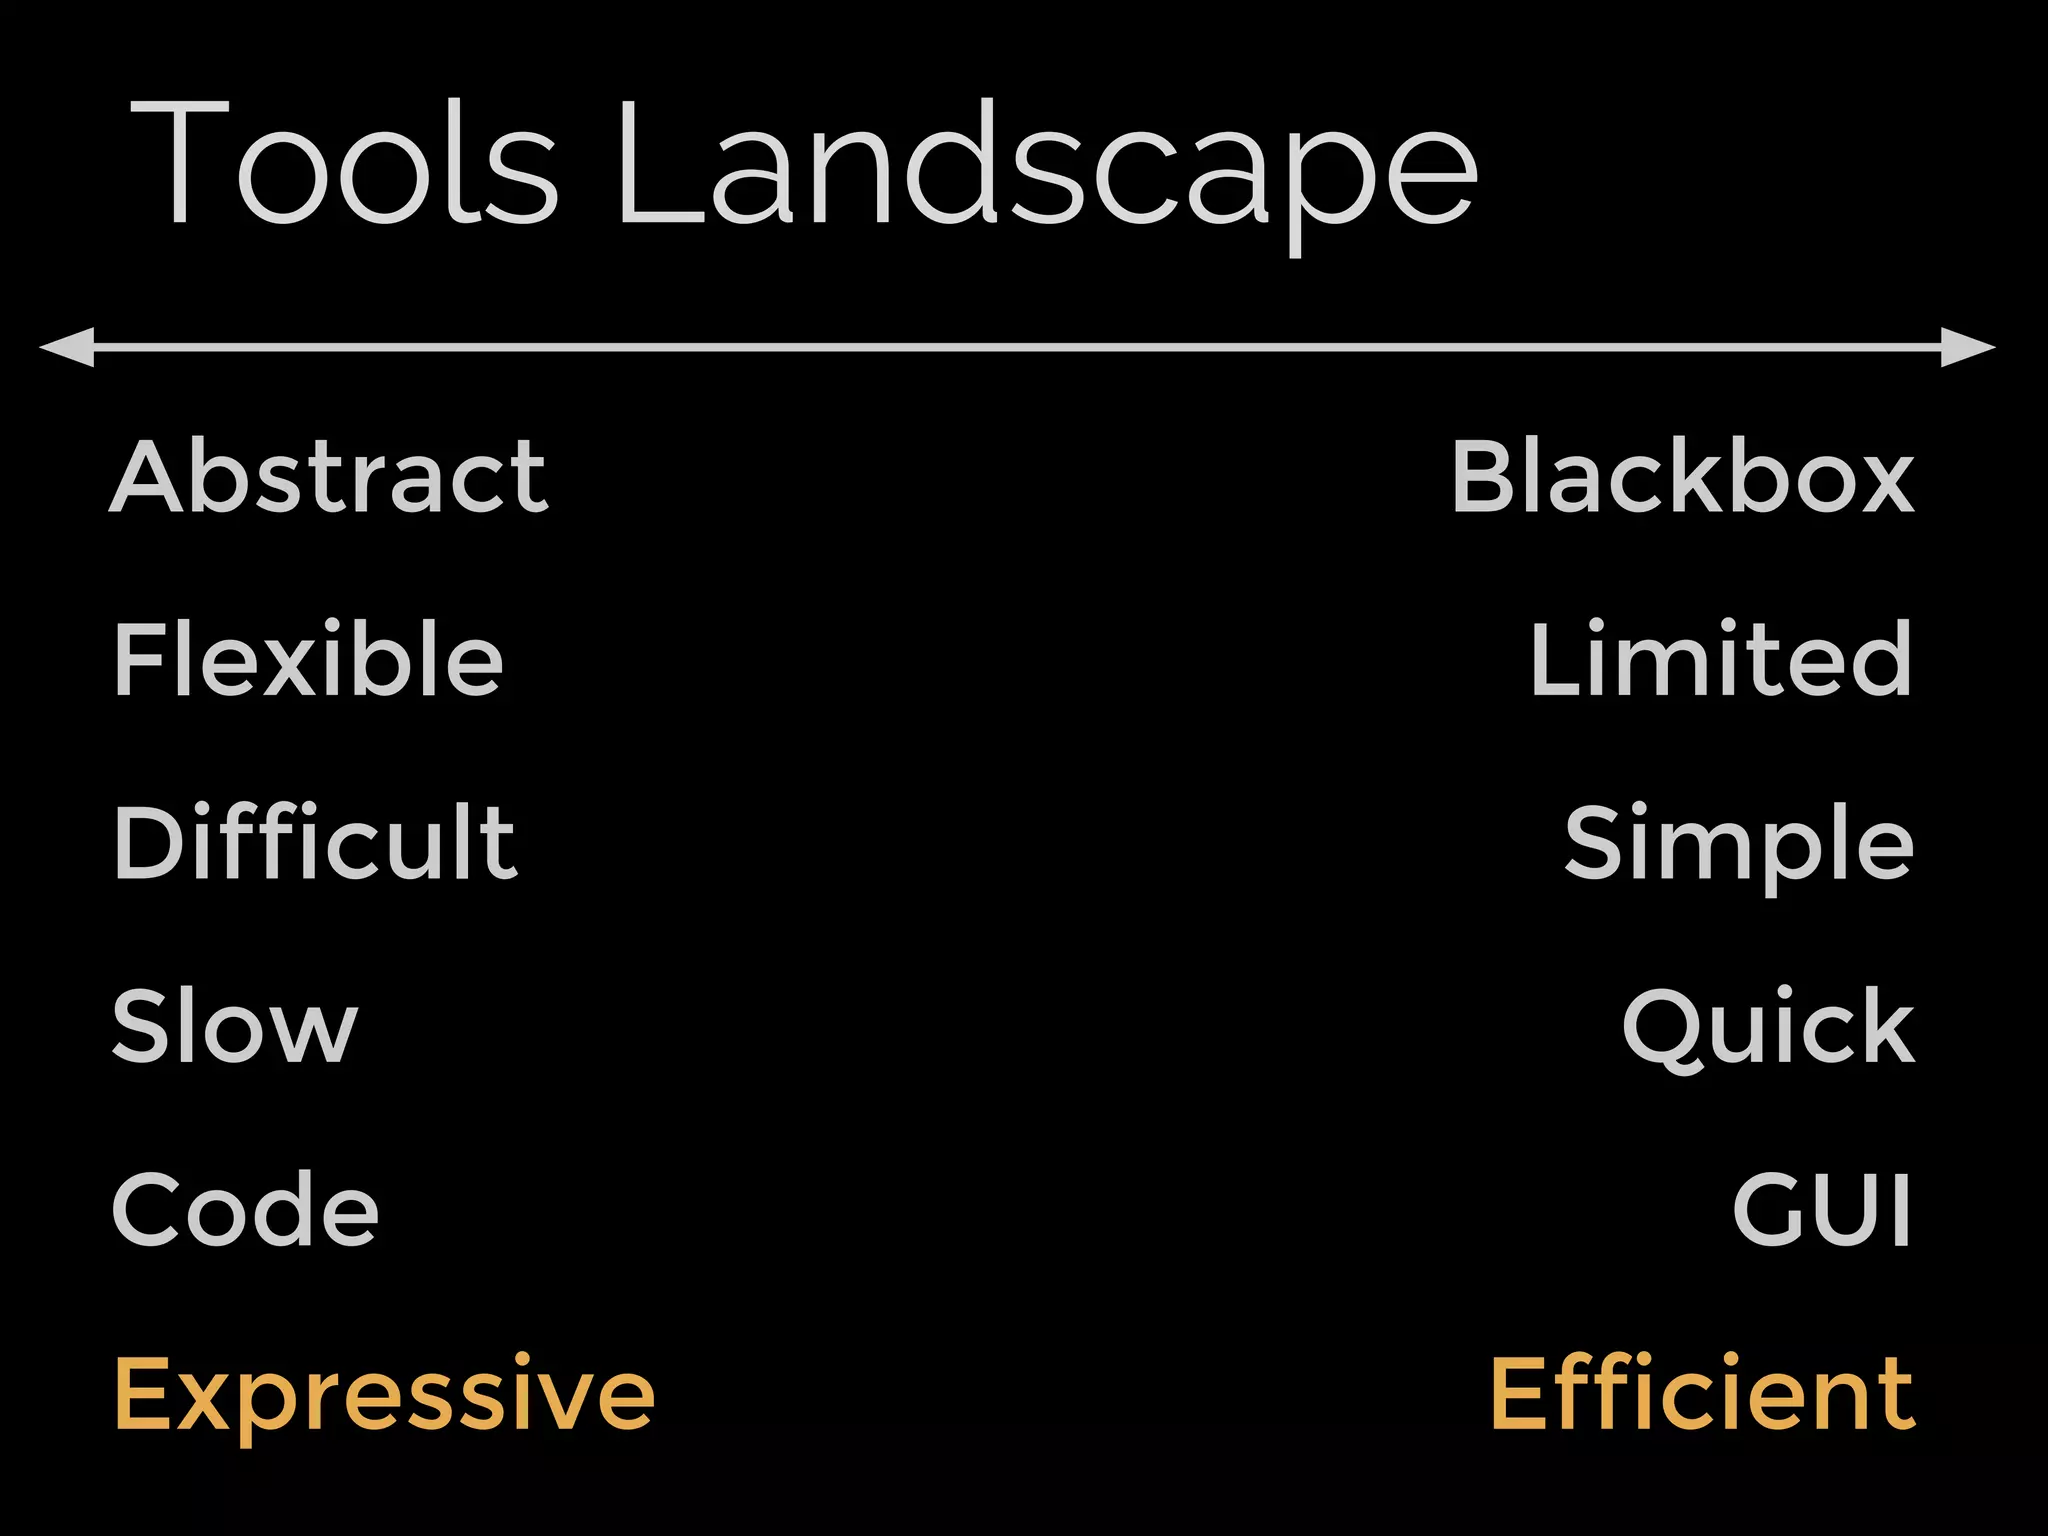
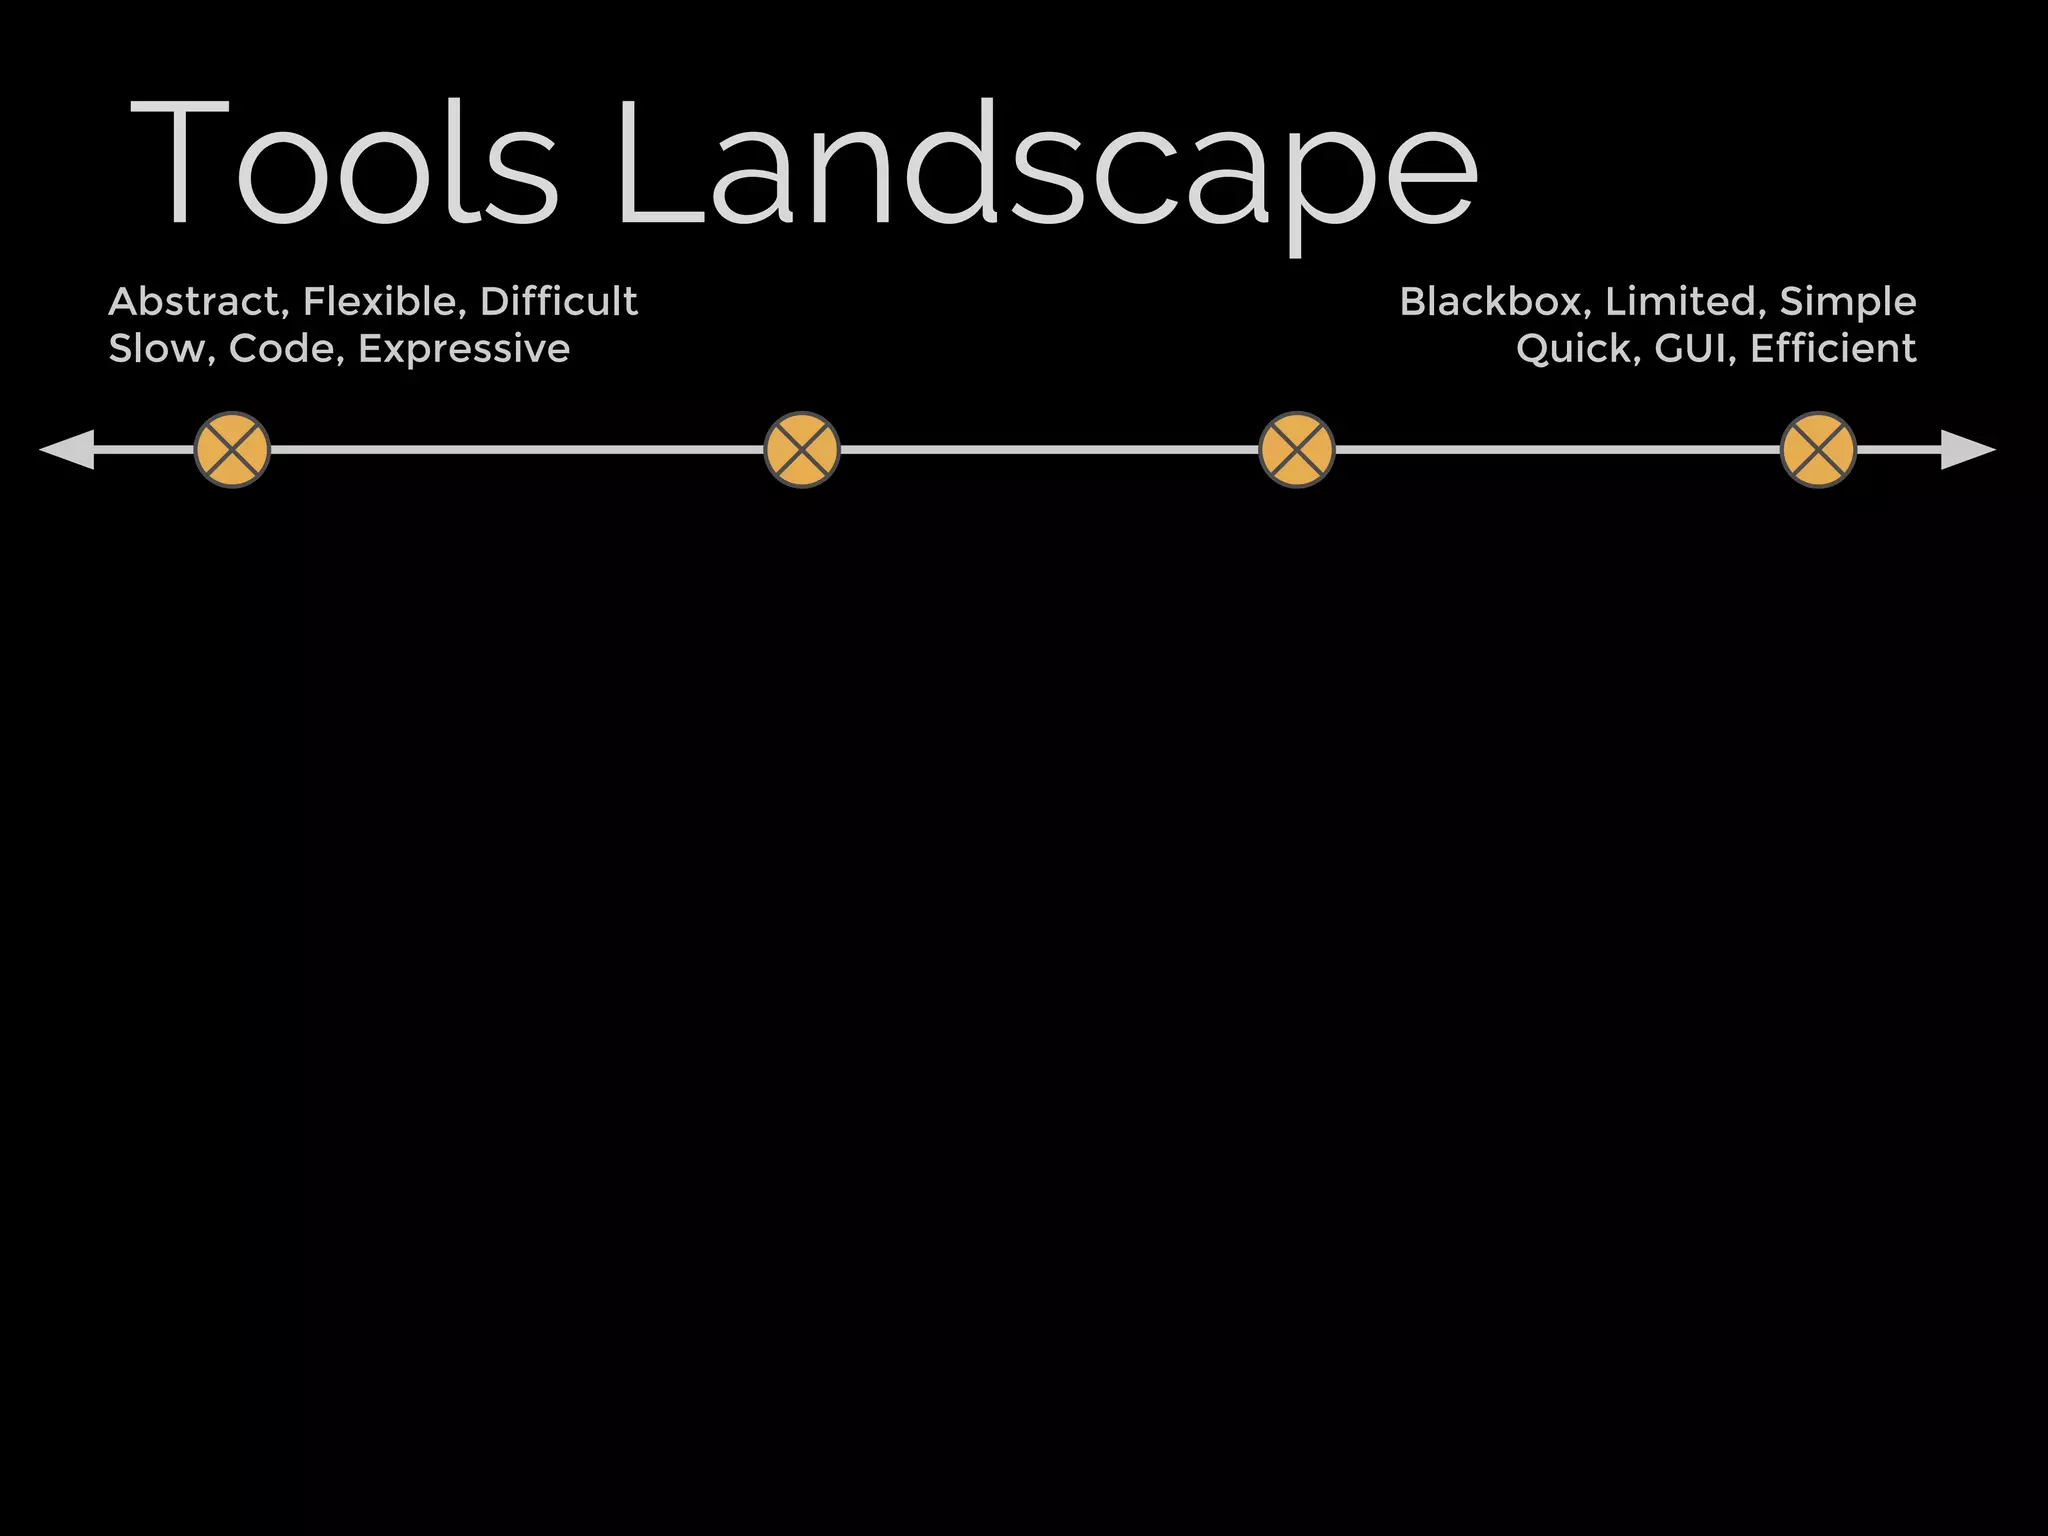
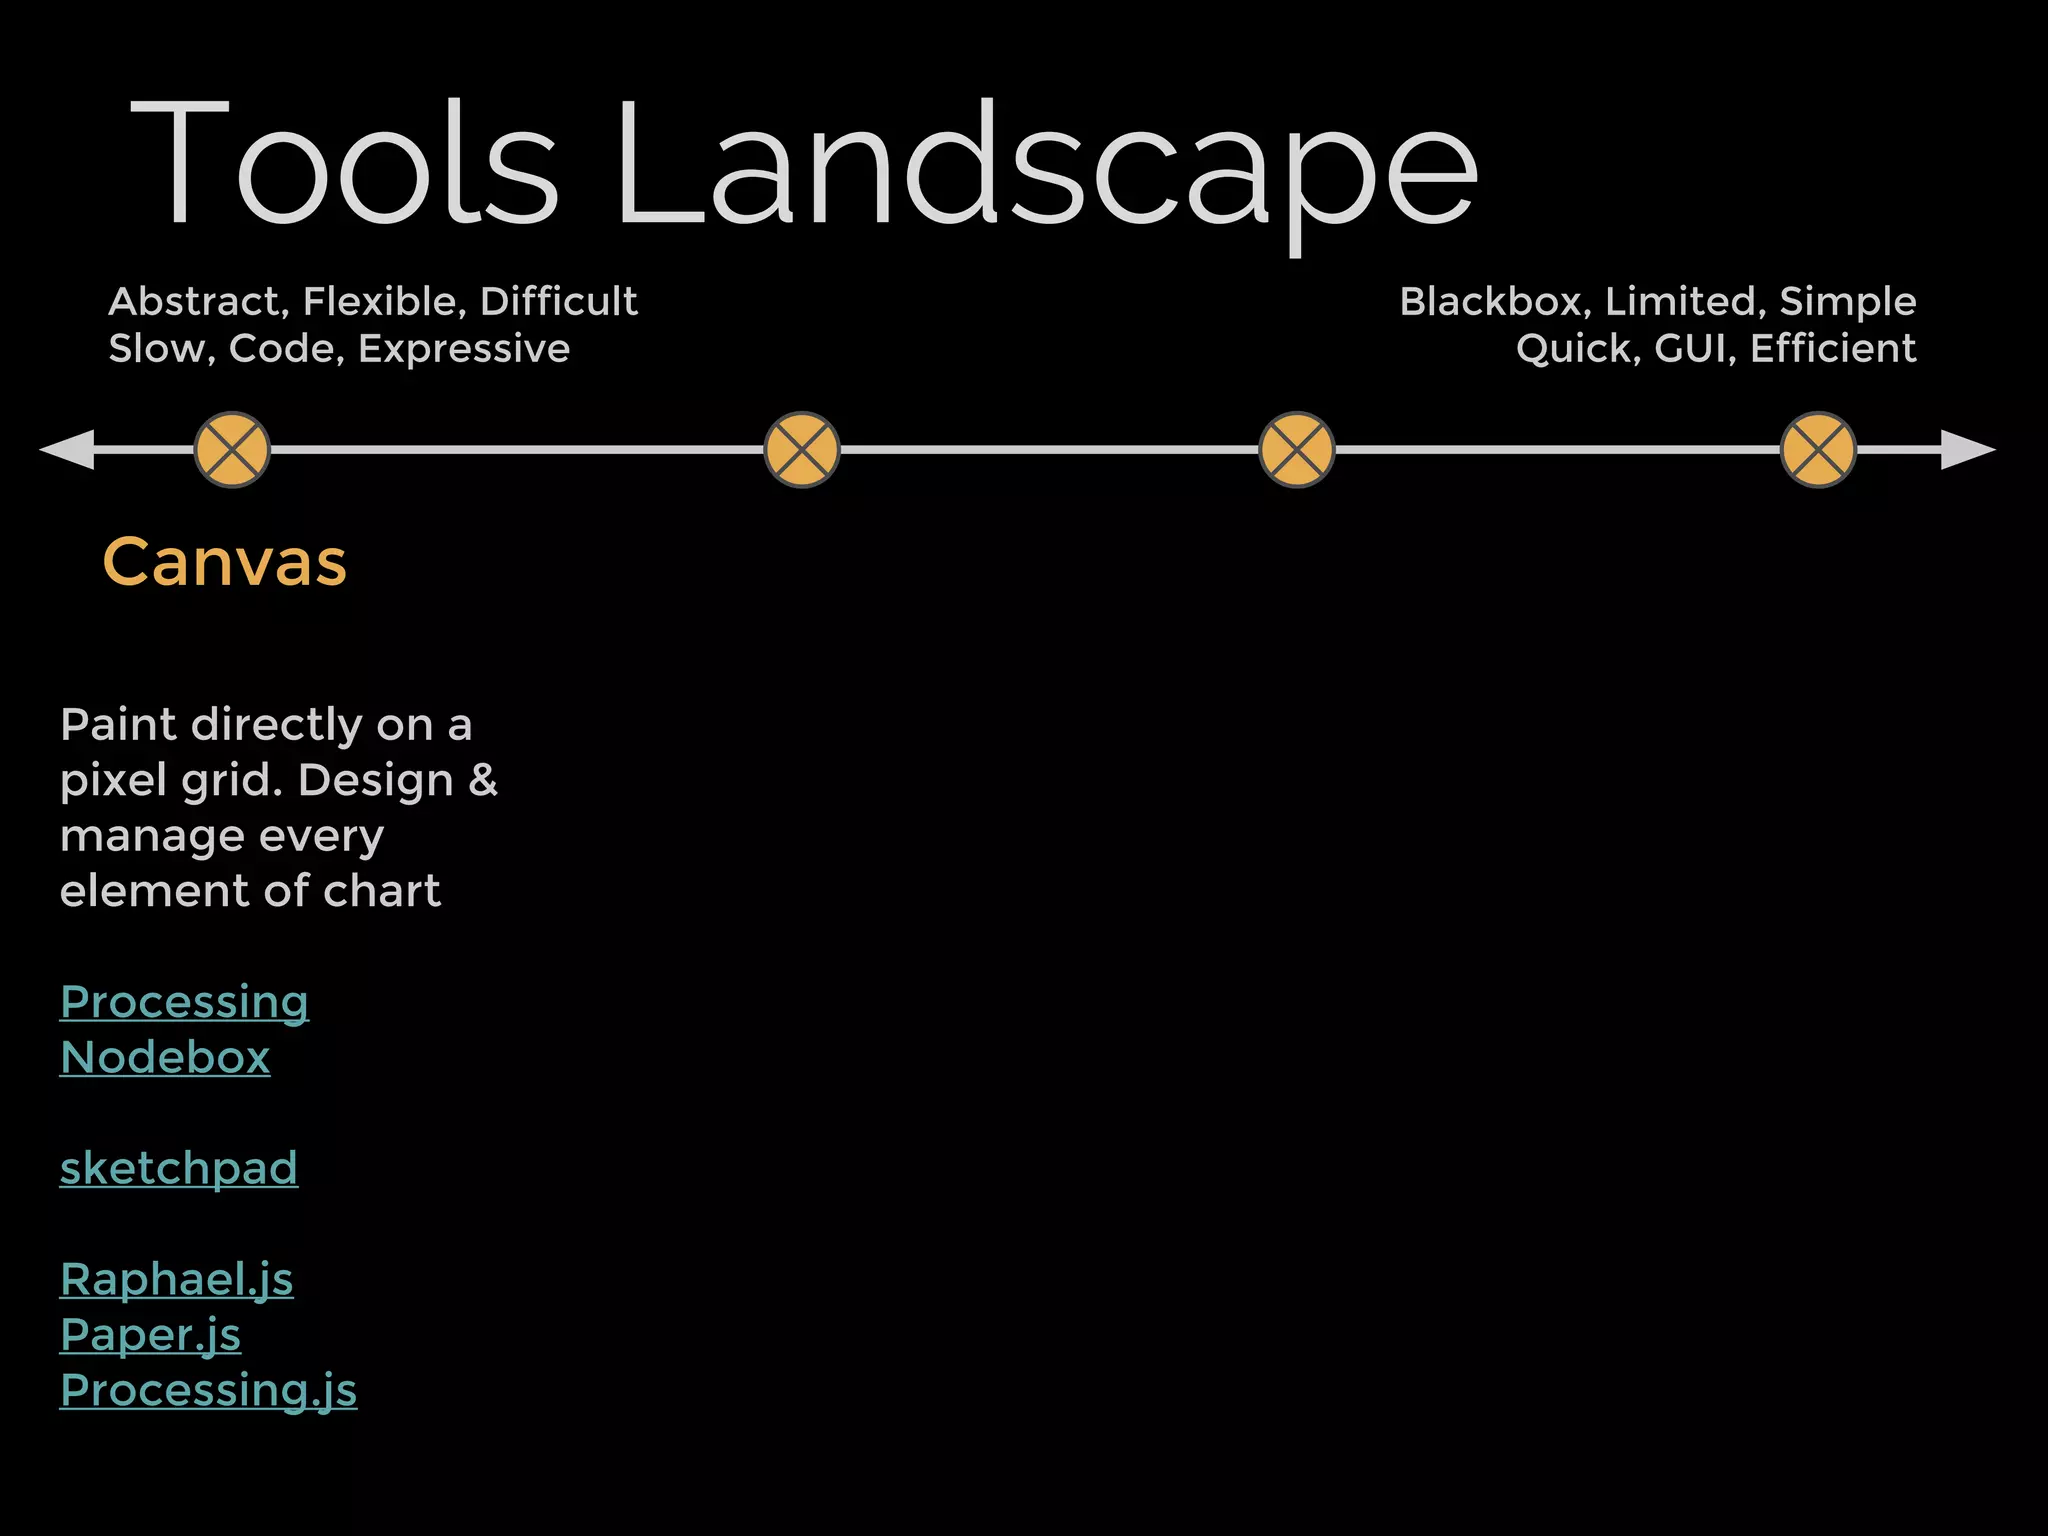
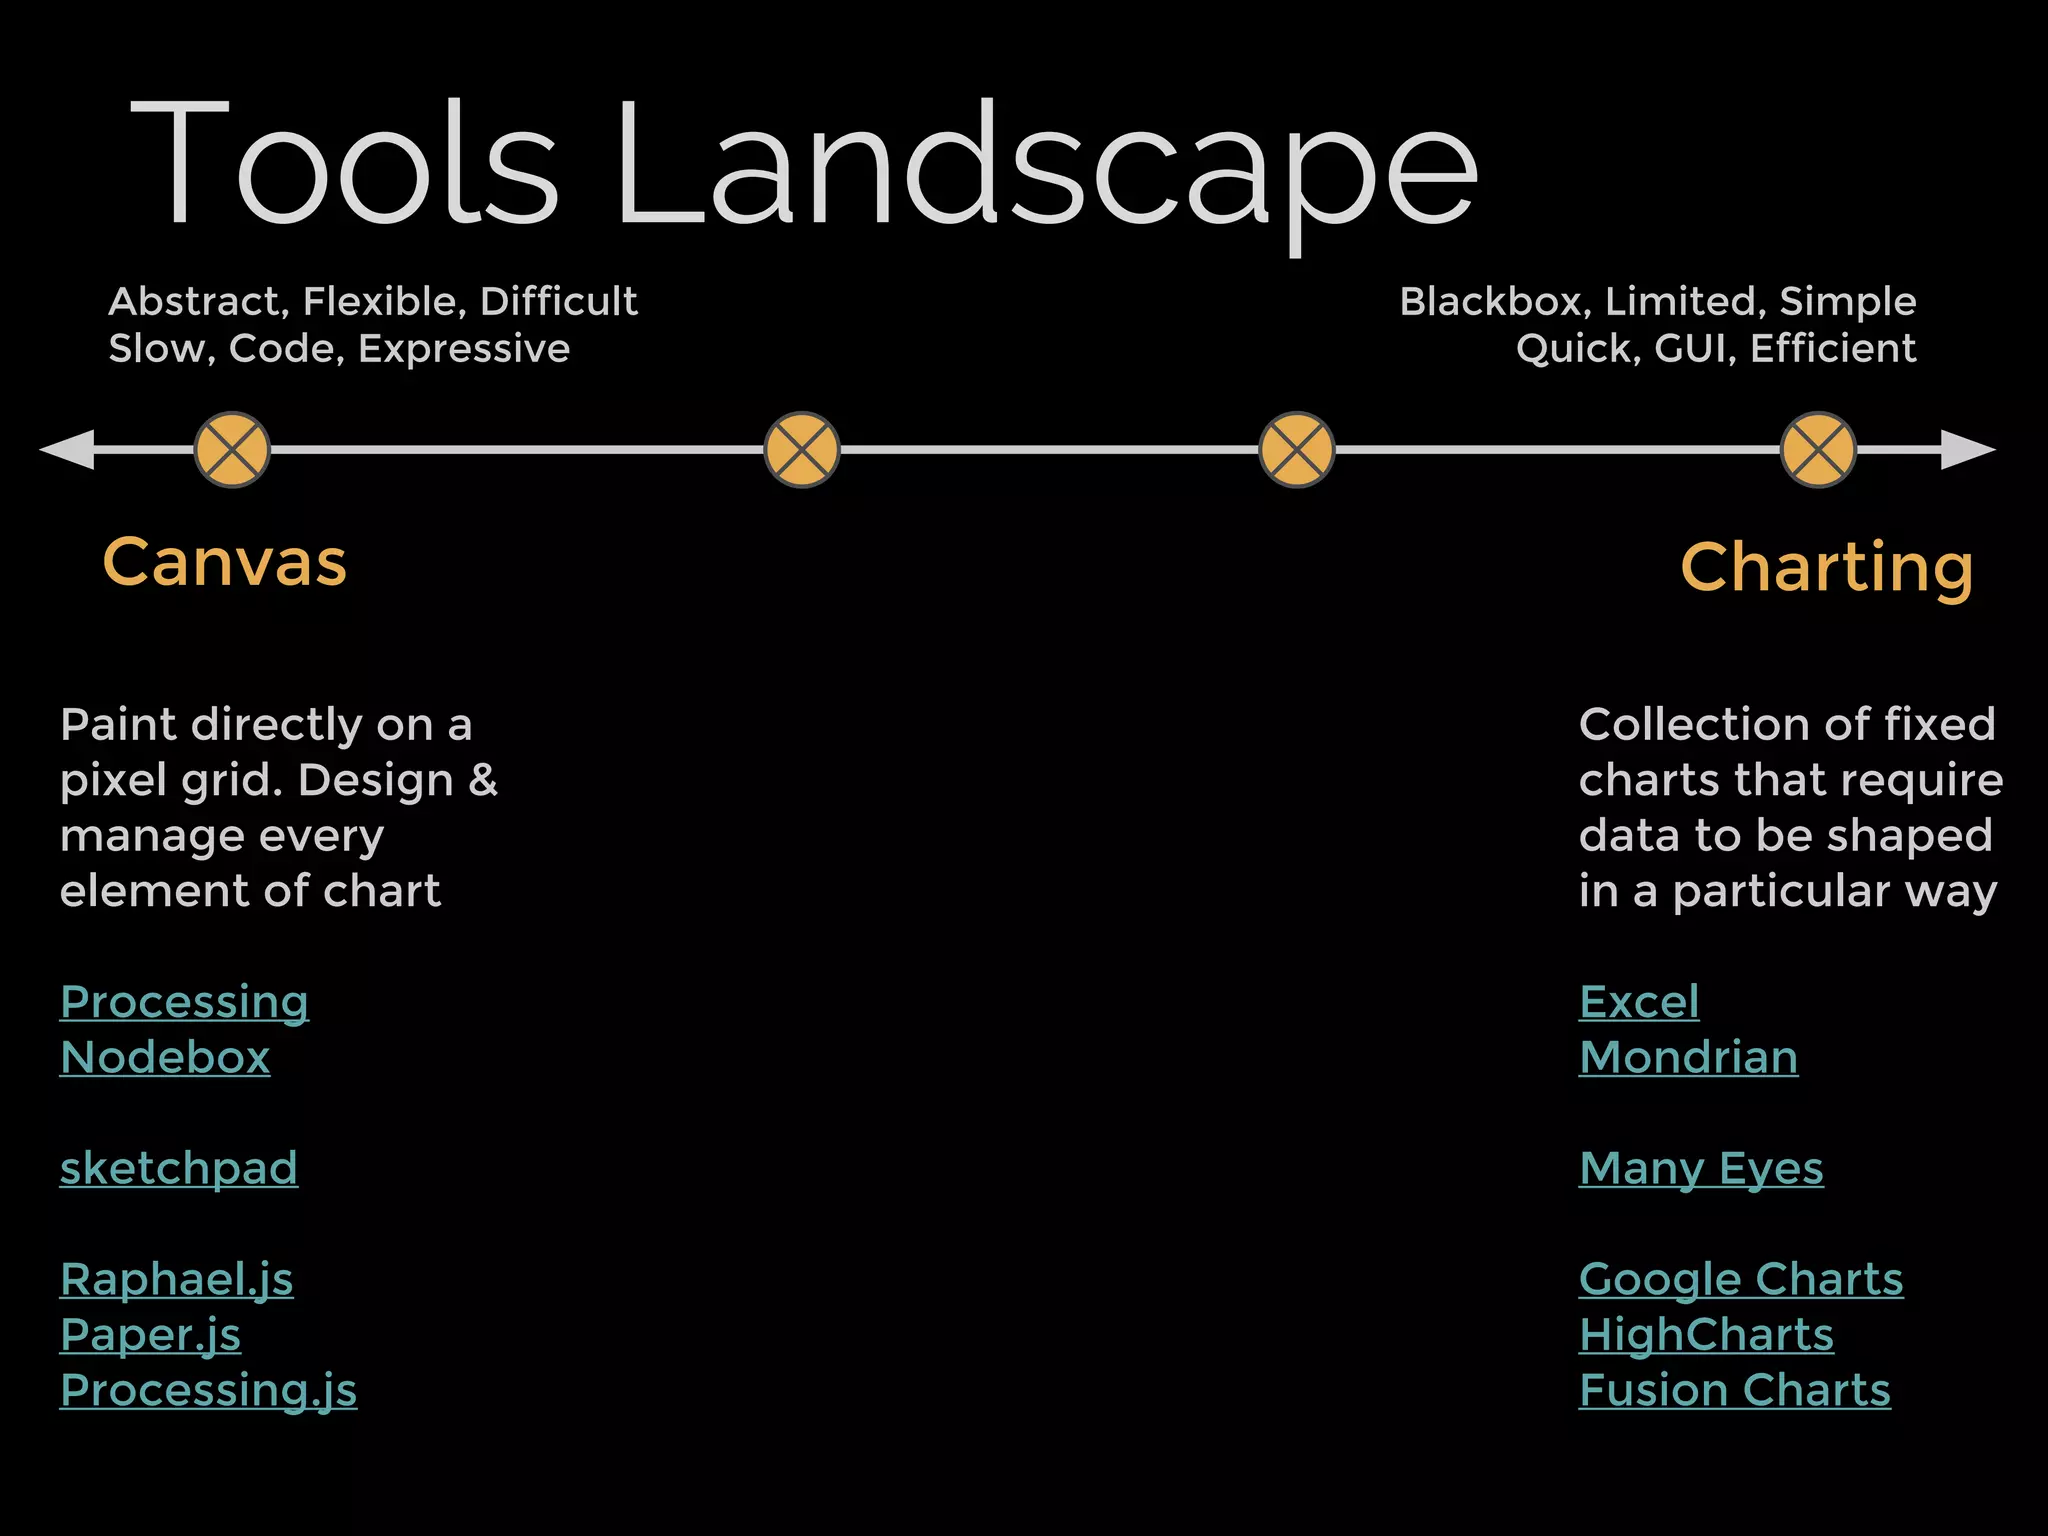
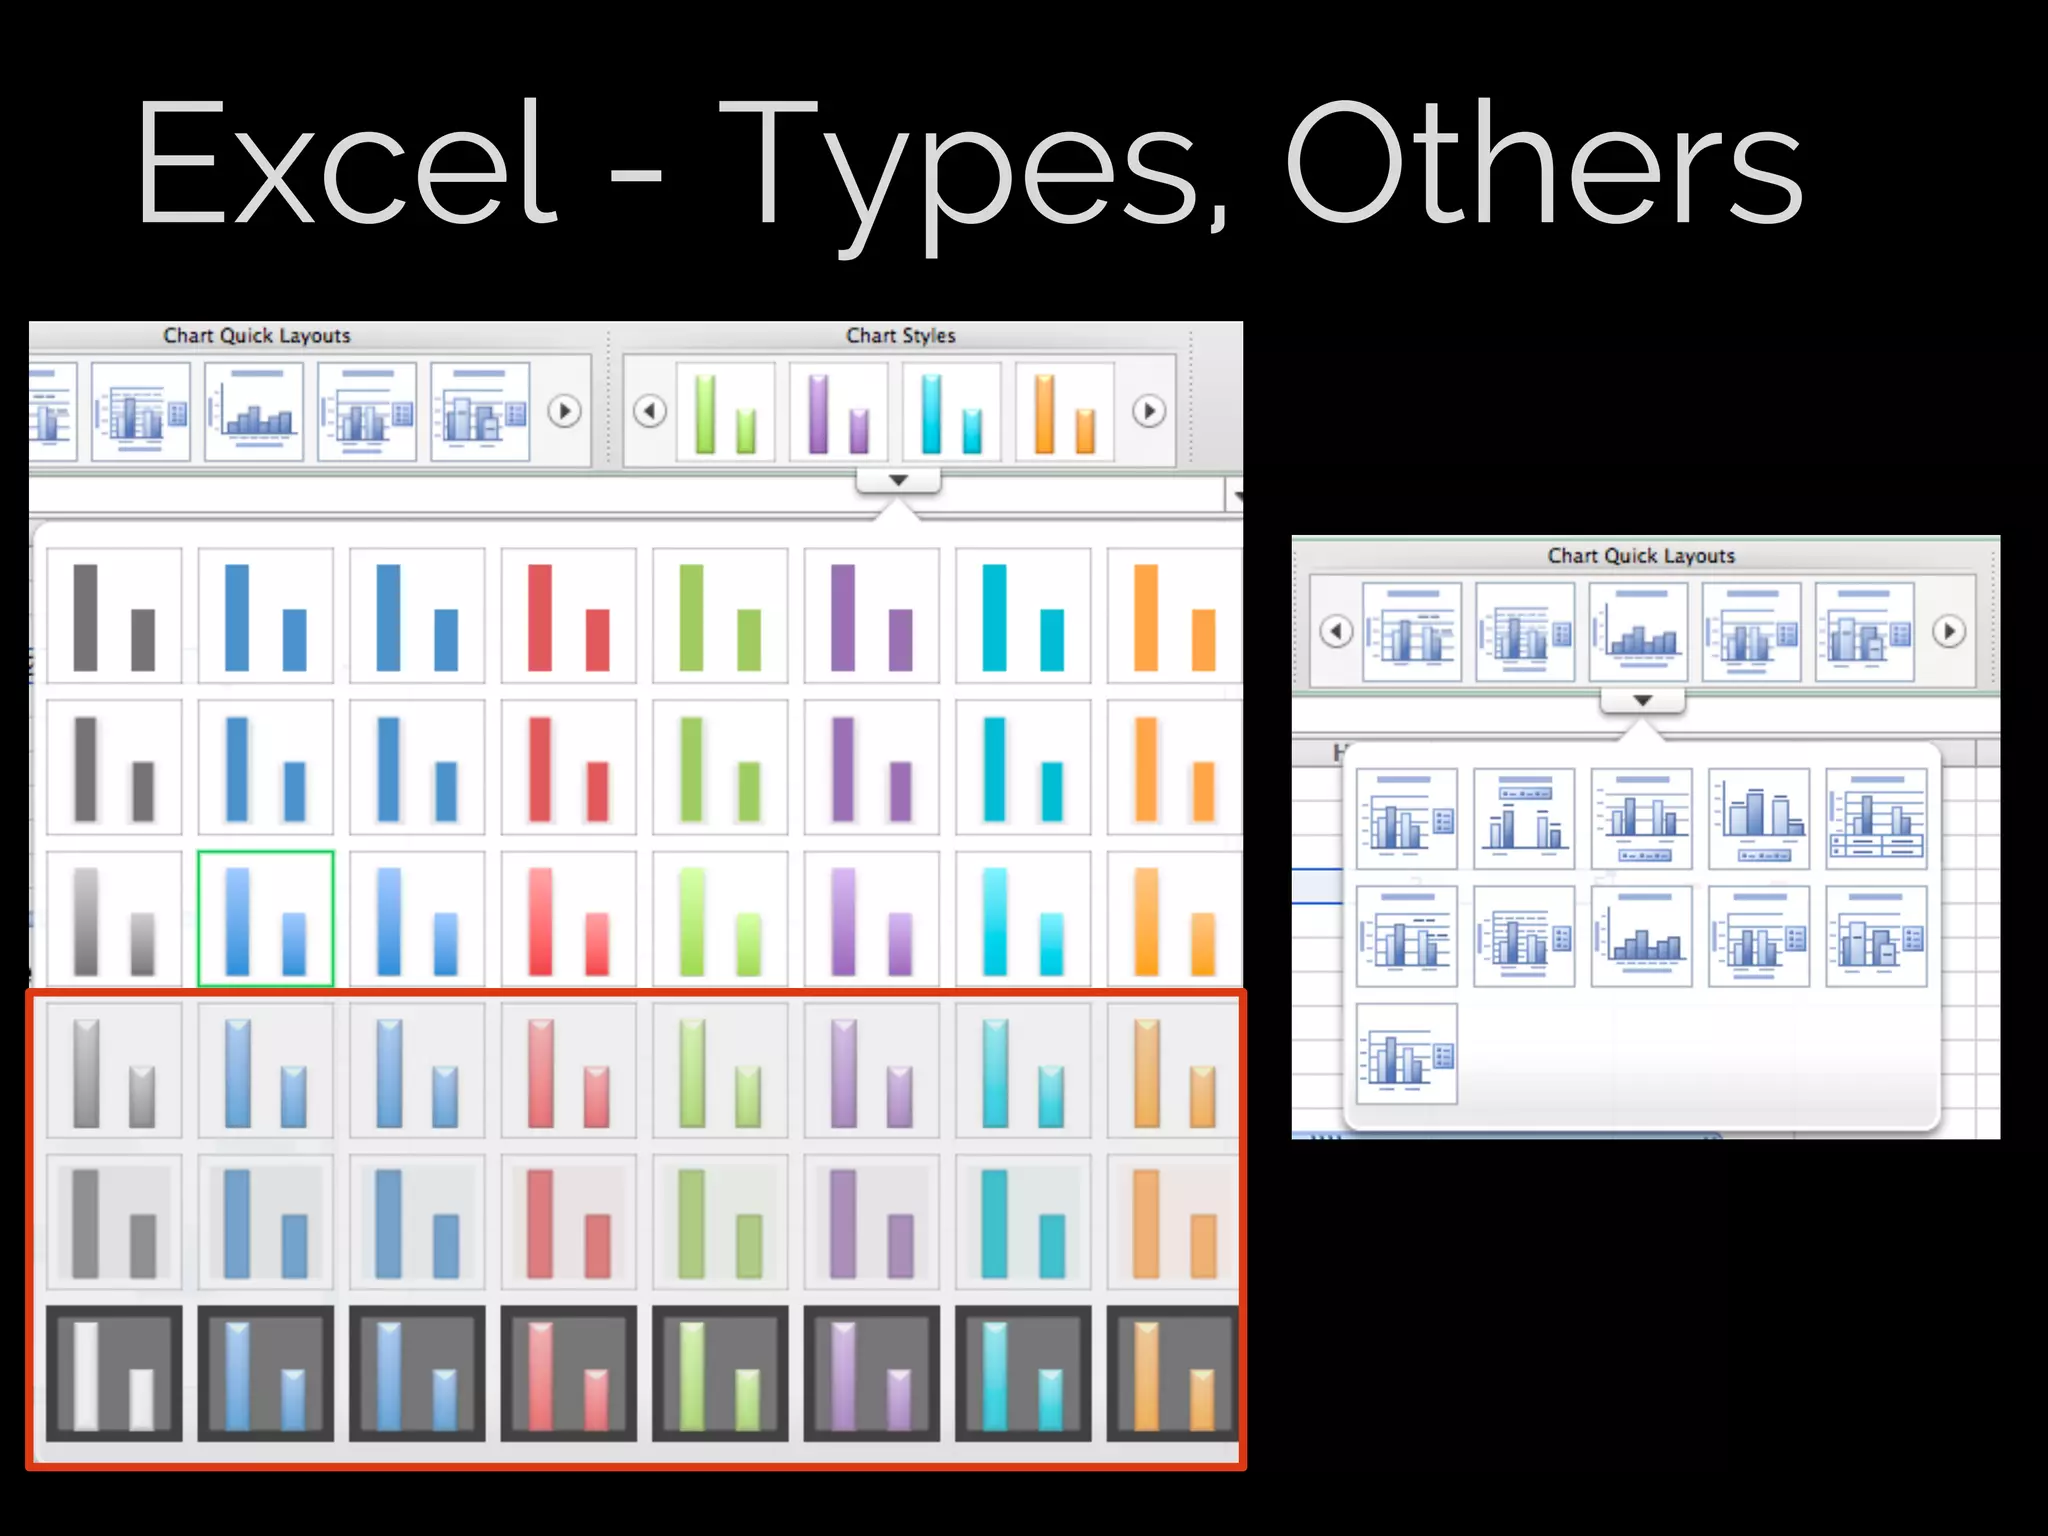
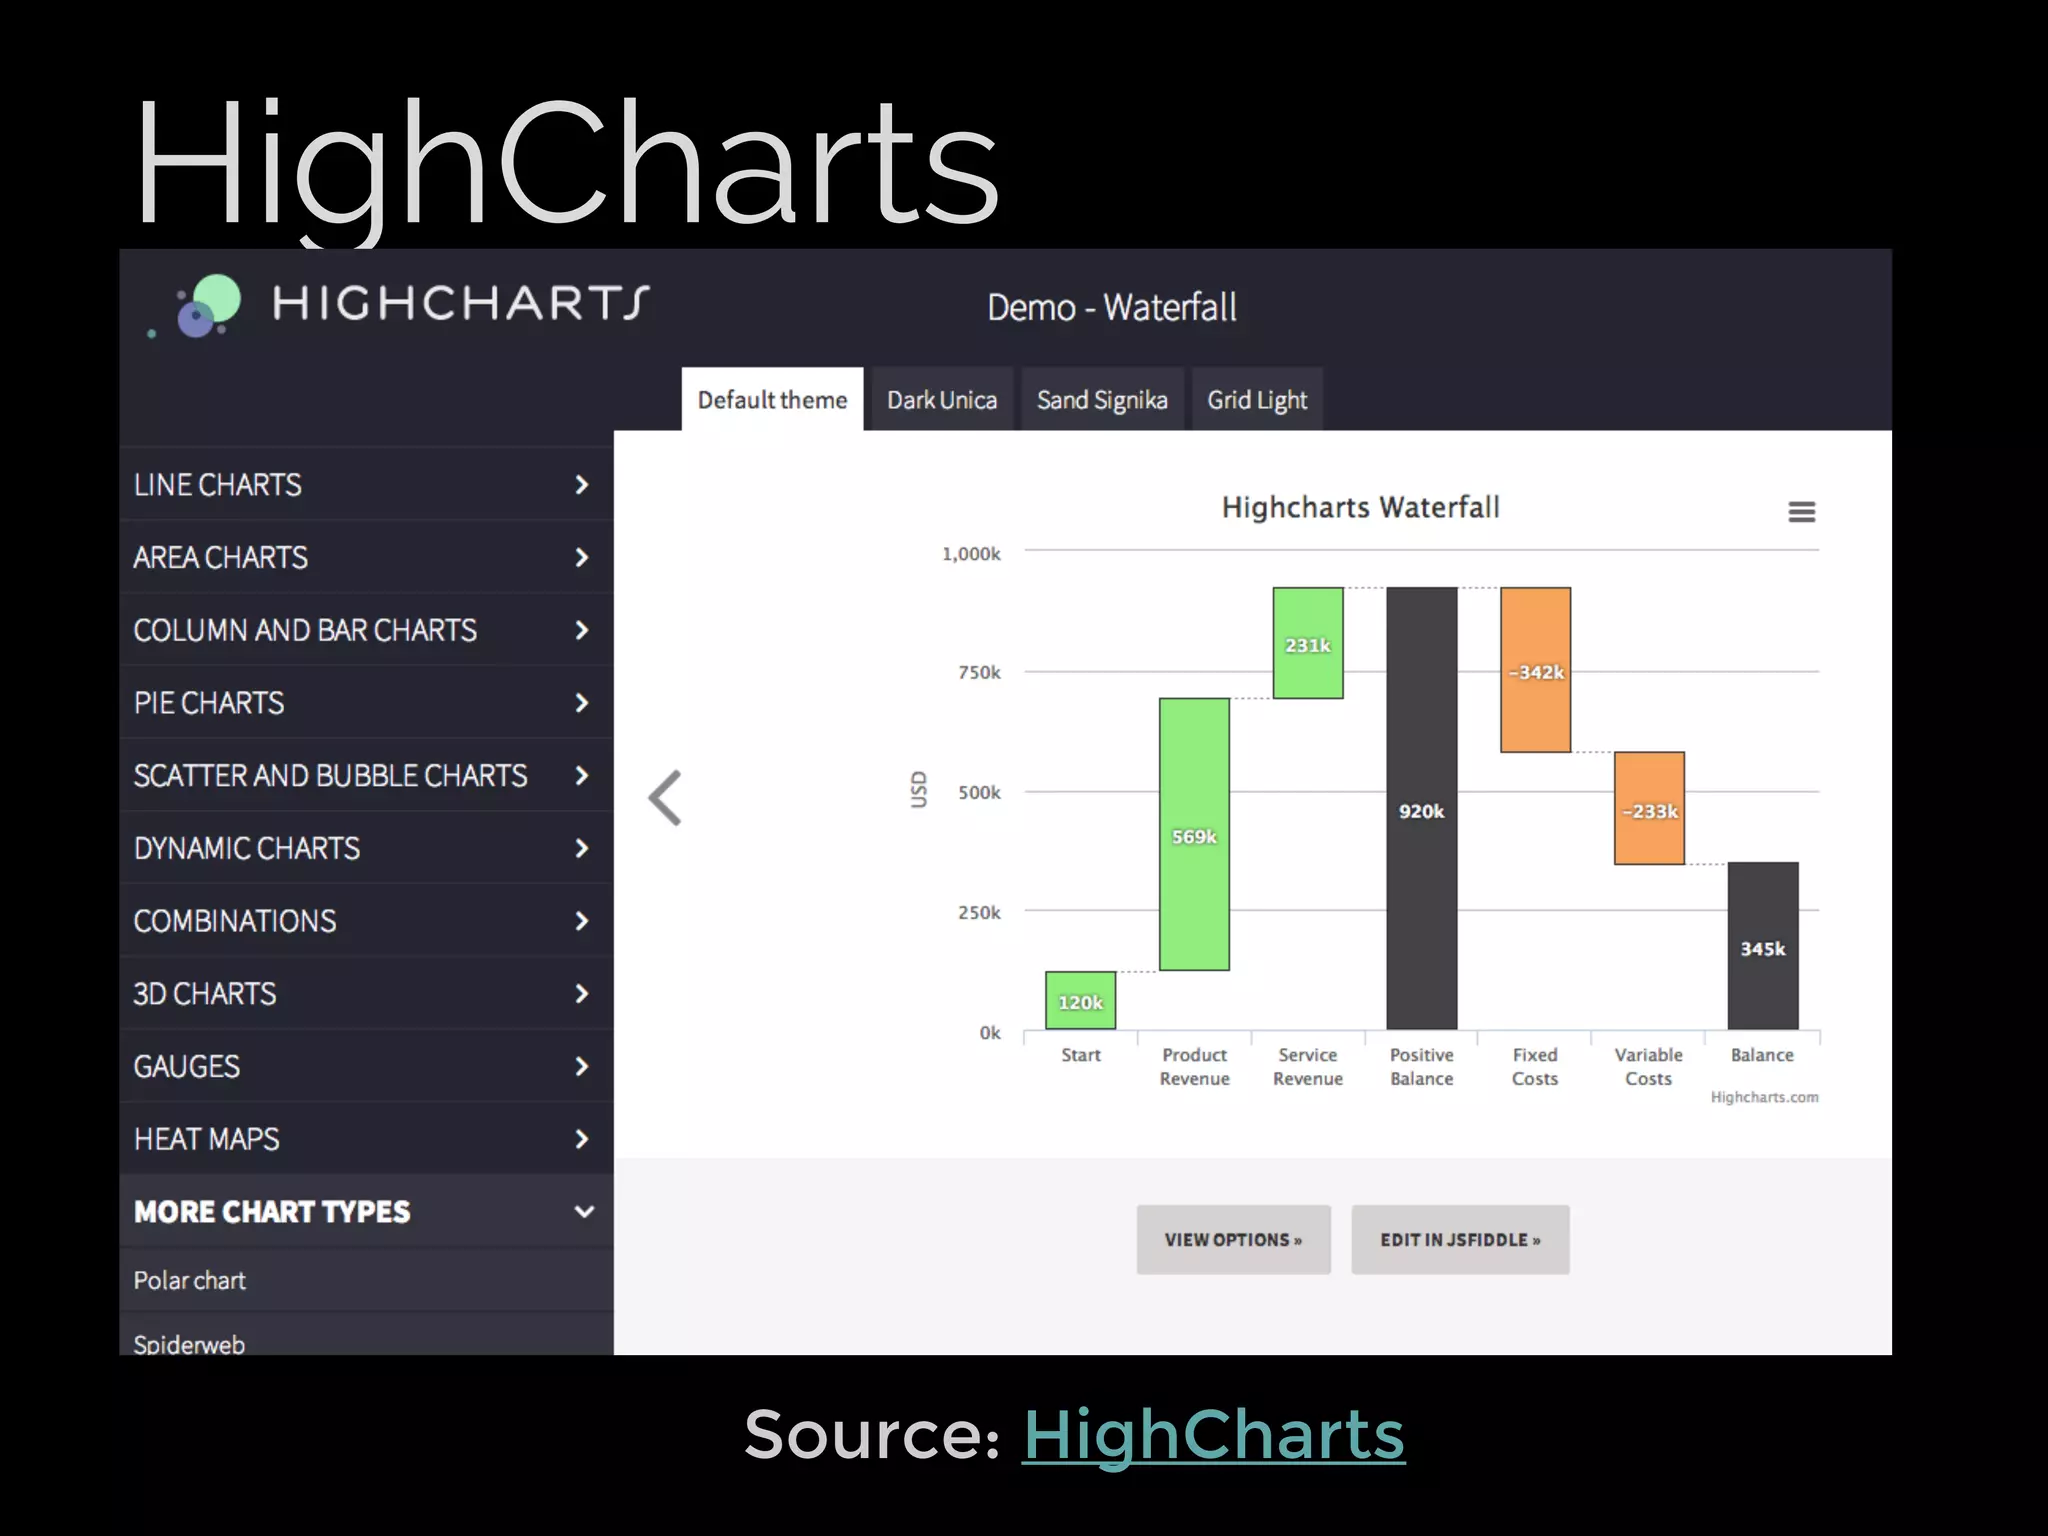
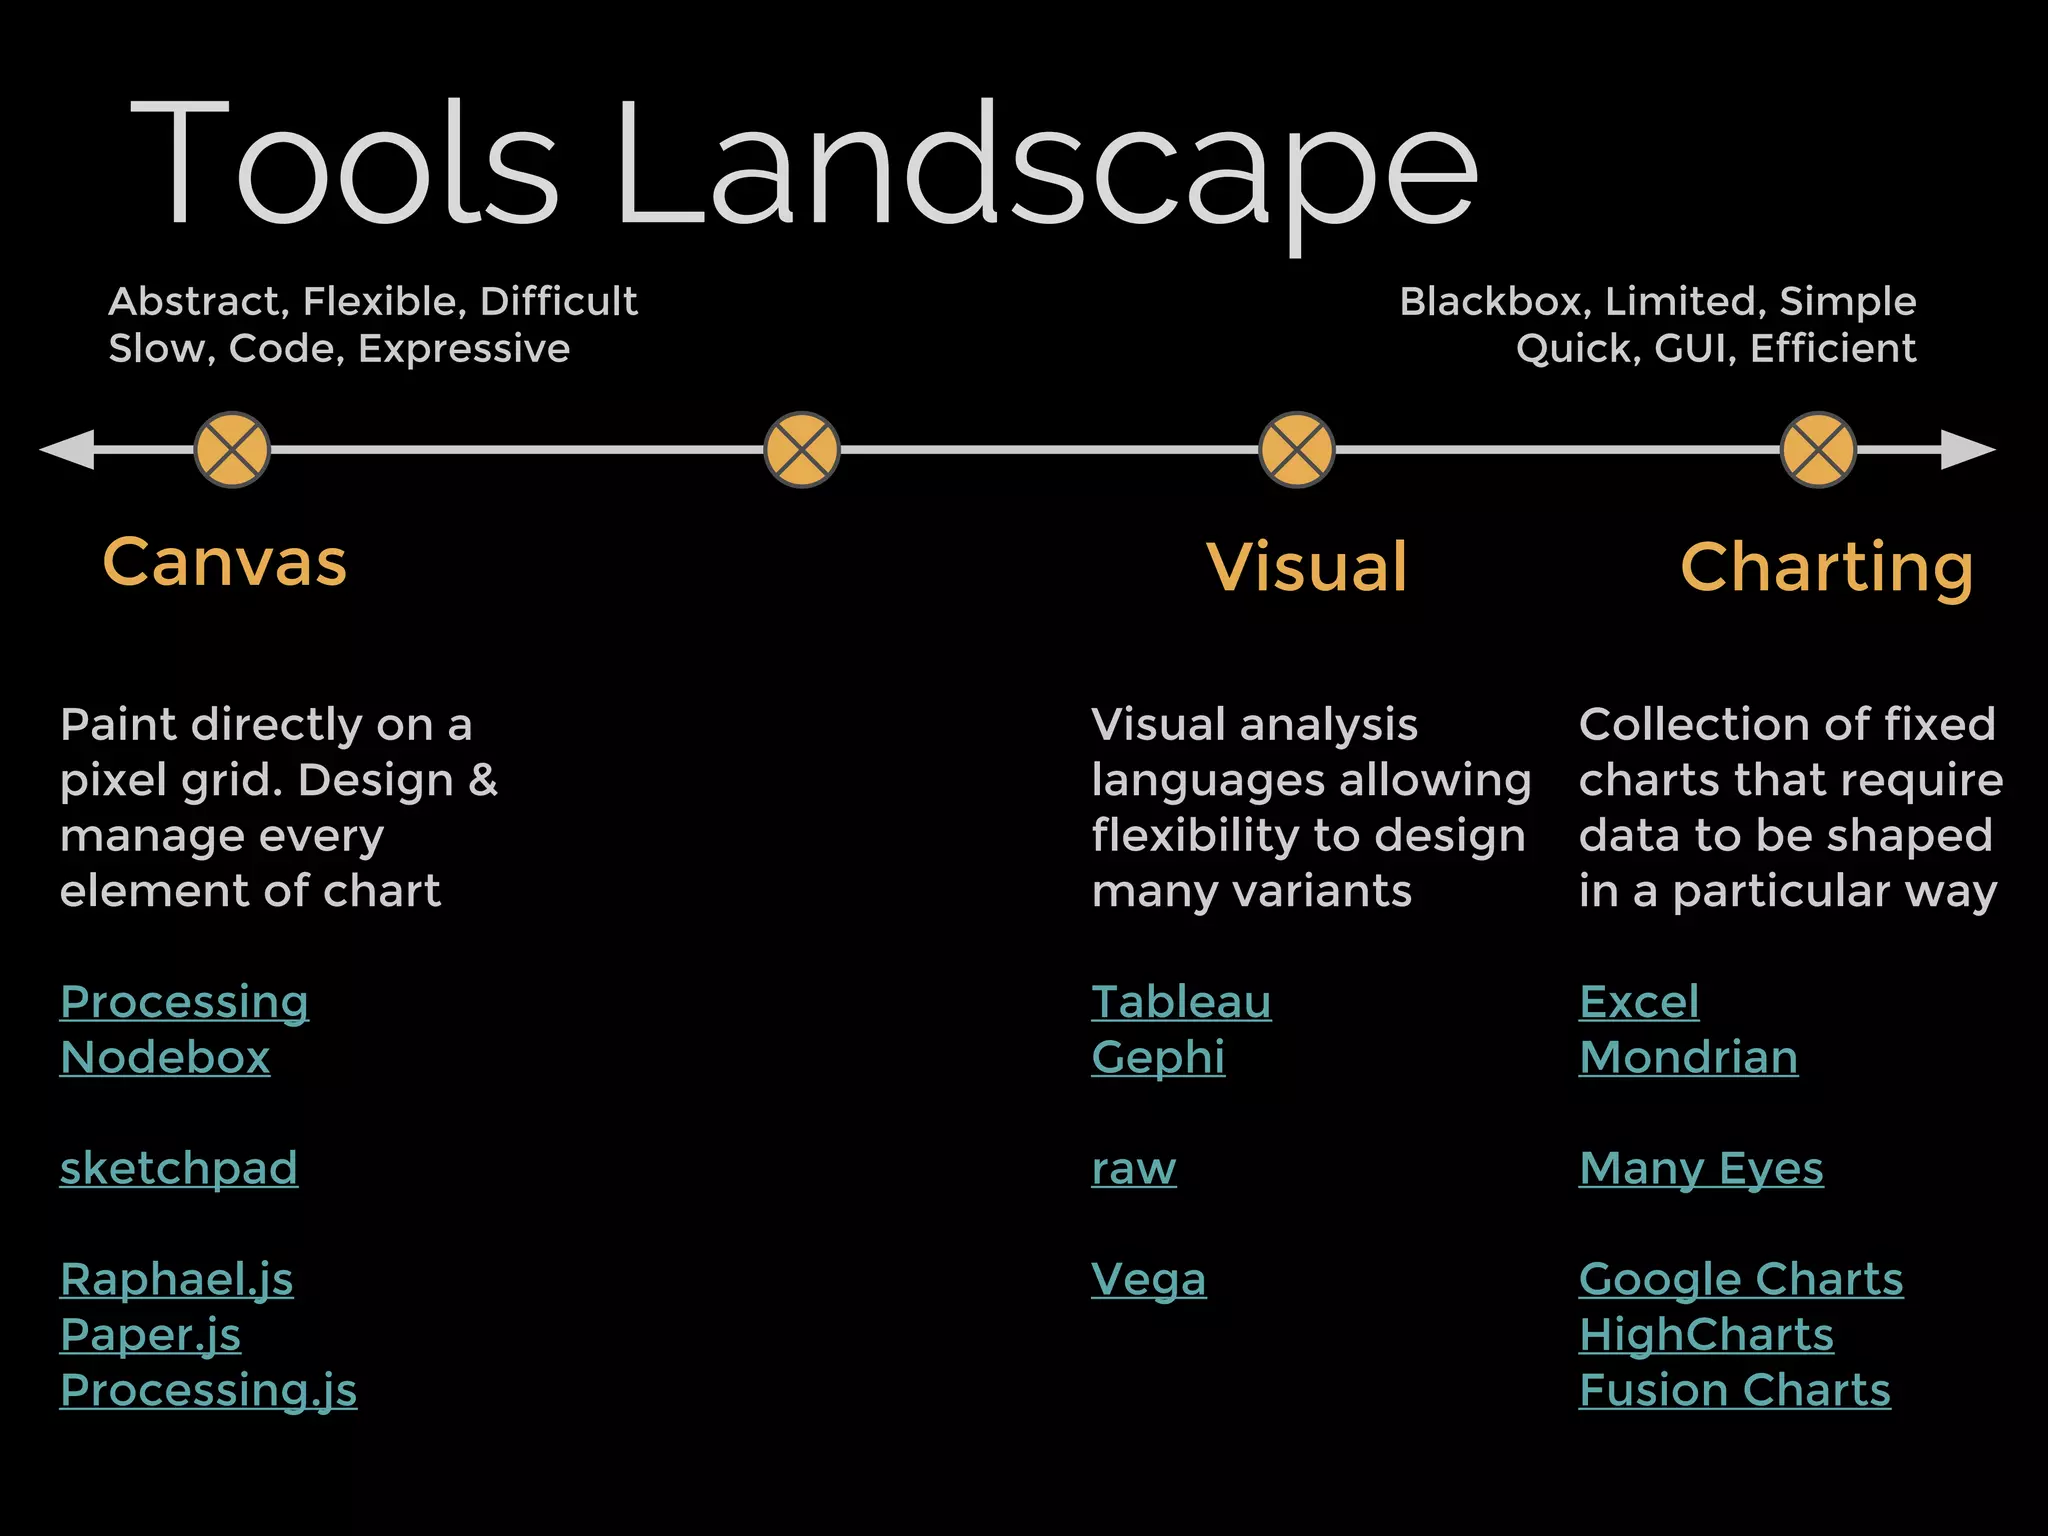
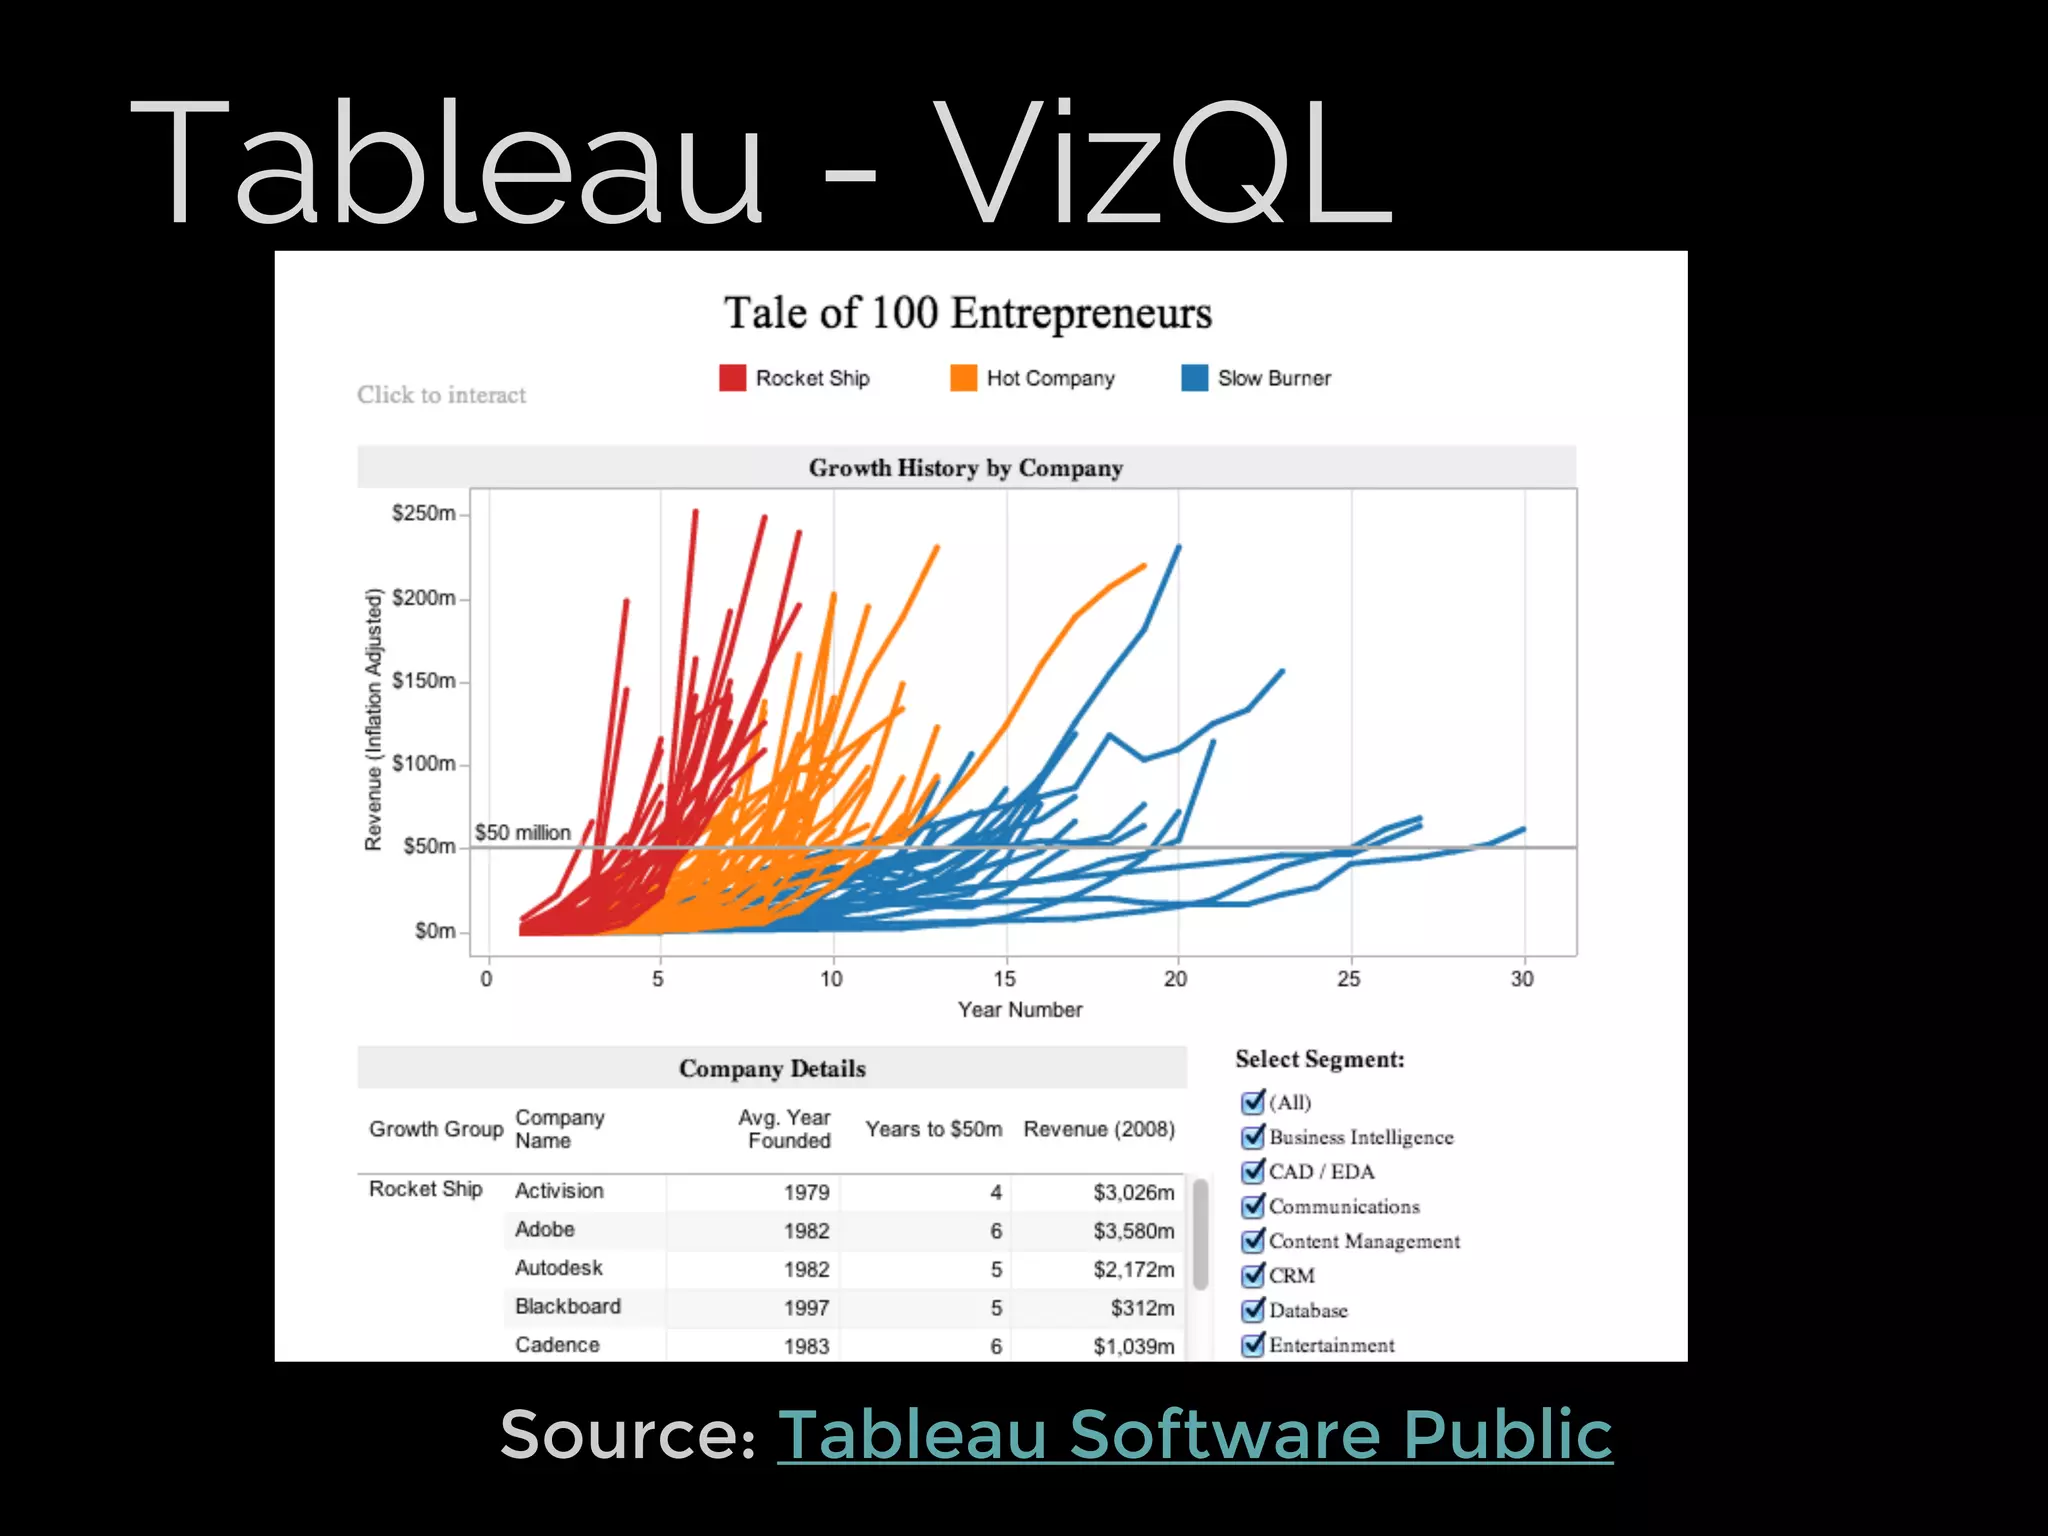
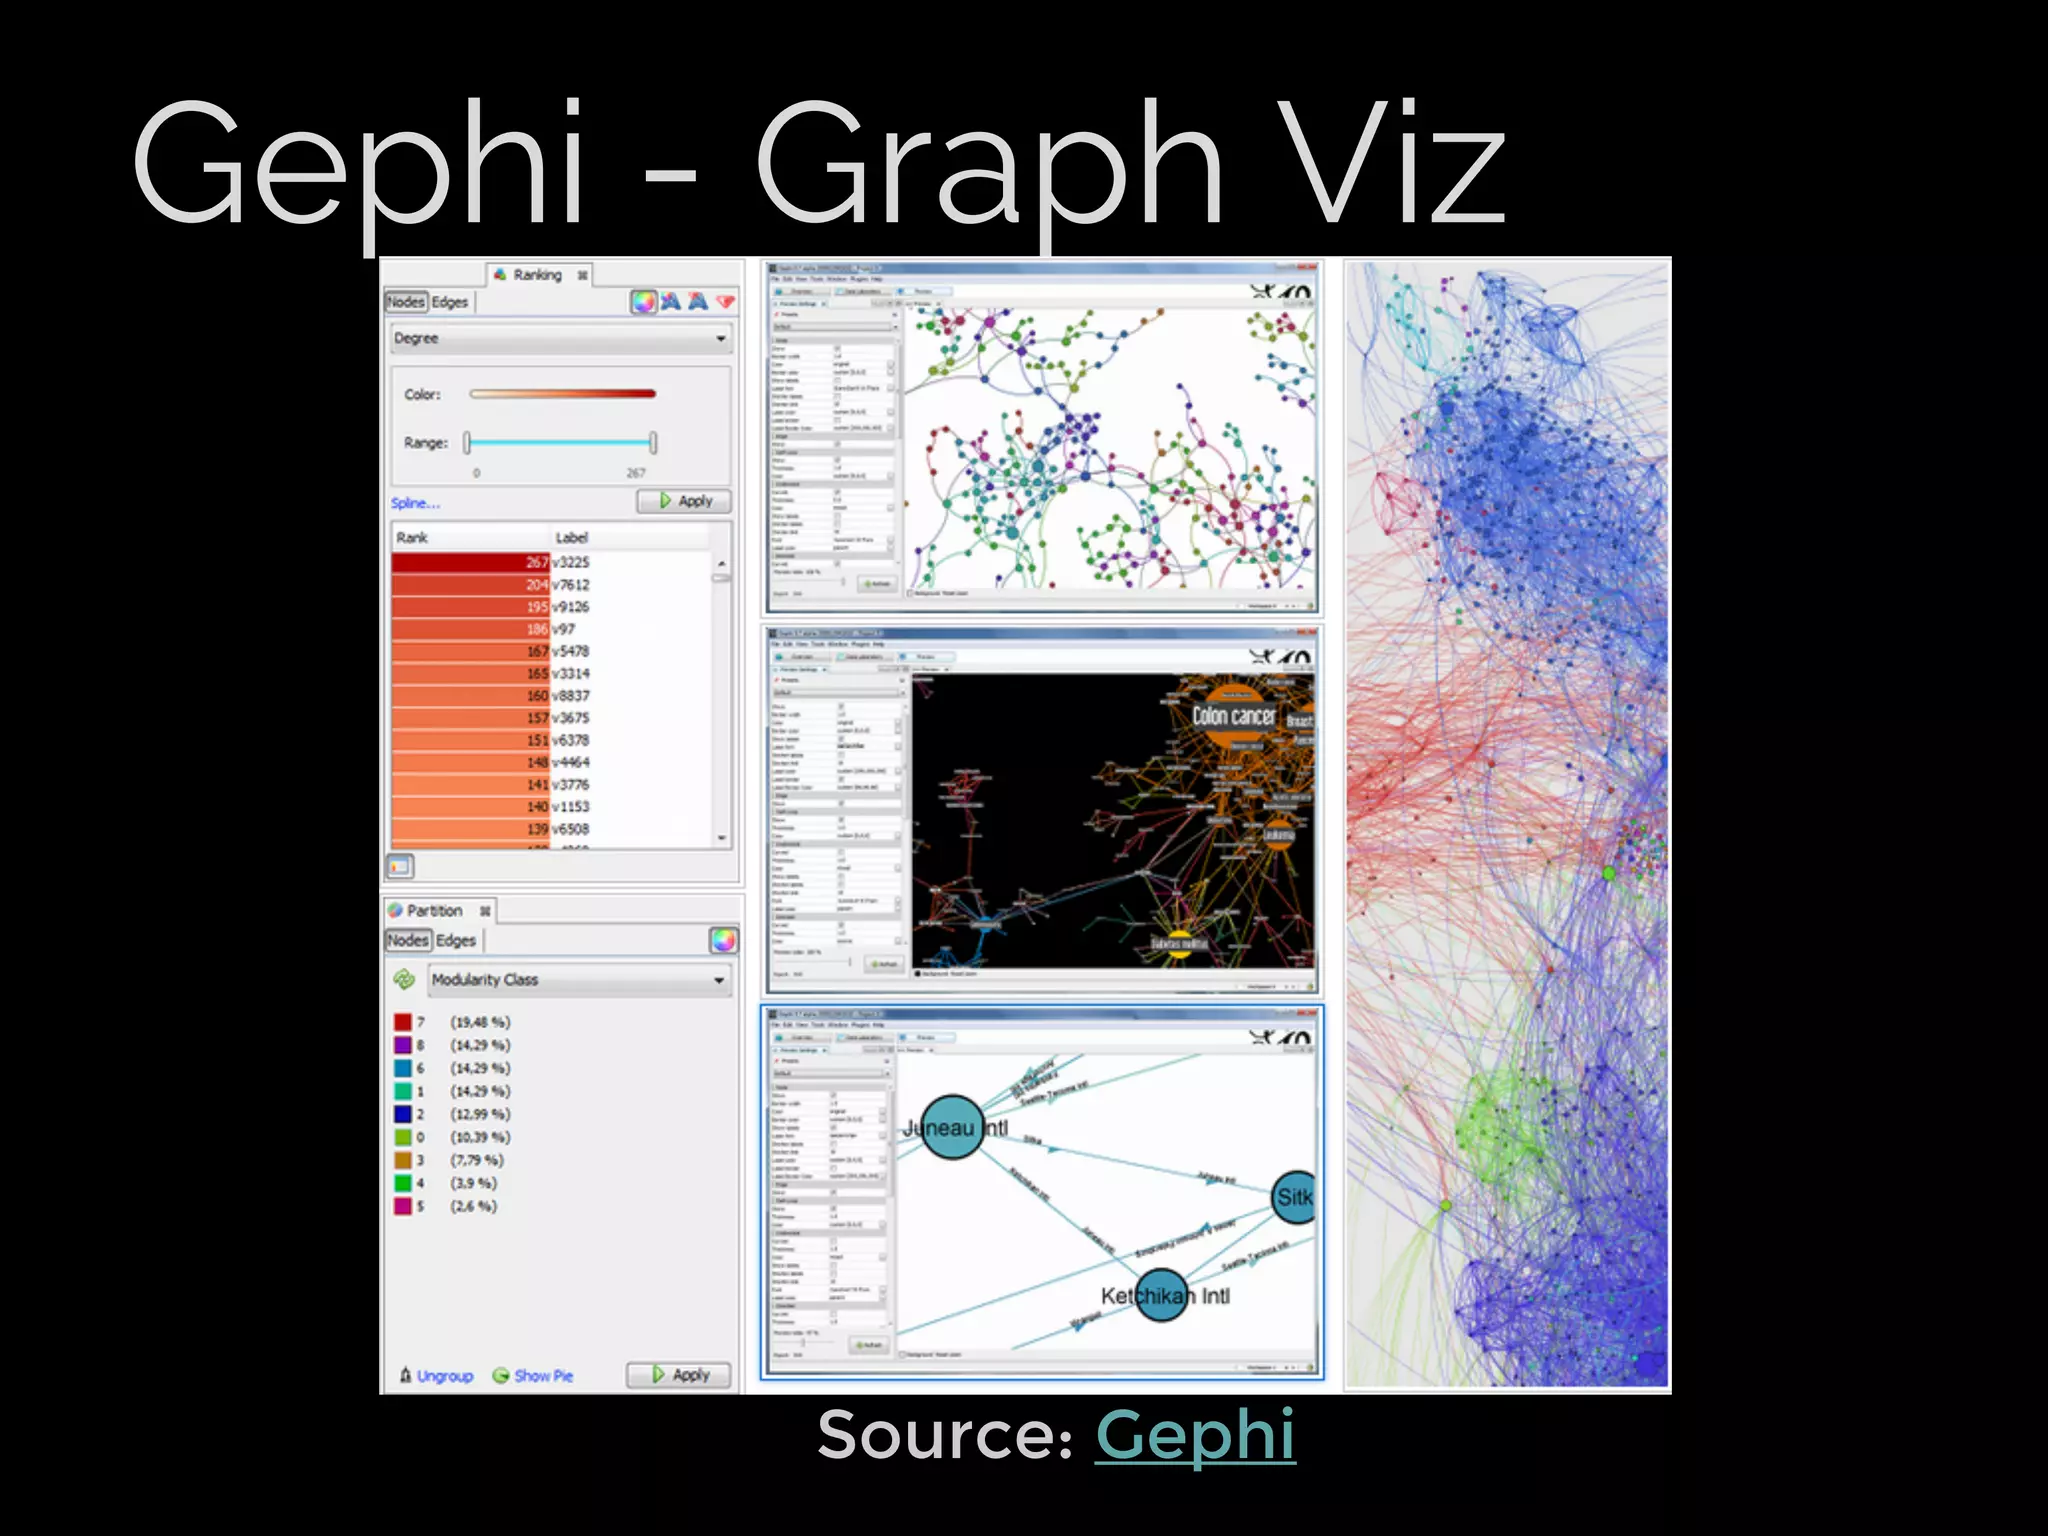
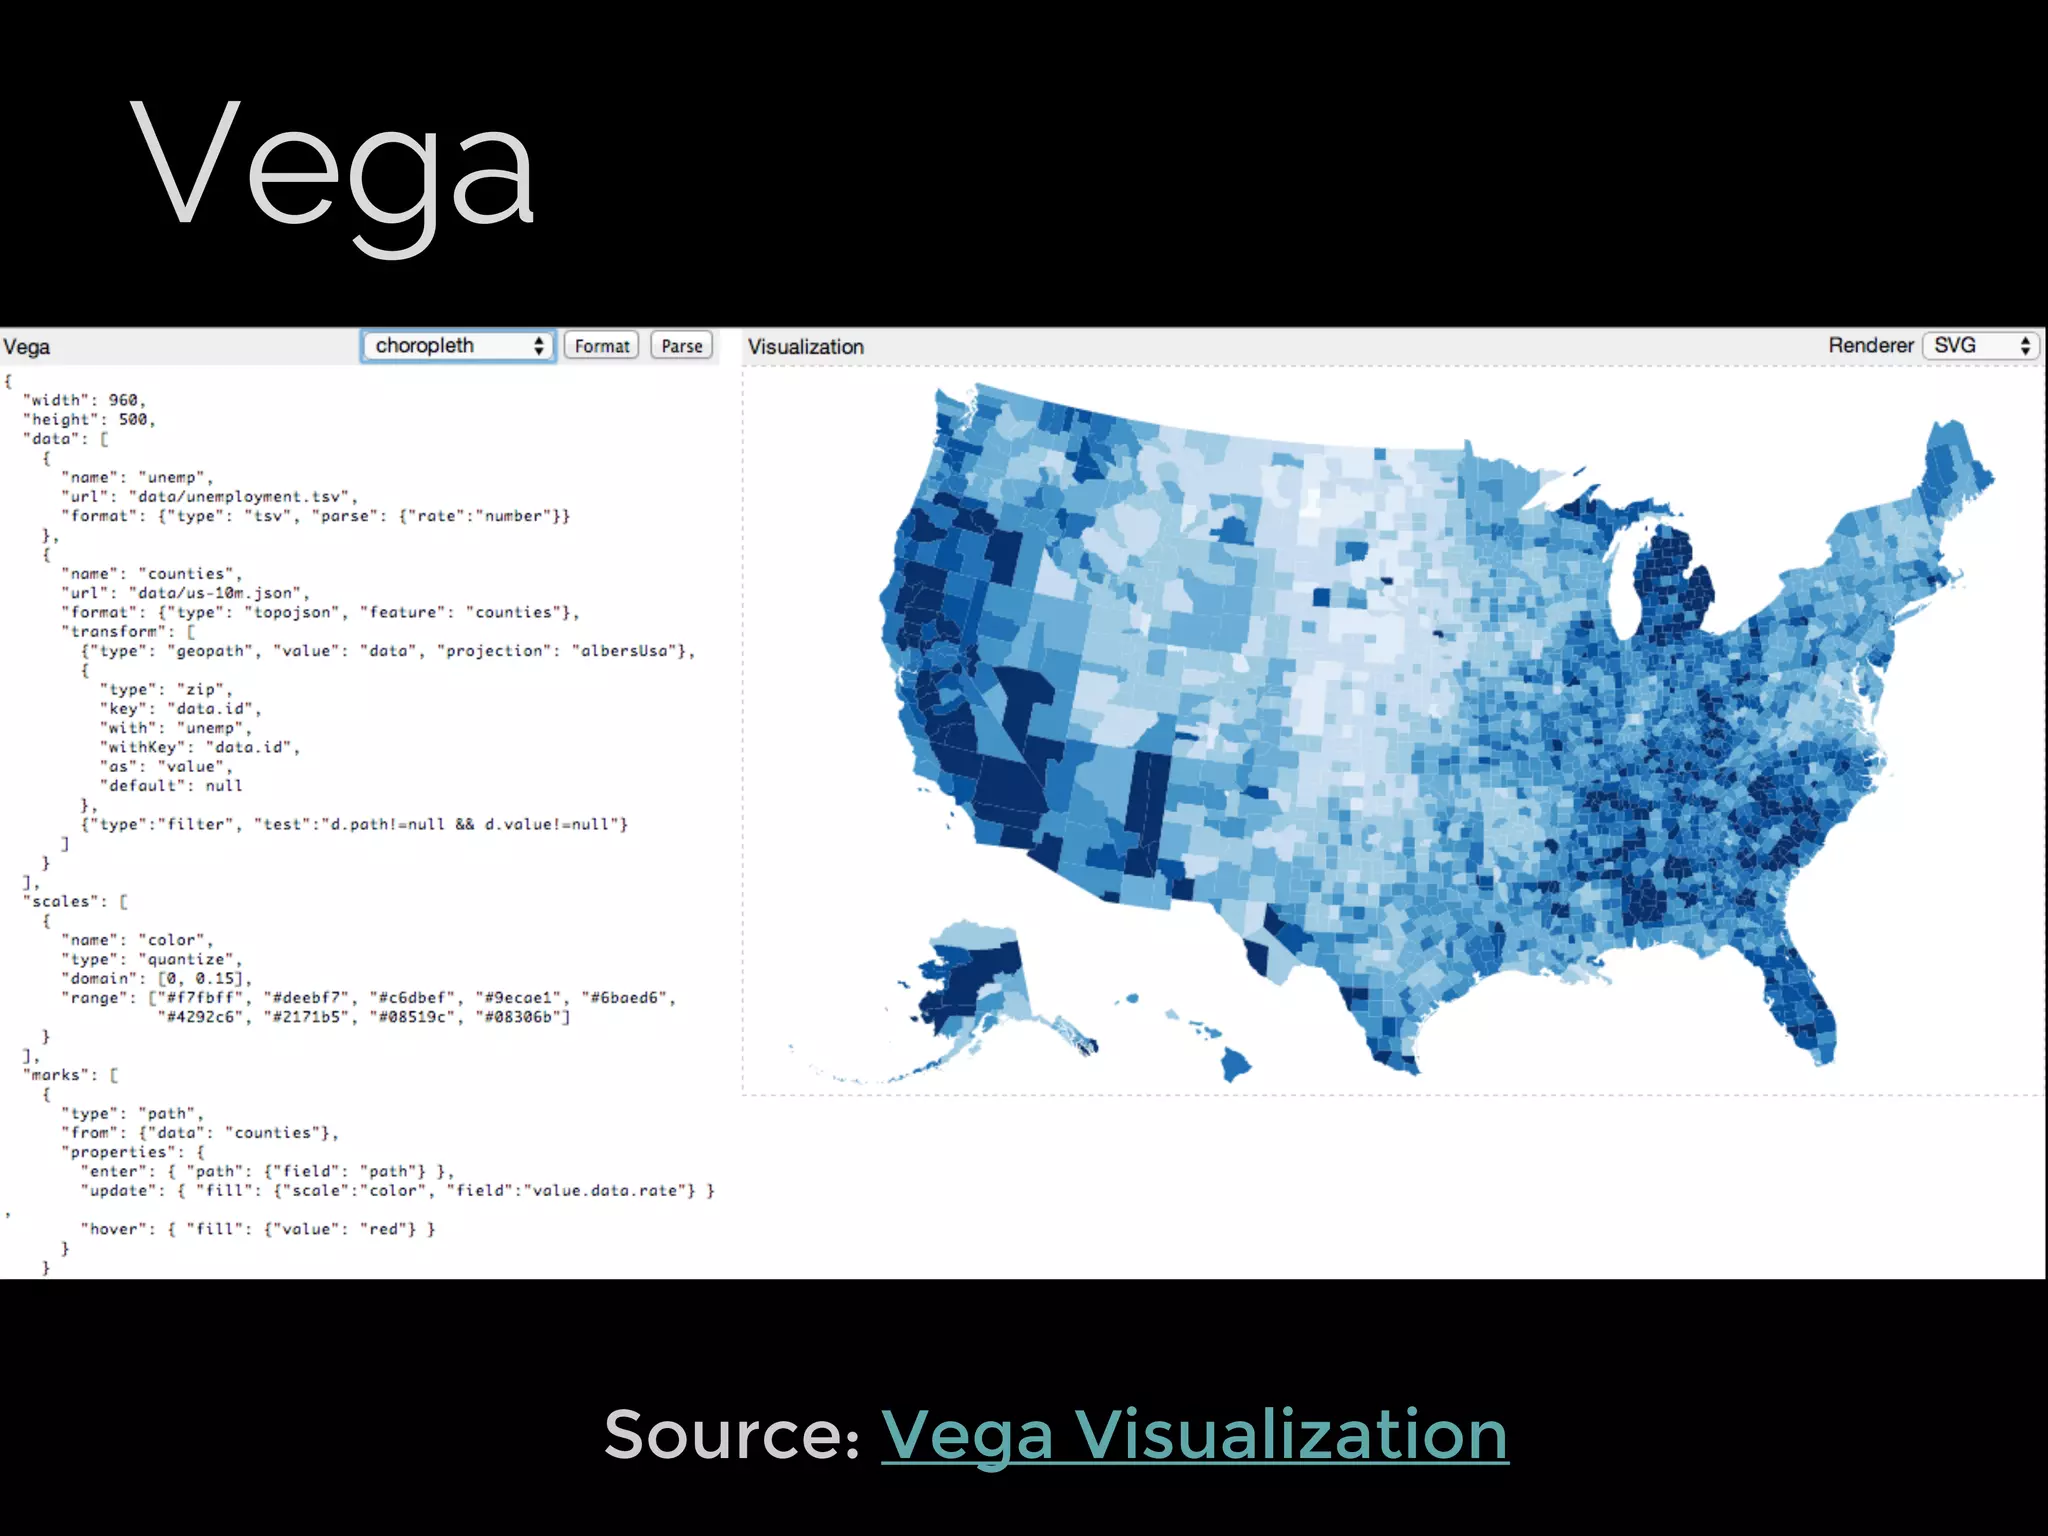
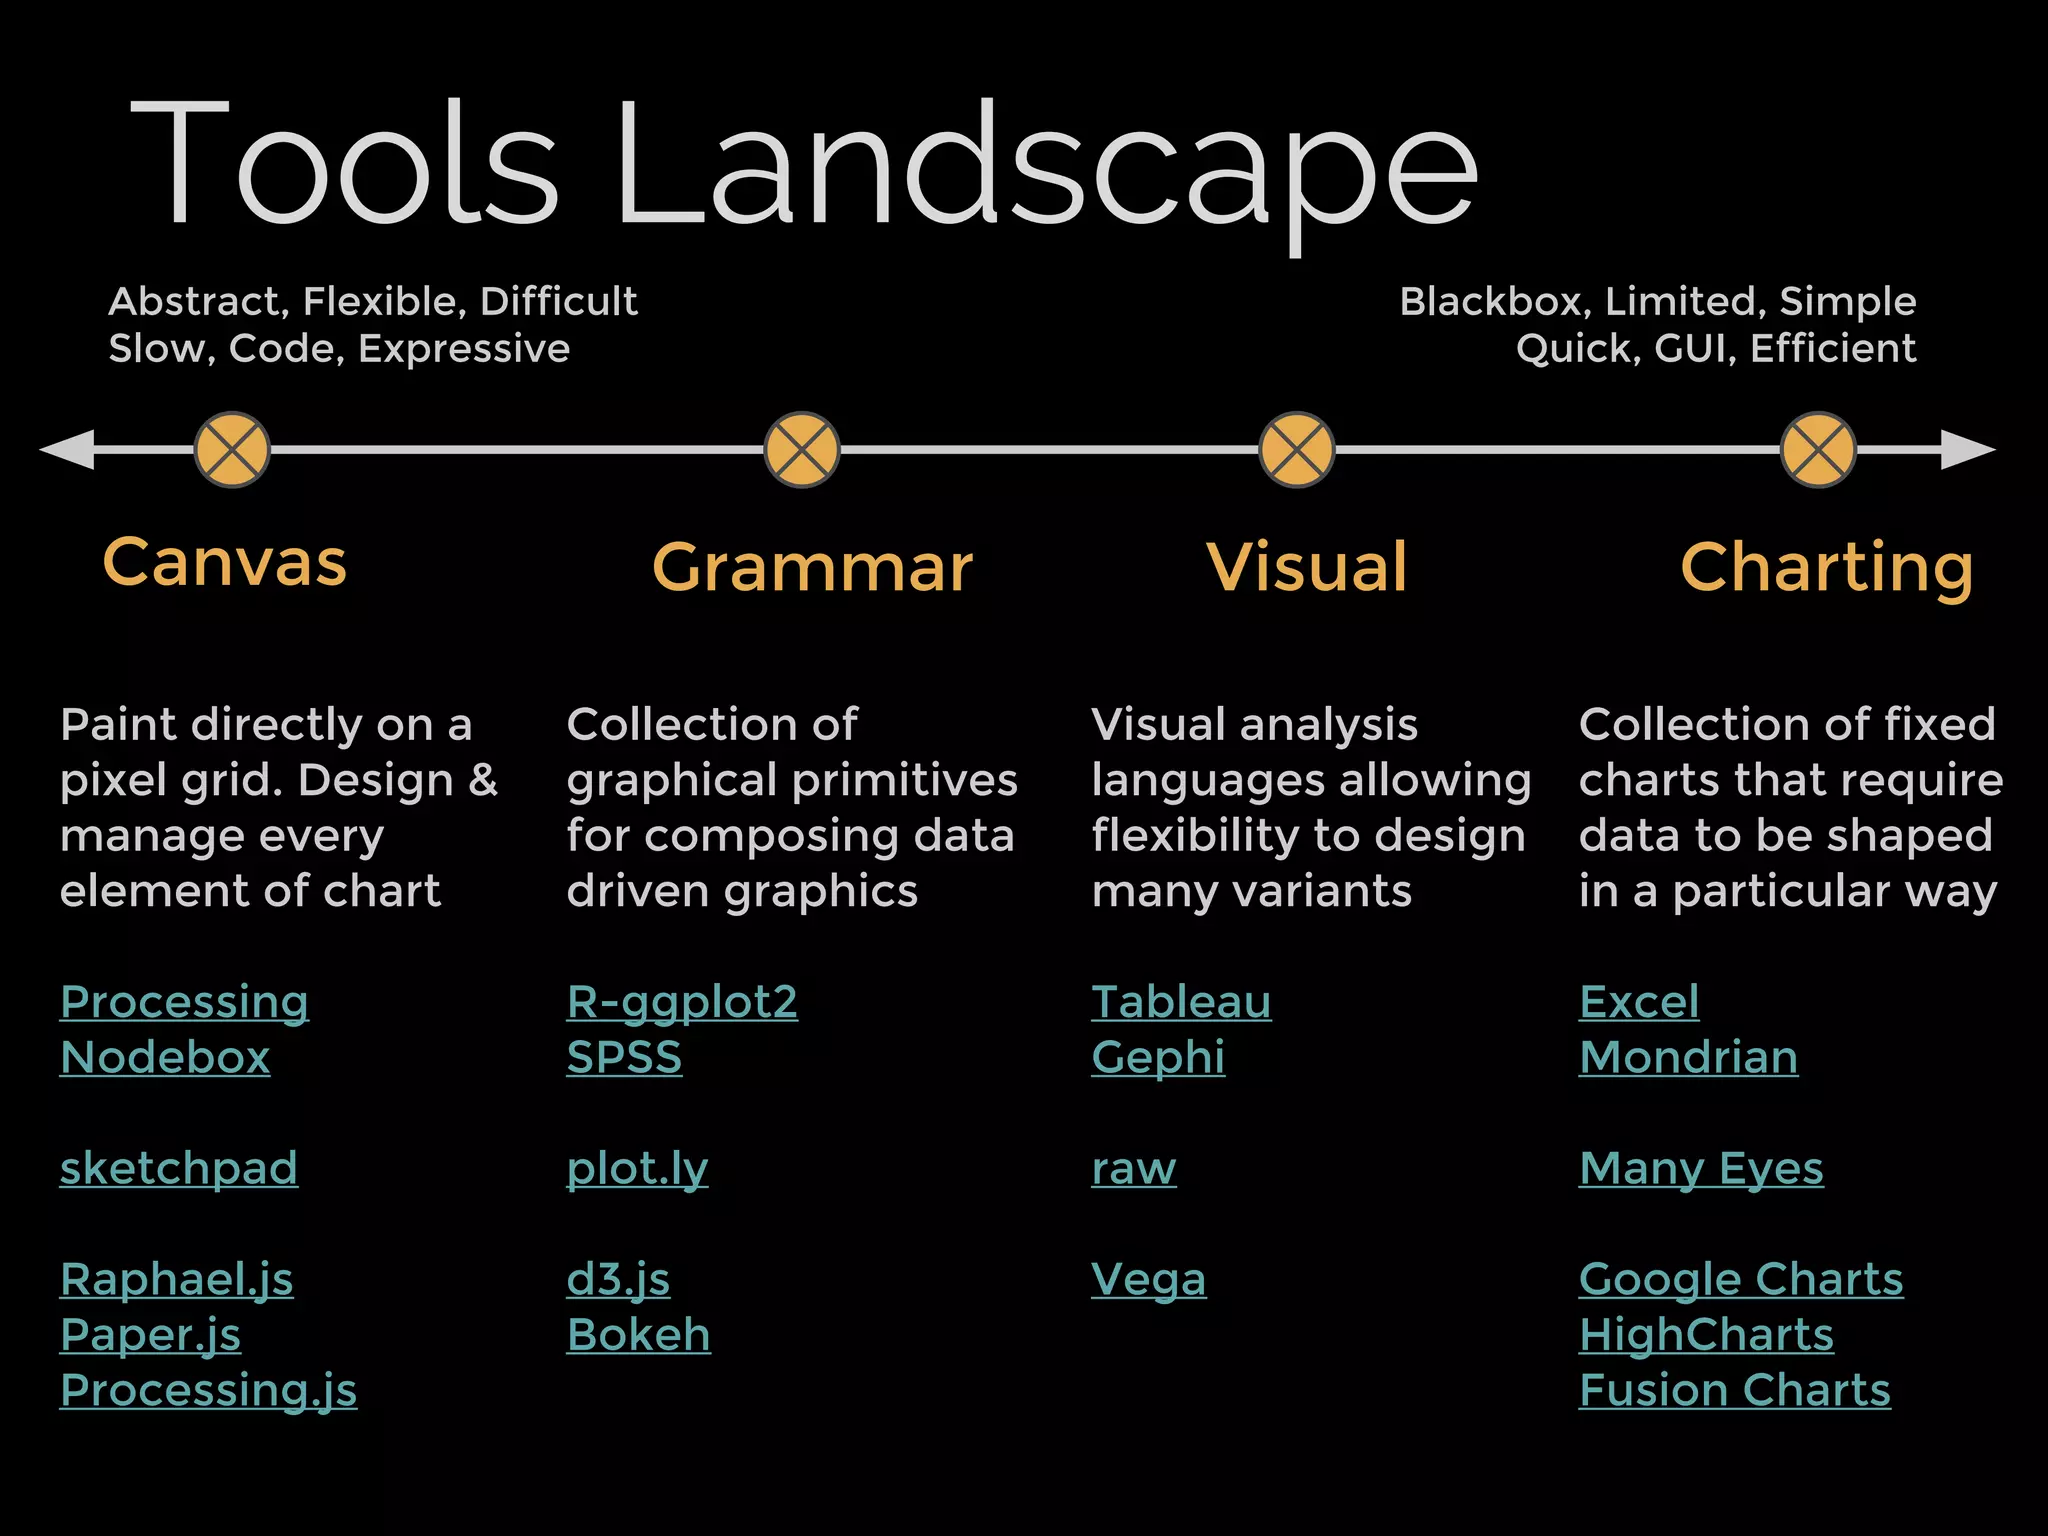
This document provides an overview of different tools and techniques for data visualization. It categorizes visualization tools as canvas (design every element), charting (collection of fixed charts), grammar (graphical primitives for composing graphics), and visual (flexible analysis languages). Examples of tools in each category are given along with short descriptions. Foundational works, processes, storytelling techniques, blogs, courses, and resources for data visualization are also listed.


![RTP_AR_Basic_Learners' Workbook_KS2 [FOR REPRODUCTION] (1).pdf](https://cdn.slidesharecdn.com/ss_thumbnails/rtparbasiclearnersworkbookks2forreproduction1-251016024943-e51a16ac-thumbnail.jpg?width=600ounds&width=560&fit=bounds)
![Matrix and determinant URT [Autosaved].pptx](https://cdn.slidesharecdn.com/ss_thumbnails/matrixanddeterminanturtautosaved-251018190340-9e6a6deb-thumbnail.jpg?width=600ounds&width=560&fit=bounds)


