Download as PDF, PPTX

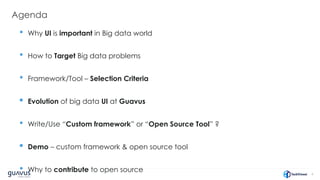
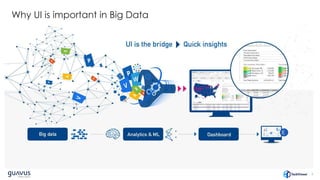
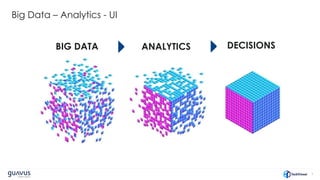
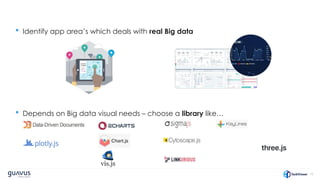


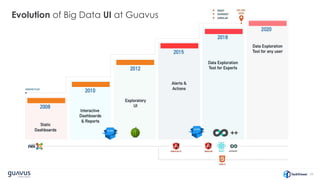
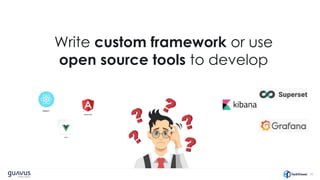
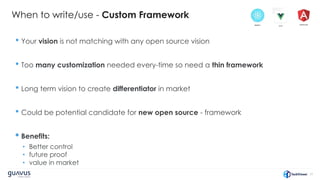


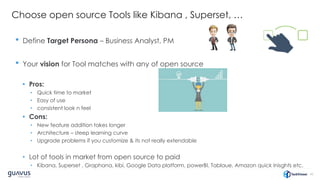
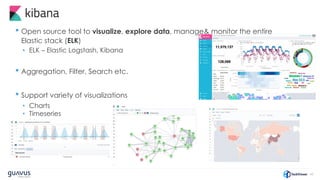


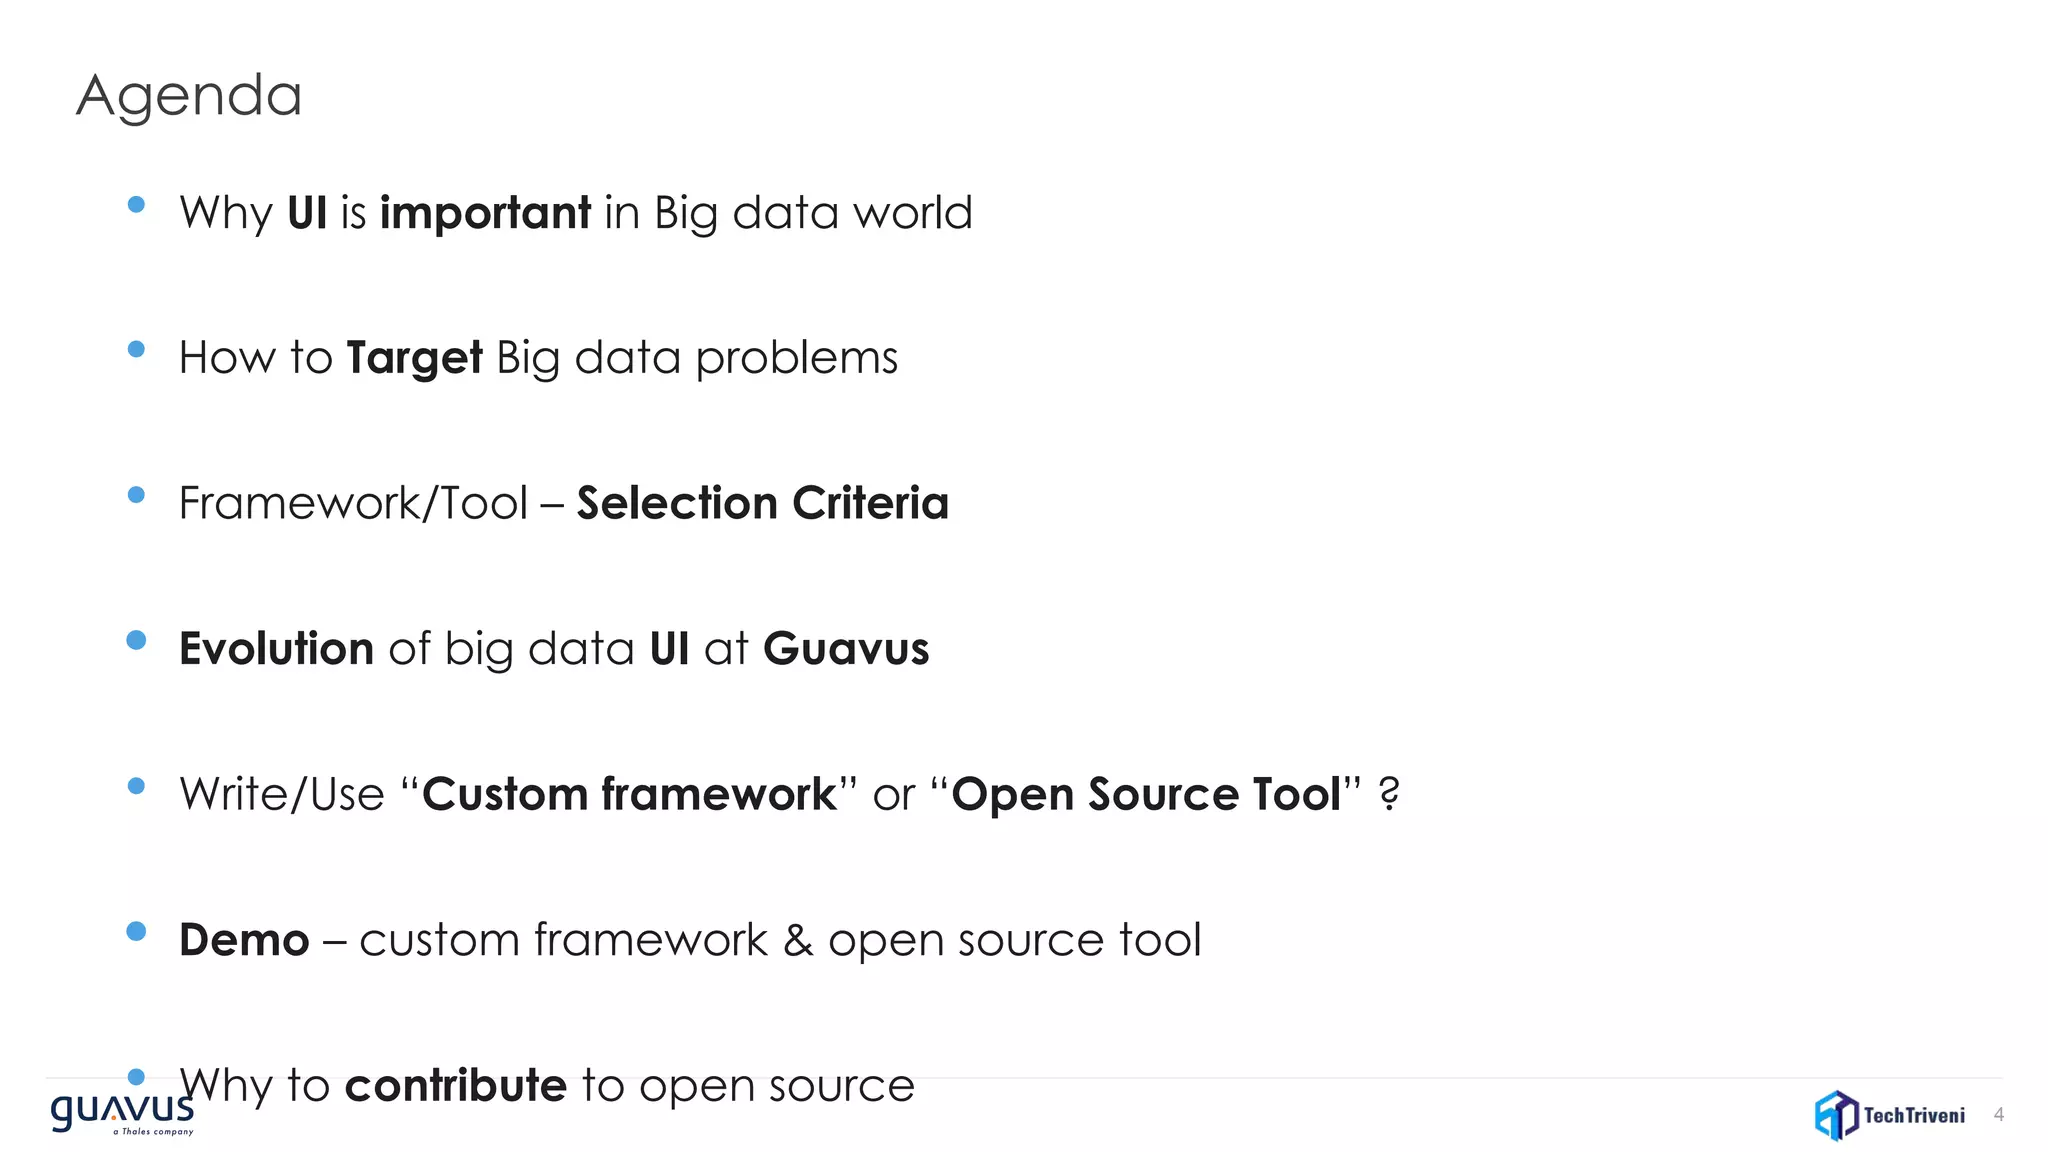


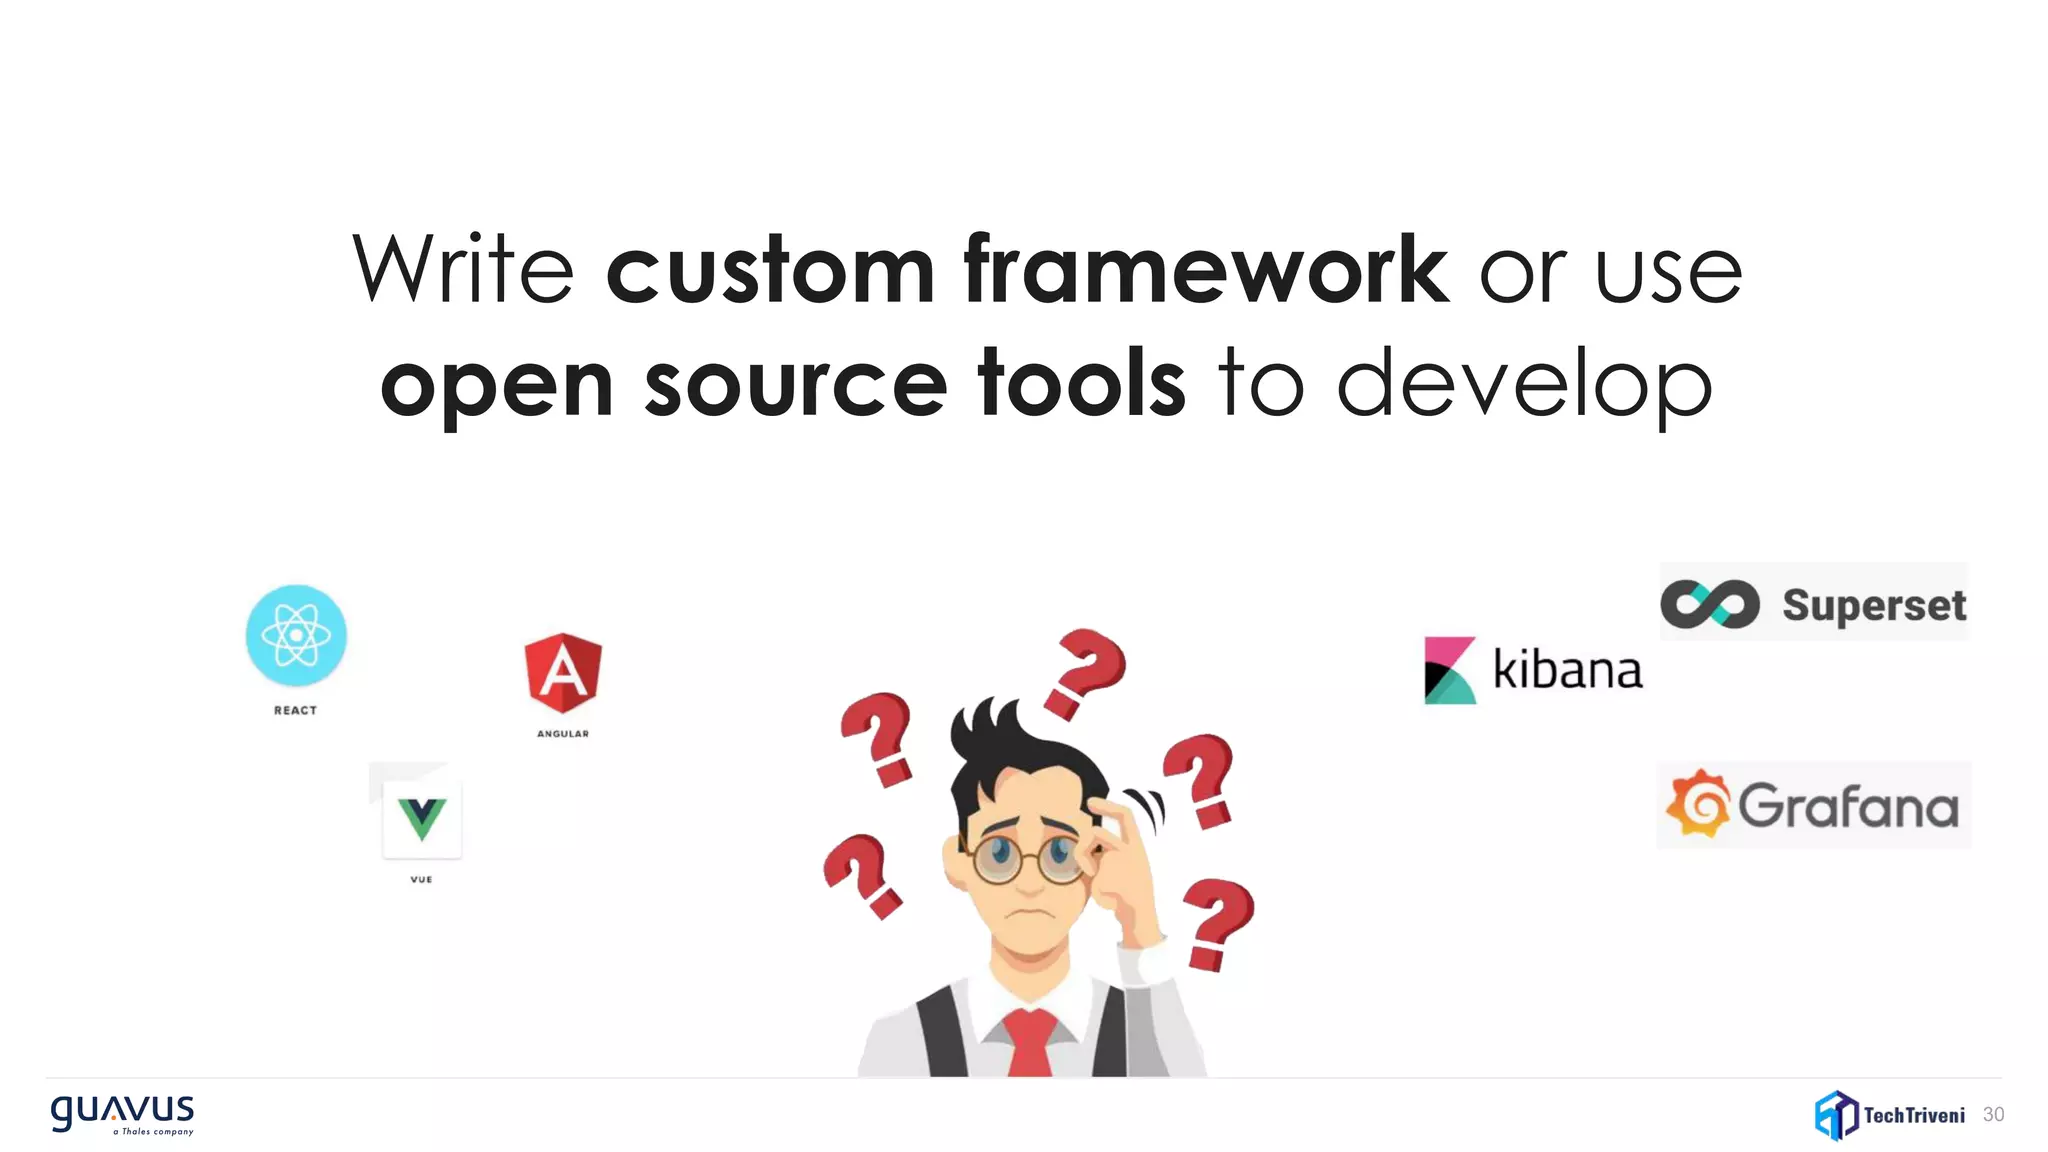
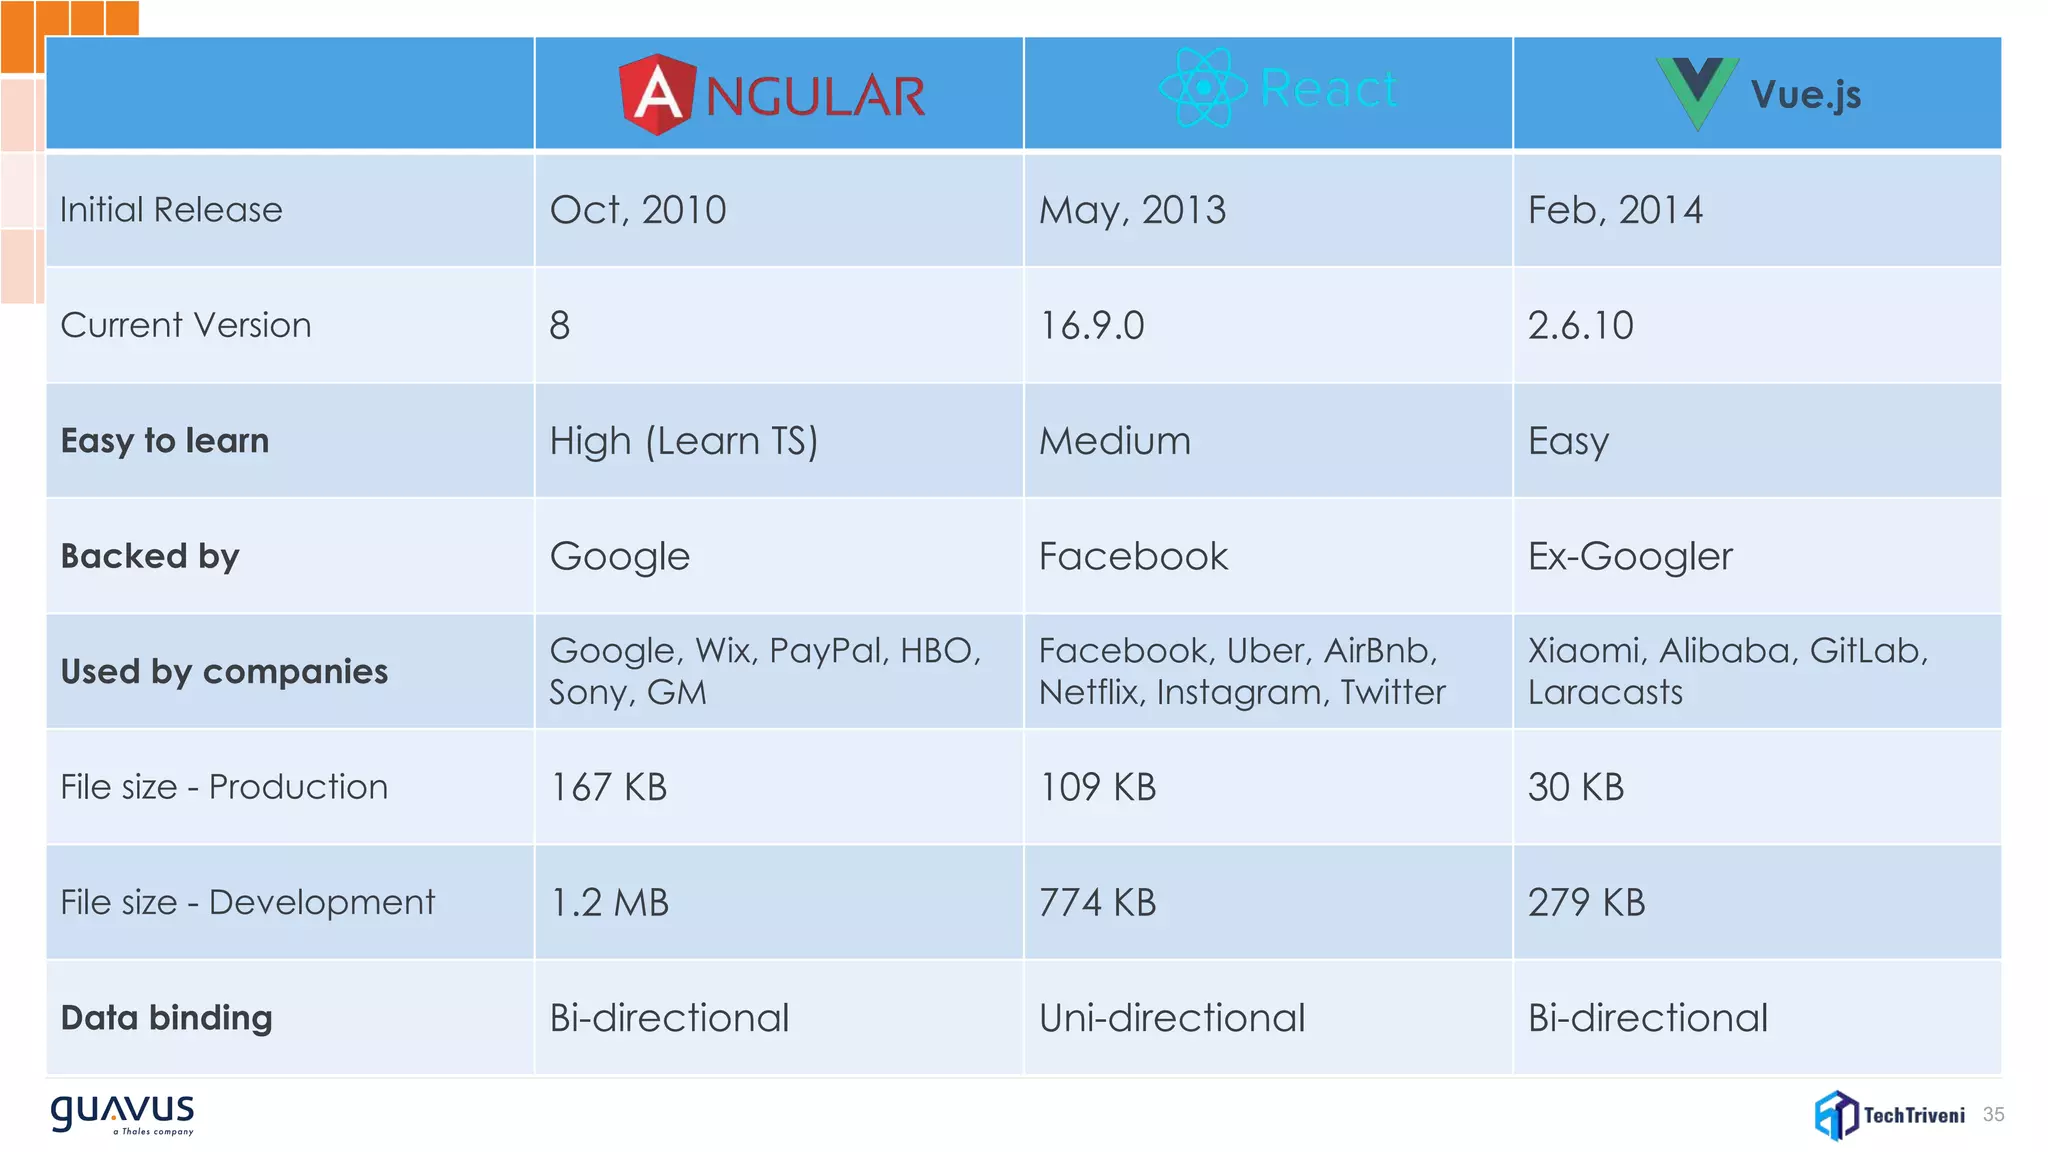
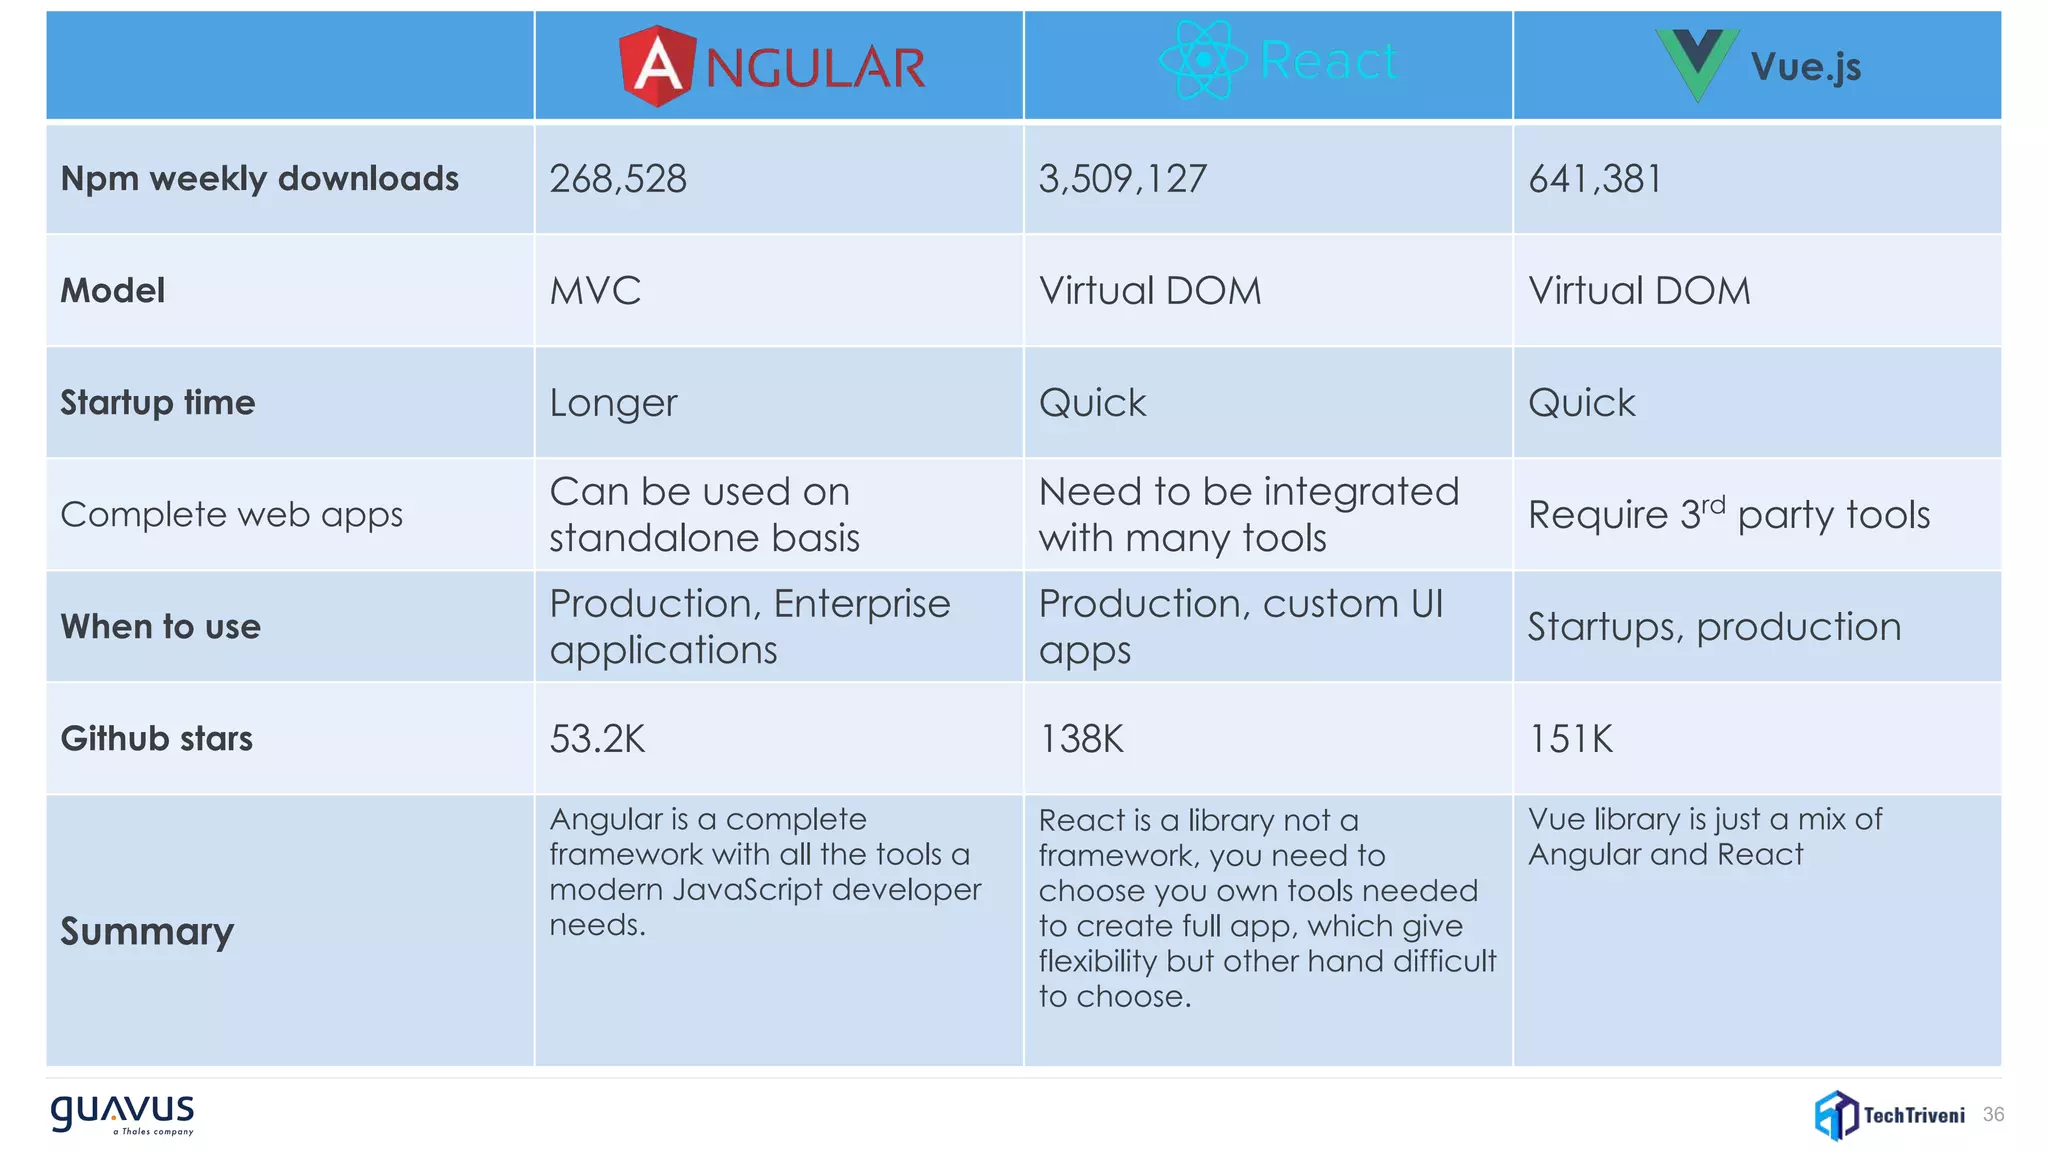

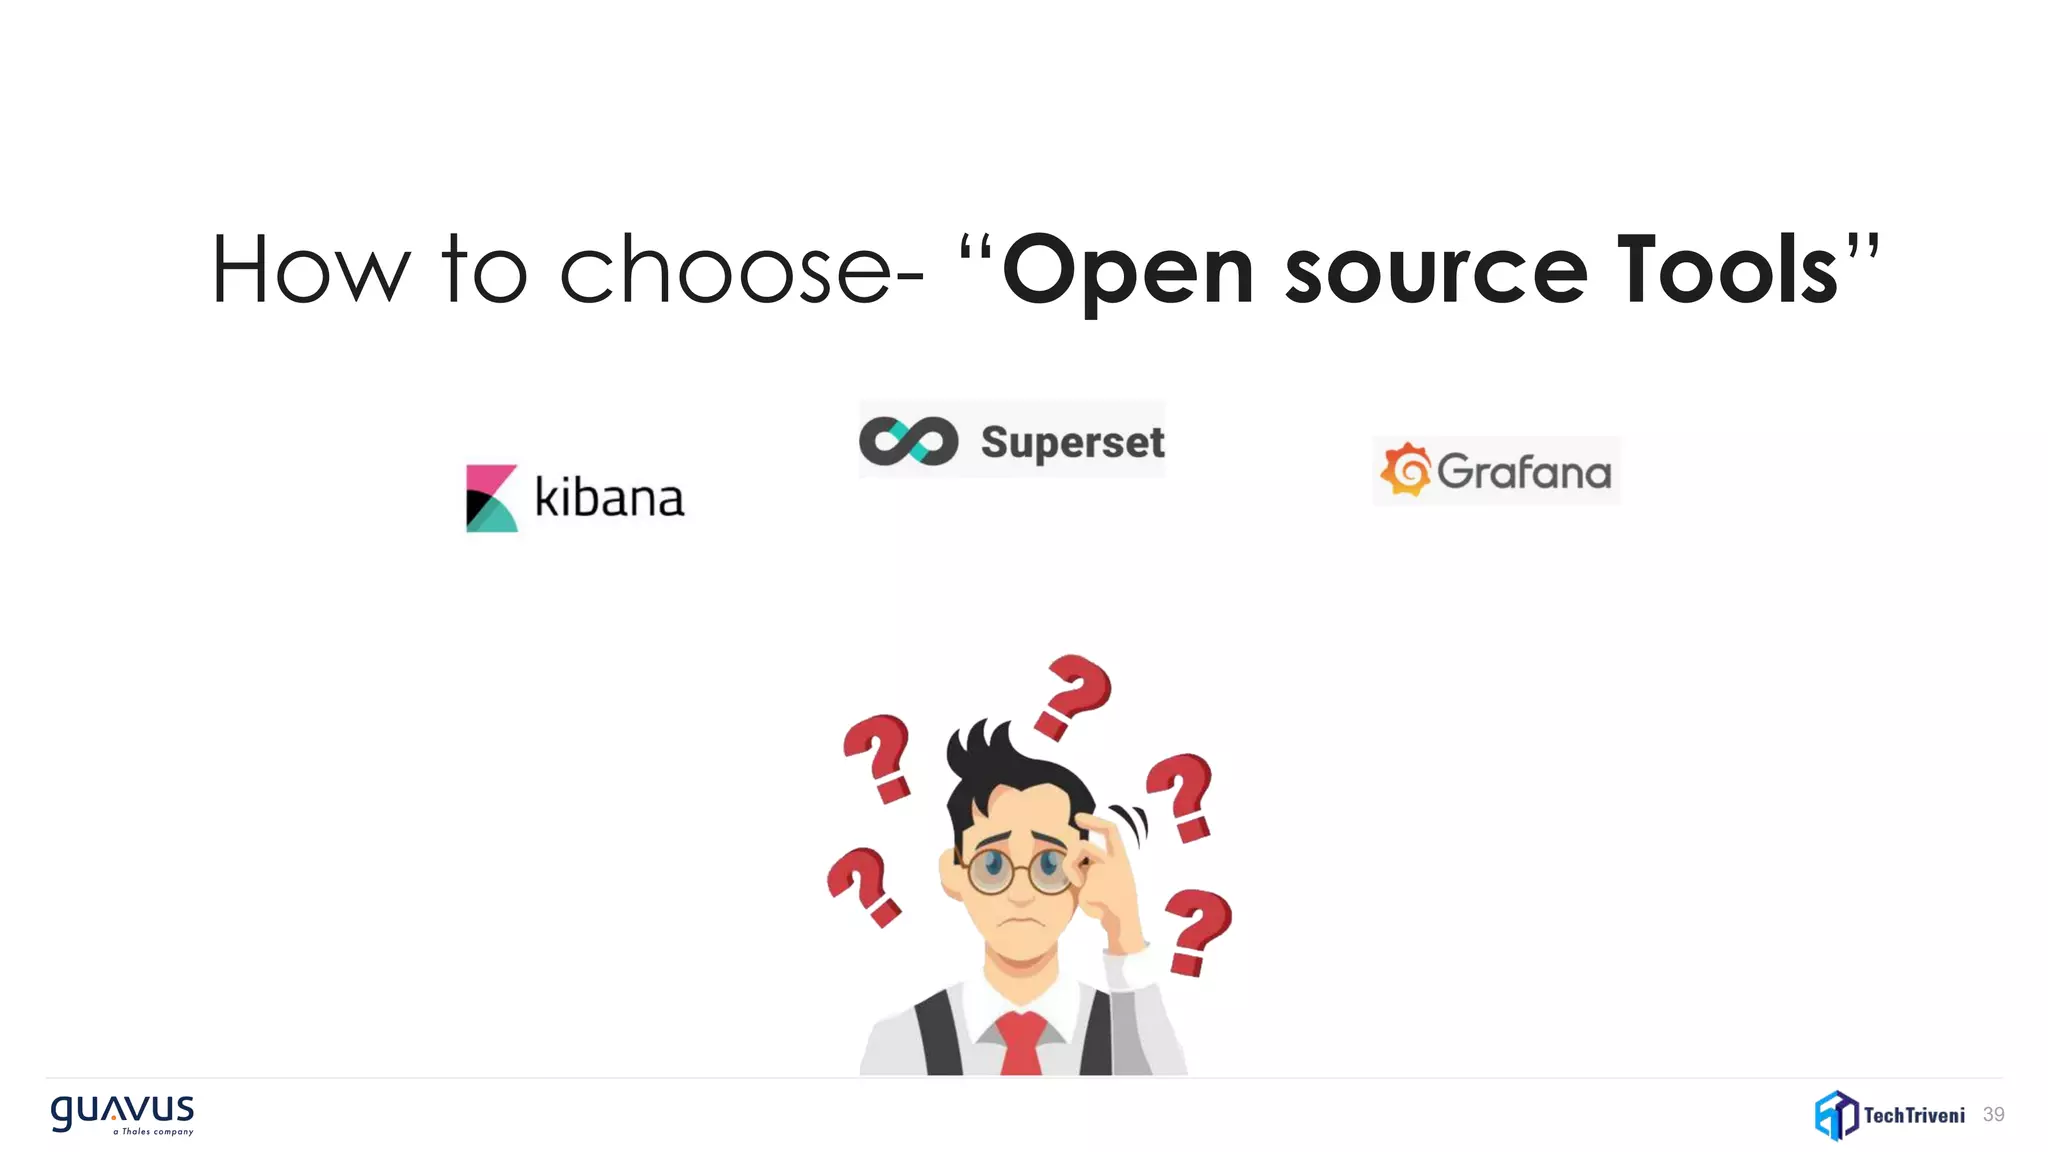

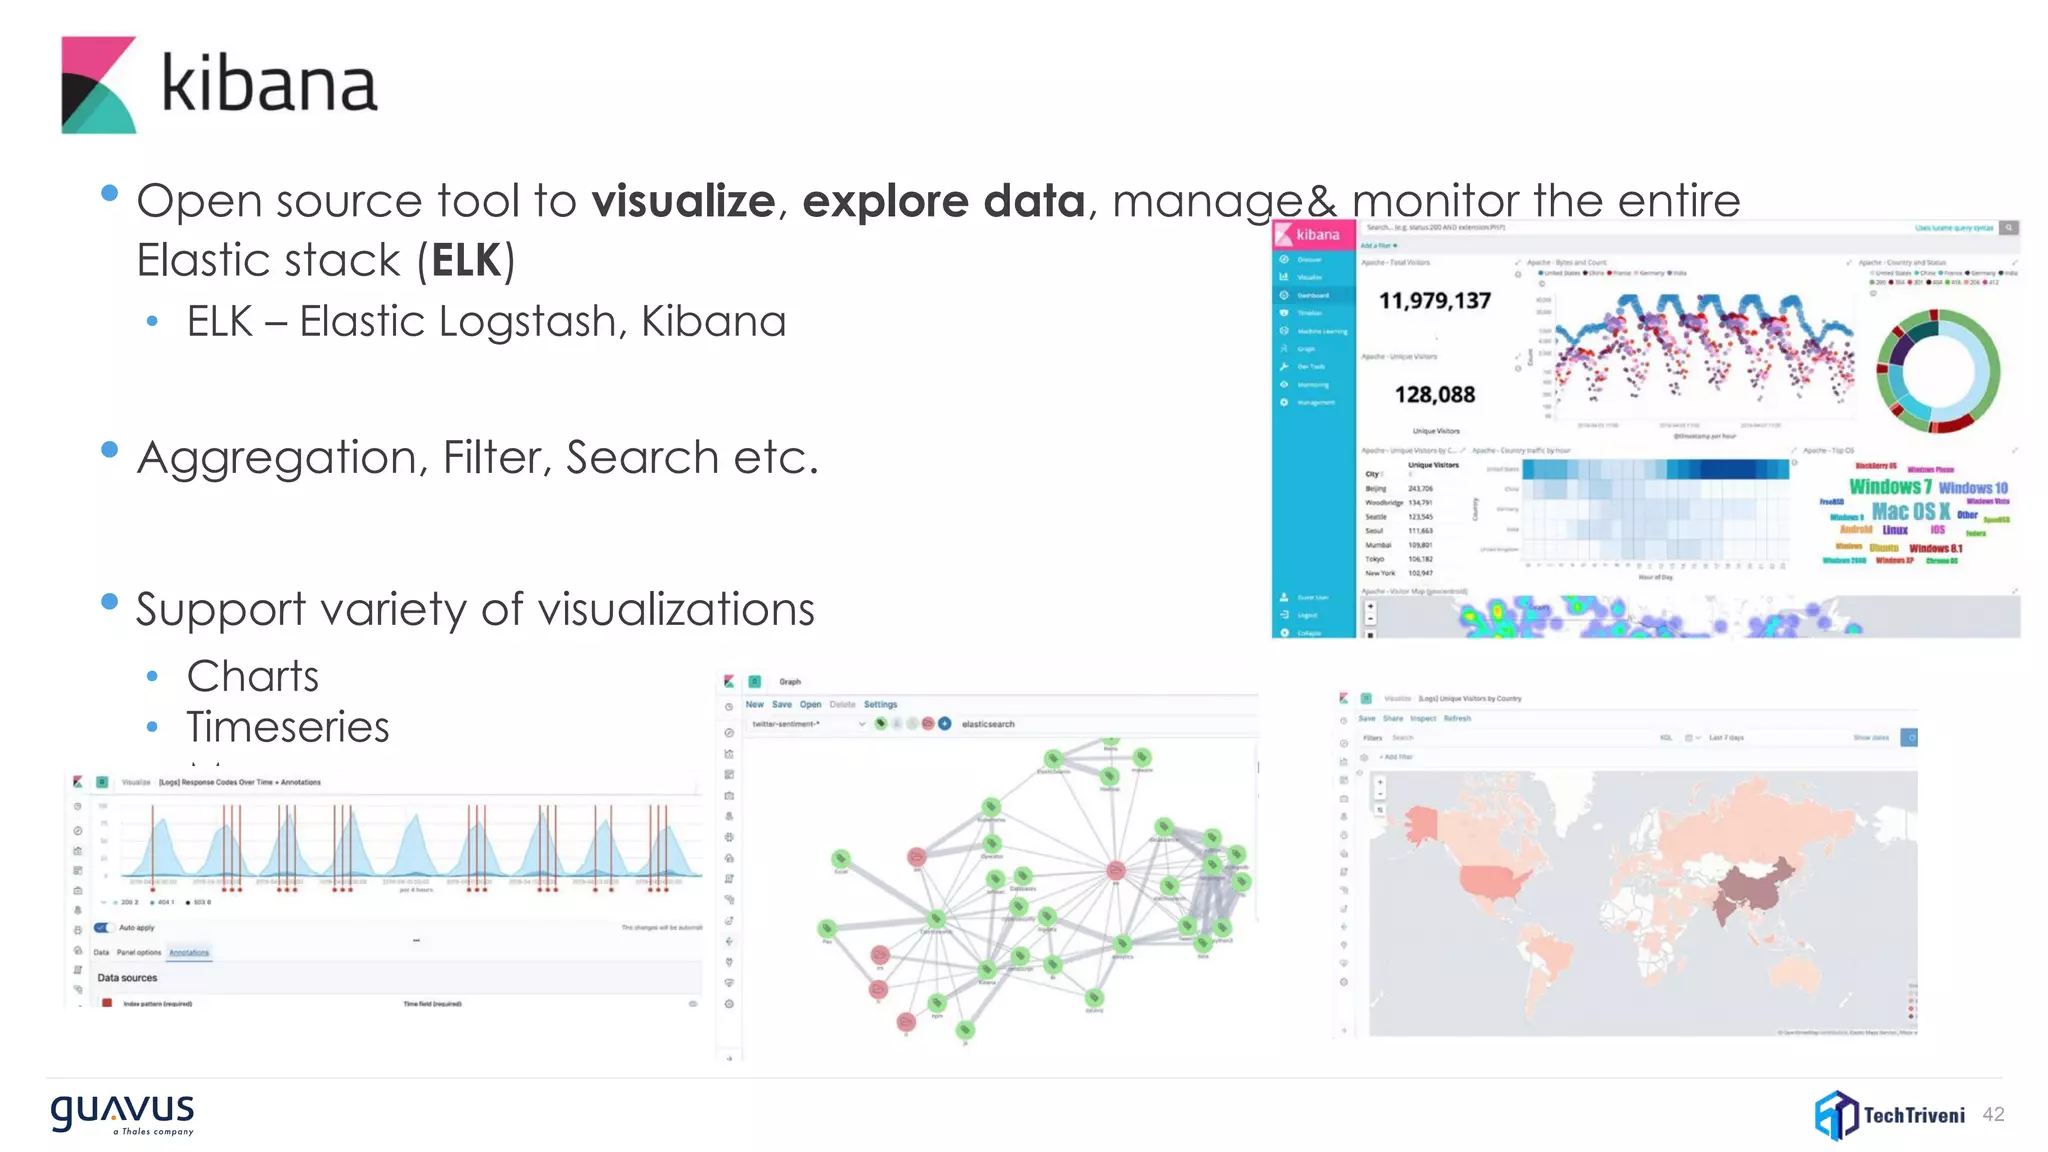
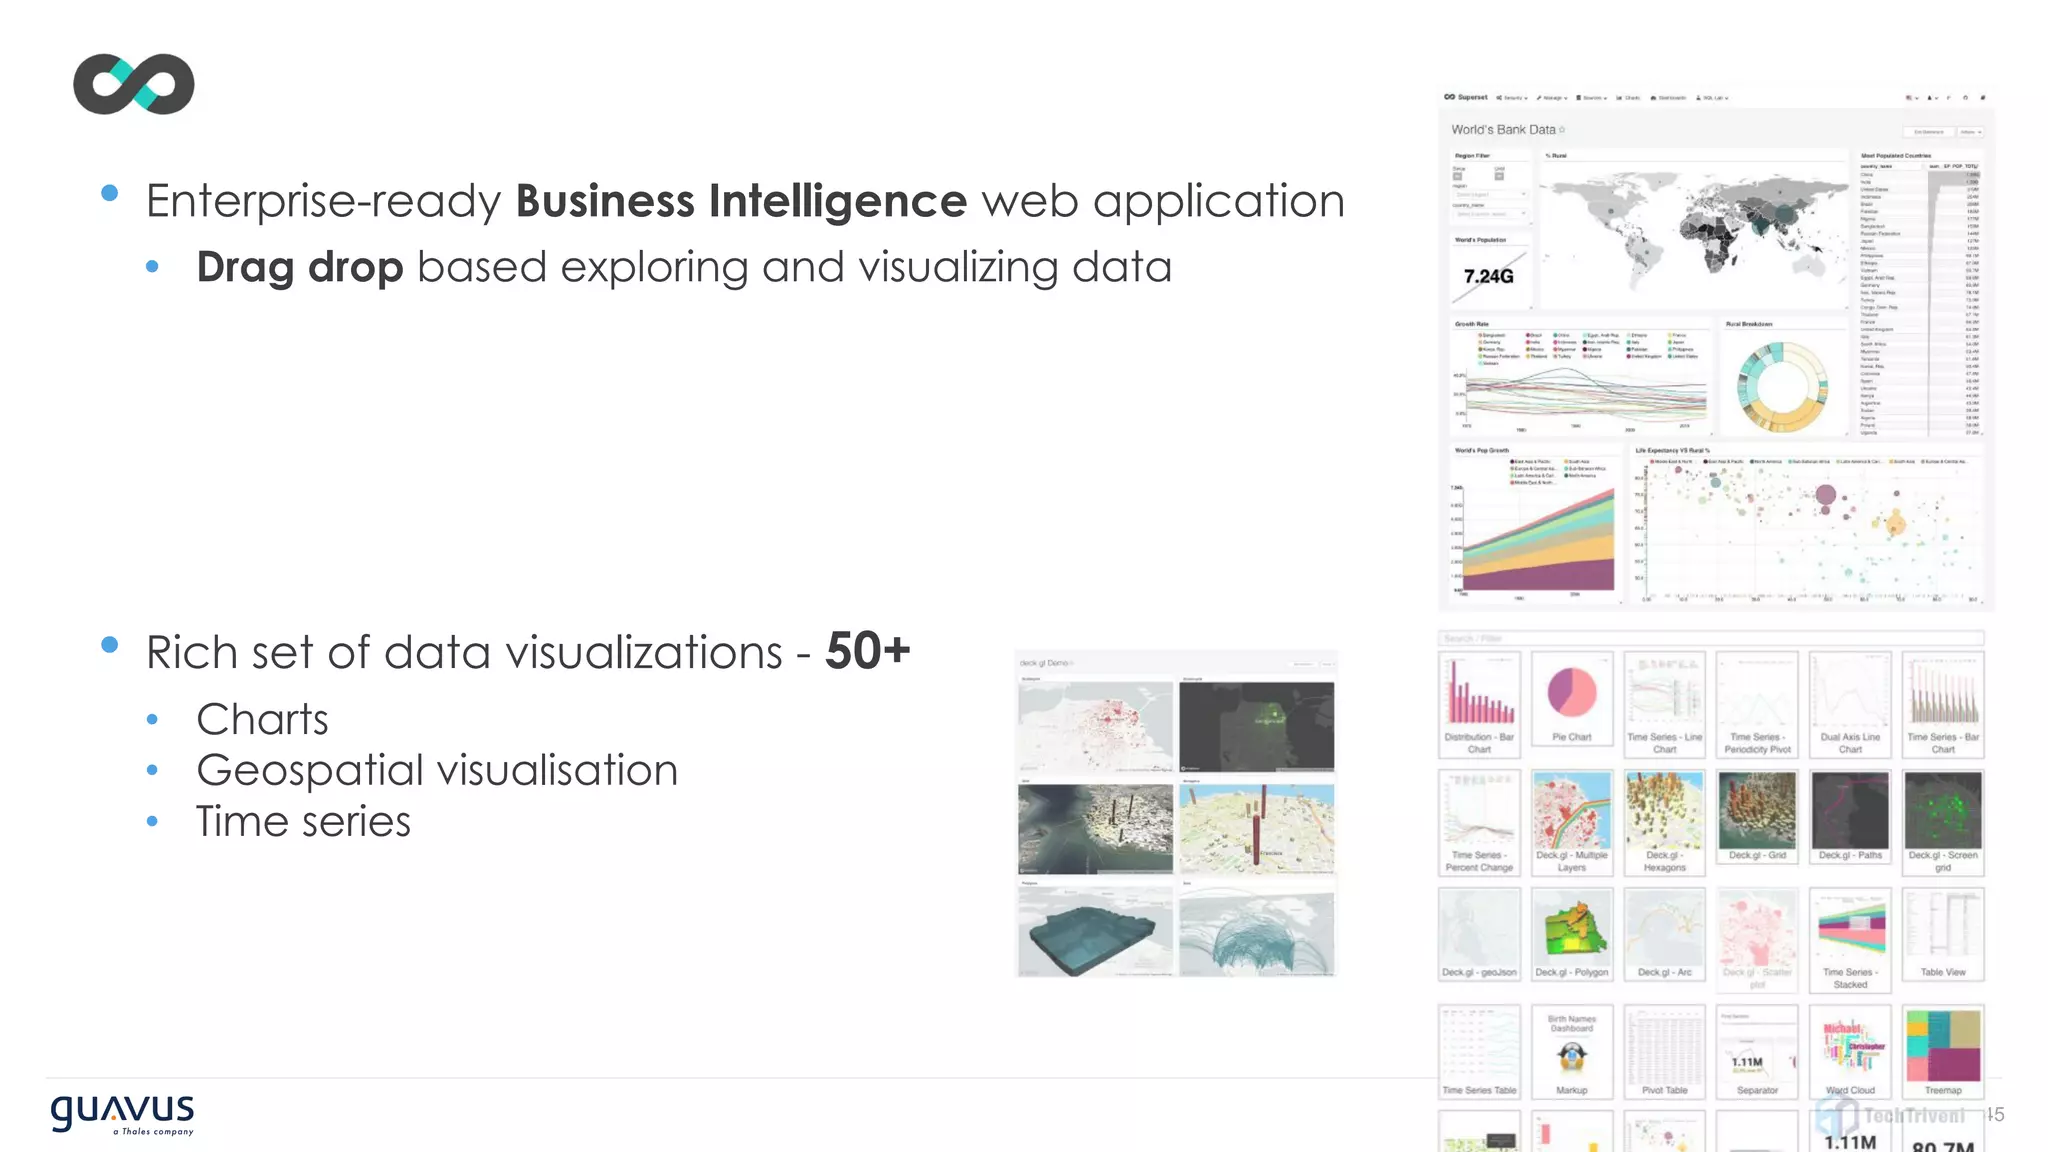
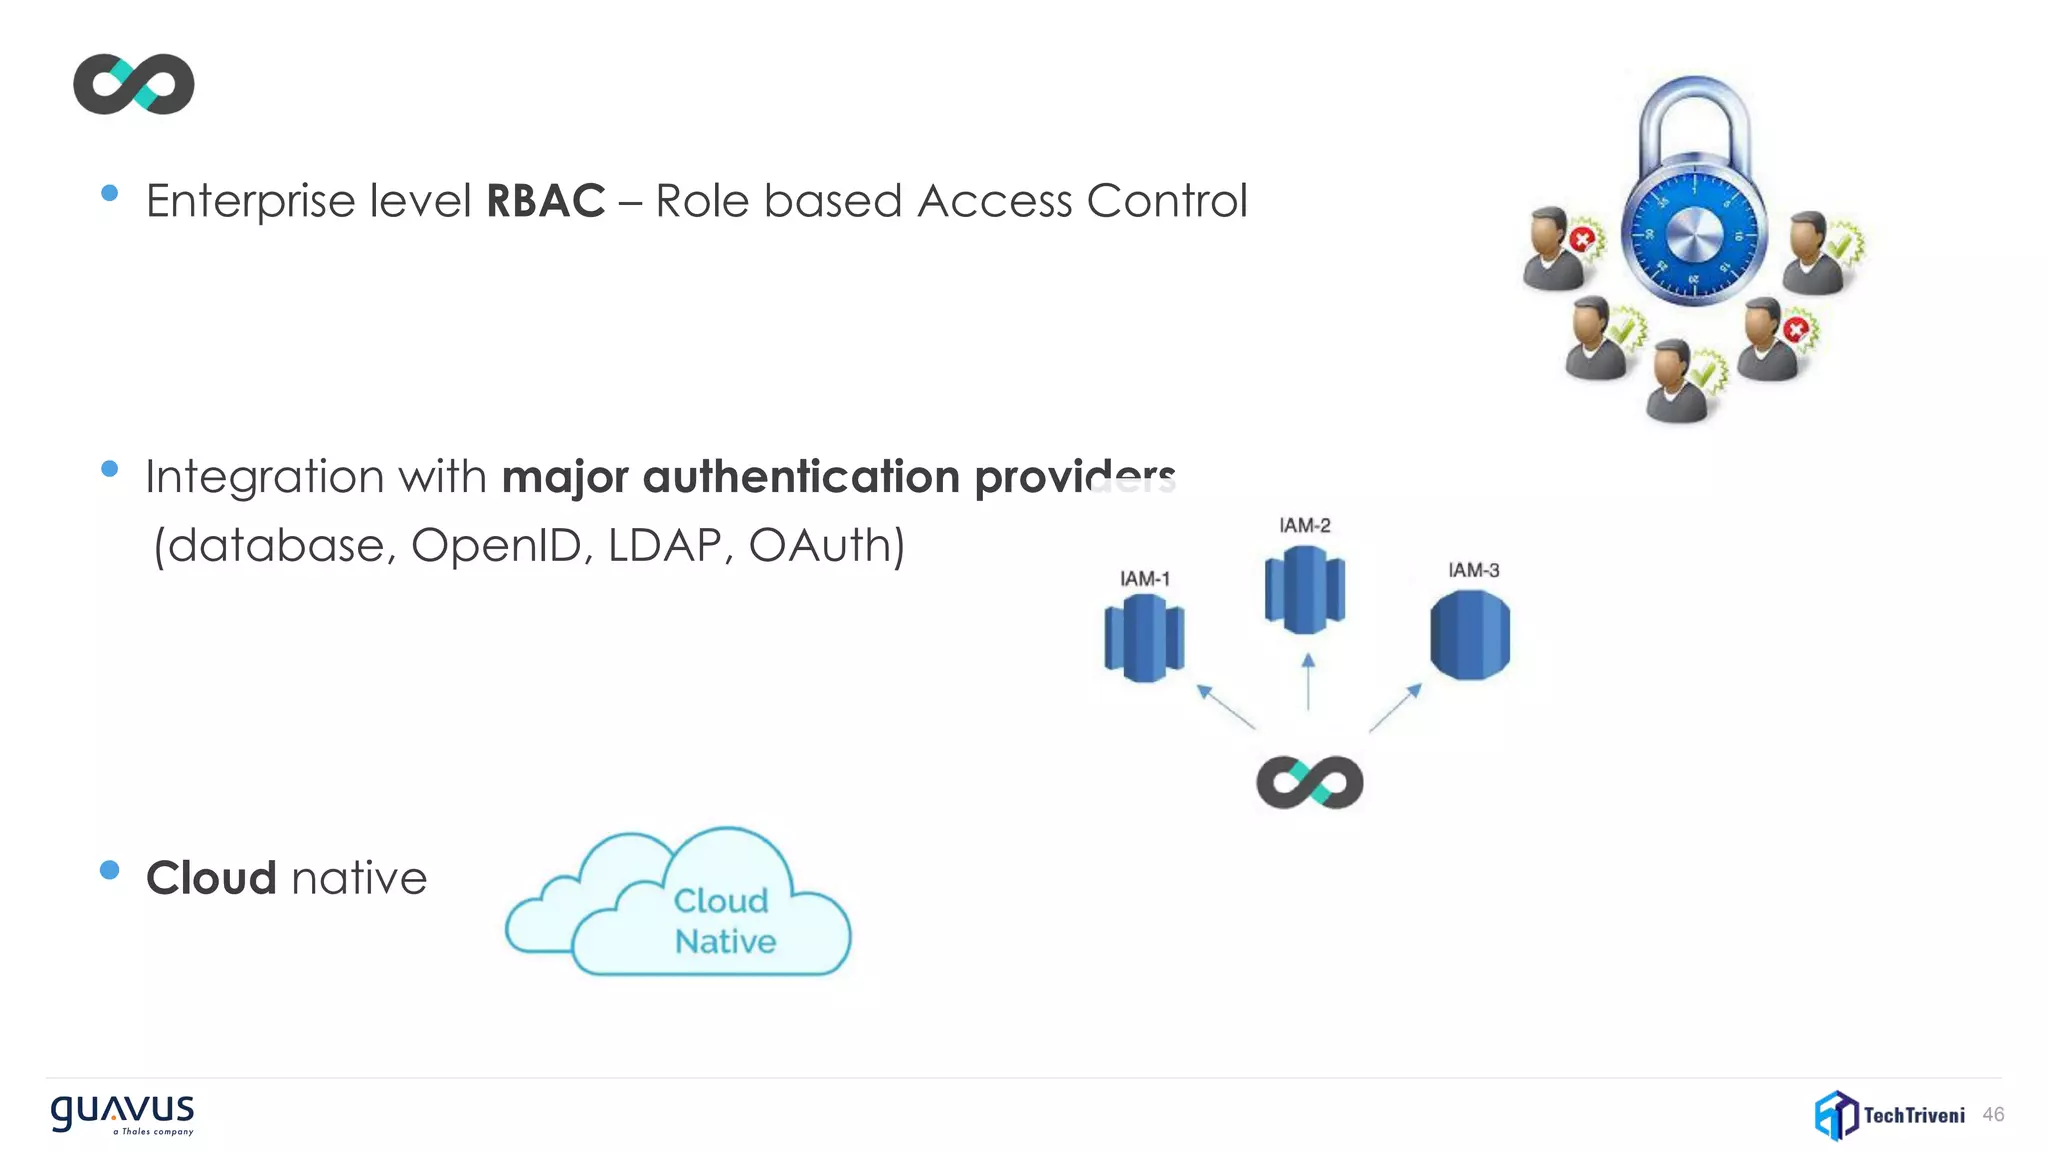
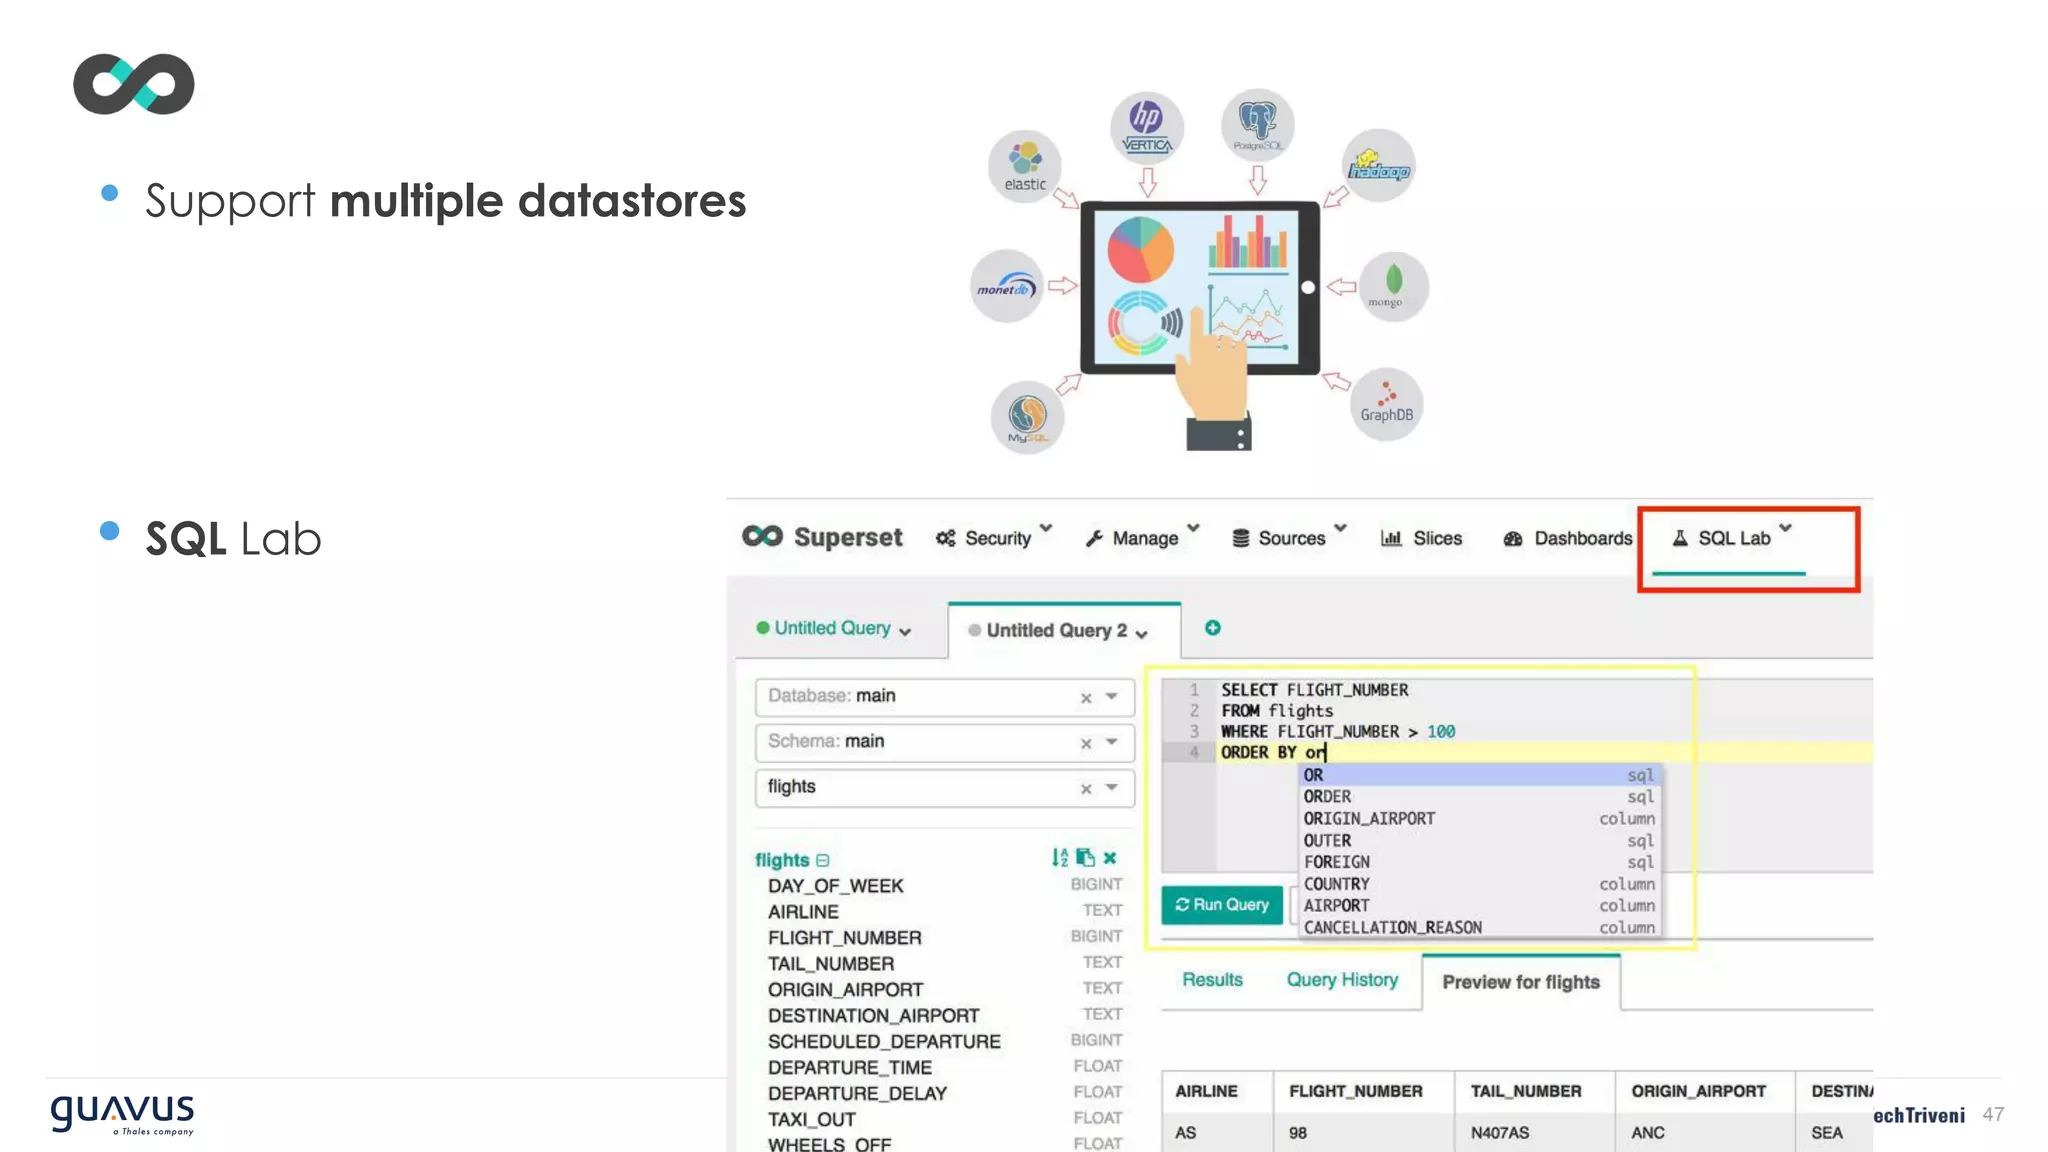
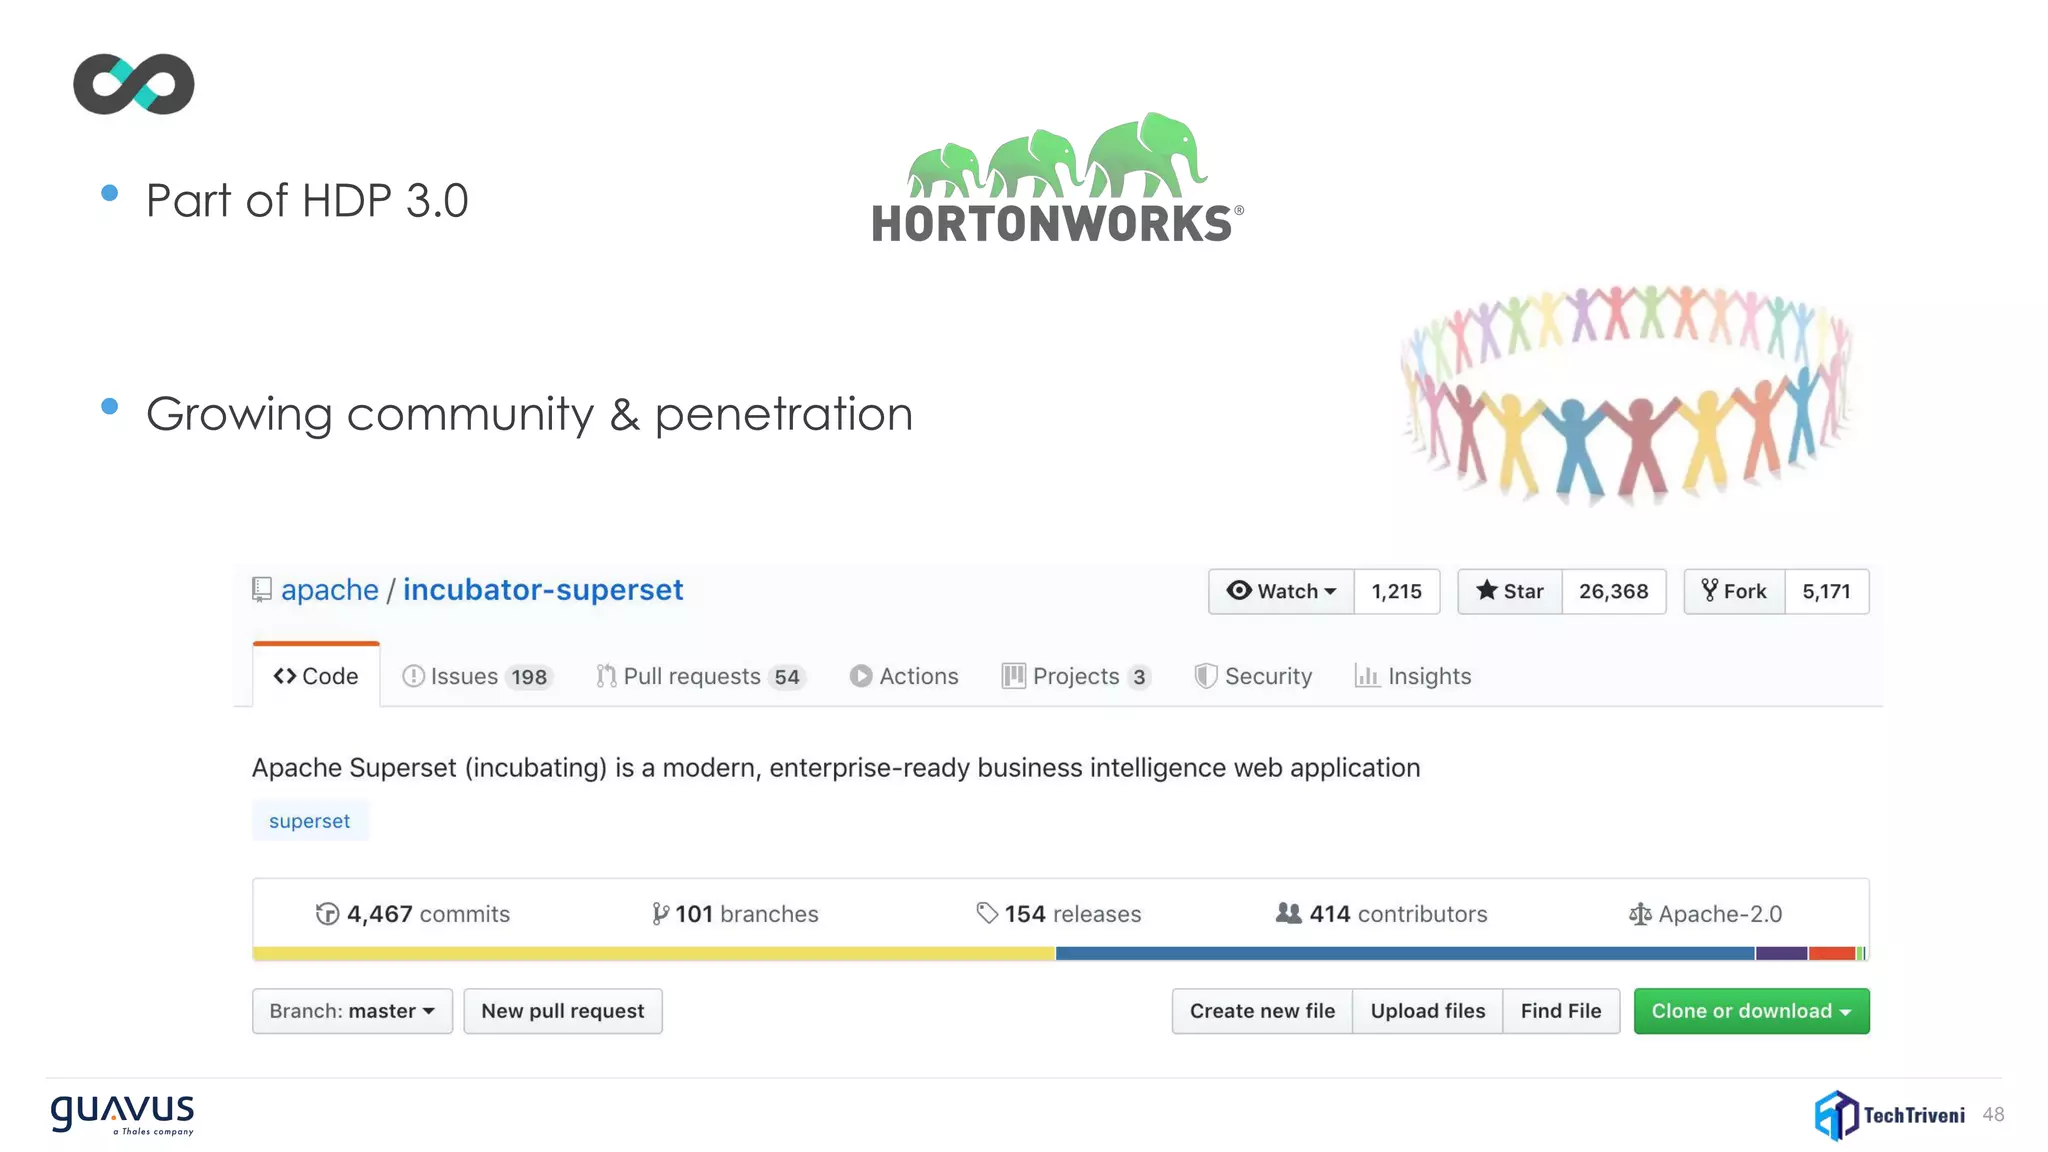


The document discusses the importance of UI in the big data world, outlining how to effectively target big data problems and select appropriate frameworks and tools. It compares custom frameworks and open-source tools, detailing their benefits and ideal use scenarios. Also included are Github statistics for popular frameworks and a summary of open-source tools like Kibana and Apache Superset for data visualization.


