UML design Software architecture and design pattern
1.
Important Topics forUnified Modeling Language (UML) Diagrams
1. What is UML?
Unified Modeling Language (UML) is a standardized visual modeling language used in the
field of software engineering to provide a general-purpose, developmental, and intuitive way
to visualize the design of a system. UML helps in specifying, visualizing, constructing, and
documenting the artifacts of software systems.
We use UML diagrams to portray the behavior and structure of a system.
UML helps software engineers, businessmen, and system architects with modeling, design,
and analysis.
The Object Management Group (OMG) adopted Unified Modelling Language as a standard
in 1997. It’s been managed by OMG ever since.
The International Organization for Standardization (ISO) published UML as an approved
standard in 2005. UML has been revised over the years and is reviewed periodically.
2. Why do we need UML?
Complex applications need collaboration and planning from multiple teams and hence require
a clear and concise way to communicate amongst them.
Businessmen do not understand code. So UML becomes essential to communicate with non-
programmers about essential requirements, functionalities, and processes of the system.
A lot of time is saved down the line when teams can visualize processes, user interactions,
and the static structure of the system.
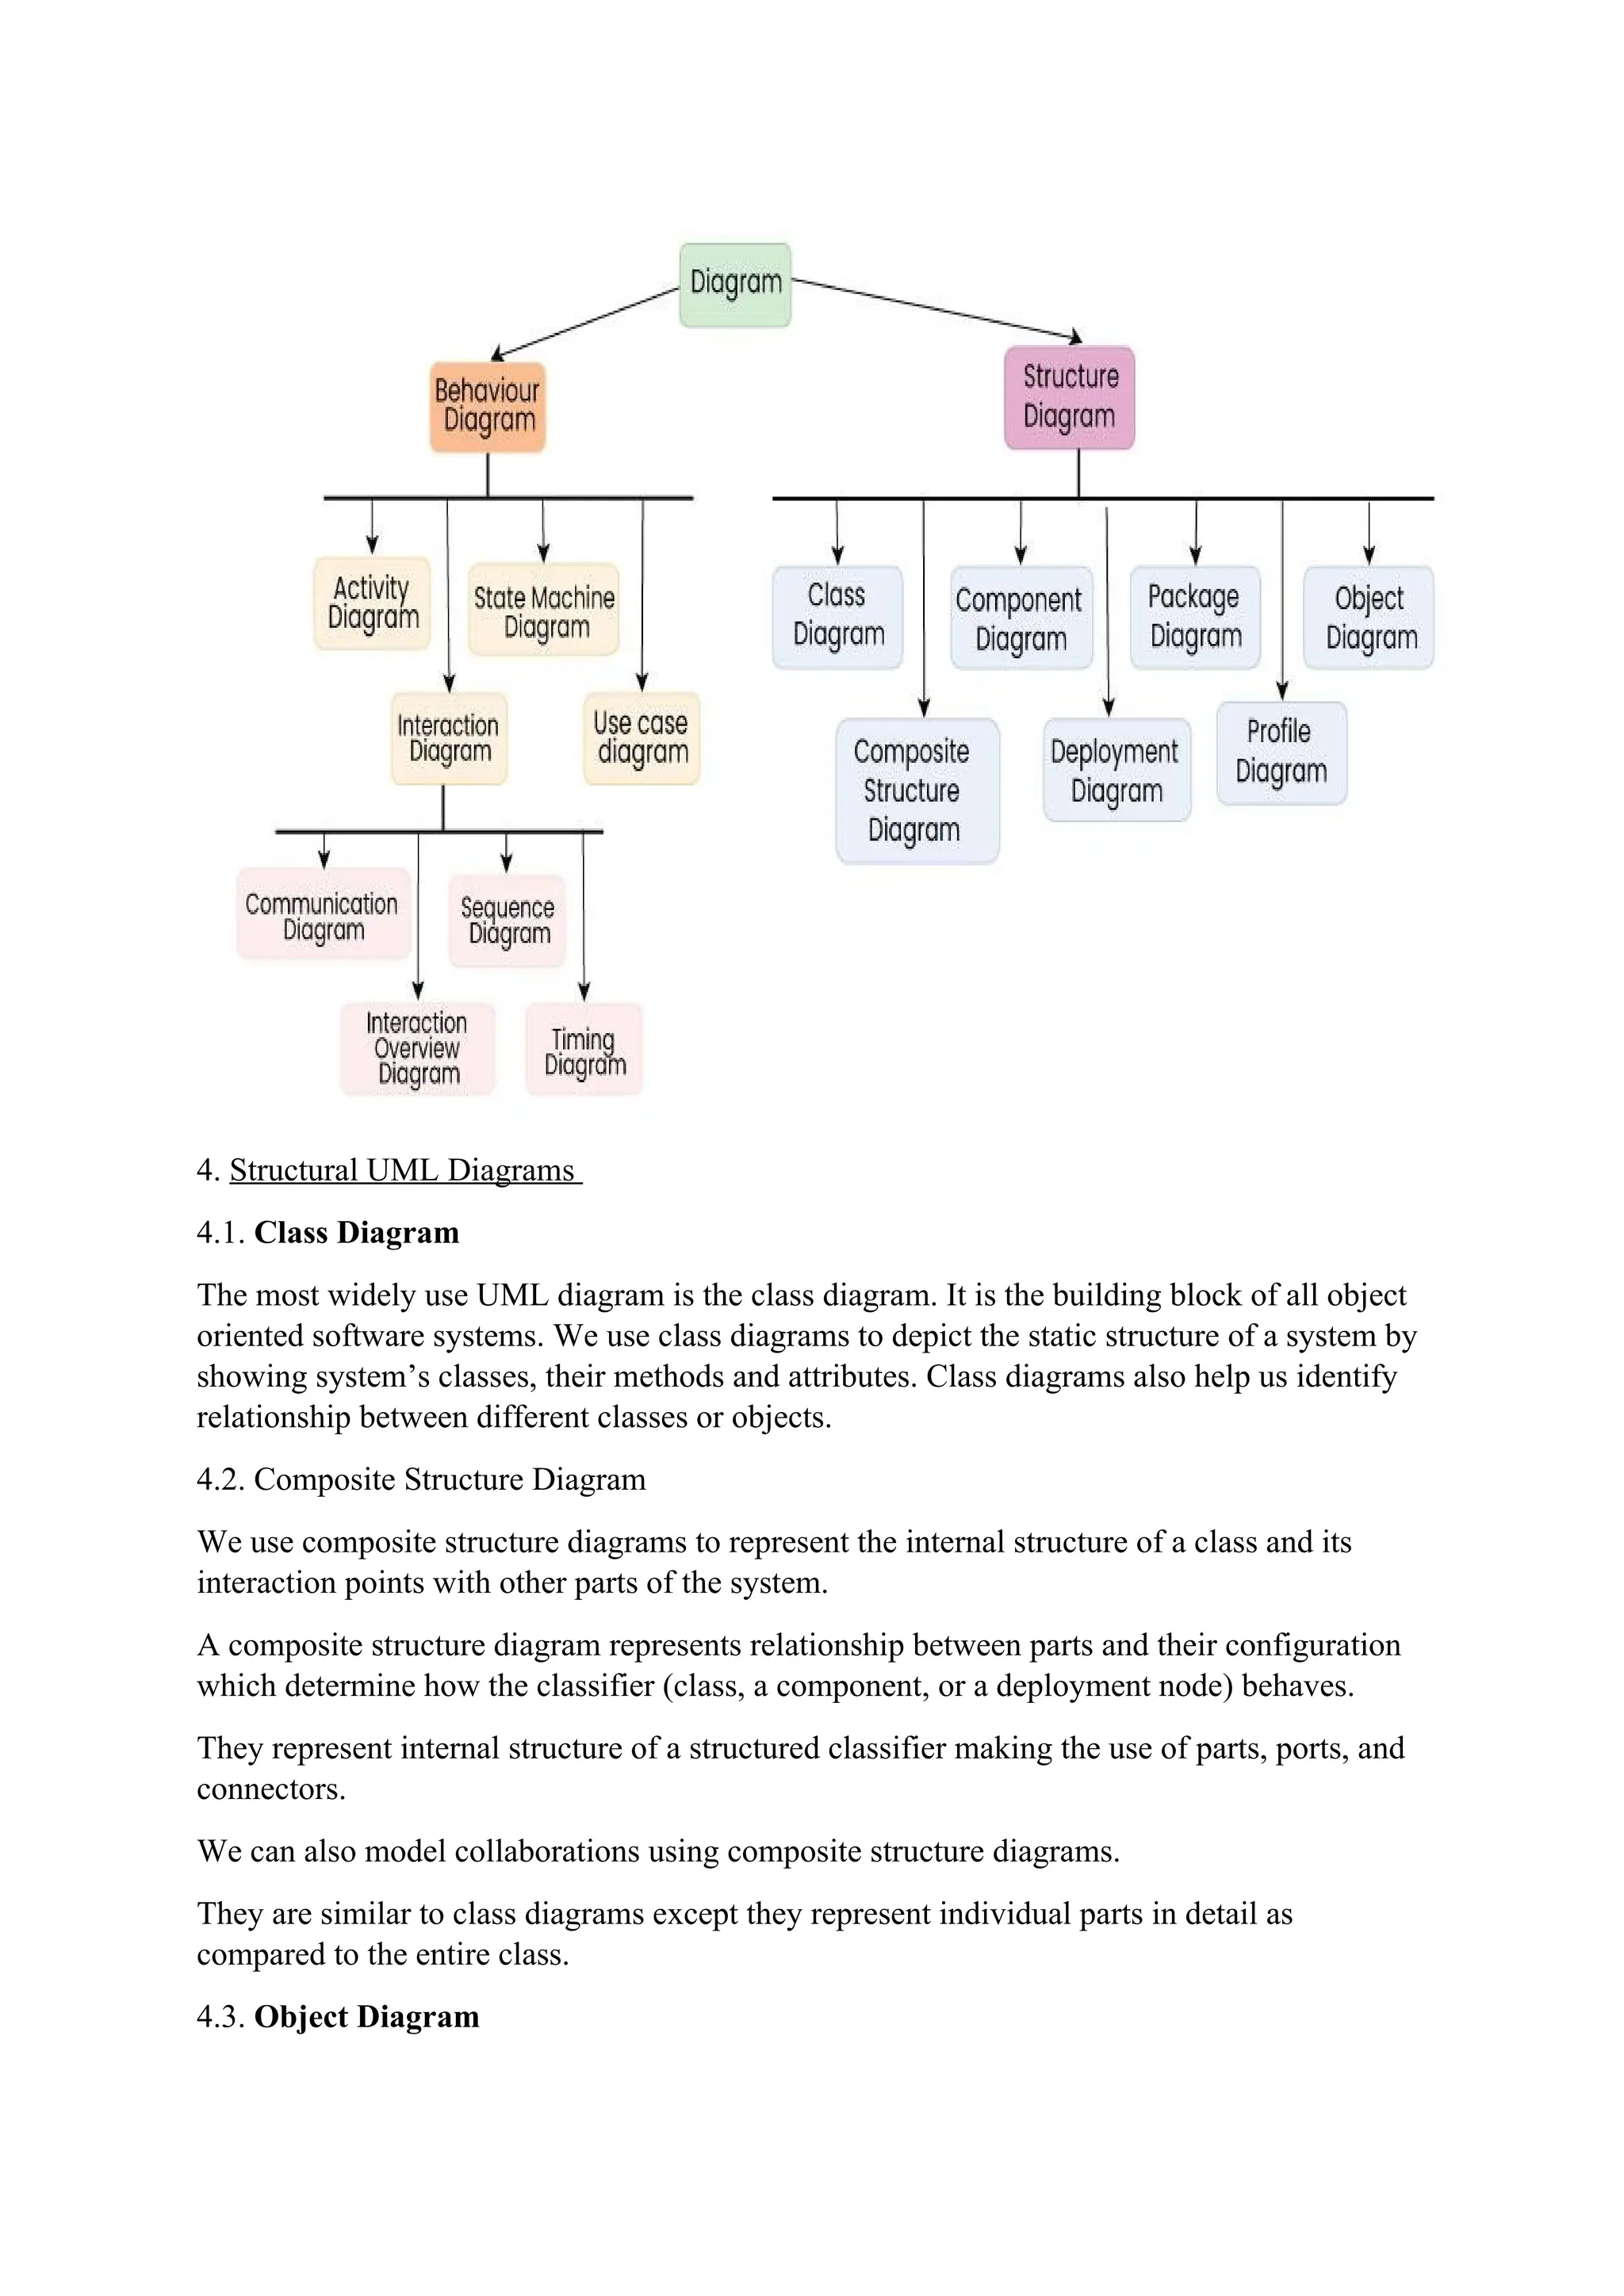
3. Different Types of UML Diagrams
UML is linked with object-oriented design and analysis. UML makes use of elements and
forms associations between them to form diagrams. Diagrams in UML can be broadly
classified as:
2.
4. Structural UMLDiagrams
4.1. Class Diagram
The most widely use UML diagram is the class diagram. It is the building block of all object
oriented software systems. We use class diagrams to depict the static structure of a system by
showing system’s classes, their methods and attributes. Class diagrams also help us identify
relationship between different classes or objects.
4.2. Composite Structure Diagram
We use composite structure diagrams to represent the internal structure of a class and its
interaction points with other parts of the system.
A composite structure diagram represents relationship between parts and their configuration
which determine how the classifier (class, a component, or a deployment node) behaves.
They represent internal structure of a structured classifier making the use of parts, ports, and
connectors.
We can also model collaborations using composite structure diagrams.
They are similar to class diagrams except they represent individual parts in detail as
compared to the entire class.
4.3. Object Diagram
3.
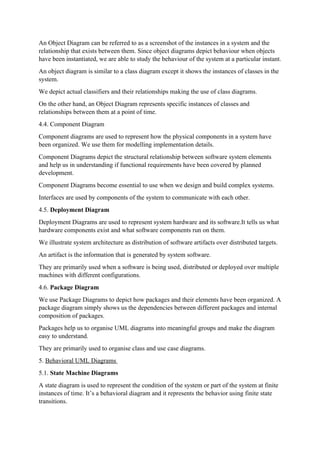
An Object Diagramcan be referred to as a screenshot of the instances in a system and the
relationship that exists between them. Since object diagrams depict behaviour when objects
have been instantiated, we are able to study the behaviour of the system at a particular instant.
An object diagram is similar to a class diagram except it shows the instances of classes in the
system.
We depict actual classifiers and their relationships making the use of class diagrams.
On the other hand, an Object Diagram represents specific instances of classes and
relationships between them at a point of time.
4.4. Component Diagram
Component diagrams are used to represent how the physical components in a system have
been organized. We use them for modelling implementation details.
Component Diagrams depict the structural relationship between software system elements
and help us in understanding if functional requirements have been covered by planned
development.
Component Diagrams become essential to use when we design and build complex systems.
Interfaces are used by components of the system to communicate with each other.
4.5. Deployment Diagram
Deployment Diagrams are used to represent system hardware and its software.It tells us what
hardware components exist and what software components run on them.
We illustrate system architecture as distribution of software artifacts over distributed targets.
An artifact is the information that is generated by system software.
They are primarily used when a software is being used, distributed or deployed over multiple
machines with different configurations.
4.6. Package Diagram
We use Package Diagrams to depict how packages and their elements have been organized. A
package diagram simply shows us the dependencies between different packages and internal
composition of packages.
Packages help us to organise UML diagrams into meaningful groups and make the diagram
easy to understand.
They are primarily used to organise class and use case diagrams.
5. Behavioral UML Diagrams
5.1. State Machine Diagrams
A state diagram is used to represent the condition of the system or part of the system at finite
instances of time. It’s a behavioral diagram and it represents the behavior using finite state
transitions.
4.
State diagrams arealso referred to as State machines and State-chart Diagrams
These terms are often used interchangeably. So simply, a state diagram is used to model the
dynamic behavior of a class in response to time and changing external stimuli.
5.2. Activity Diagrams
We use Activity Diagrams to illustrate the flow of control in a system. We can also use an
activity diagram to refer to the steps involved in the execution of a use case.
We model sequential and concurrent activities using activity diagrams. So, we basically
depict workflows visually using an activity diagram.
An activity diagram focuses on condition of flow and the sequence in which it happens.
We describe or depict what causes a particular event using an activity diagram.
5.3. Use Case Diagrams
Use Case Diagrams are used to depict the functionality of a system or a part of a system.
They are widely used to illustrate the functional requirements of the system and its interaction
with external agents(actors).
A use case is basically a diagram representing different scenarios where the system can be
used.
A use case diagram gives us a high level view of what the system or a part of the system does
without going into implementation details.
5.4. Sequence Diagram
A sequence diagram simply depicts interaction between objects in a sequential order i.e. the
order in which these interactions take place.
We can also use the terms event diagrams or event scenarios to refer to a sequence diagram.
Sequence diagrams describe how and in what order the objects in a system function.
These diagrams are widely used by businessmen and software developers to document and
understand requirements for new and existing systems.
5.5. Communication Diagram
A Communication Diagram (known as Collaboration Diagram in UML 1.x) is used to show
sequenced messages exchanged between objects.
A communication diagram focuses primarily on objects and their relationships.
We can represent similar information using Sequence diagrams, however communication
diagrams represent objects and links in a free form.
5.6. Timing Diagram
Timing Diagram are a special form of Sequence diagrams which are used to depict the
behavior of objects over a time frame. We use them to show time and duration constraints
which govern changes in states and behavior of objects.
5.
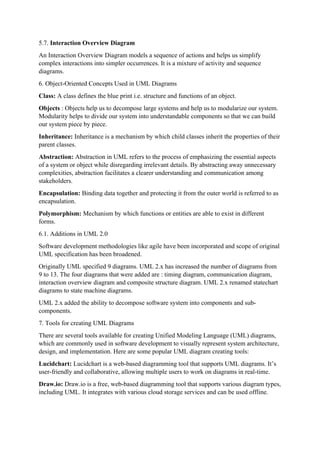
5.7. Interaction OverviewDiagram
An Interaction Overview Diagram models a sequence of actions and helps us simplify
complex interactions into simpler occurrences. It is a mixture of activity and sequence
diagrams.
6. Object-Oriented Concepts Used in UML Diagrams
Class: A class defines the blue print i.e. structure and functions of an object.
Objects : Objects help us to decompose large systems and help us to modularize our system.
Modularity helps to divide our system into understandable components so that we can build
our system piece by piece.
Inheritance: Inheritance is a mechanism by which child classes inherit the properties of their
parent classes.
Abstraction: Abstraction in UML refers to the process of emphasizing the essential aspects
of a system or object while disregarding irrelevant details. By abstracting away unnecessary
complexities, abstraction facilitates a clearer understanding and communication among
stakeholders.
Encapsulation: Binding data together and protecting it from the outer world is referred to as
encapsulation.
Polymorphism: Mechanism by which functions or entities are able to exist in different
forms.
6.1. Additions in UML 2.0
Software development methodologies like agile have been incorporated and scope of original
UML specification has been broadened.
Originally UML specified 9 diagrams. UML 2.x has increased the number of diagrams from
9 to 13. The four diagrams that were added are : timing diagram, communication diagram,
interaction overview diagram and composite structure diagram. UML 2.x renamed statechart
diagrams to state machine diagrams.
UML 2.x added the ability to decompose software system into components and sub-
components.
7. Tools for creating UML Diagrams
There are several tools available for creating Unified Modeling Language (UML) diagrams,
which are commonly used in software development to visually represent system architecture,
design, and implementation. Here are some popular UML diagram creating tools:
Lucidchart: Lucidchart is a web-based diagramming tool that supports UML diagrams. It’s
user-friendly and collaborative, allowing multiple users to work on diagrams in real-time.
Draw.io: Draw.io is a free, web-based diagramming tool that supports various diagram types,
including UML. It integrates with various cloud storage services and can be used offline.
6.
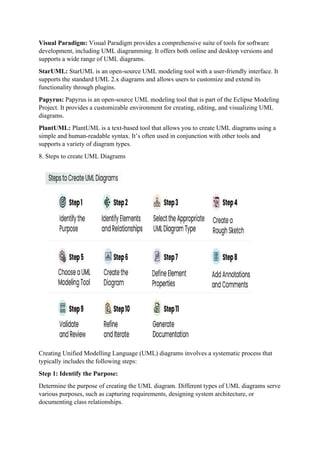
Visual Paradigm: VisualParadigm provides a comprehensive suite of tools for software
development, including UML diagramming. It offers both online and desktop versions and
supports a wide range of UML diagrams.
StarUML: StarUML is an open-source UML modeling tool with a user-friendly interface. It
supports the standard UML 2.x diagrams and allows users to customize and extend its
functionality through plugins.
Papyrus: Papyrus is an open-source UML modeling tool that is part of the Eclipse Modeling
Project. It provides a customizable environment for creating, editing, and visualizing UML
diagrams.
PlantUML: PlantUML is a text-based tool that allows you to create UML diagrams using a
simple and human-readable syntax. It’s often used in conjunction with other tools and
supports a variety of diagram types.
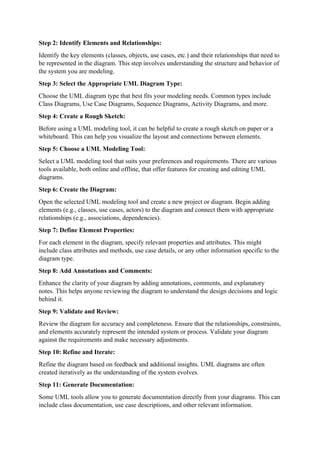
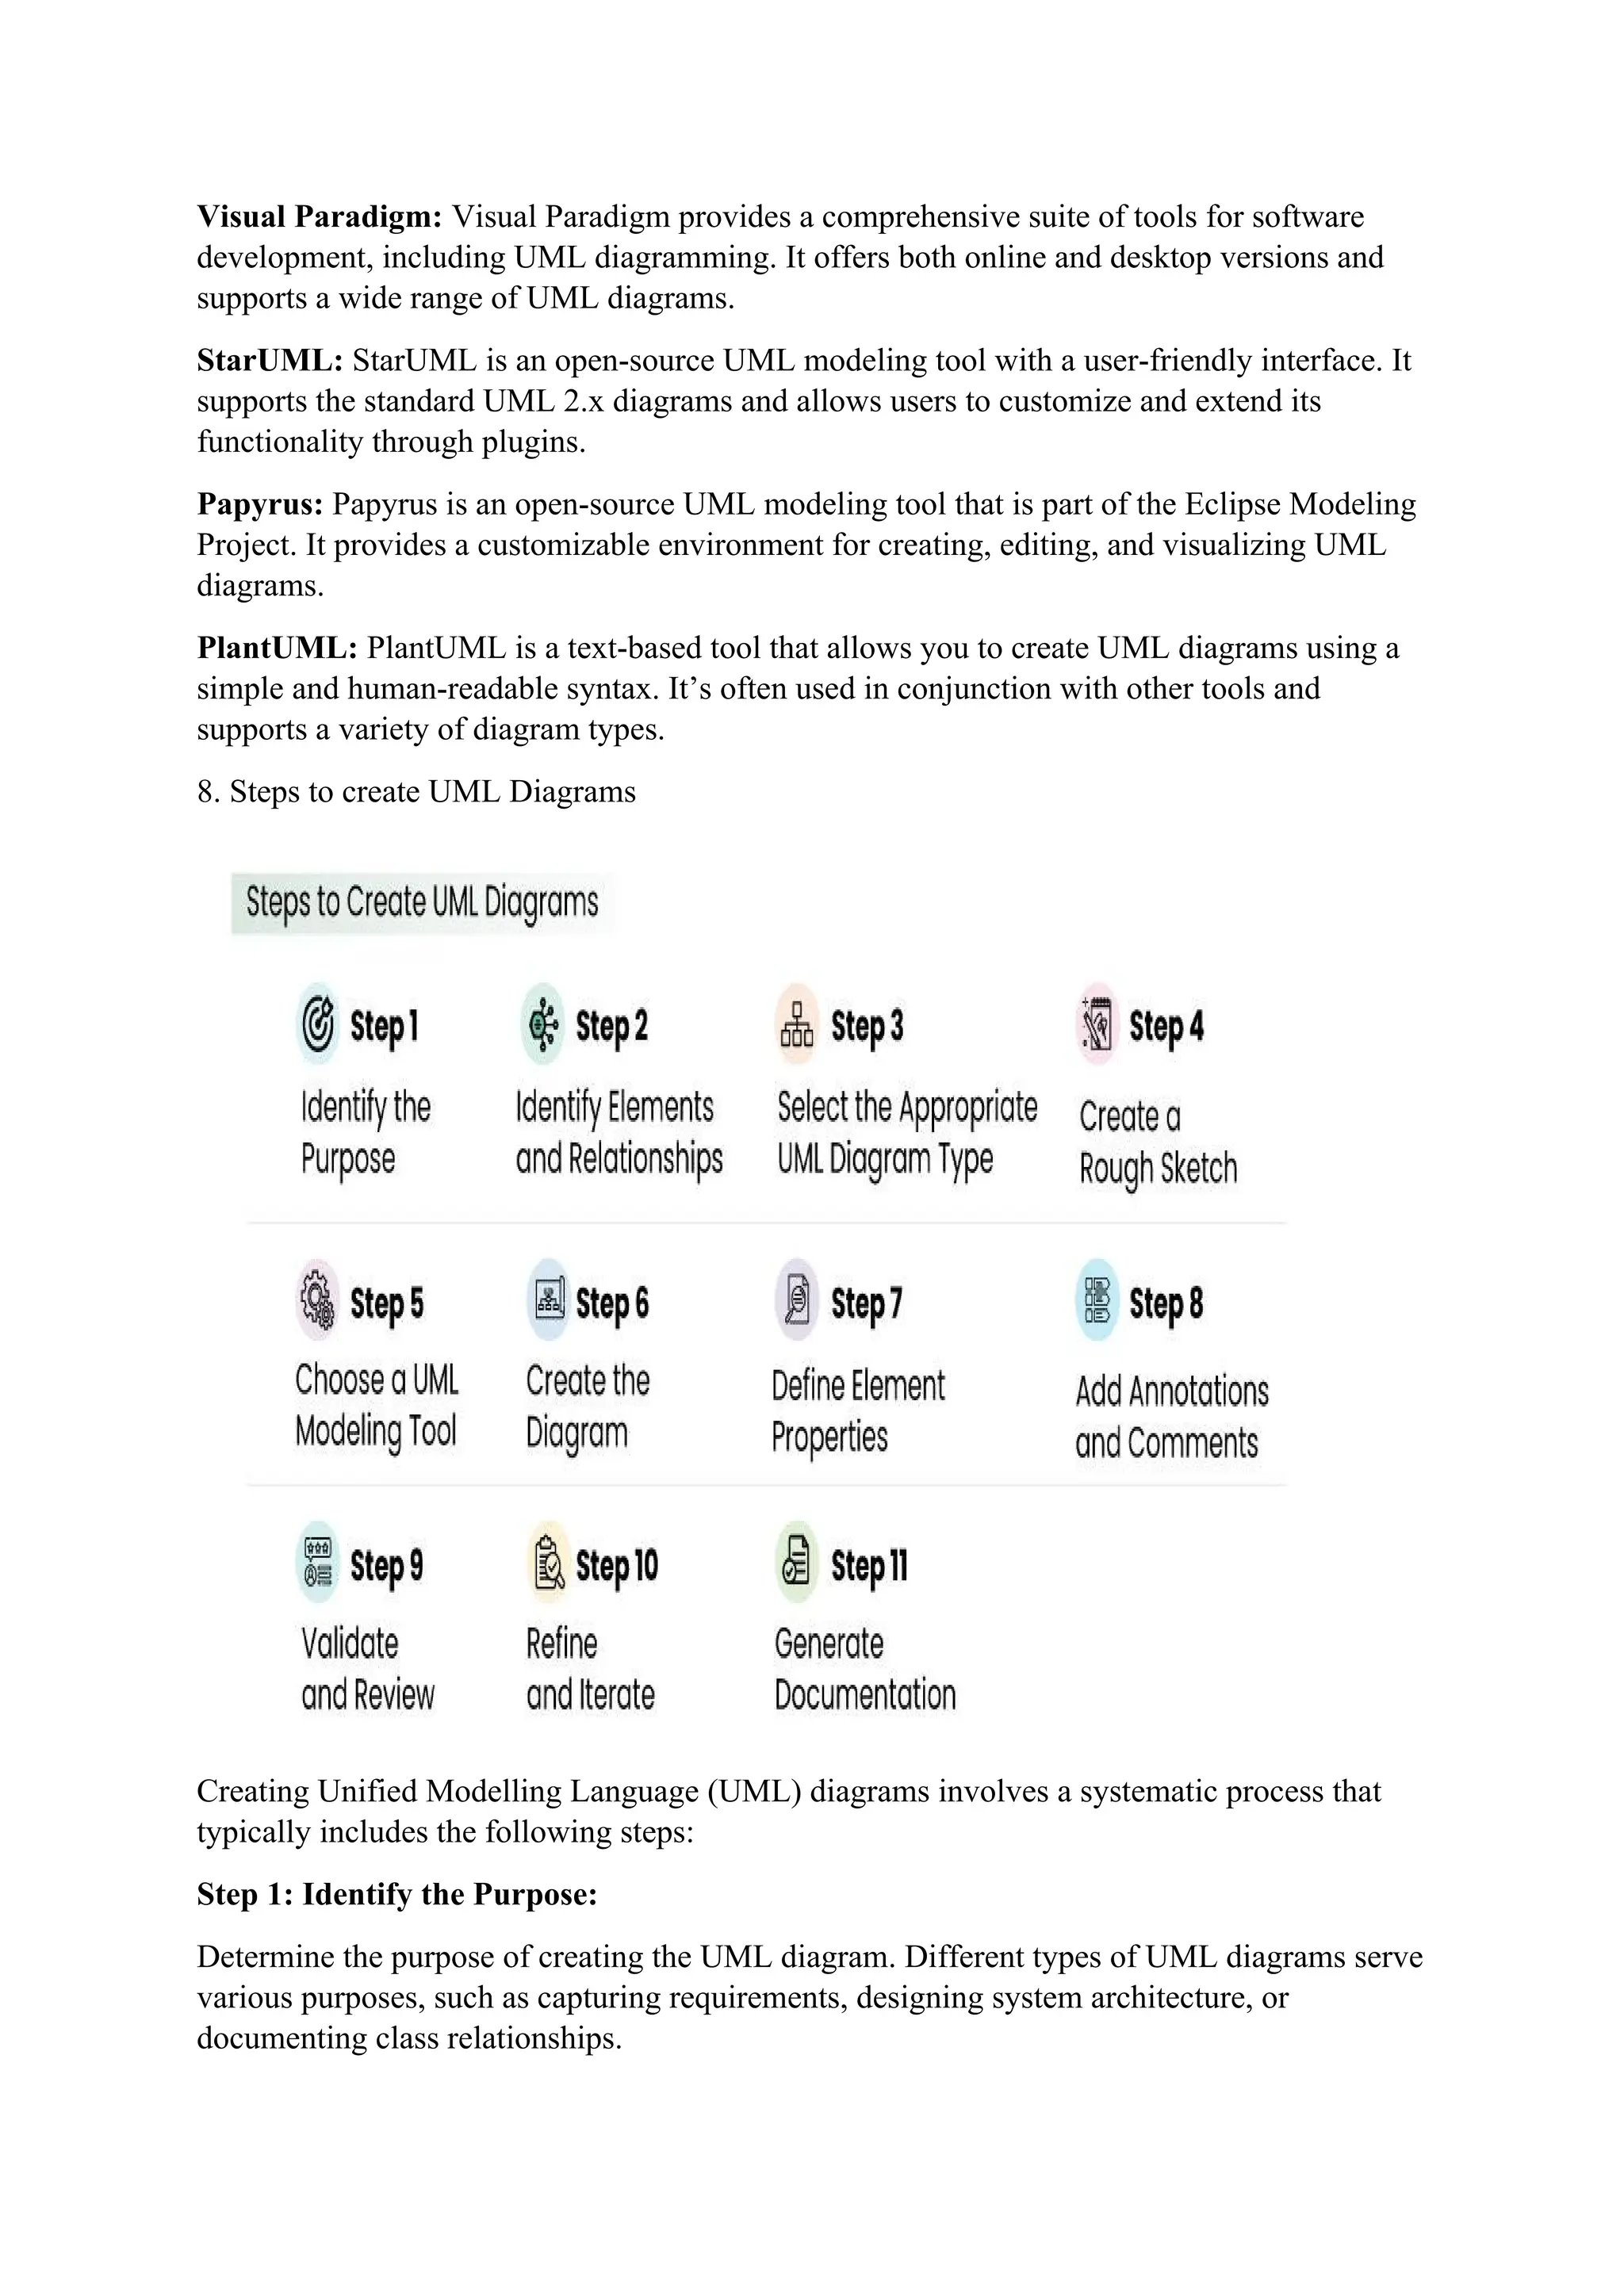
8. Steps to create UML Diagrams
Creating Unified Modelling Language (UML) diagrams involves a systematic process that
typically includes the following steps:
Step 1: Identify the Purpose:
Determine the purpose of creating the UML diagram. Different types of UML diagrams serve
various purposes, such as capturing requirements, designing system architecture, or
documenting class relationships.
7.
Step 2: IdentifyElements and Relationships:
Identify the key elements (classes, objects, use cases, etc.) and their relationships that need to
be represented in the diagram. This step involves understanding the structure and behavior of
the system you are modeling.
Step 3: Select the Appropriate UML Diagram Type:
Choose the UML diagram type that best fits your modeling needs. Common types include
Class Diagrams, Use Case Diagrams, Sequence Diagrams, Activity Diagrams, and more.
Step 4: Create a Rough Sketch:
Before using a UML modeling tool, it can be helpful to create a rough sketch on paper or a
whiteboard. This can help you visualize the layout and connections between elements.
Step 5: Choose a UML Modeling Tool:
Select a UML modeling tool that suits your preferences and requirements. There are various
tools available, both online and offline, that offer features for creating and editing UML
diagrams.
Step 6: Create the Diagram:
Open the selected UML modeling tool and create a new project or diagram. Begin adding
elements (e.g., classes, use cases, actors) to the diagram and connect them with appropriate
relationships (e.g., associations, dependencies).
Step 7: Define Element Properties:
For each element in the diagram, specify relevant properties and attributes. This might
include class attributes and methods, use case details, or any other information specific to the
diagram type.
Step 8: Add Annotations and Comments:
Enhance the clarity of your diagram by adding annotations, comments, and explanatory
notes. This helps anyone reviewing the diagram to understand the design decisions and logic
behind it.
Step 9: Validate and Review:
Review the diagram for accuracy and completeness. Ensure that the relationships, constraints,
and elements accurately represent the intended system or process. Validate your diagram
against the requirements and make necessary adjustments.
Step 10: Refine and Iterate:
Refine the diagram based on feedback and additional insights. UML diagrams are often
created iteratively as the understanding of the system evolves.
Step 11: Generate Documentation:
Some UML tools allow you to generate documentation directly from your diagrams. This can
include class documentation, use case descriptions, and other relevant information.
8.
Note: Remember thatthe specific steps may vary based on the UML diagram type and the
tool you are using.
9. UML diagrams best practices
Unified Modeling Language (UML) is a powerful tool for visualizing and documenting the
design of a system. To create effective and meaningful UML diagrams, it’s essential to
follow best practices. Here are some UML best practices:
Understand the Audience: Consider your audience when creating UML diagrams. Tailor
the level of detail and the choice of diagrams to match the understanding and needs of your
audience, whether they are developers, architects, or stakeholders.
Keep Diagrams Simple and Focused: Aim for simplicity in your diagrams. Each diagram
should focus on a specific aspect of the system or a particular set of relationships. Avoid
clutter and unnecessary details that can distract from the main message.
Use Consistent Naming Conventions: Adopt consistent and meaningful names for classes,
objects, attributes, methods, and other UML elements. Clear and well-thought-out naming
conventions enhance the understandability of your diagrams.
Follow Standard UML Notations: Adhere to standard UML notations and symbols.
Consistency in using UML conventions ensures that your diagrams are easily understood by
others who are familiar with UML.
Keep Relationships Explicit: Clearly define and label relationships between elements. Use
appropriate arrows, multiplicity notations, and association names to communicate the nature
of connections between classes, objects, or use cases.
10. UML and Agile Development
Unified Modeling Language (UML) and Agile development are two different approaches to
software development, and they can be effectively integrated to enhance the overall
development process. Here are some key points about the relationship between UML and
Agile development:
10.1. UML in Agile Development
Visualization and Communication: UML diagrams provide a visual way to represent
system architecture, design, and behavior. In Agile development, where communication is
crucial, UML diagrams can serve as effective communication tools between team members,
stakeholders, and even non-technical audiences.
User Stories and Use Cases: UML use case diagrams can be used to capture and model user
stories in Agile development. Use cases help in understanding the system from an end-user
perspective and contribute to the creation of user stories.
Iterative Modeling: Agile methodologies emphasize iterative development, and UML can be
adapted to support this approach. UML models can be created and refined incrementally as
the understanding of the system evolves during each iteration.
Agile Modeling Techniques: Agile modeling techniques, such as user story mapping and
impact mapping, complement UML by providing lightweight ways to visualize and
9.
communicate requirements anddesign. These techniques align with the Agile principle of
valuing working software over comprehensive documentation.
10.2. Balancing Agility and Modeling
Adaptive Modeling: Adopt an adaptive modeling approach where UML is used to the extent
necessary for effective communication and understanding. The focus should be on delivering
value through working software rather than exhaustive documentation.
Team Empowerment: Empower the development team to choose the right level of modeling
based on the project’s needs. Team members should feel comfortable using UML as a
communication tool without feeling burdened by excessive modeling requirements.
11. Common Challenges in UML Modeling
Time-Intensive: UML modeling can be perceived as time-consuming, especially in fast-
paced Agile environments where rapid development is emphasized. Teams may struggle to
keep up with the need for frequent updates to UML diagrams.
Over-Documentation: Agile principles value working software over comprehensive
documentation. There’s a risk of over-documentation when using UML, as teams may spend
too much time on detailed diagrams that do not directly contribute to delivering value.
Changing Requirements: Agile projects often face changing requirements, and UML
diagrams may become quickly outdated. Keeping up with these changes and ensuring that
UML models reflect the current system state can be challenging.
Collaboration Issues: Agile emphasizes collaboration among team members, and sometimes
UML diagrams are seen as artifacts that only certain team members understand. Ensuring that
everyone can contribute to and benefit from UML models can be a challenge.
12. Benefits of Using UML Diagrams
Standardization: UML provides a standardized way of representing system models,
ensuring that developers and stakeholders can communicate using a common visual language.
Communication: UML diagrams serve as a powerful communication tool between
stakeholders, including developers, designers, testers, and business users. They help in
conveying complex ideas in a more understandable manner.
Visualization: UML diagrams facilitate the visualization of system components,
relationships, and processes. This visual representation aids in understanding and designing
complex systems.
Documentation: UML diagrams can be used as effective documentation tools. They provide
a structured and organized way to document various aspects of a system, such as architecture,
design, and behavior.
Analysis and Design: UML supports both analysis and design phases of software
development. It helps in modelling the requirements of a system and then transforming them
into a design that can be implemented.