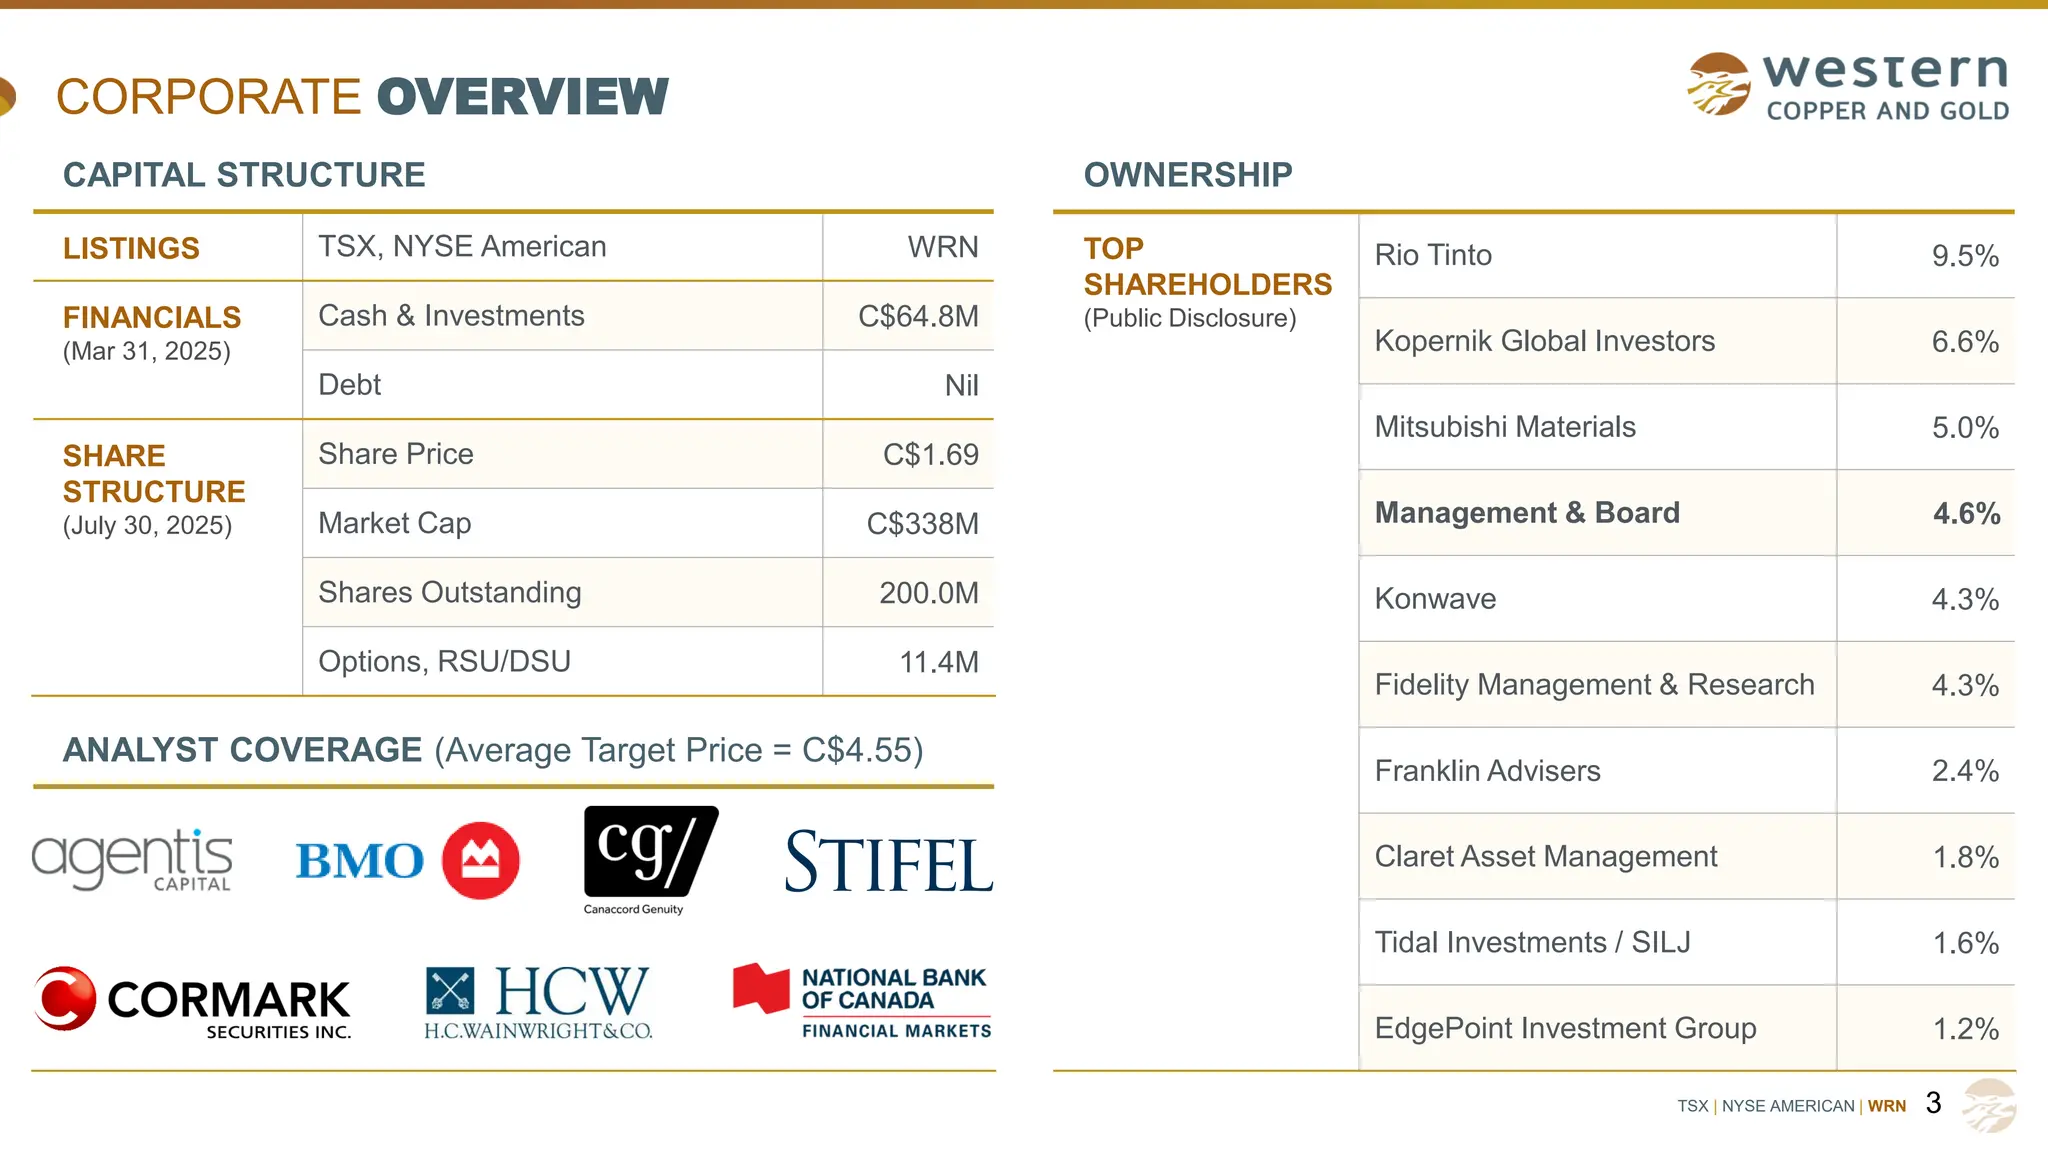
TSX | NYSEAMERICAN | WRN
CAUTIONARY NOTES
The information provided in this presentation is not
intended to be a comprehensive review of all matters and
developments concerning Western Copper and Gold
Corporation and its subsidiaries (collectively, the
“Company”). This document should be read in conjunction
with all other disclosure documents of the Company. No
securities commission or regulatory authority has
reviewed the accuracy or adequacy of the information
presented herein.
Note Regarding Forward-Looking Statements
Certain of the statements and information in this
presentation constitute “forward-looking statements”
within the meaning of the United States Private Securities
Litigation Reform Act of 1995 and “forward-looking
information” within the meaning of applicable Canadian
securities laws (together referred to herein as “forward-
looking statements”). Any statements or information that
express or involve discussions with respect to predictions,
expectations, beliefs, plans, projections, objectives,
assumptions, or future events or performance (often, but
not always, using words or phrases such as “expects”, “is
expected”, “anticipates”, “believes”, “plans”, “projects”,
“estimates”, “assumes”, “intends”, “strategies”, “targets”,
“goals”, “forecasts”, “objectives”, “budgets”, “schedules”,
“potential” or variations thereof or stating that certain
actions, events or results “may”, “could”, “would”, “might”
or “will” be taken, occur or be achieved, or the negative of
any of these terms and similar expressions) are not
statements of historical fact and may be forward-looking
statements. Such statements include, but are not limited
to, statements regarding mineral reserve and mineral
resource estimates, planned exploration and development
activities, corporate objectives, the economic prospects of
the Company’s projects, the Company’s future plans or
future revenues, and timing of development, or potential
expansions or improvements.
The forward-looking statements are necessarily based on
a number of estimates, assumptions, beliefs, expectations
and opinions of management as of the date of this
presentation that, while considered reasonable by
management, are inherently subject to significant
business, economic and competitive uncertainties and
contingencies. These estimates, assumptions, beliefs,
expectations and opinions include, without limitation, with
respect to any mineral reserve or mineral resource
estimate, the key assumptions and parameters on which
such estimates are based, prevailing and projected
market prices and foreign exchange rates, projected
capital and operating costs, continued availability of
capital and financing, availability of equipment and
personnel required for construction and operations, the
Company not experiencing unforeseen delays,
unexpected geological or other effects, equipment
failures, permitting delays, and general economic, market
or business conditions.
Forward-looking statements are subject to known and
unknown risks and uncertainties which could cause actual
results to differ materially from estimated results. Such
risks and uncertainties include, but are not limited to, the
Company’s ability to raise sufficient capital to fund
development; changes in general economic conditions or
financial markets, changes in prices for the Company’s
mineral products or increases in input costs; uncertainties
relating to interpretation of drill results and the geological
continuity and grade of mineral deposits; that mineral
resources and mineral reserves are not as estimated;
risks related to cooperation of government agencies and
First Nations in the exploration and development of the
property; litigation; legislative, environmental and other
judicial, regulatory, political and competitive developments
in Canada; technological and operational difficulties or
inability to obtain permits encountered in connection with
exploration and development activities; labour relations
matters, changing foreign exchange rates, and other
factors described under the heading “Risk Factors” in the
Company’s annual information form for the most recently
completed financial year and its other publicly filed
disclosure documents. This list is not exhaustive of the
factors that may affect any of the Company’s forward-
looking statements.
Although the forward-looking statements contained in this
presentation are based upon what management believes
are reasonable assumptions, there can be no assurance
that actual results will be consistent with these forward-
looking statements. All forward-looking statements in this
presentation are qualified by this cautionary note.
Accordingly, readers should not place undue reliance on
such statements. Other than as specifically required by
applicable laws, the Company is under no obligation and
expressly disclaims any such obligation to update or alter
the forward-looking statements whether as a result of new
information, future events or otherwise. These forward-
looking statements are made as of the date of this
presentation.
Note to U.S. Readers/Investors
Information regarding the Company’s mining operations
included in this presentation has been prepared in
accordance with the requirements of the securities laws in
effect in Canada, which differ in certain material respects
from the disclosure requirements of United States
securities laws applicable to domestic United States
issuers. The terms “mineral reserve”, “proven mineral
reserve” and “probable mineral reserve” are Canadian
mining terms as defined in accordance with Canadian
National Instrument 43-101 – Standards of Disclosure for
Mineral Projects (“NI 43-101”) and the Canadian Institute
of Mining, Metallurgy and Petroleum (the “CIM”) Definition
Standards for Mineral Resources and Mineral Reserves,
adopted by the CIM Council, as amended. NI 43-101 is a
rule developed by the Canadian Securities Administrators
that establishes standards for all public disclosure an
issuer makes of scientific and technical information
concerning mineral projects. The definitions of these
terms and other mining terms, such as “inferred mineral
resource”, differ from the definitions of such terms, if any,
for purposes of the disclosure requirements of the U.S.
Securities and Exchange Commission (the “SEC”).
Accordingly, information in this presentation describing
the Company’s mineral deposits may not be comparable
to similar information made public by issuers subject to
the SEC’s reporting and disclosure requirements
applicable to domestic United States issuers.
Note Regarding Inferred Mineral Resources
Under Canadian rules, estimates of inferred mineral
resources are considered too speculative geologically to
have the economic considerations applied to them to
enable them to be categorized as mineral reserves and,
accordingly, may not form the basis of feasibility or pre-
feasibility studies, or economic studies except for a
preliminary economic assessment as defined under NI
43-101. Investors are cautioned not to assume that part or
all of an inferred mineral resource exists or is
economically or legally mineable. Mineral resources that
are not mineral reserves do not have demonstrated
economic viability.
2
TSX | NYSEAMERICAN | WRN
INVESTMENT HIGHLIGHTS
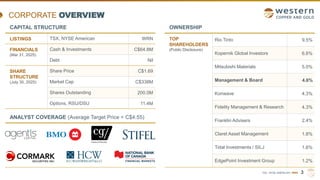
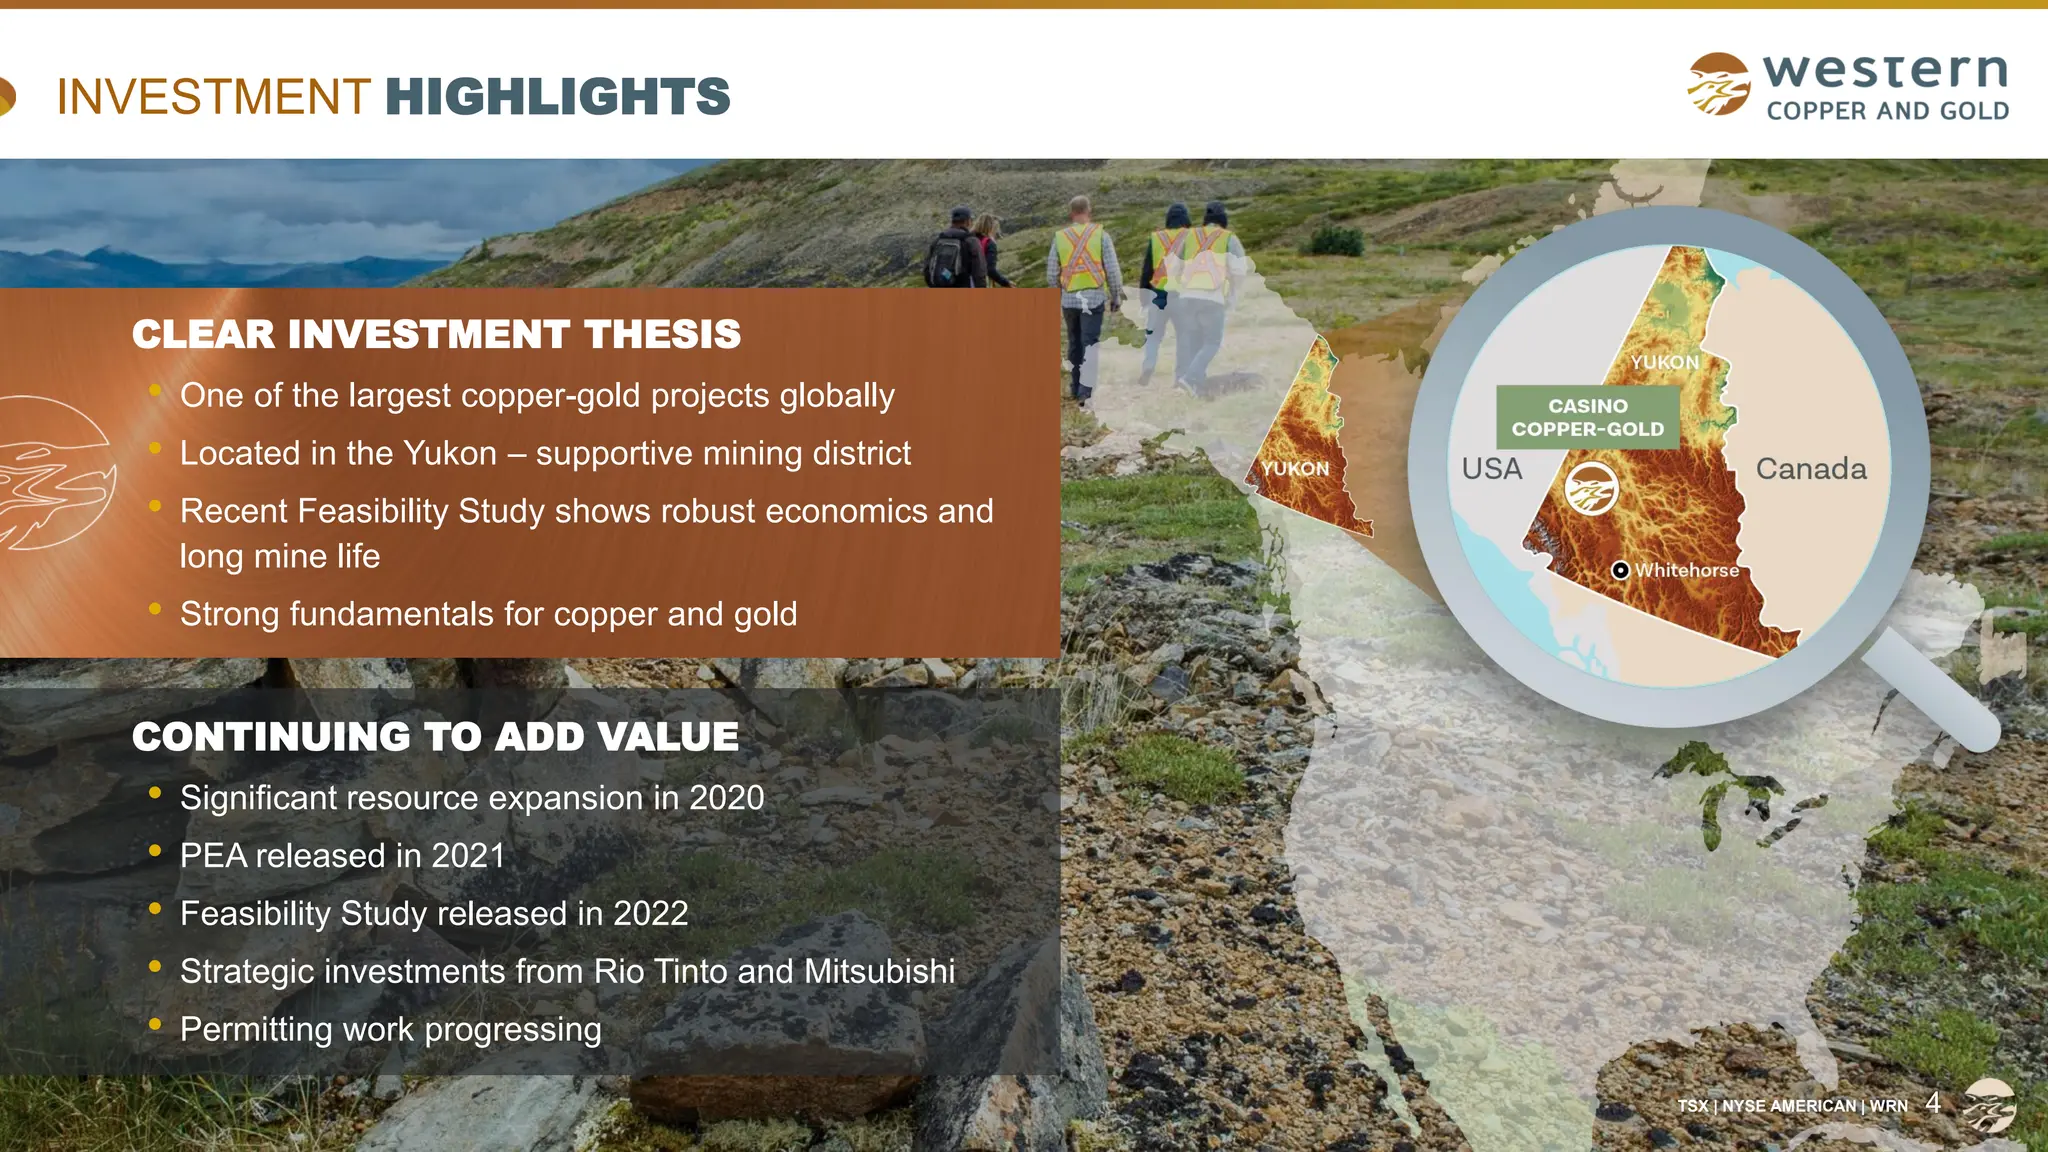
CLEAR INVESTMENT THESIS
• One of the largest copper-gold projects globally
• Located in the Yukon – supportive mining district
• Recent Feasibility Study shows robust economics and
long mine life
• Strong fundamentals for copper and gold
CONTINUING TO ADD VALUE
• Significant resource expansion in 2020
• PEA released in 2021
• Feasibility Study released in 2022
• Strategic investments from Rio Tinto and Mitsubishi
• Permitting work progressing
TSX | NYSE AMERICAN | WRN 4
5.
TSX | NYSEAMERICAN | WRN
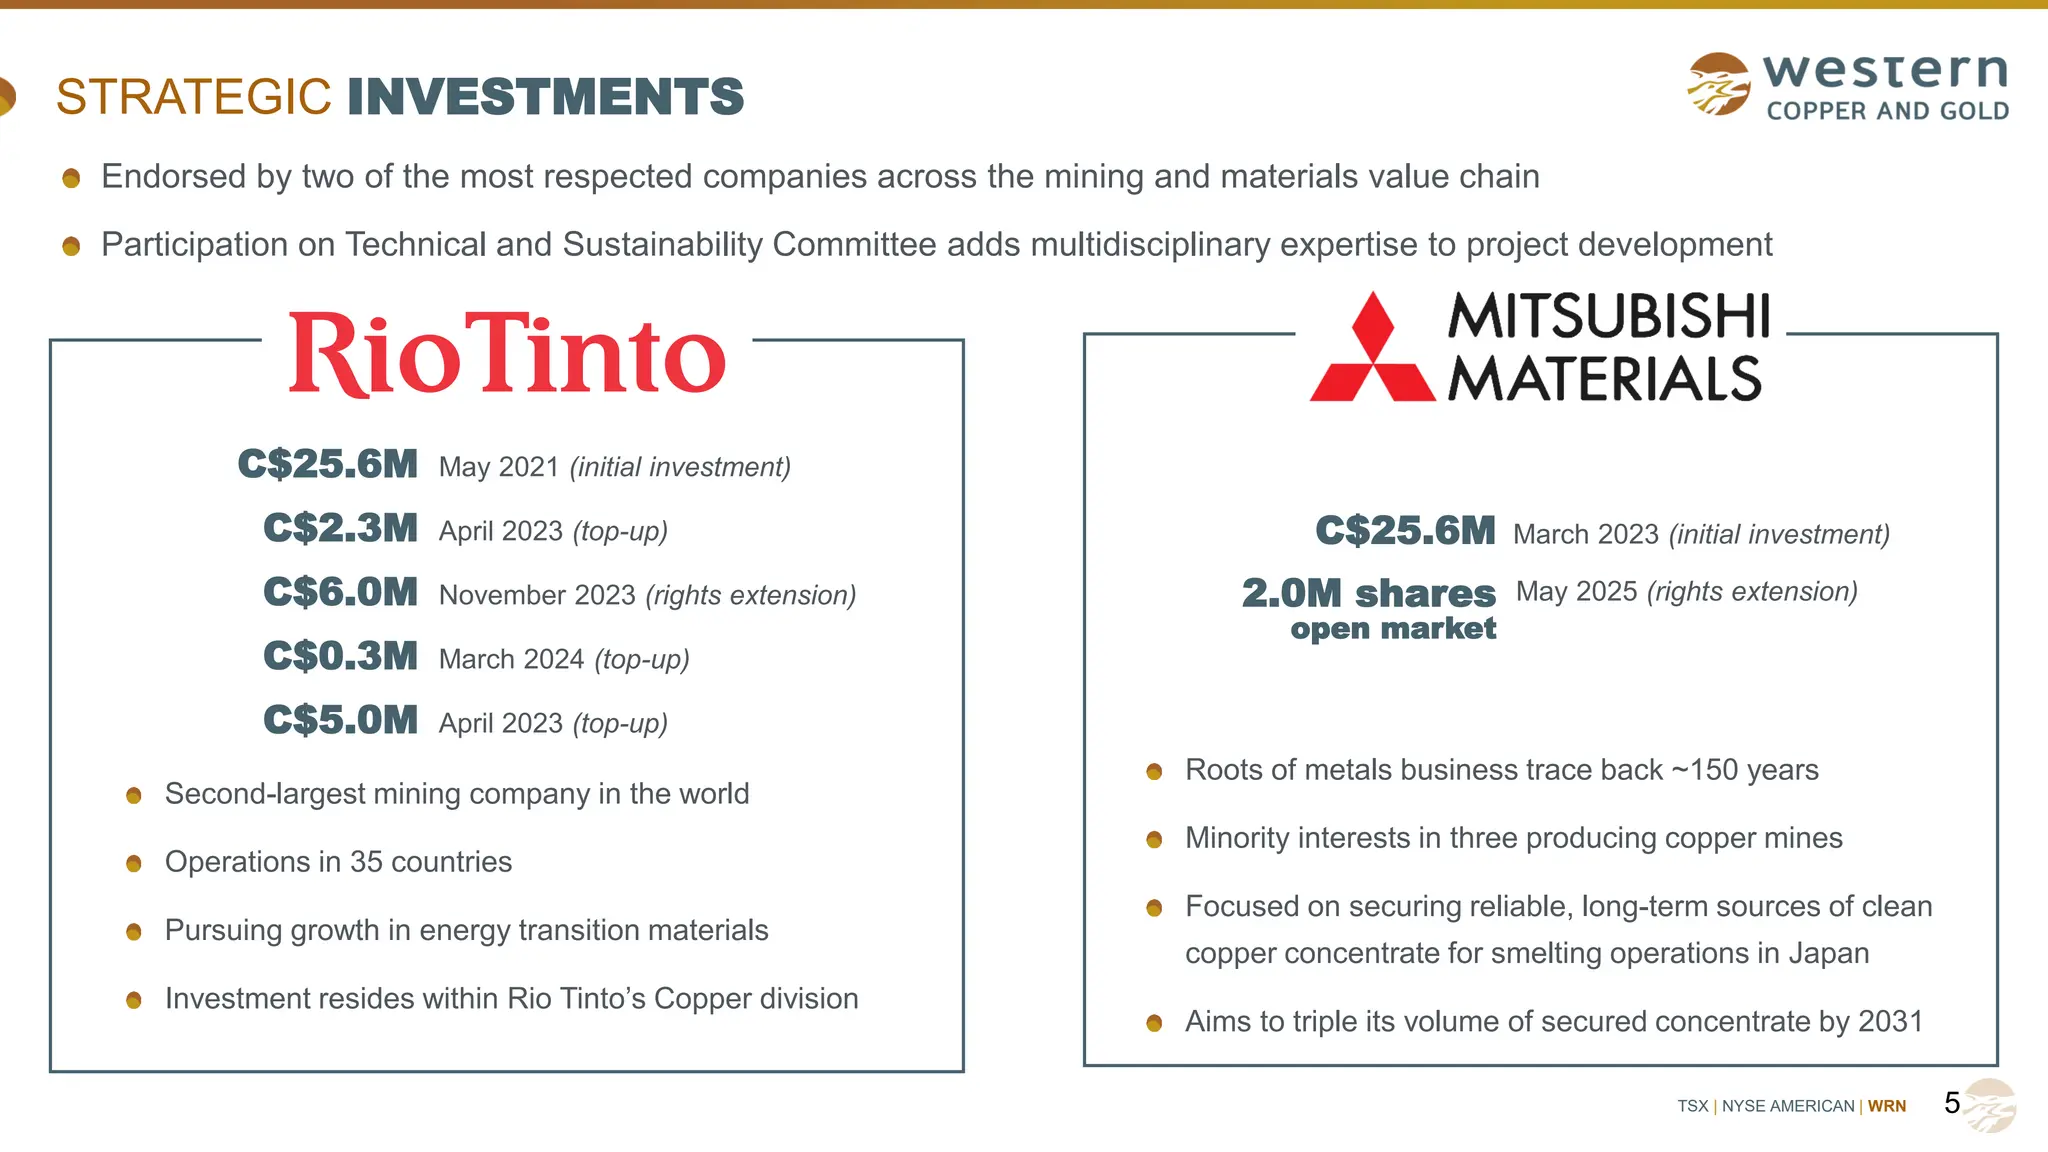
STRATEGIC INVESTMENTS
5
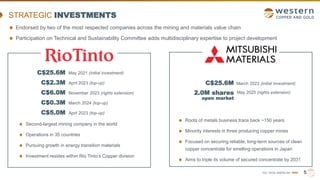
Endorsed by two of the most respected companies across the mining and materials value chain
Participation on Technical and Sustainability Committee adds multidisciplinary expertise to project development
Second-largest mining company in the world
Operations in 35 countries
Pursuing growth in energy transition materials
Investment resides within Rio Tinto’s Copper division
Roots of metals business trace back ~150 years
Minority interests in three producing copper mines
Focused on securing reliable, long-term sources of clean
copper concentrate for smelting operations in Japan
Aims to triple its volume of secured concentrate by 2031
C$25.6M
C$2.3M
C$6.0M
C$0.3M
C$5.0M
May 2021 (initial investment)
April 2023 (top-up)
November 2023 (rights extension)
March 2024 (top-up)
April 2023 (top-up)
C$25.6M March 2023 (initial investment)
May 2025 (rights extension)
2.0M shares
open market
6.
TSX | NYSEAMERICAN | WRN
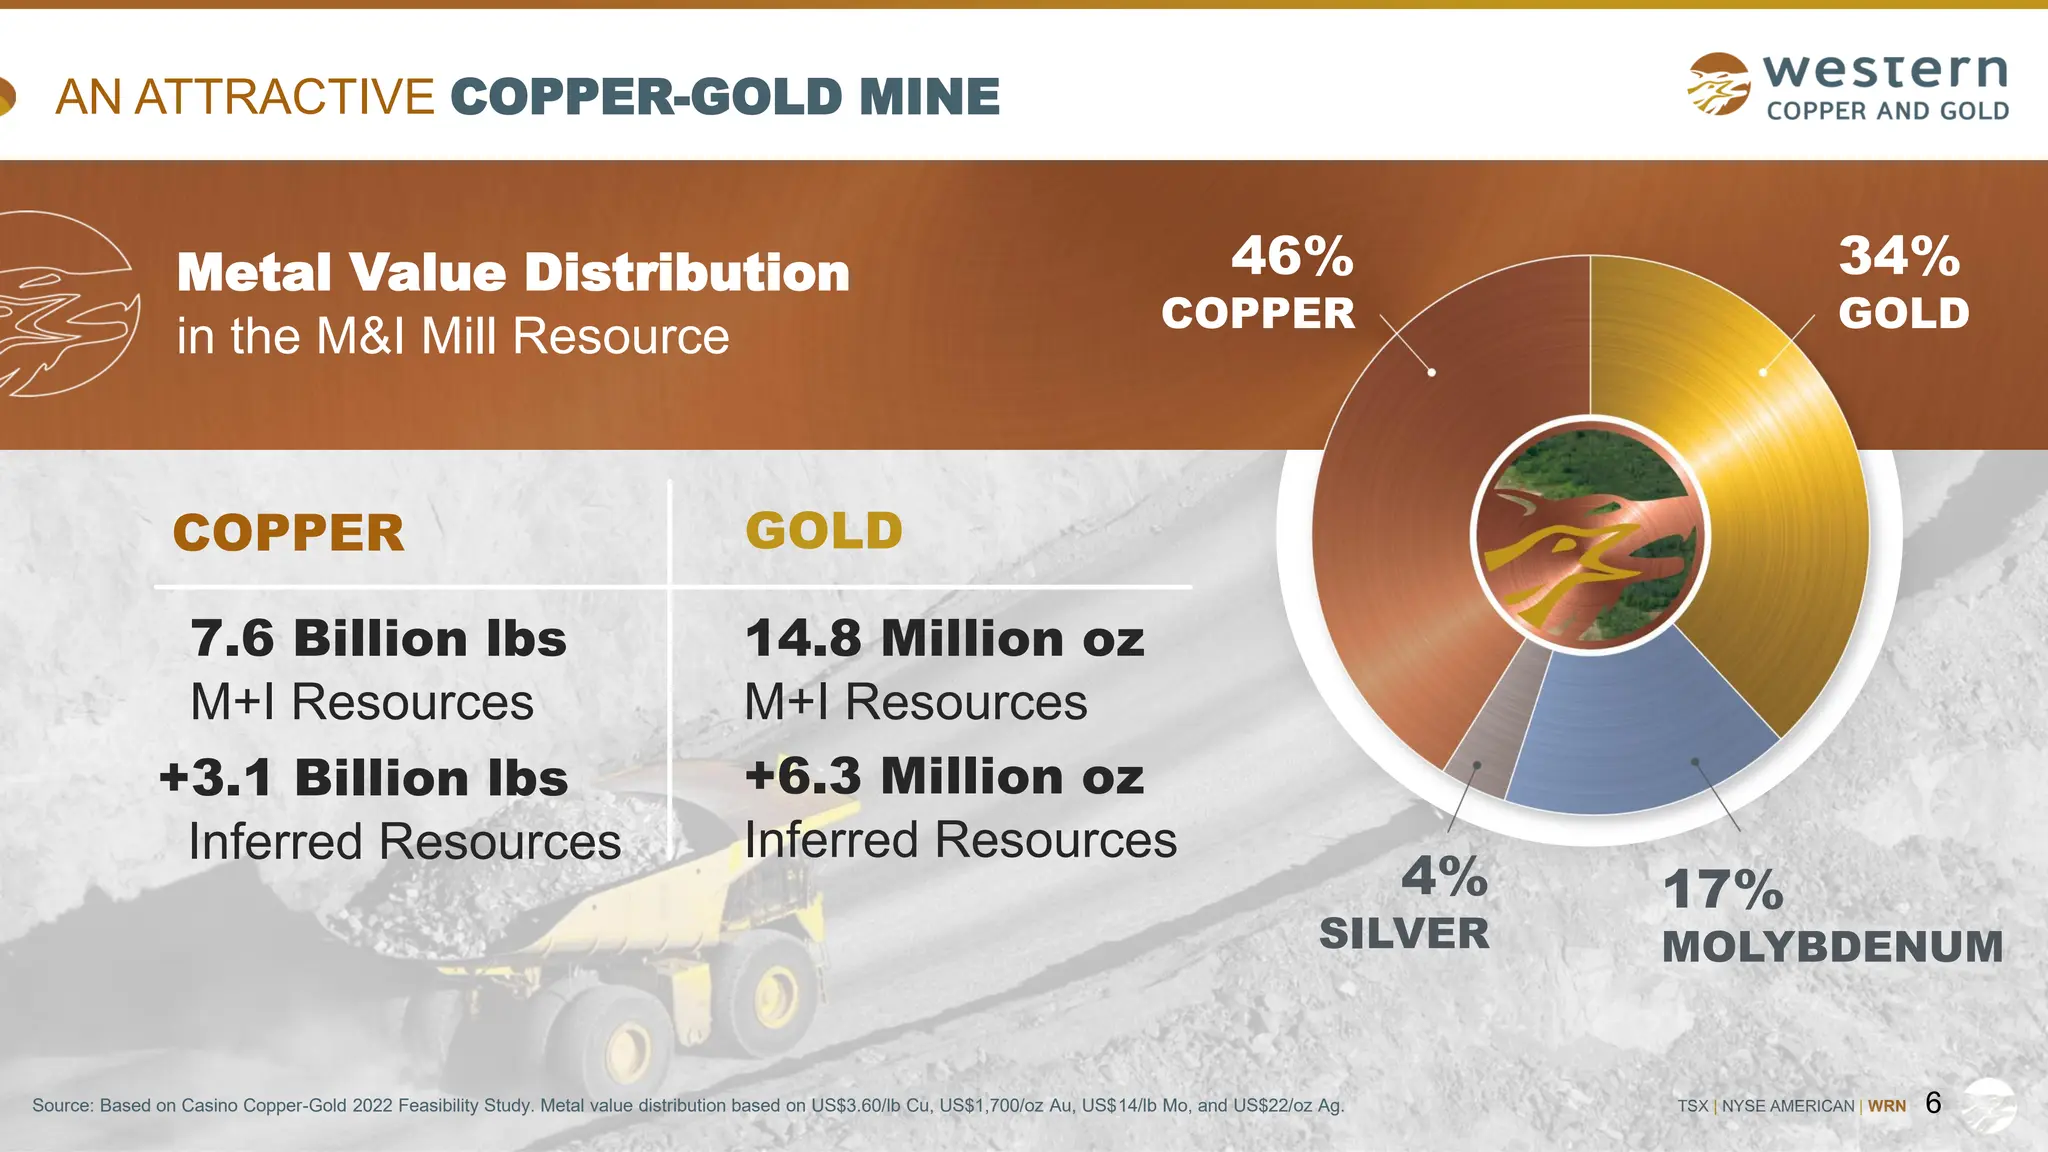
AN ATTRACTIVE COPPER-GOLD MINE
6
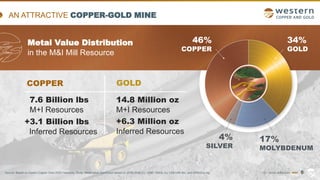
Metal Value Distribution
in the M&I Mill Resource
46%
COPPER
34%
GOLD
4%
SILVER
17%
MOLYBDENUM
COPPER GOLD
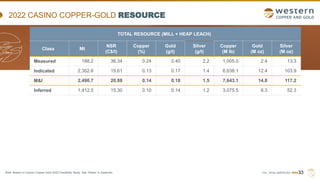
7.6 Billion lbs
M+I Resources
+3.1 Billion lbs
Inferred Resources
14.8 Million oz
M+I Resources
+6.3 Million oz
Inferred Resources
Source: Based on Casino Copper-Gold 2022 Feasibility Study. Metal value distribution based on US$3.60/lb Cu, US$1,700/oz Au, US$14/lb Mo, and US$22/oz Ag.
7.
TSX | NYSEAMERICAN | WRN
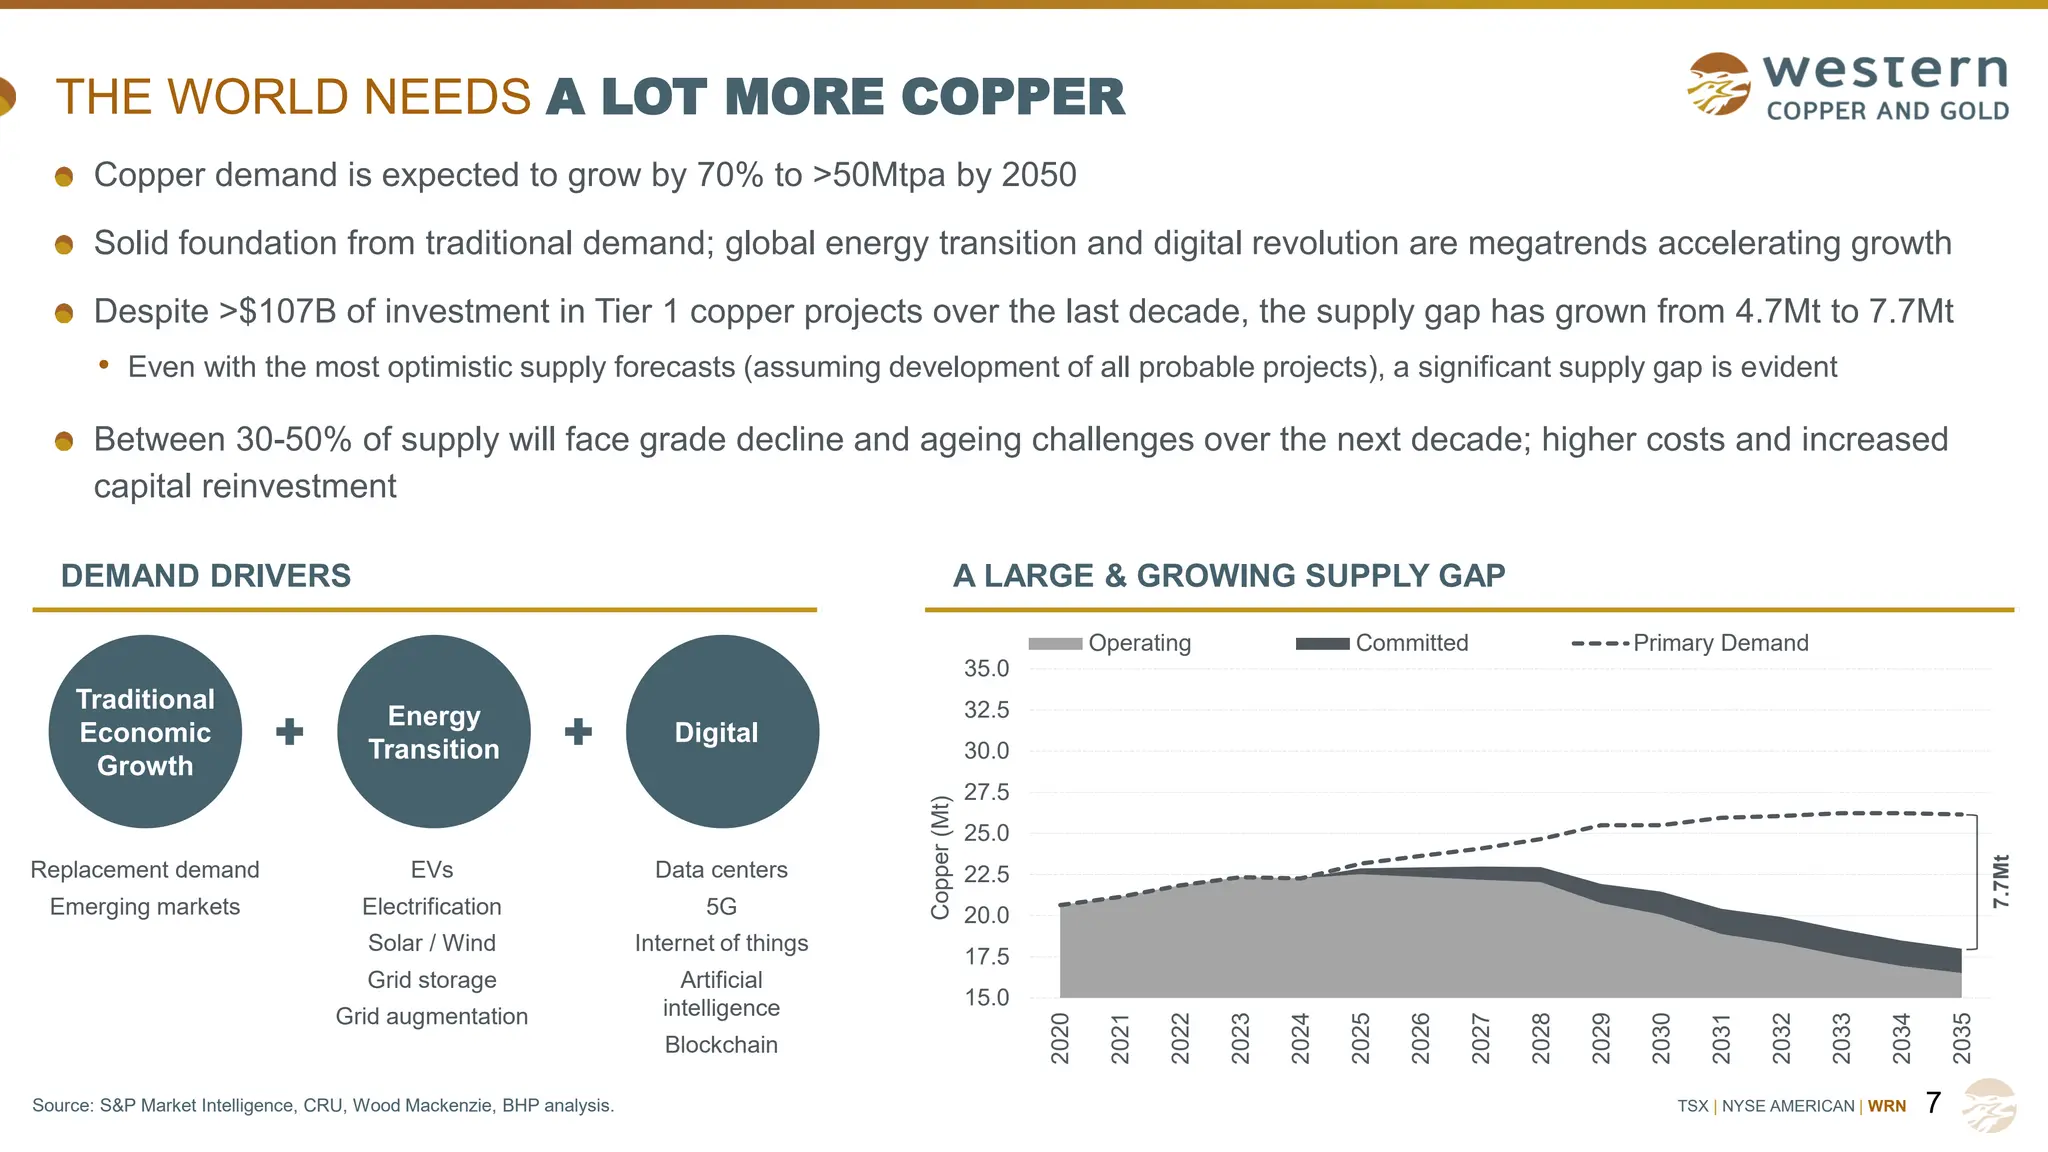
Source: S&P Market Intelligence, CRU, Wood Mackenzie, BHP analysis.
DEMAND DRIVERS
THE WORLD NEEDS A LOT MORE COPPER
7
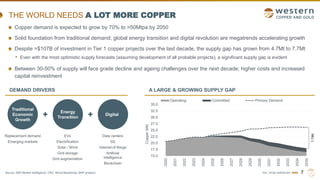
Copper demand is expected to grow by 70% to >50Mtpa by 2050
Solid foundation from traditional demand; global energy transition and digital revolution are megatrends accelerating growth
Despite >$107B of investment in Tier 1 copper projects over the last decade, the supply gap has grown from 4.7Mt to 7.7Mt
• Even with the most optimistic supply forecasts (assuming development of all probable projects), a significant supply gap is evident
Between 30-50% of supply will face grade decline and ageing challenges over the next decade; higher costs and increased
capital reinvestment
A LARGE & GROWING SUPPLY GAP
Traditional
Economic
Growth
Energy
Transition
Digital
EVs
Electrification
Solar / Wind
Grid storage
Grid augmentation
Data centers
5G
Internet of things
Artificial
intelligence
Blockchain
Replacement demand
Emerging markets
15.0
17.5
20.0
22.5
25.0
27.5
30.0
32.5
35.0
2020
2021
2022
2023
2024
2025
2026
2027
2028
2029
2030
2031
2032
2033
2034
2035
Copper
(Mt)
Operating Committed Primary Demand
7.7Mt
8.
TSX | NYSEAMERICAN | WRN
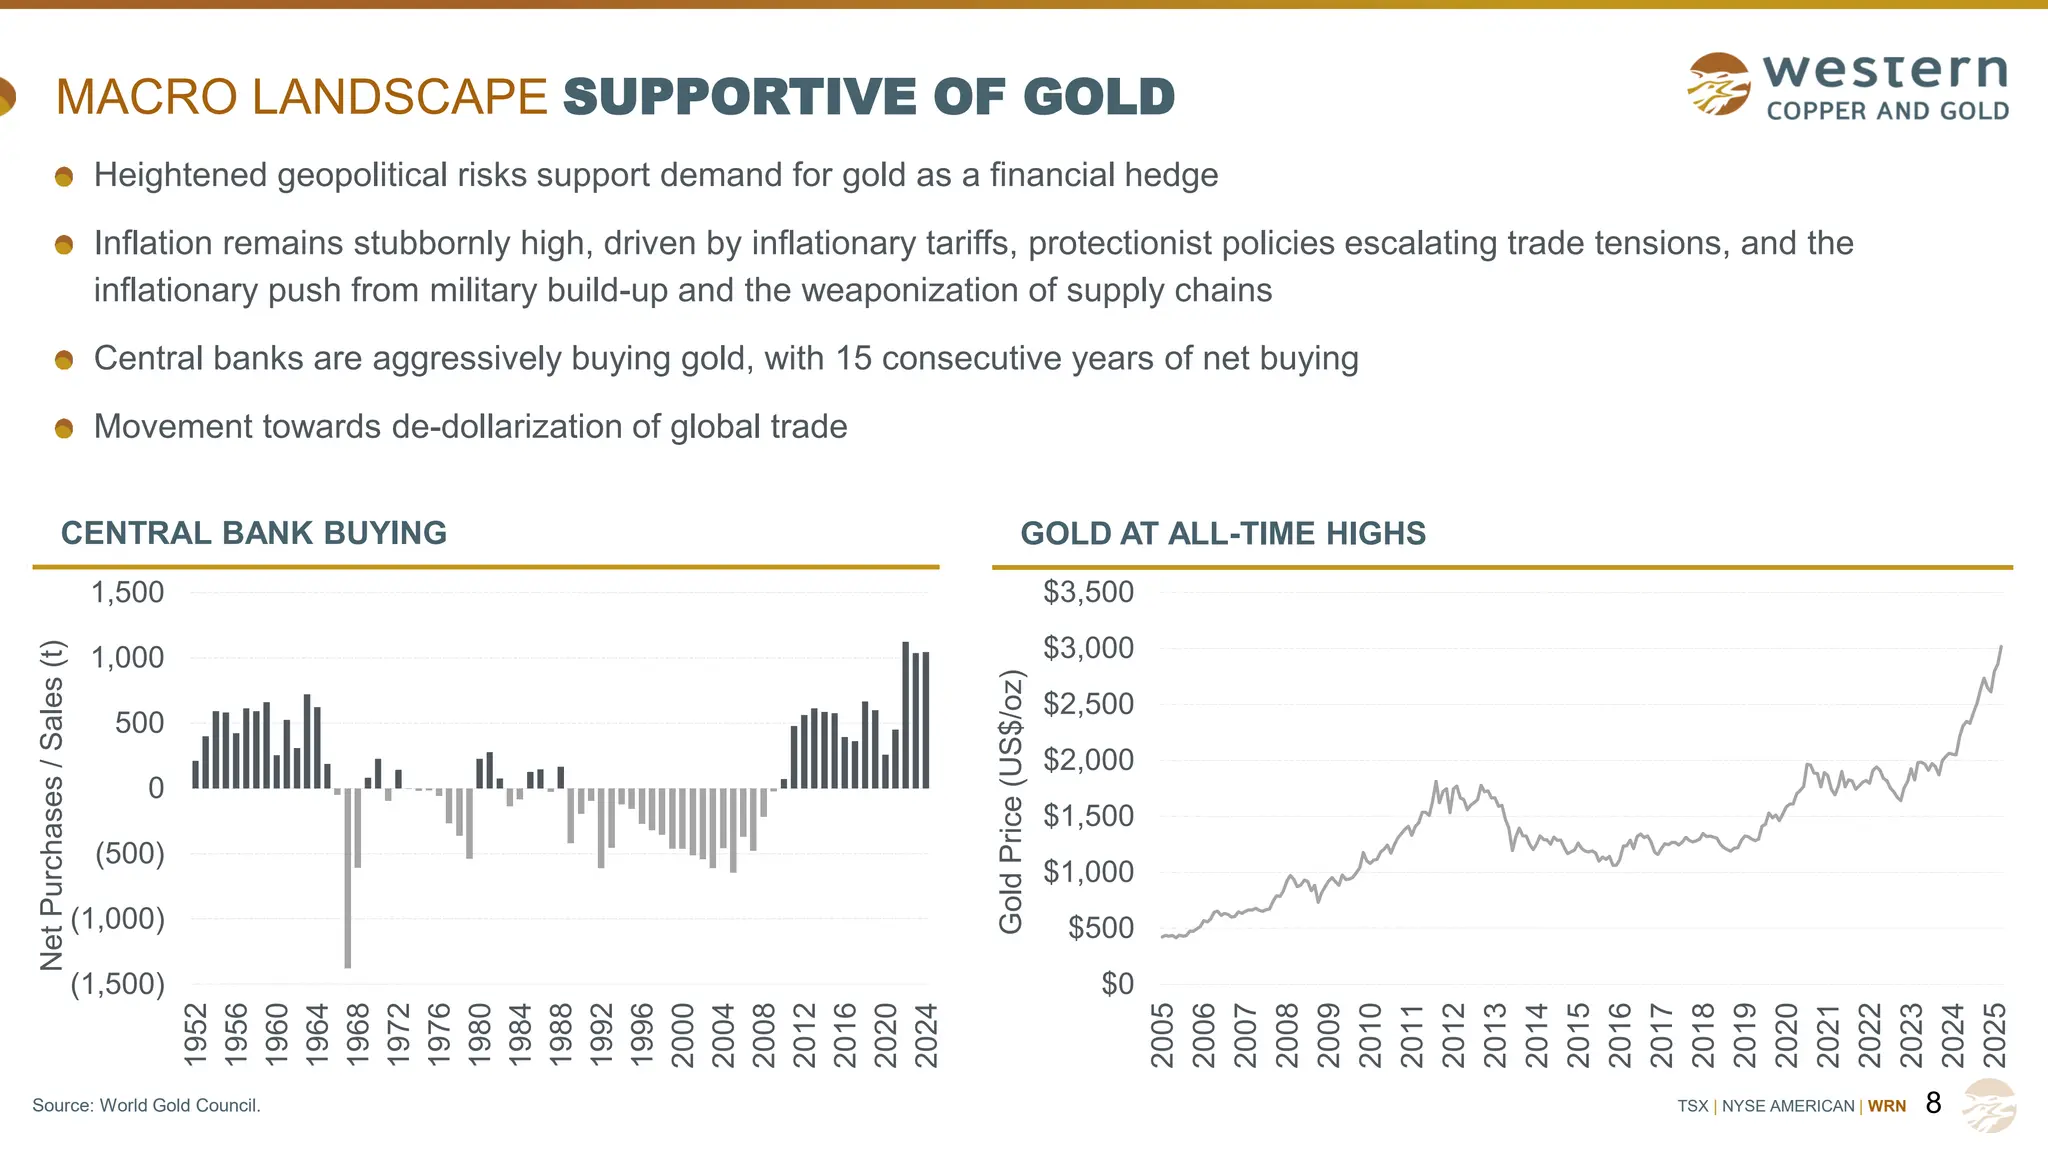
MACRO LANDSCAPE SUPPORTIVE OF GOLD
8
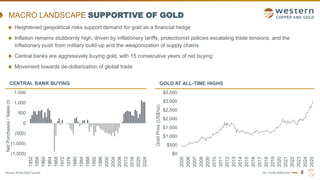
GOLD AT ALL-TIME HIGHS
CENTRAL BANK BUYING
(1,500)
(1,000)
(500)
0
500
1,000
1,500
1952
1956
1960
1964
1968
1972
1976
1980
1984
1988
1992
1996
2000
2004
2008
2012
2016
2020
2024
Net
Purchases
/
Sales
(t)
$0
$500
$1,000
$1,500
$2,000
$2,500
$3,000
$3,500
2005
2006
2007
2008
2009
2010
2011
2012
2013
2014
2015
2016
2017
2018
2019
2020
2021
2022
2023
2024
2025
Gold
Price
(US$/oz)
Heightened geopolitical risks support demand for gold as a financial hedge
Inflation remains stubbornly high, driven by inflationary tariffs, protectionist policies escalating trade tensions, and the
inflationary push from military build-up and the weaponization of supply chains
Central banks are aggressively buying gold, with 15 consecutive years of net buying
Movement towards de-dollarization of global trade
Source: World Gold Council.
9.
TSX | NYSEAMERICAN | WRN
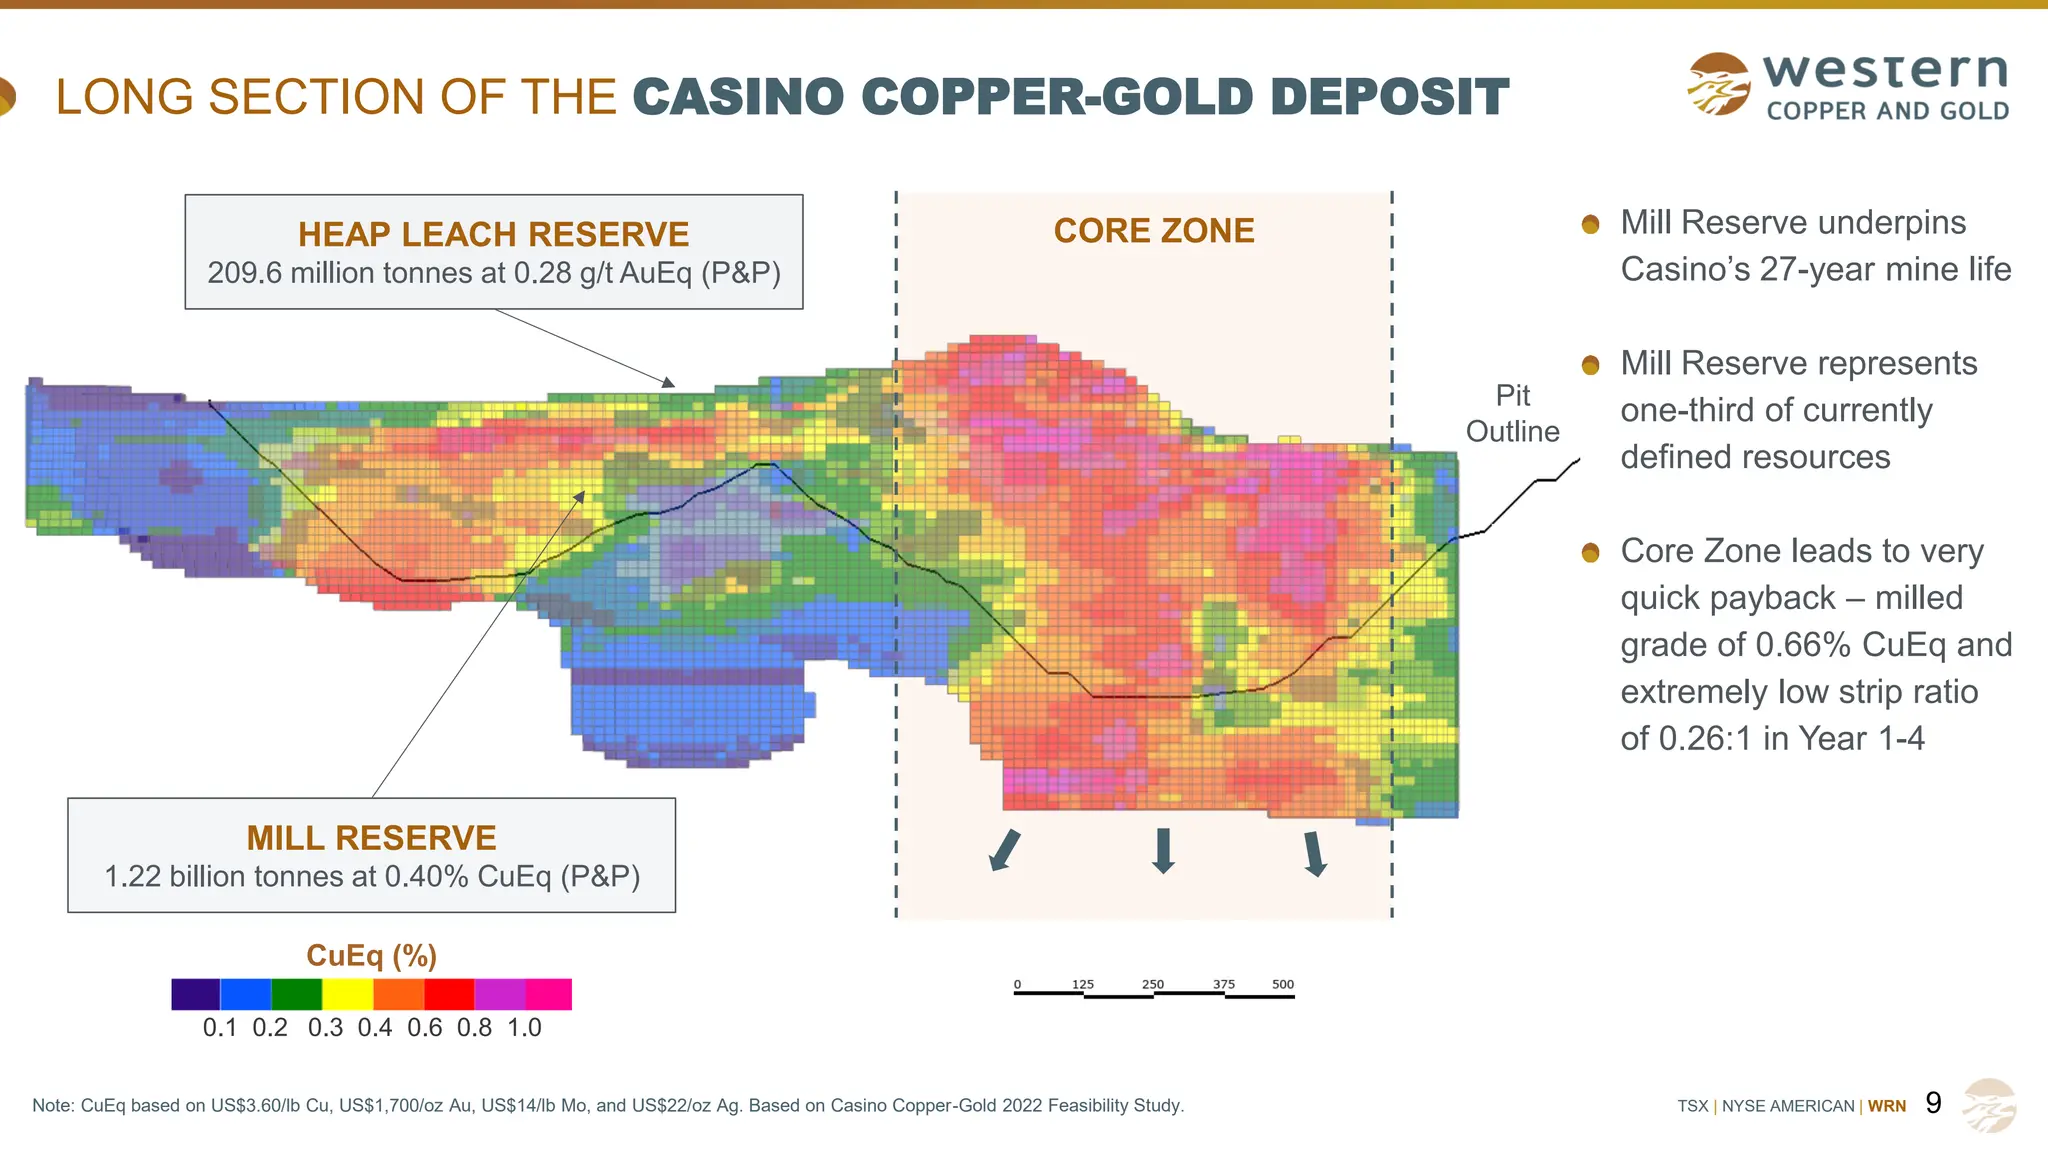
Note: CuEq based on US$3.60/lb Cu, US$1,700/oz Au, US$14/lb Mo, and US$22/oz Ag. Based on Casino Copper-Gold 2022 Feasibility Study.
LONG SECTION OF THE CASINO COPPER-GOLD DEPOSIT
9
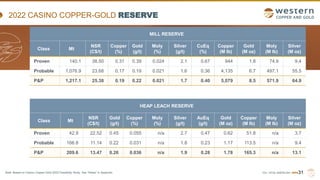
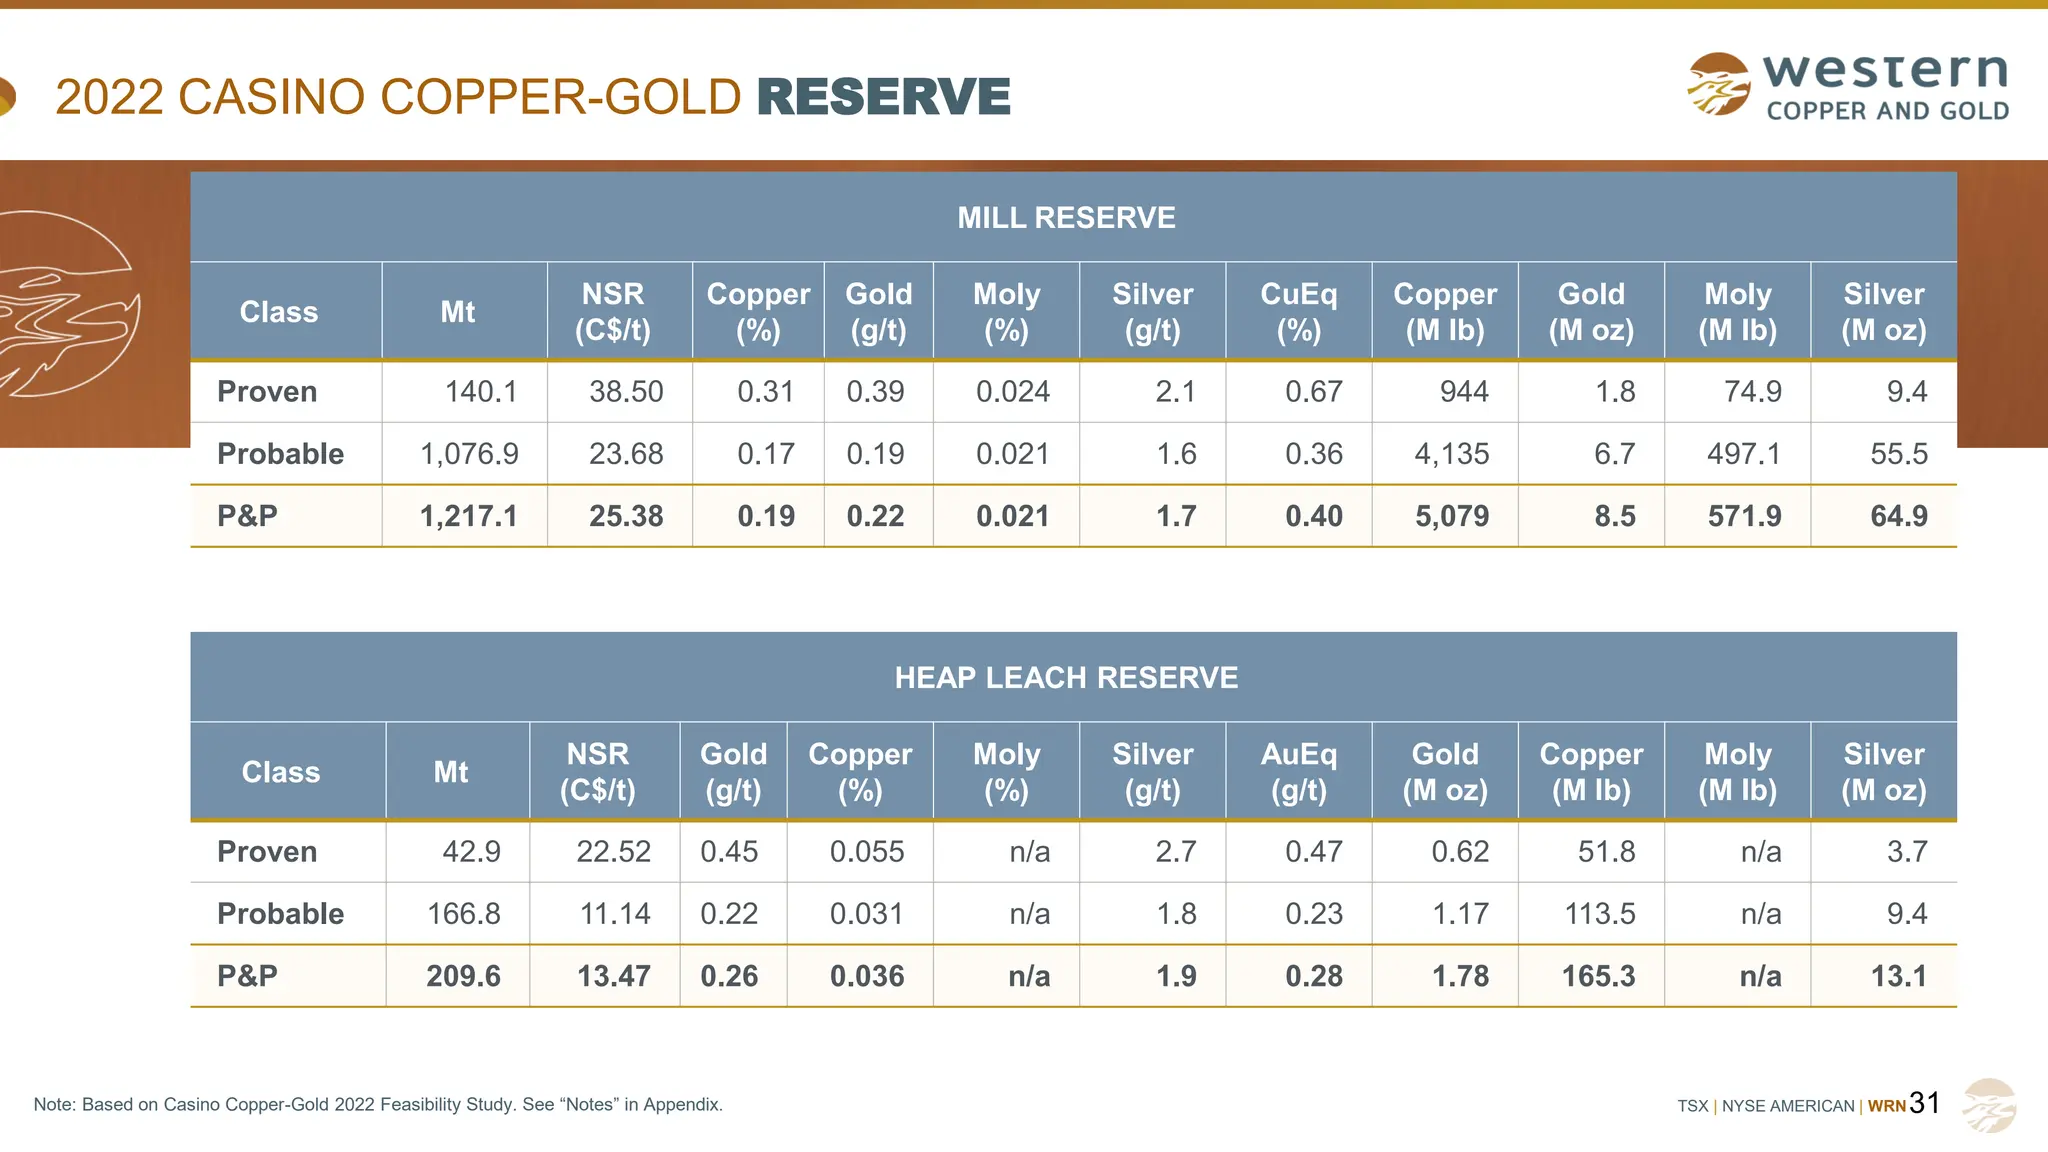
HEAP LEACH RESERVE
209.6 million tonnes at 0.28 g/t AuEq (P&P)
MILL RESERVE
1.22 billion tonnes at 0.40% CuEq (P&P)
CORE ZONE
Pit
Outline
CuEq (%)
1.0
0.8
0.6
0.4
0.3
0.2
0.1
Mill Reserve underpins
Casino’s 27-year mine life
Mill Reserve represents
one-third of currently
defined resources
Core Zone leads to very
quick payback – milled
grade of 0.66% CuEq and
extremely low strip ratio
of 0.26:1 in Year 1-4
10.
TSX | NYSEAMERICAN | WRN
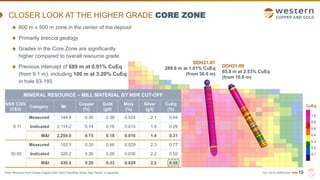
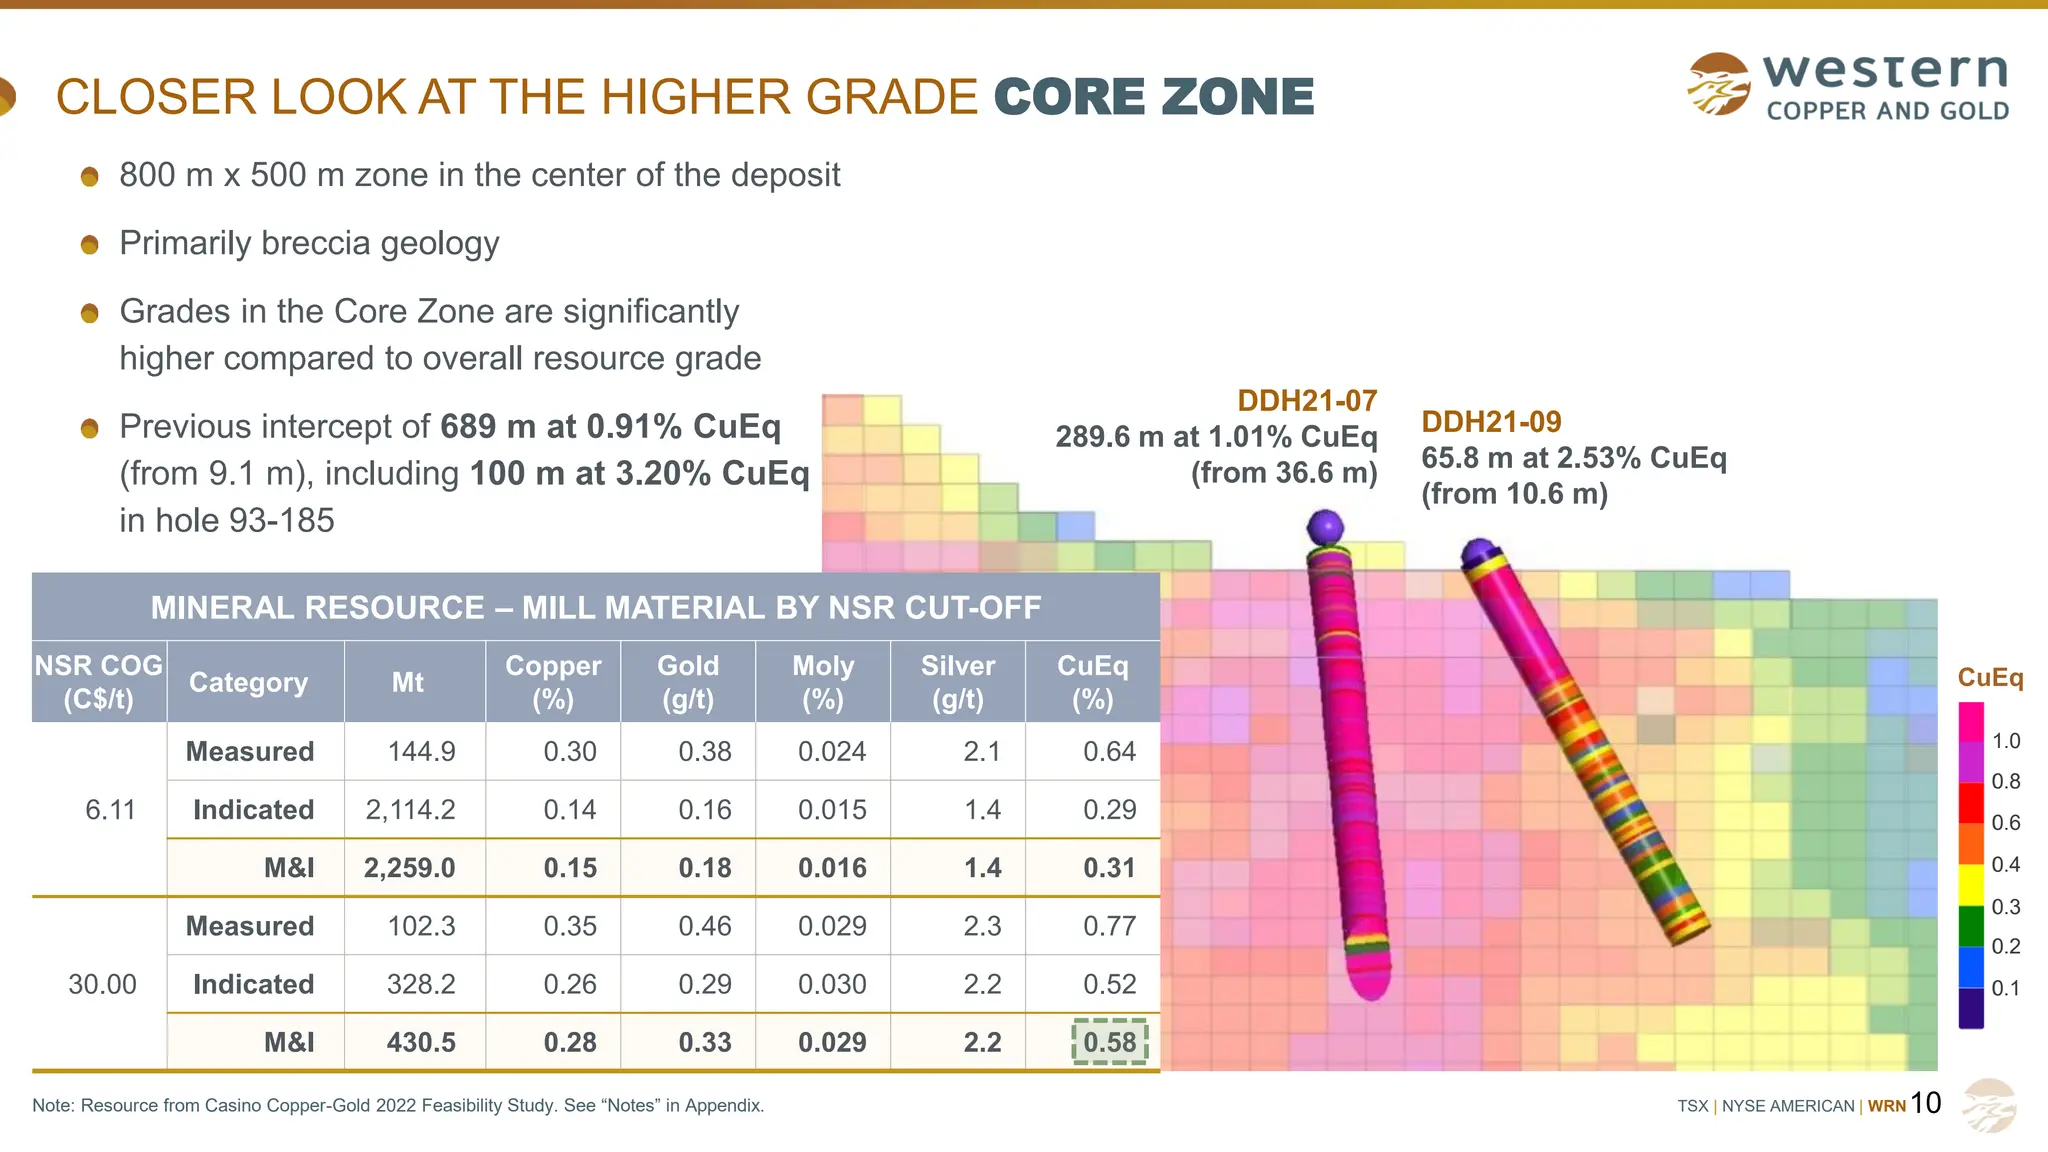
CLOSER LOOK AT THE HIGHER GRADE CORE ZONE
10
DDH21-09
65.8 m at 2.53% CuEq
(from 10.6 m)
DDH21-07
289.6 m at 1.01% CuEq
(from 36.6 m)
CuEq
1.0
0.8
0.6
0.4
0.3
0.2
0.1
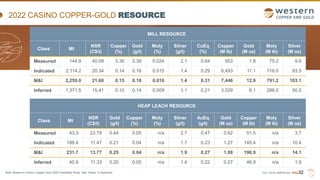
MINERAL RESOURCE – MILL MATERIAL BY NSR CUT-OFF
NSR COG
(C$/t)
Category Mt
Copper
(%)
Gold
(g/t)
Moly
(%)
Silver
(g/t)
CuEq
(%)
6.11
Measured 144.9 0.30 0.38 0.024 2.1 0.64
Indicated 2,114.2 0.14 0.16 0.015 1.4 0.29
M&I 2,259.0 0.15 0.18 0.016 1.4 0.31
30.00
Measured 102.3 0.35 0.46 0.029 2.3 0.77
Indicated 328.2 0.26 0.29 0.030 2.2 0.52
M&I 430.5 0.28 0.33 0.029 2.2 0.58
800 m x 500 m zone in the center of the deposit
Primarily breccia geology
Grades in the Core Zone are significantly
higher compared to overall resource grade
Previous intercept of 689 m at 0.91% CuEq
(from 9.1 m), including 100 m at 3.20% CuEq
in hole 93-185
Note: Resource from Casino Copper-Gold 2022 Feasibility Study. See “Notes” in Appendix.
11.
TSX | NYSEAMERICAN | WRN 11
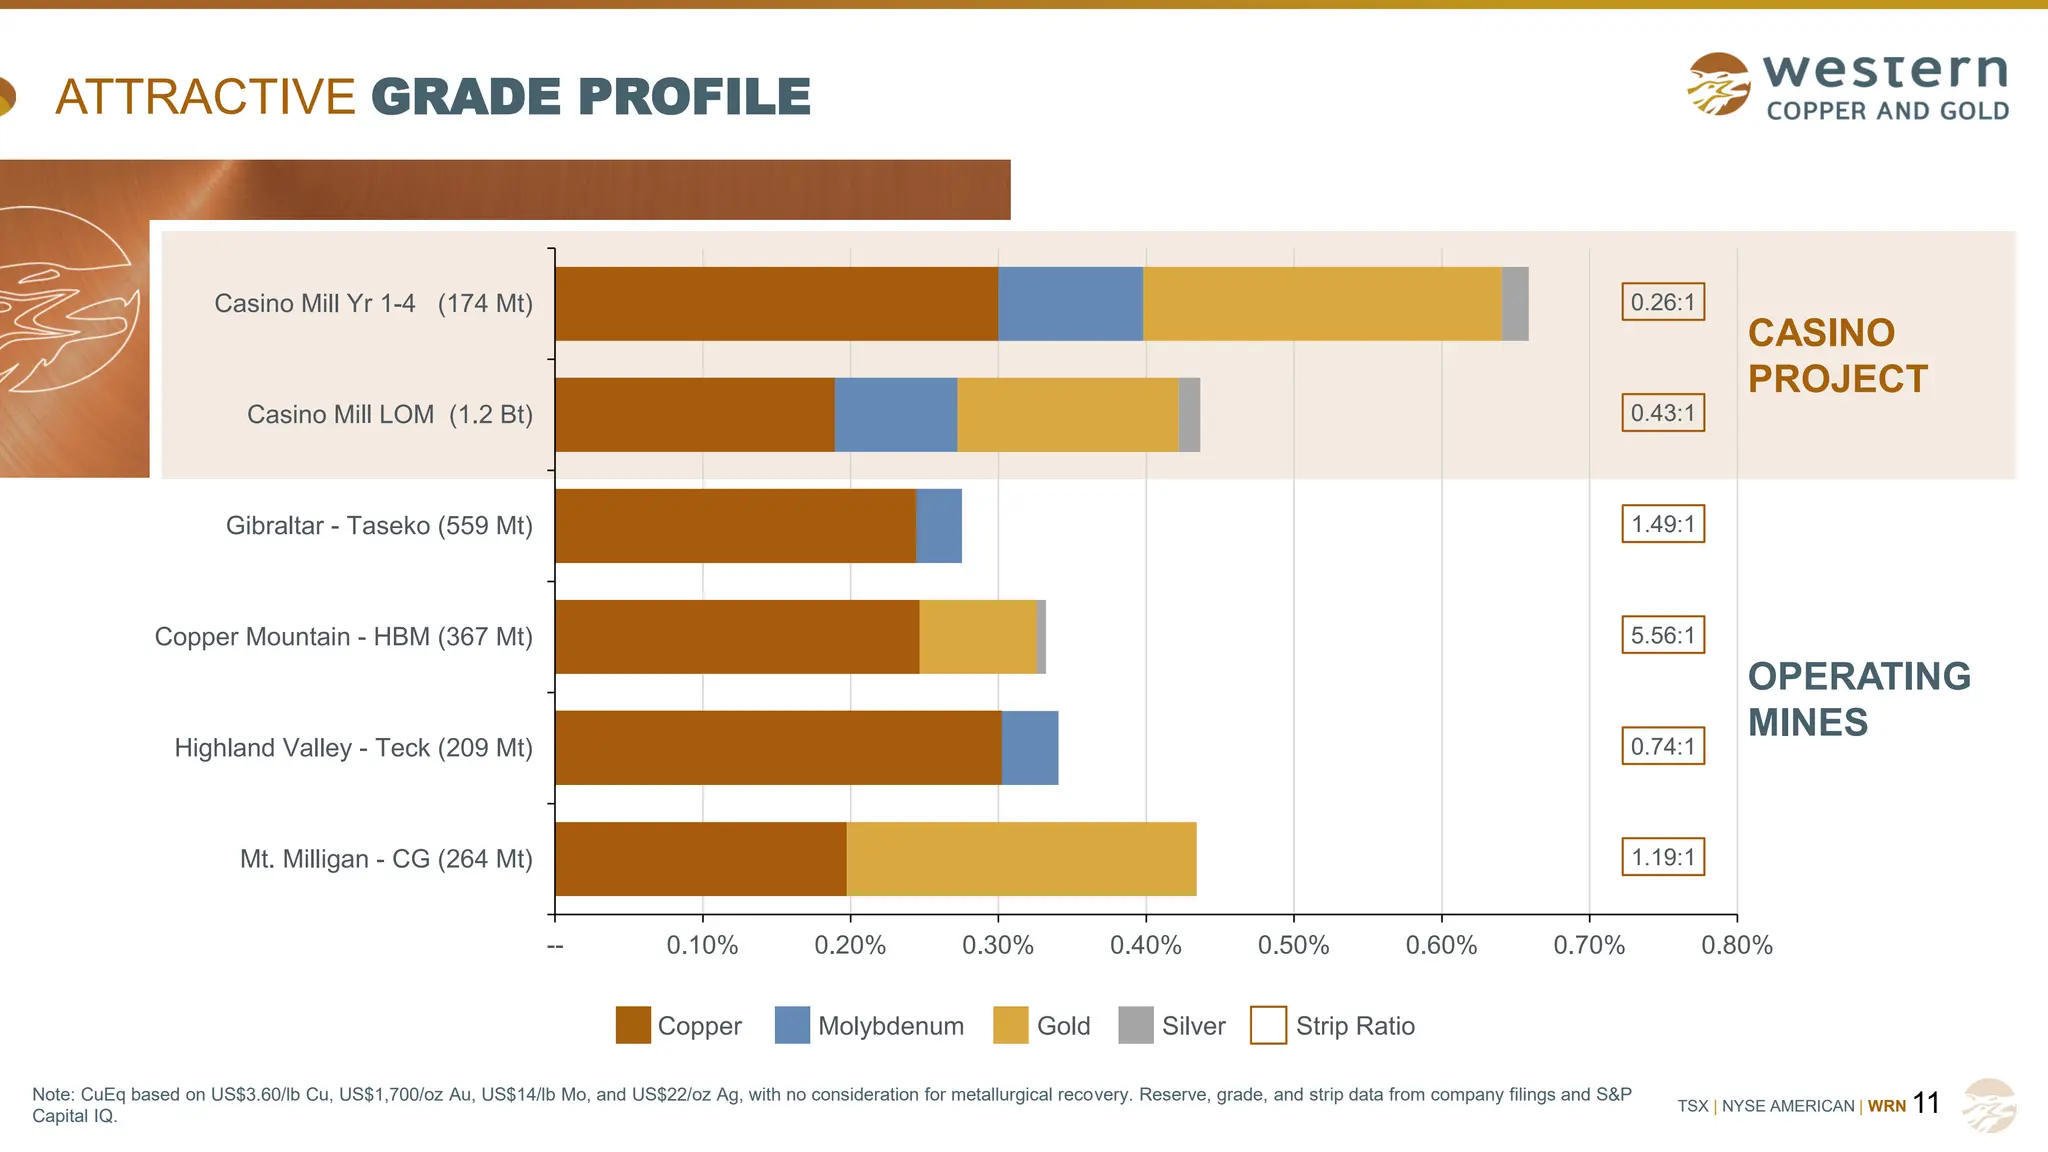
CASINO
PROJECT
OPERATING
MINES
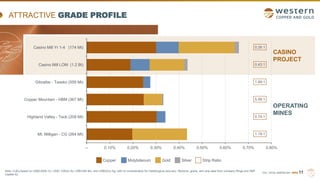
ATTRACTIVE GRADE PROFILE
Copper Molybdenum Gold Silver Strip Ratio
Note: CuEq based on US$3.60/lb Cu, US$1,700/oz Au, US$14/lb Mo, and US$22/oz Ag, with no consideration for metallurgical recovery. Reserve, grade, and strip data from company filings and S&P
Capital IQ.
1.19:1
0.74:1
5.56:1
1.49:1
0.43:1
0.26:1
-- 0.10% 0.20% 0.30% 0.40% 0.50% 0.60% 0.70% 0.80%
Mt. Milligan - CG (264 Mt)
Highland Valley - Teck (209 Mt)
Copper Mountain - HBM (367 Mt)
Gibraltar - Taseko (559 Mt)
Casino Mill LOM (1.2 Bt)
Casino Mill Yr 1-4 (174 Mt)
12.
TSX | NYSEAMERICAN | WRN
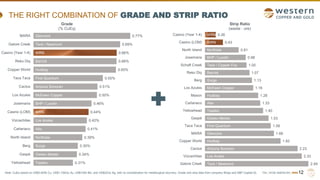
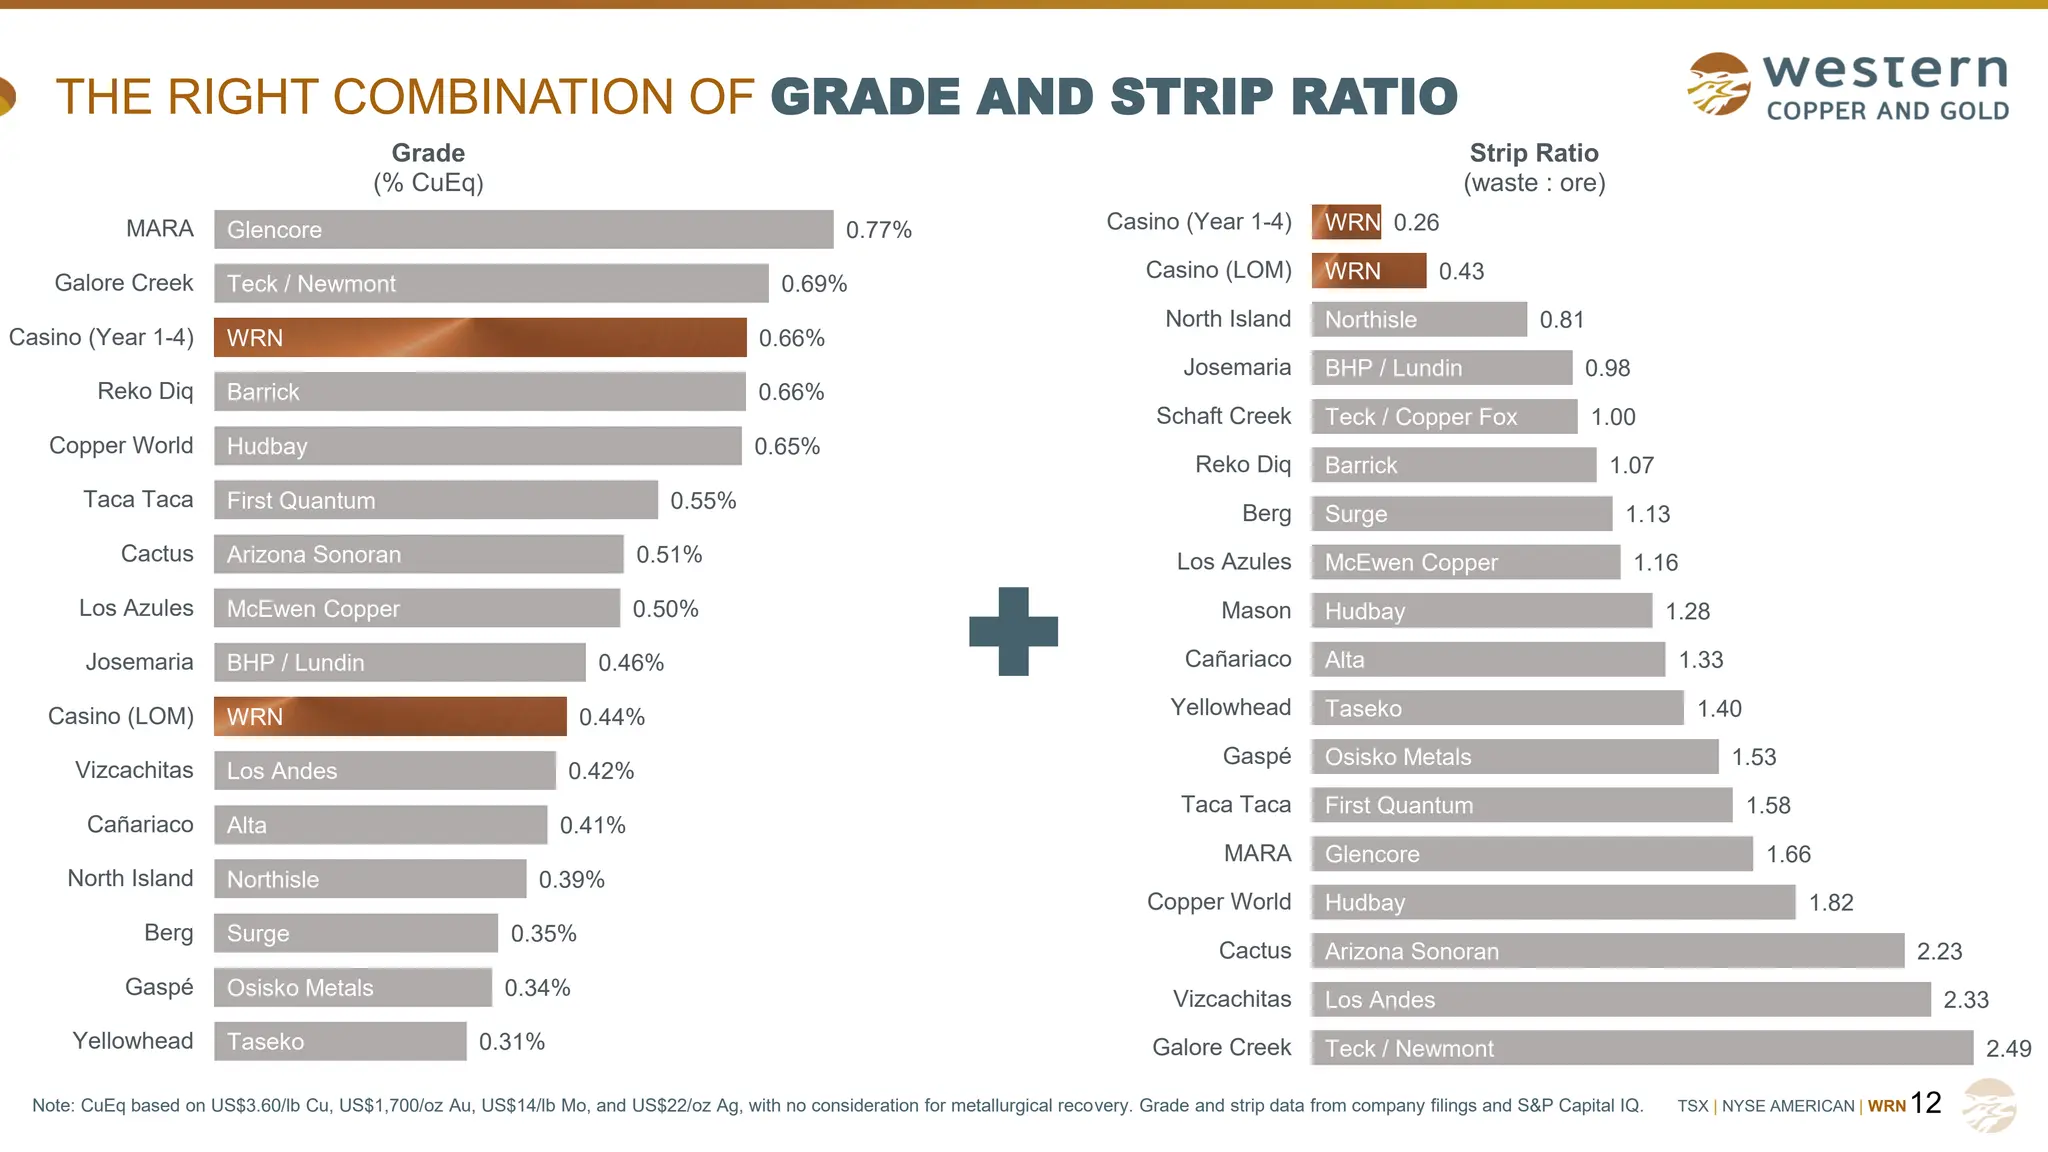
THE RIGHT COMBINATION OF GRADE AND STRIP RATIO
12
Note: CuEq based on US$3.60/lb Cu, US$1,700/oz Au, US$14/lb Mo, and US$22/oz Ag, with no consideration for metallurgical recovery. Grade and strip data from company filings and S&P Capital IQ.
Taseko
Osisko Metals
Surge
Northisle
Alta
Los Andes
WRN
BHP / Lundin
McEwen Copper
Arizona Sonoran
First Quantum
Hudbay
Barrick
WRN
Teck / Newmont
Glencore
0.31%
0.34%
0.35%
0.39%
0.41%
0.42%
0.44%
0.46%
0.50%
0.51%
0.55%
0.65%
0.66%
0.66%
0.69%
0.77%
Yellowhead
Gaspé
Berg
North Island
Cañariaco
Vizcachitas
Casino (LOM)
Josemaria
Los Azules
Cactus
Taca Taca
Copper World
Reko Diq
Casino (Year 1-4)
Galore Creek
MARA
Grade
(% CuEq)
Teck / Newmont
Los Andes
Arizona Sonoran
Hudbay
Glencore
First Quantum
Osisko Metals
Taseko
Alta
Hudbay
McEwen Copper
Surge
Barrick
Teck / Copper Fox
BHP / Lundin
Northisle
WRN
WRN
2.49
2.33
2.23
1.82
1.66
1.58
1.53
1.40
1.33
1.28
1.16
1.13
1.07
1.00
0.98
0.81
0.43
0.26
Galore Creek
Vizcachitas
Cactus
Copper World
MARA
Taca Taca
Gaspé
Yellowhead
Cañariaco
Mason
Los Azules
Berg
Reko Diq
Schaft Creek
Josemaria
North Island
Casino (LOM)
Casino (Year 1-4)
Strip Ratio
(waste : ore)
TSX | NYSEAMERICAN | WRN
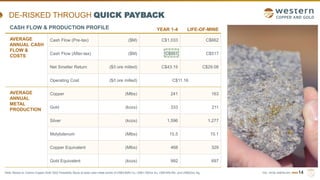
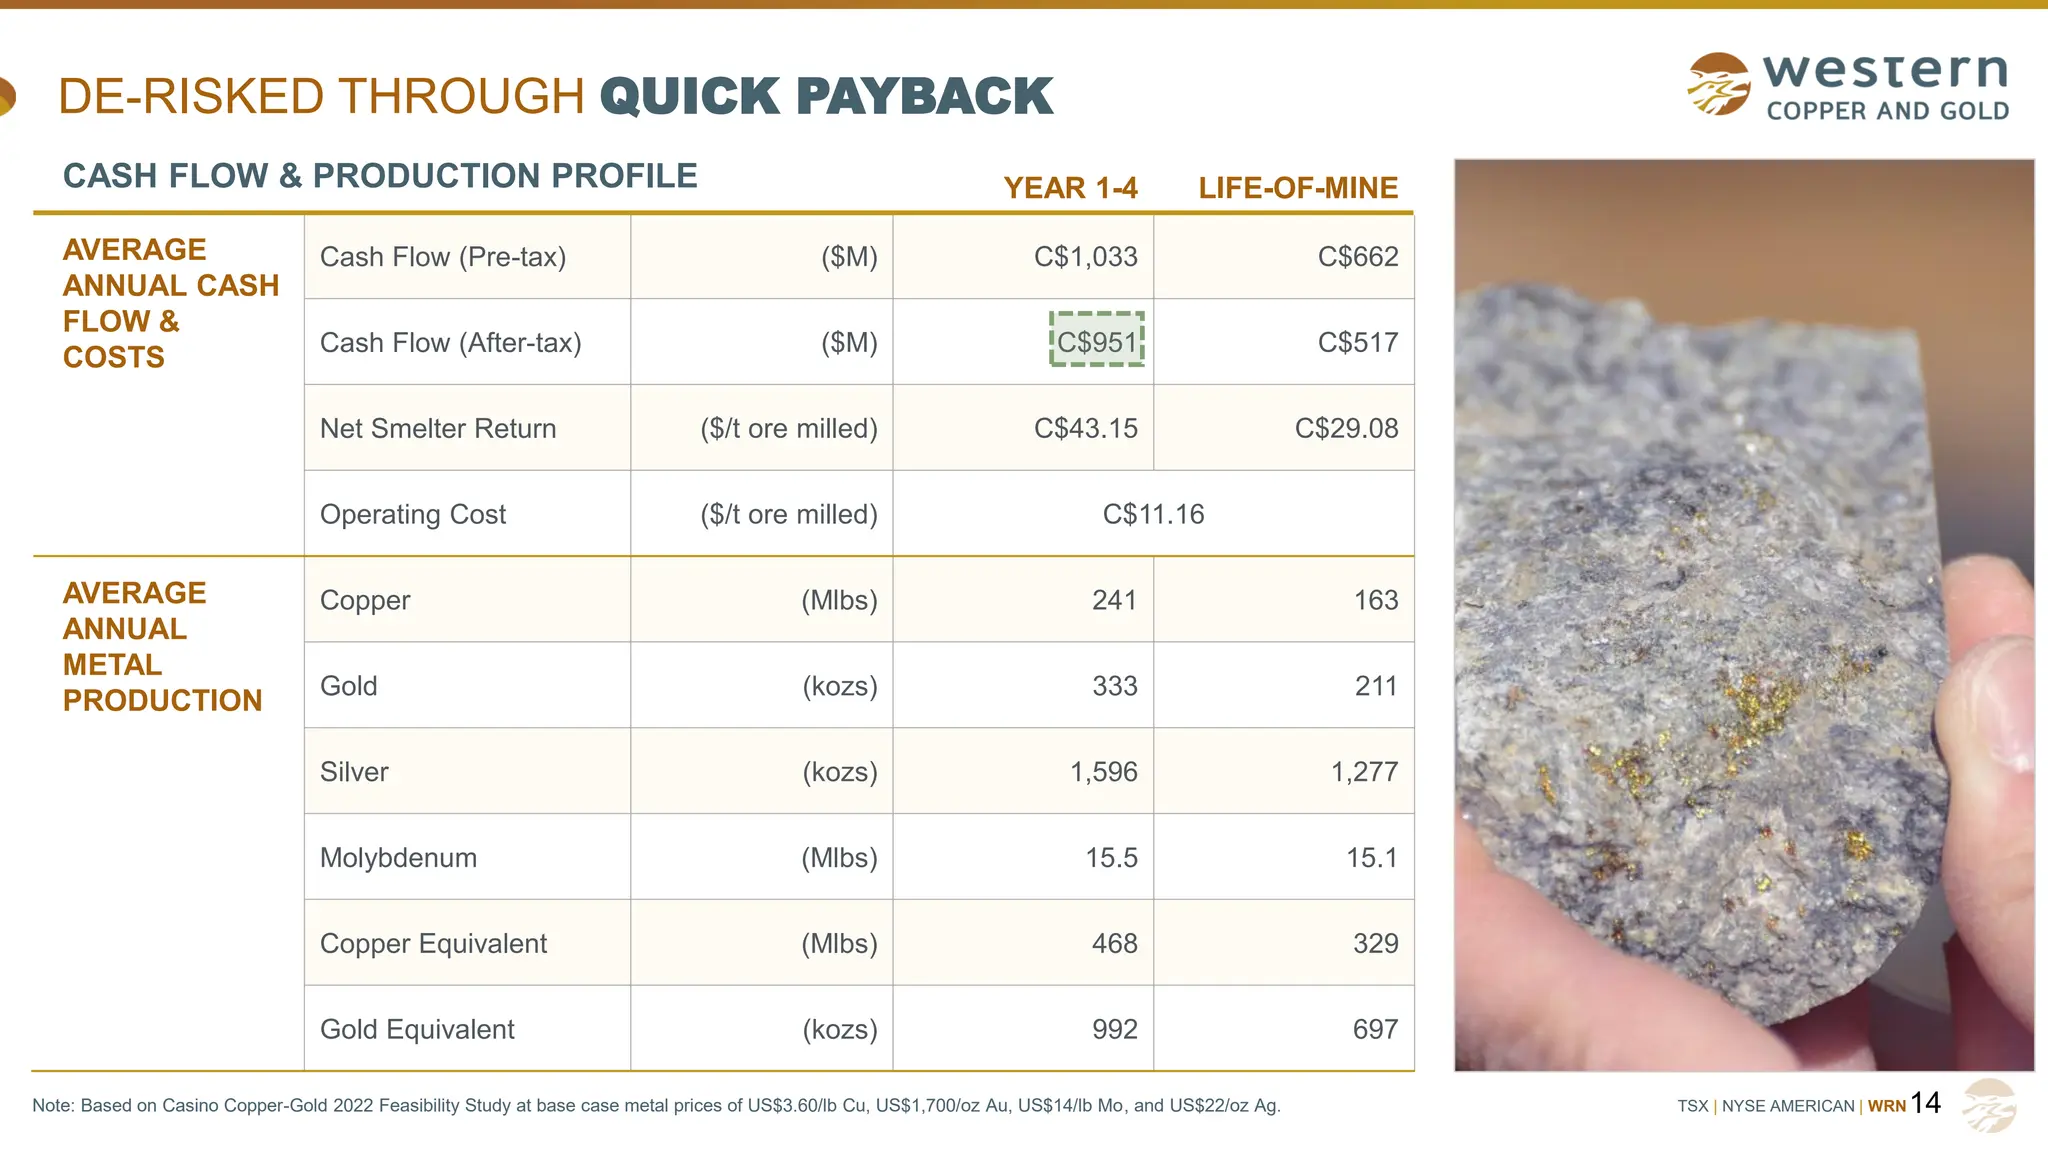
DE-RISKED THROUGH QUICK PAYBACK
14
CASH FLOW & PRODUCTION PROFILE YEAR 1-4 LIFE-OF-MINE
AVERAGE
ANNUAL CASH
FLOW &
COSTS
Cash Flow (Pre-tax) ($M) C$1,033 C$662
Cash Flow (After-tax) ($M) C$951 C$517
Net Smelter Return ($/t ore milled) C$43.15 C$29.08
Operating Cost ($/t ore milled) C$11.16
AVERAGE
ANNUAL
METAL
PRODUCTION
Copper (Mlbs) 241 163
Gold (kozs) 333 211
Silver (kozs) 1,596 1,277
Molybdenum (Mlbs) 15.5 15.1
Copper Equivalent (Mlbs) 468 329
Gold Equivalent (kozs) 992 697
Note: Based on Casino Copper-Gold 2022 Feasibility Study at base case metal prices of US$3.60/lb Cu, US$1,700/oz Au, US$14/lb Mo, and US$22/oz Ag.
15.
TSX | NYSEAMERICAN | WRN
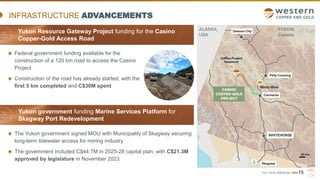
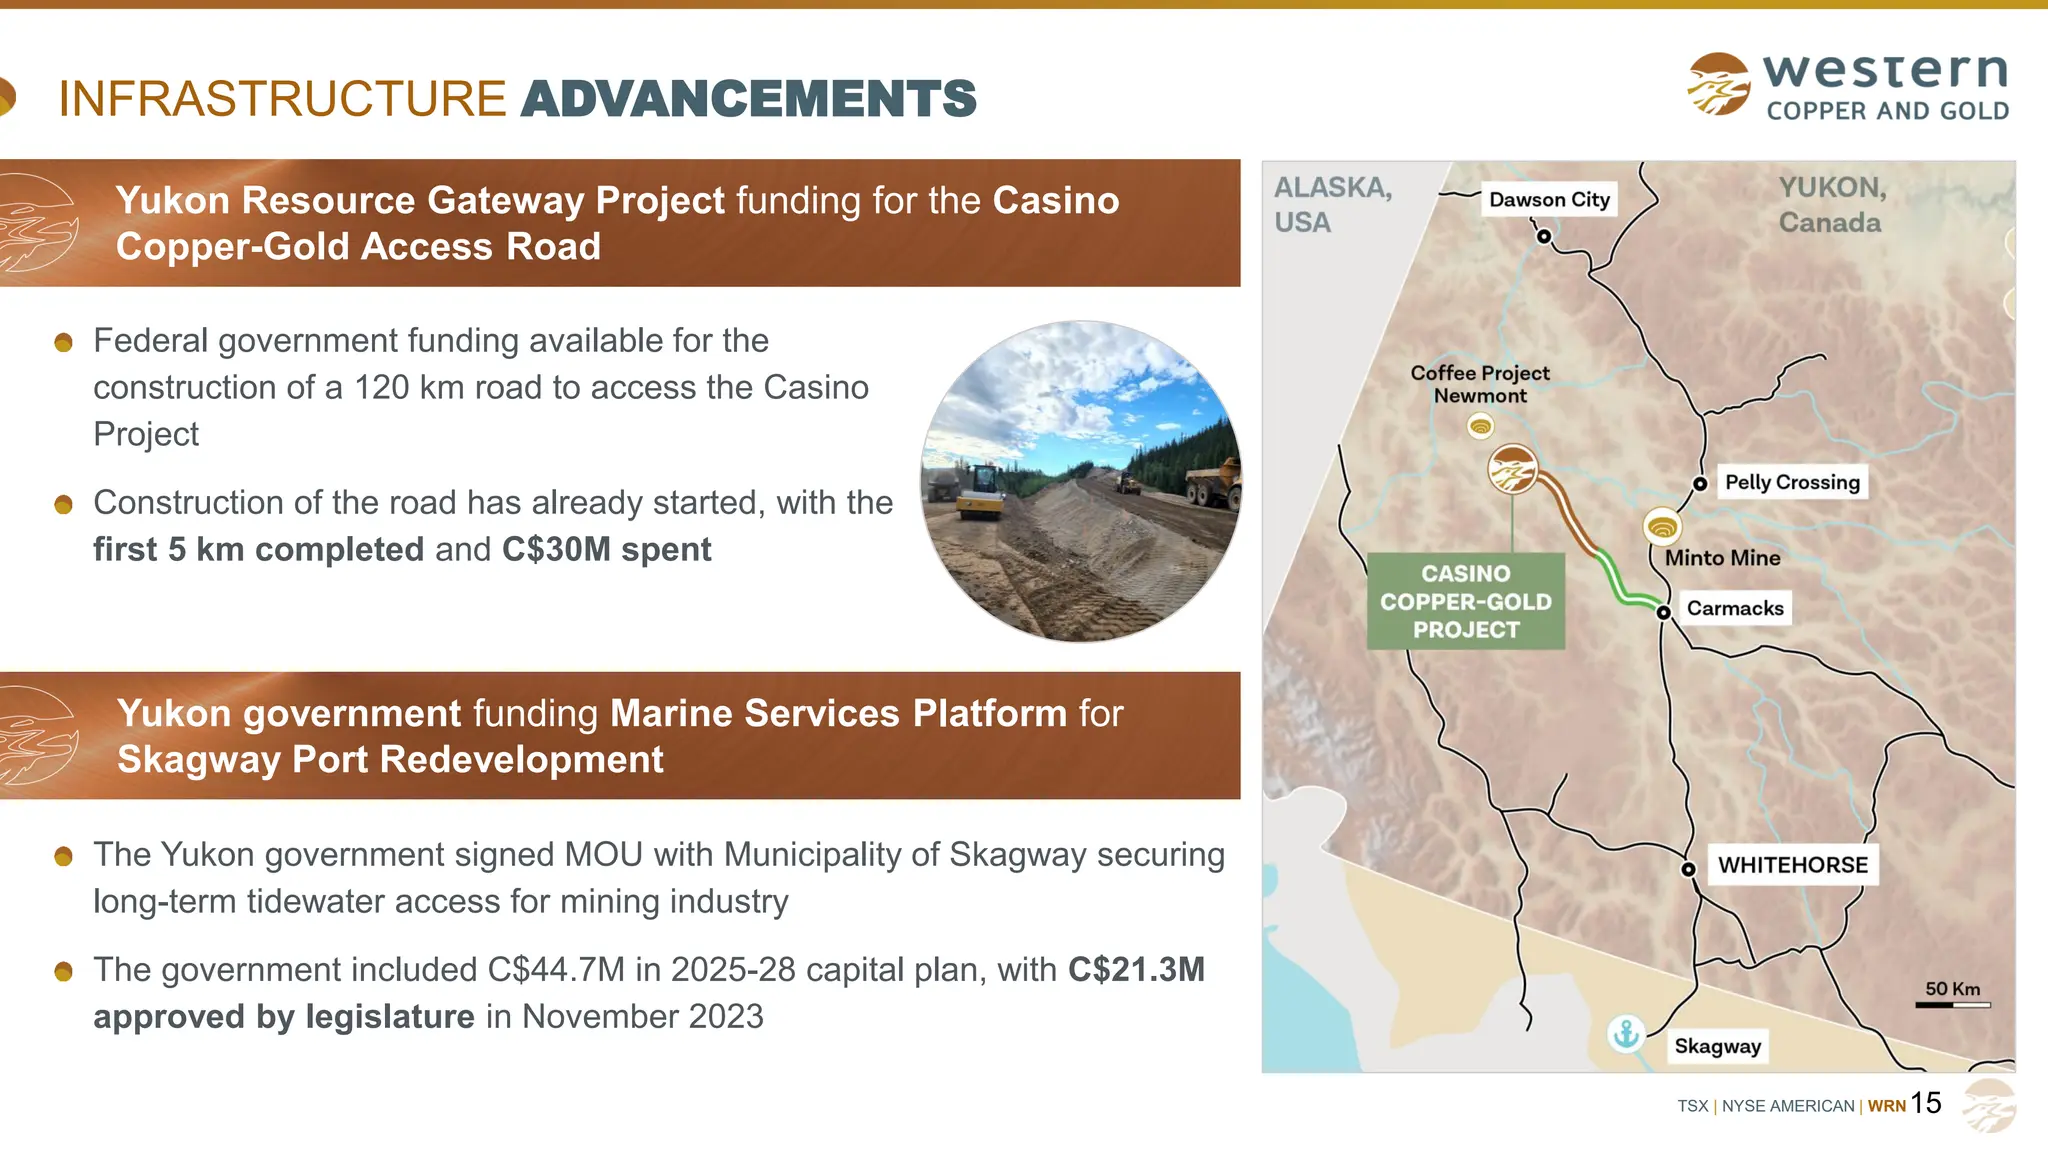
INFRASTRUCTURE ADVANCEMENTS
15
Yukon Resource Gateway Project funding for the Casino
Copper-Gold Access Road
Yukon government funding Marine Services Platform for
Skagway Port Redevelopment
Federal government funding available for the
construction of a 120 km road to access the Casino
Project
Construction of the road has already started, with the
first 5 km completed and C$30M spent
The Yukon government signed MOU with Municipality of Skagway securing
long-term tidewater access for mining industry
The government included C$44.7M in 2025-28 capital plan, with C$21.3M
approved by legislature in November 2023
16.
TSX | NYSEAMERICAN | WRN
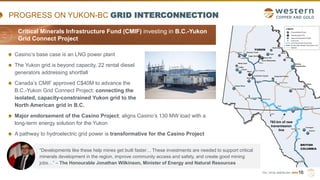
Casino’s base case is an LNG power plant
The Yukon grid is beyond capacity, 22 rental diesel
generators addressing shortfall
Canada’s CMIF approved C$40M to advance the
B.C.-Yukon Grid Connect Project: connecting the
isolated, capacity-constrained Yukon grid to the
North American grid in B.C.
Major endorsement of the Casino Project; aligns Casino’s 130 MW load with a
long-term energy solution for the Yukon
A pathway to hydroelectric grid power is transformative for the Casino Project
PROGRESS ON YUKON-BC GRID INTERCONNECTION
16
763 km of new
transmission
line
“Developments like these help mines get built faster… These investments are needed to support critical
minerals development in the region, improve community access and safety, and create good mining
jobs…” – The Honourable Jonathan Wilkinson, Minister of Energy and Natural Resources
Critical Minerals Infrastructure Fund (CMIF) investing in B.C.-Yukon
Grid Connect Project
17.
TSX | NYSEAMERICAN | WRN
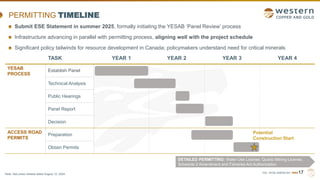
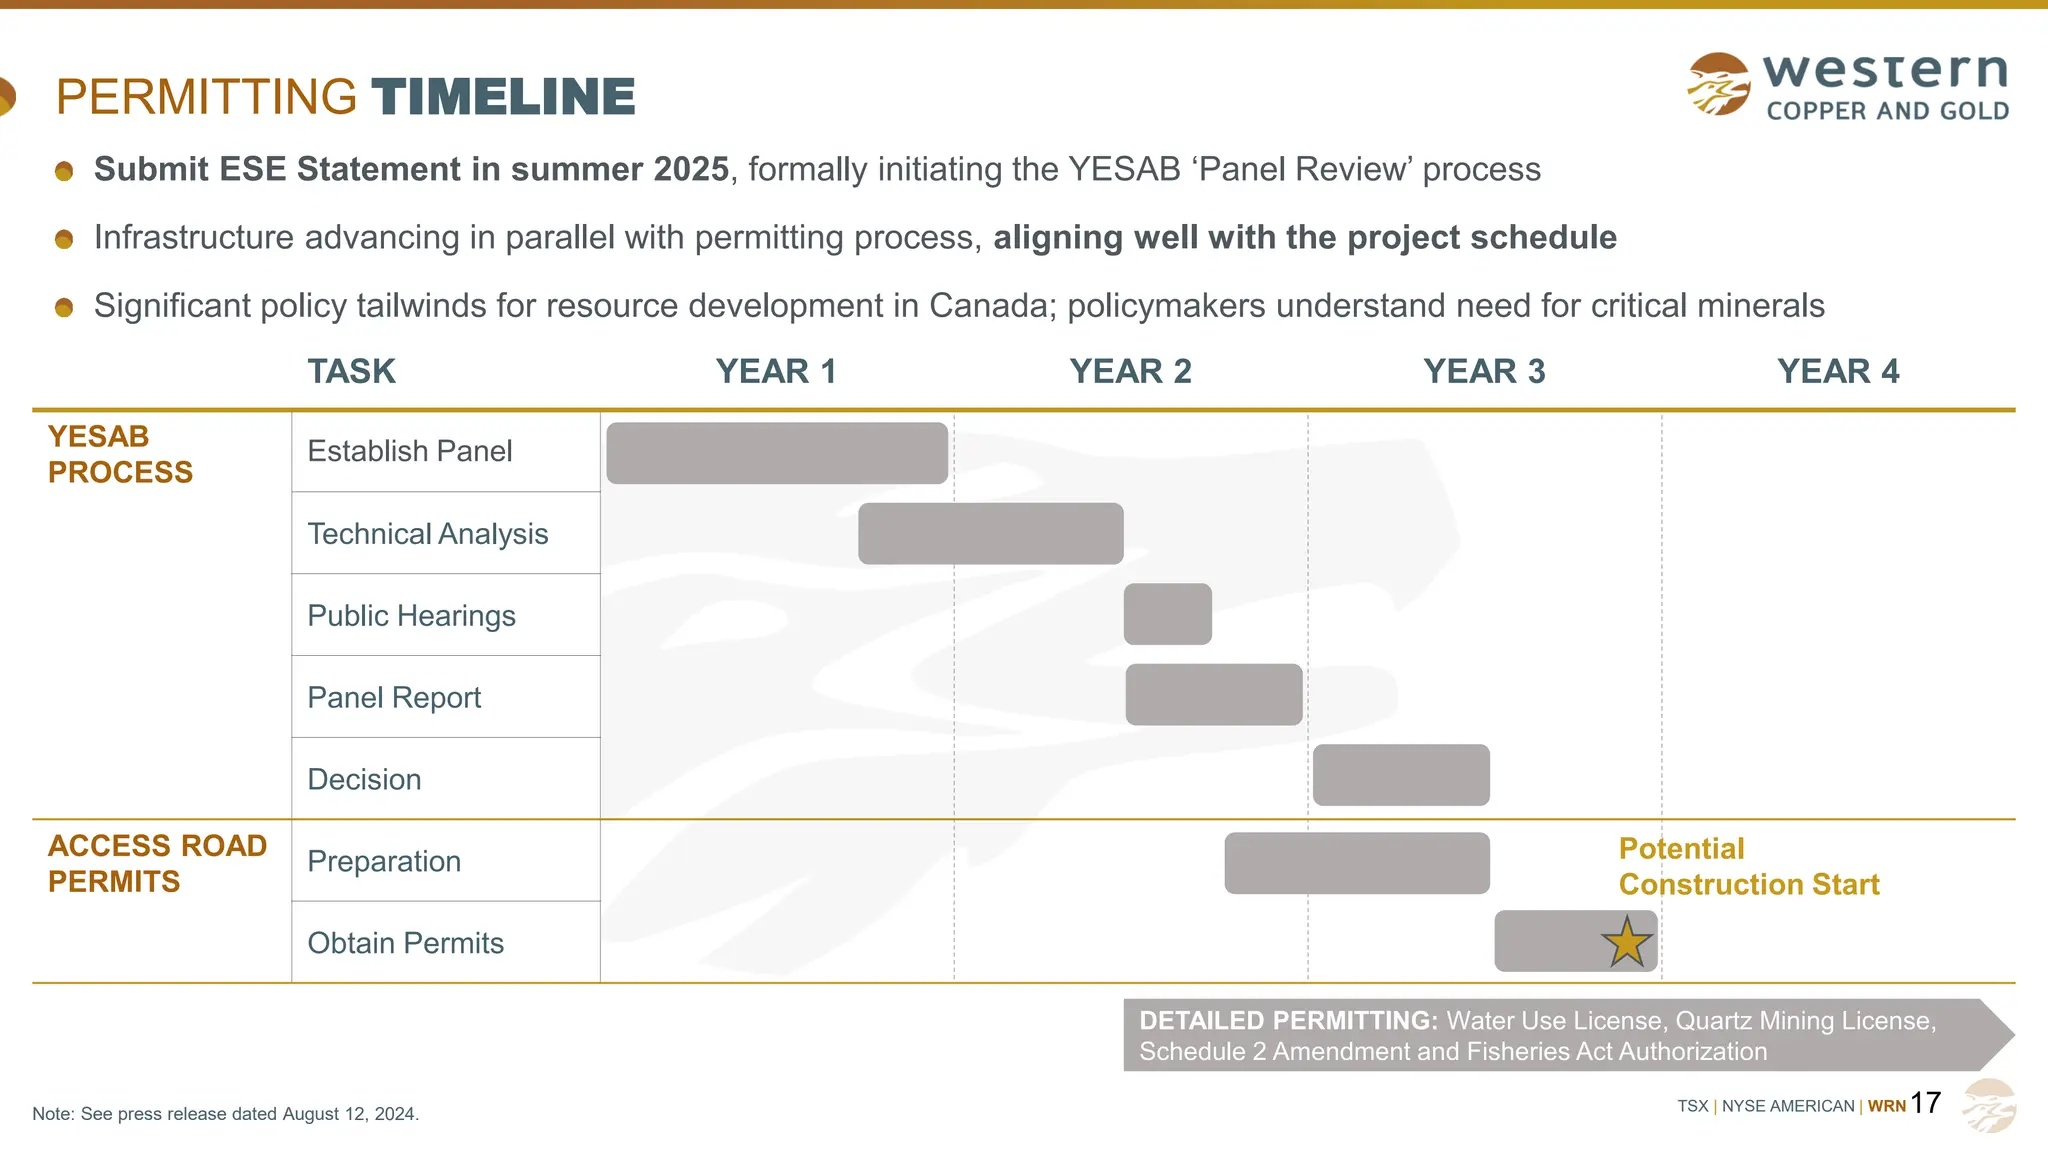
TASK YEAR 1 YEAR 2 YEAR 3 YEAR 4
YESAB
PROCESS
Establish Panel
Technical Analysis
Public Hearings
Panel Report
Decision
ACCESS ROAD
PERMITS
Preparation
Obtain Permits
PERMITTING TIMELINE
17
Potential
Construction Start
DETAILED PERMITTING: Water Use License, Quartz Mining License,
Schedule 2 Amendment and Fisheries Act Authorization
Submit ESE Statement in summer 2025, formally initiating the YESAB ‘Panel Review’ process
Infrastructure advancing in parallel with permitting process, aligning well with the project schedule
Significant policy tailwinds for resource development in Canada; policymakers understand need for critical minerals
Note: See press release dated August 12, 2024.
18.
TSX | NYSEAMERICAN | WRN18
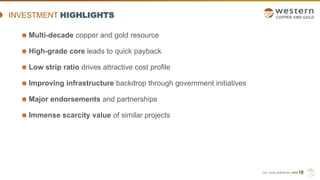
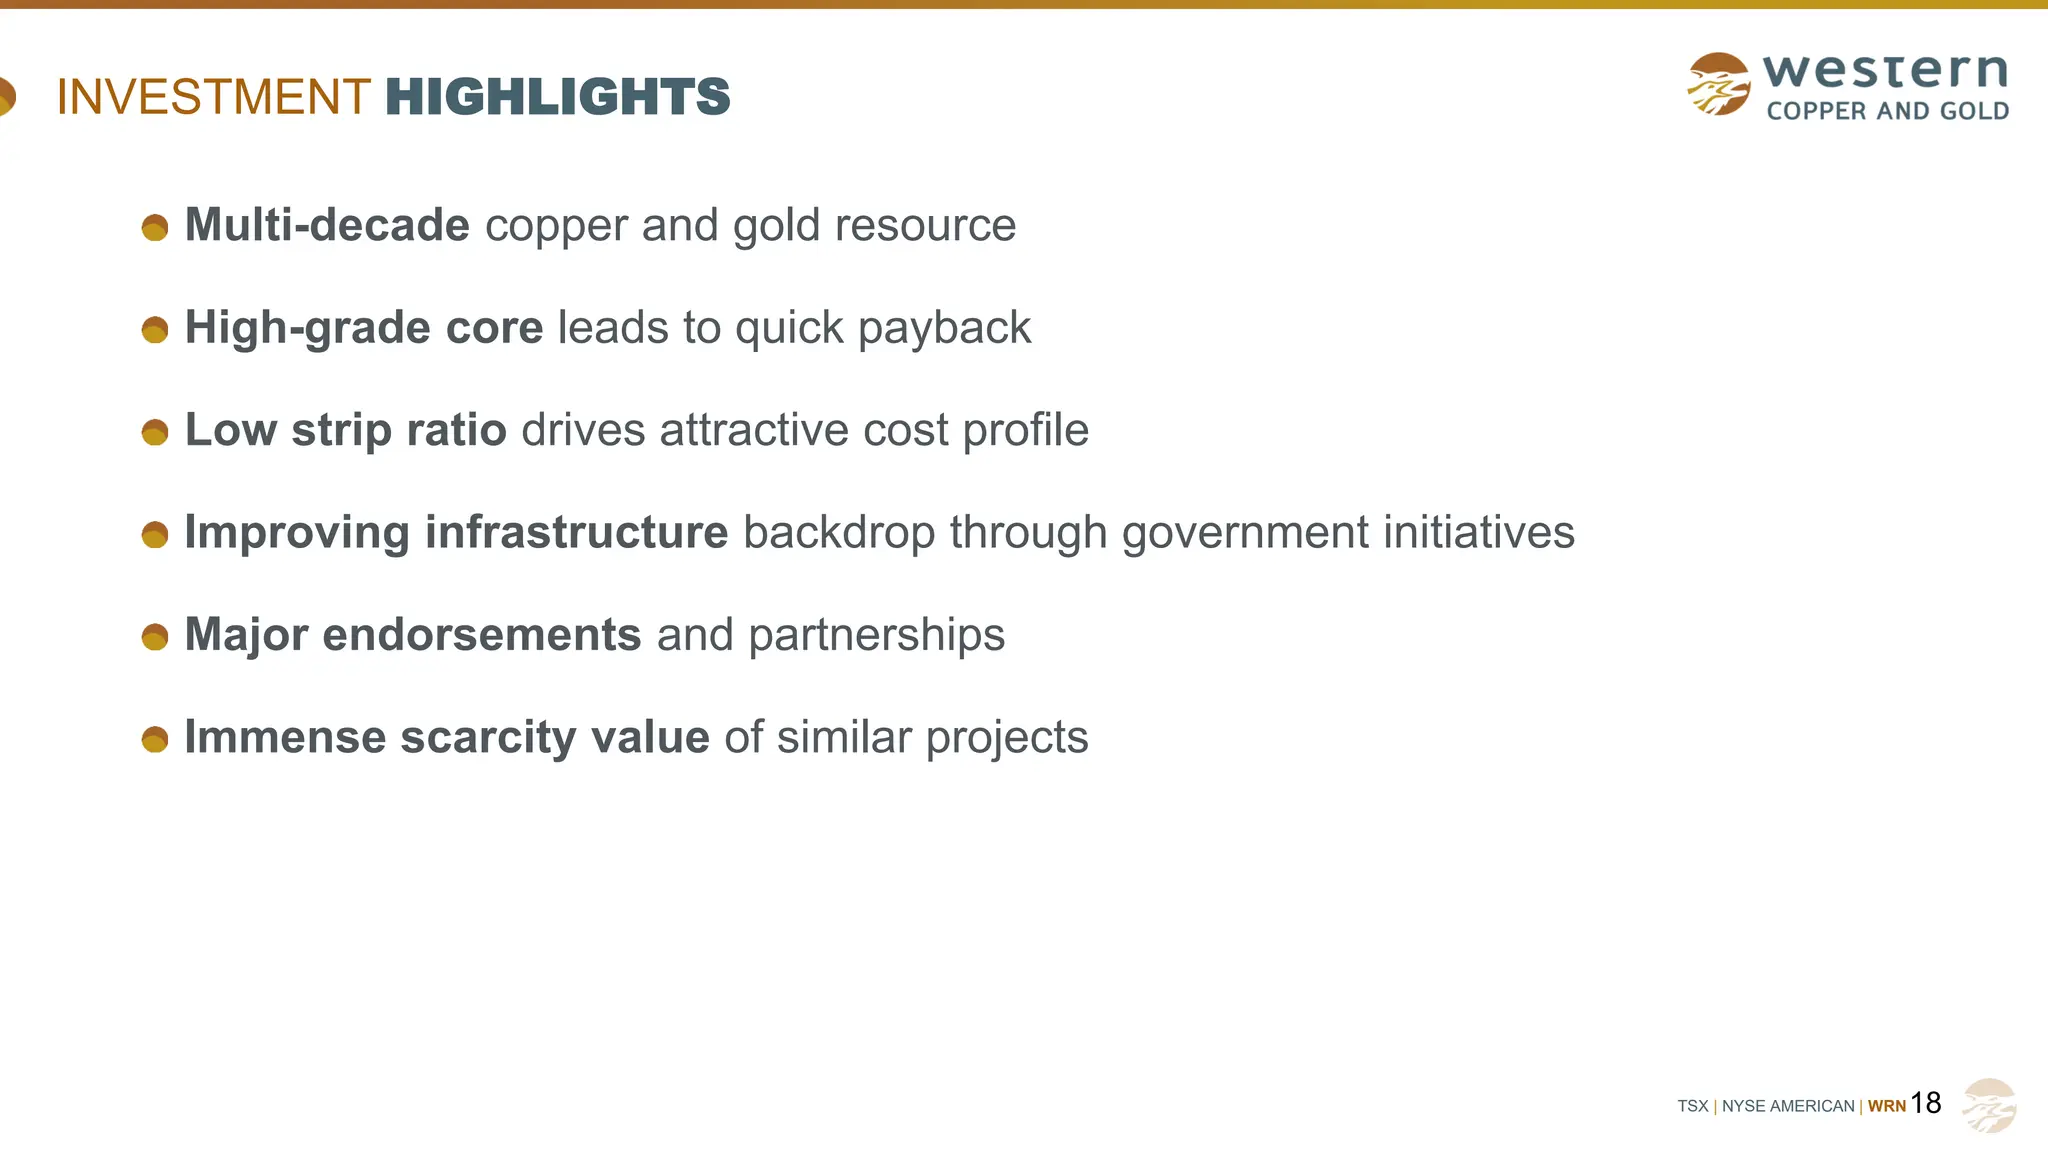
INVESTMENT HIGHLIGHTS
Multi-decade copper and gold resource
High-grade core leads to quick payback
Low strip ratio drives attractive cost profile
Improving infrastructure backdrop through government initiatives
Major endorsements and partnerships
Immense scarcity value of similar projects
TSX | NYSEAMERICAN | WRN
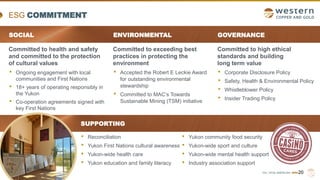
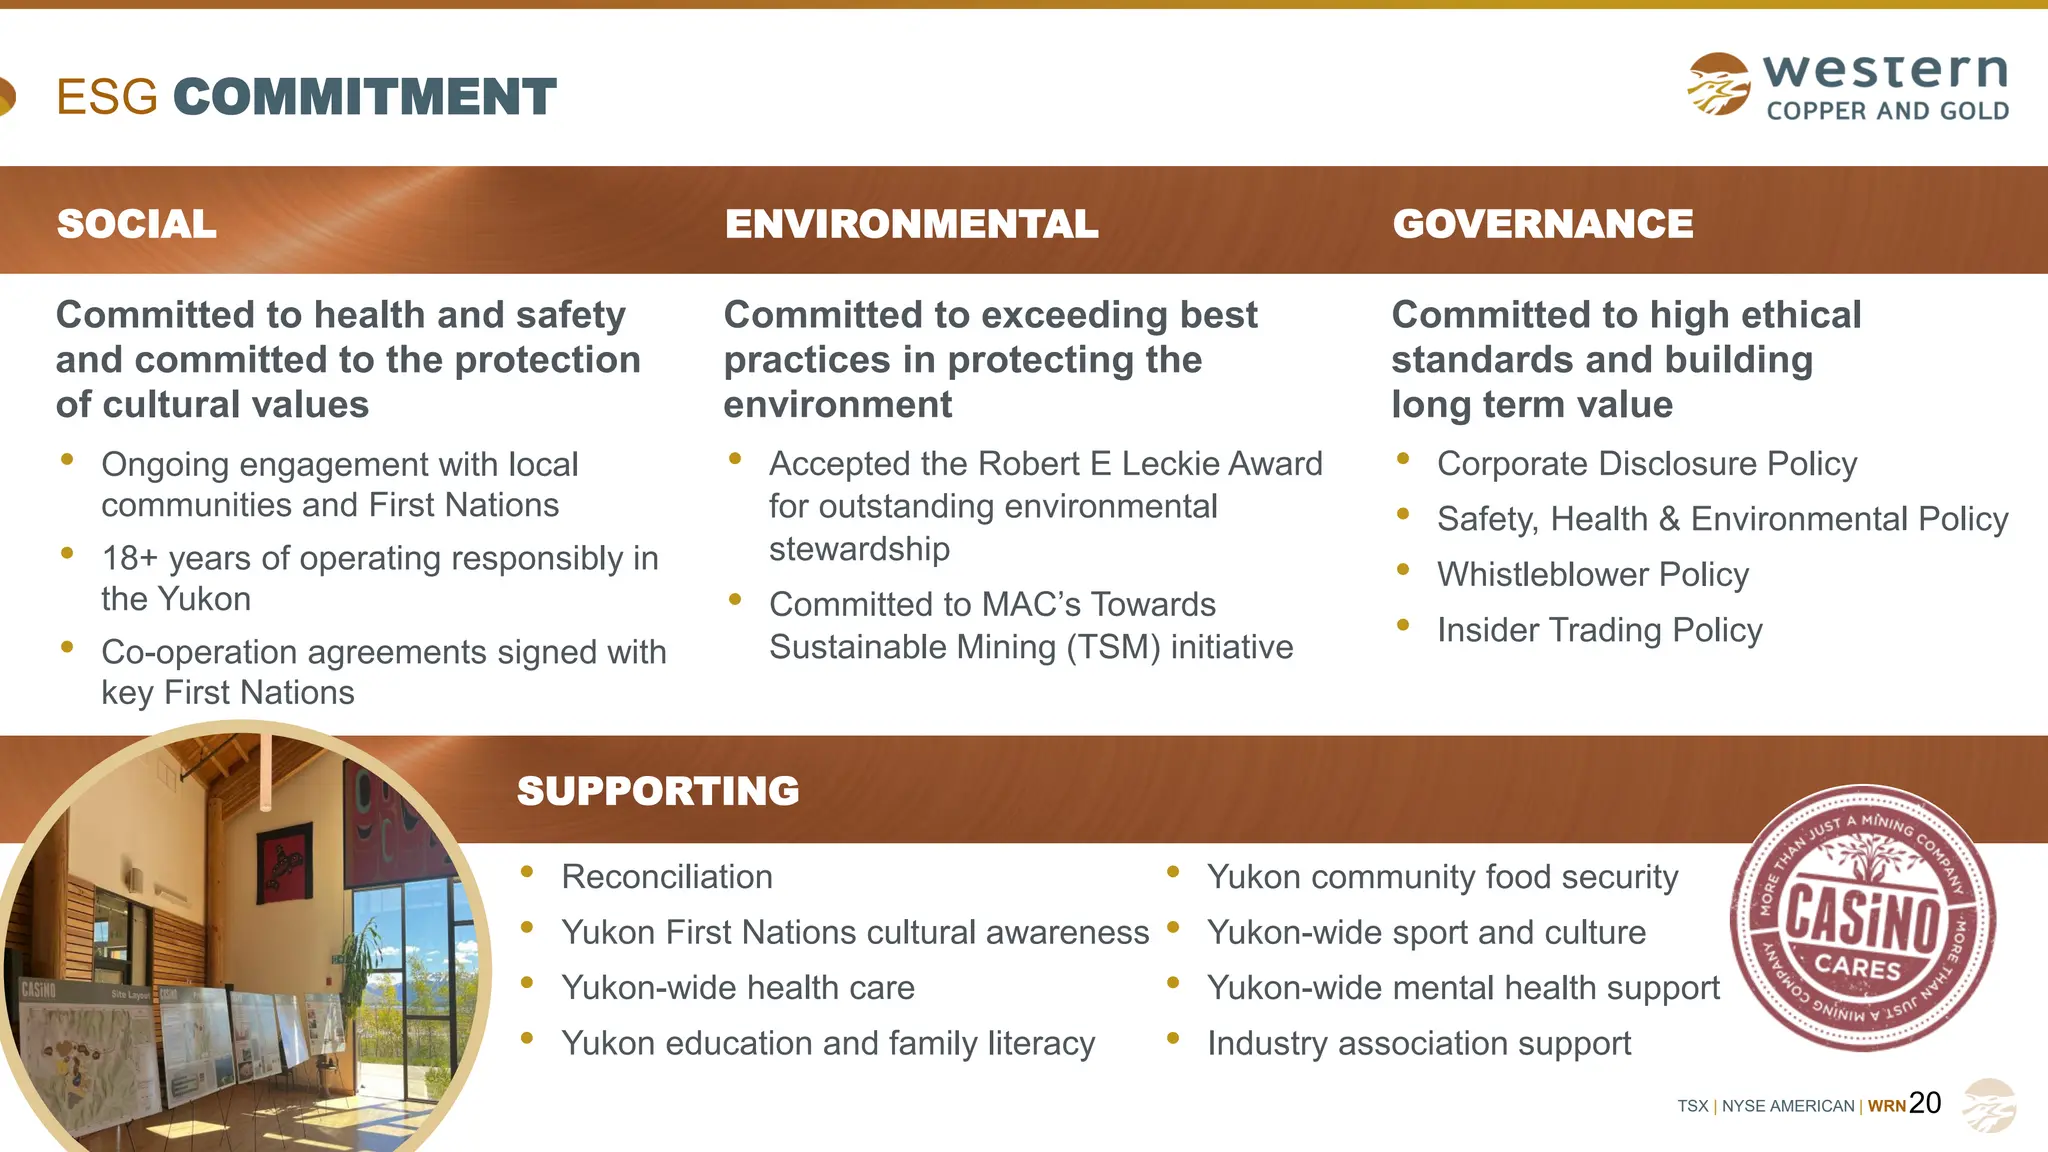
ESG COMMITMENT
20
Committed to health and safety
and committed to the protection
of cultural values
• Ongoing engagement with local
communities and First Nations
• 18+ years of operating responsibly in
the Yukon
• Co-operation agreements signed with
key First Nations
SOCIAL ENVIRONMENTAL
Committed to exceeding best
practices in protecting the
environment
• Accepted the Robert E Leckie Award
for outstanding environmental
stewardship
• Committed to MAC’s Towards
Sustainable Mining (TSM) initiative
Committed to high ethical
standards and building
long term value
• Corporate Disclosure Policy
• Safety, Health & Environmental Policy
• Whistleblower Policy
• Insider Trading Policy
GOVERNANCE
SUPPORTING
• Yukon community food security
• Yukon-wide sport and culture
• Yukon-wide mental health support
• Industry association support
• Reconciliation
• Yukon First Nations cultural awareness
• Yukon-wide health care
• Yukon education and family literacy
21.
TSX | NYSEAMERICAN | WRN
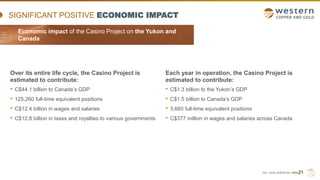
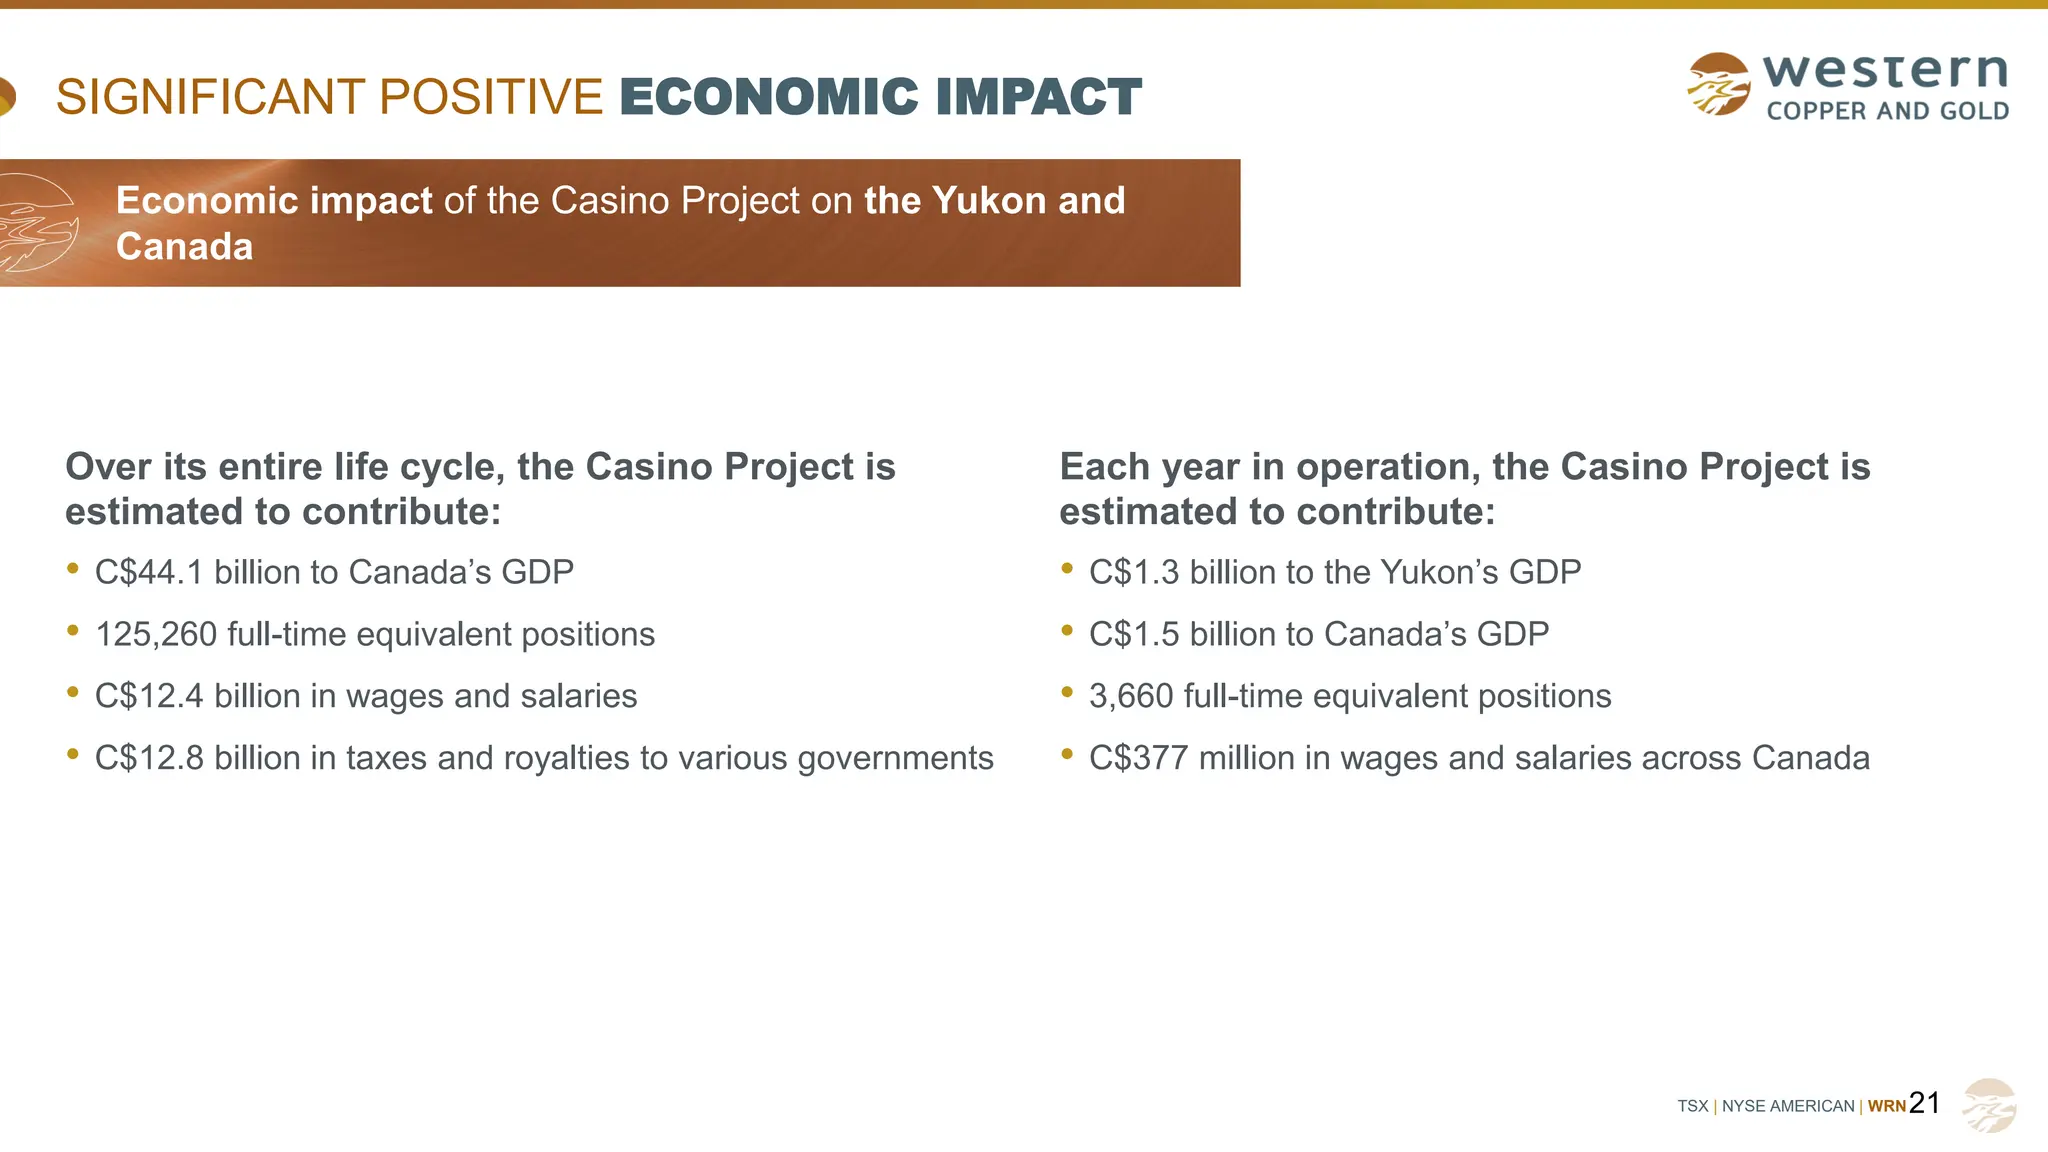
SIGNIFICANT POSITIVE ECONOMIC IMPACT
Over its entire life cycle, the Casino Project is
estimated to contribute:
• C$44.1 billion to Canada’s GDP
• 125,260 full-time equivalent positions
• C$12.4 billion in wages and salaries
• C$12.8 billion in taxes and royalties to various governments
21
Each year in operation, the Casino Project is
estimated to contribute:
• C$1.3 billion to the Yukon’s GDP
• C$1.5 billion to Canada’s GDP
• 3,660 full-time equivalent positions
• C$377 million in wages and salaries across Canada
Economic Impact Casino Project
on the Yukon and Canada
Economic impact of the Casino Project on the Yukon and
Canada
22.
TSX | NYSEAMERICAN | WRN
x
157
144
--
20
40
60
80
100
120
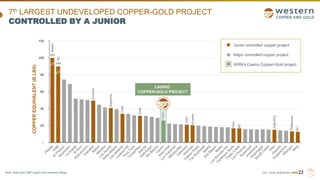
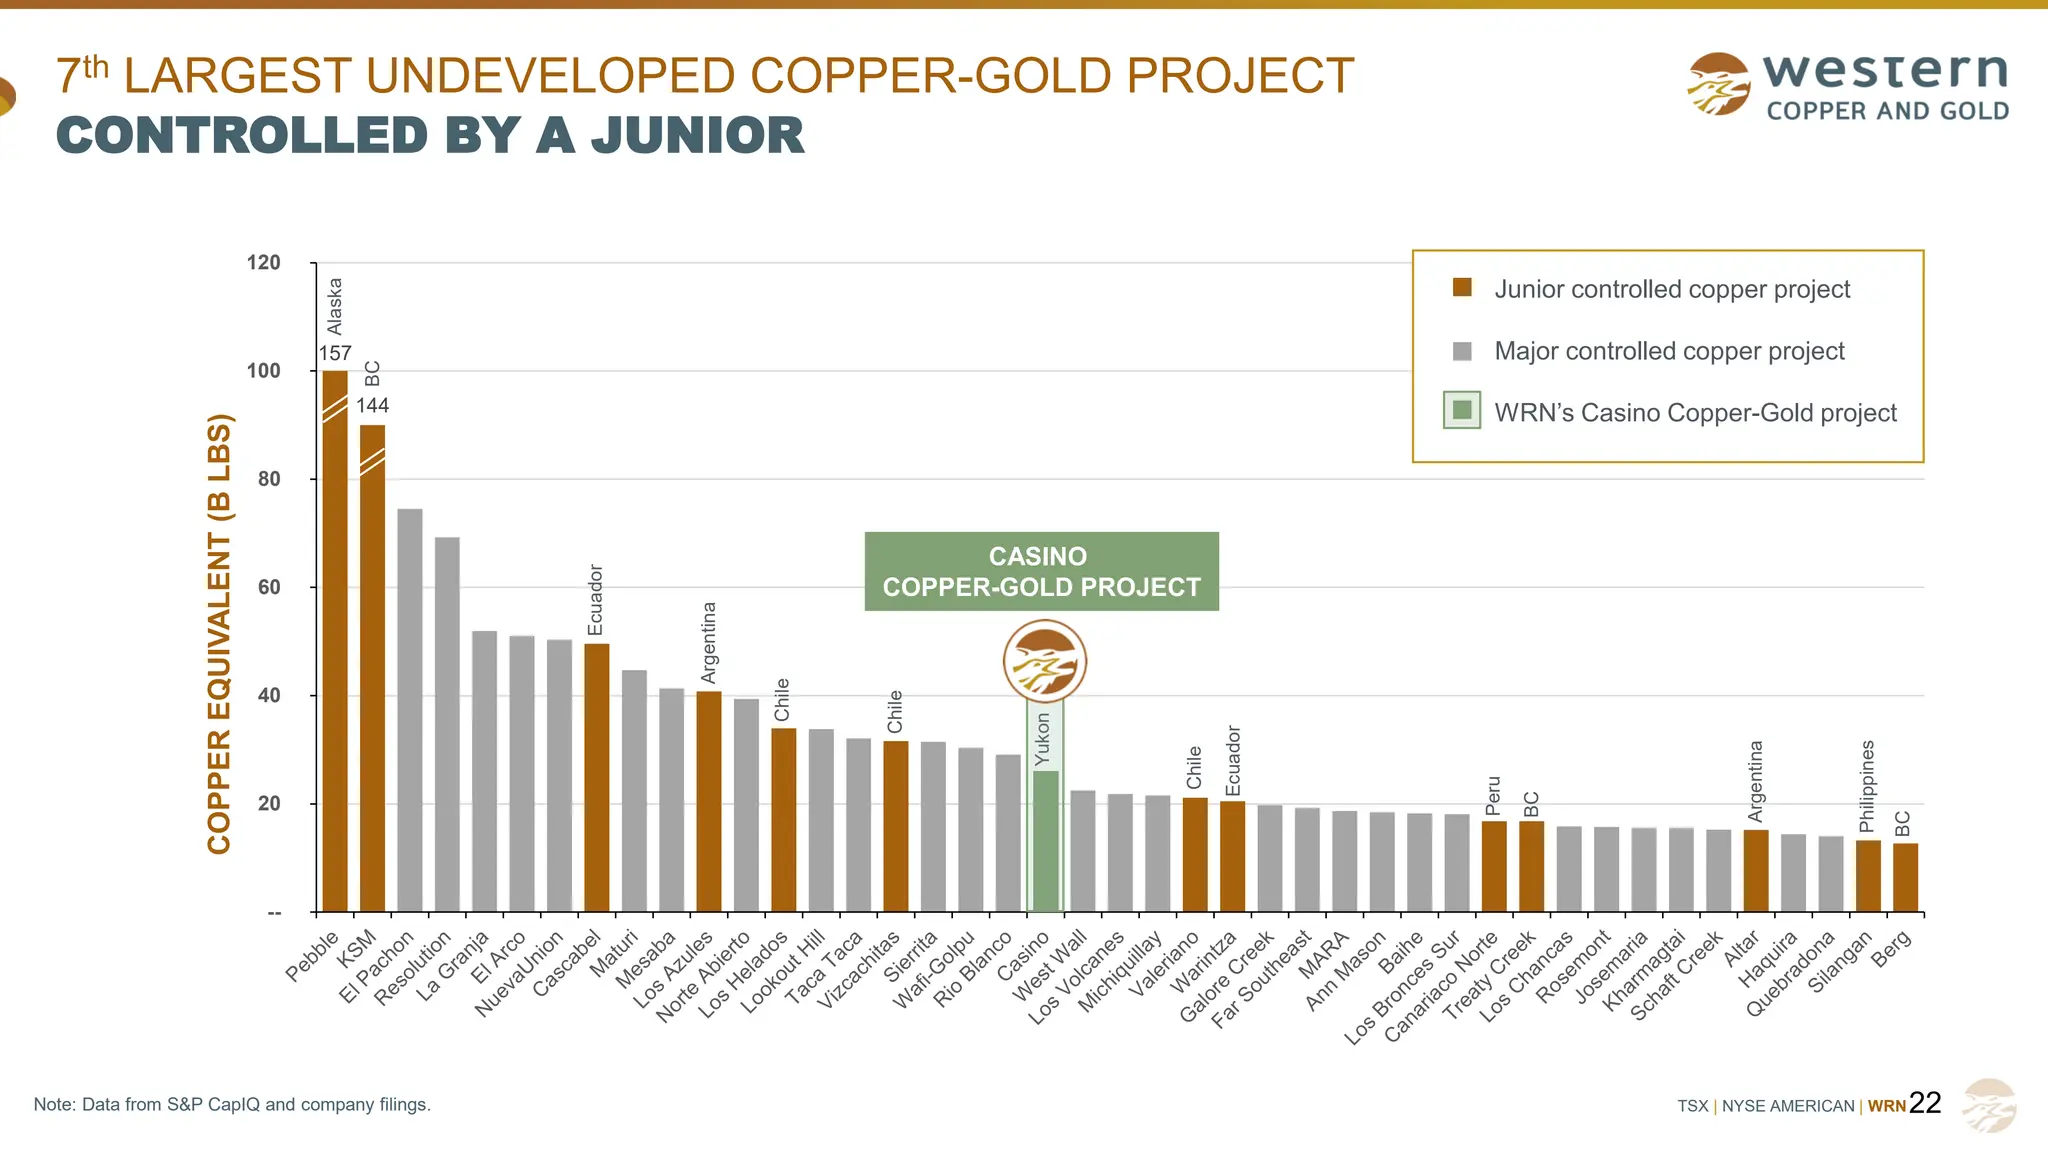
7th LARGEST UNDEVELOPED COPPER-GOLD PROJECT
CONTROLLED BY A JUNIOR
22
CASINO
COPPER-GOLD PROJECT
Junior controlled copper project
Major controlled copper project
WRN’s Casino Copper-Gold project
Ecuador
Argentina
Chile
Ecuador
Peru
Yukon
Alaska
BC
BC
Philippines
BC
Argentina
COPPER
EQUIVALENT
(B
LBS)
Chile
Chile
Note: Data from S&P CapIQ and company filings.
23.
TSX | NYSEAMERICAN | WRN
x
23
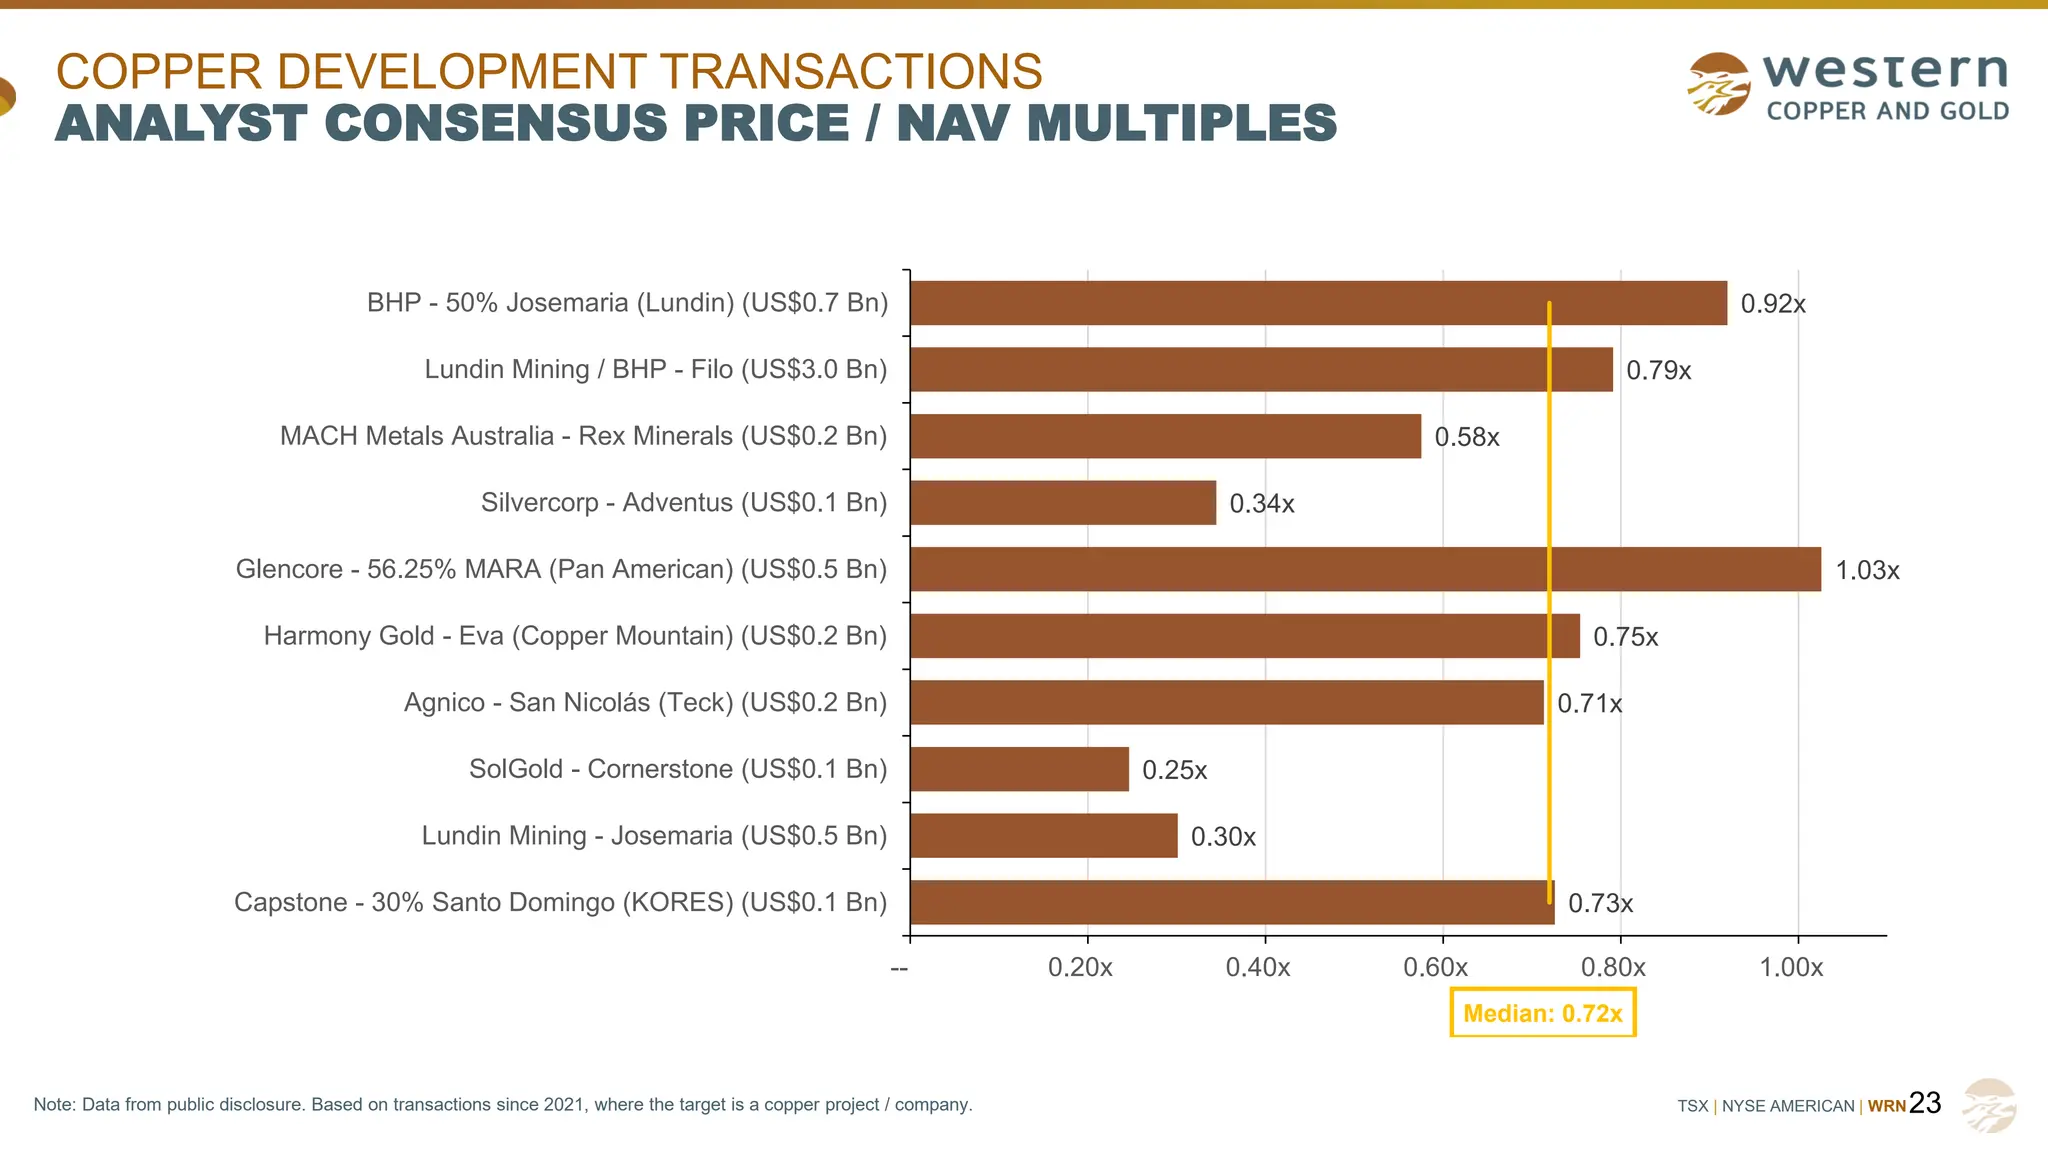
COPPER DEVELOPMENT TRANSACTIONS
ANALYST CONSENSUS PRICE / NAV MULTIPLES
0.92x
0.79x
0.58x
0.34x
1.03x
0.75x
0.71x
0.25x
0.30x
0.73x
-- 0.20x 0.40x 0.60x 0.80x 1.00x
BHP - 50% Josemaria (Lundin) (US$0.7 Bn)
Lundin Mining / BHP - Filo (US$3.0 Bn)
MACH Metals Australia - Rex Minerals (US$0.2 Bn)
Silvercorp - Adventus (US$0.1 Bn)
Glencore - 56.25% MARA (Pan American) (US$0.5 Bn)
Harmony Gold - Eva (Copper Mountain) (US$0.2 Bn)
Agnico - San Nicolás (Teck) (US$0.2 Bn)
SolGold - Cornerstone (US$0.1 Bn)
Lundin Mining - Josemaria (US$0.5 Bn)
Capstone - 30% Santo Domingo (KORES) (US$0.1 Bn)
Median: 0.72x
Note: Data from public disclosure. Based on transactions since 2021, where the target is a copper project / company.
24.
TSX | NYSEAMERICAN | WRN24
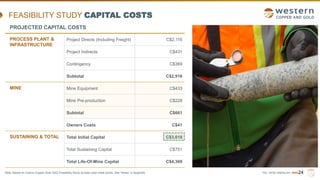
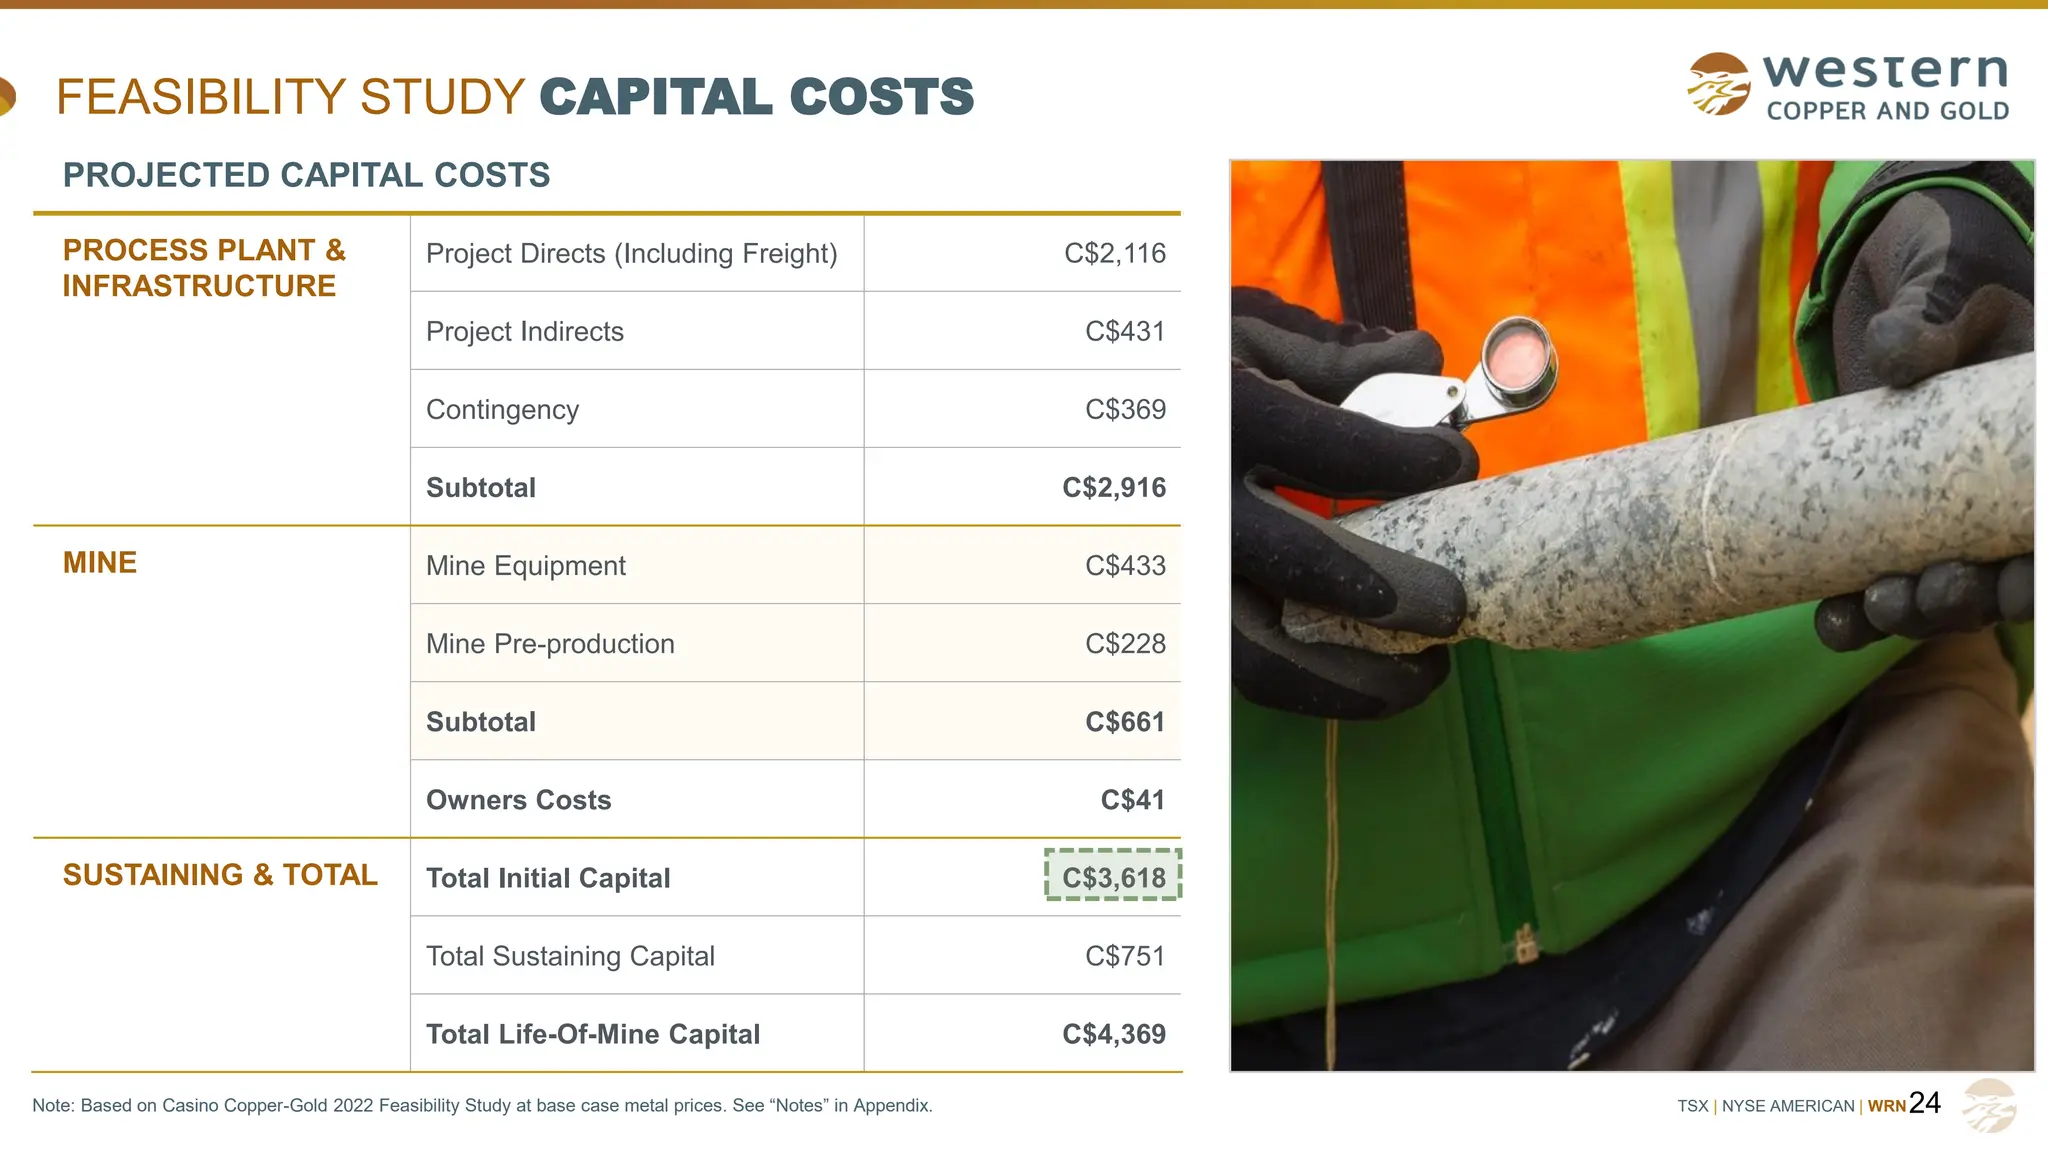
FEASIBILITY STUDY CAPITAL COSTS
PROJECTED CAPITAL COSTS
PROCESS PLANT &
INFRASTRUCTURE
Project Directs (Including Freight) C$2,116
Project Indirects C$431
Contingency C$369
Subtotal C$2,916
MINE Mine Equipment C$433
Mine Pre-production C$228
Subtotal C$661
Owners Costs C$41
SUSTAINING & TOTAL Total Initial Capital C$3,618
Total Sustaining Capital C$751
Total Life-Of-Mine Capital C$4,369
Note: Based on Casino Copper-Gold 2022 Feasibility Study at base case metal prices. See “Notes” in Appendix.
25.
TSX | NYSEAMERICAN | WRN
--
$5,000
$10,000
$15,000
$20,000
$25,000
$30,000
$35,000
$40,000
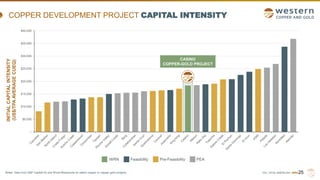
COPPER DEVELOPMENT PROJECT CAPITAL INTENSITY
25
CASINO
COPPER-GOLD PROJECT
INITIAL
CAPITAL
INTENSITY
(US$/TPA
AVERAGE
CUEQ)
WRN Feasibility Pre-Feasibility PEA
Notes: Data from S&P Capital IQ and Wood Mackenzie on select copper or copper-gold projects.
26.
TSX | NYSEAMERICAN | WRN26
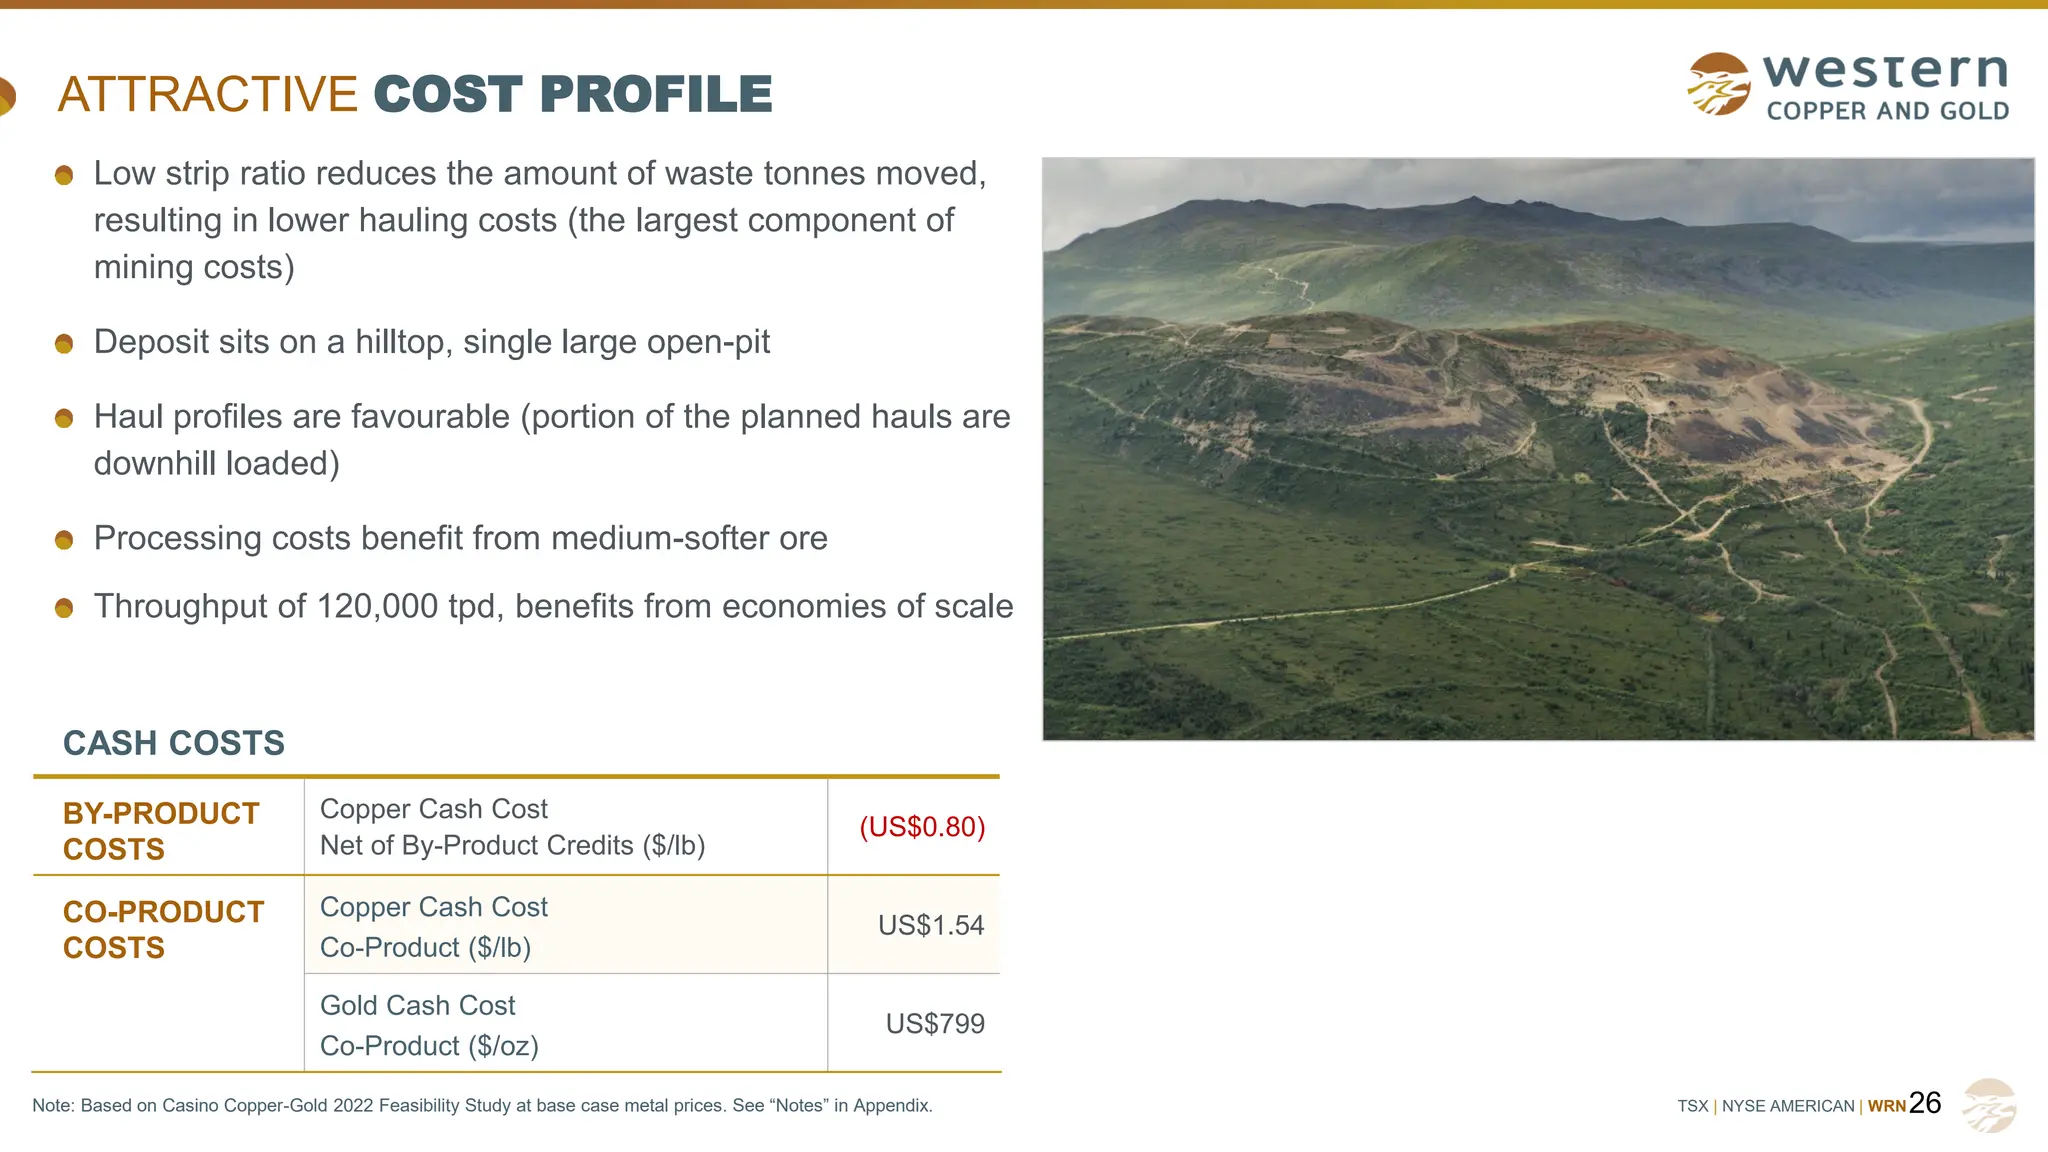
ATTRACTIVE COST PROFILE
CASH COSTS
BY-PRODUCT
COSTS
Copper Cash Cost
Net of By-Product Credits ($/lb)
(US$0.80)
CO-PRODUCT
COSTS
Copper Cash Cost
Co-Product ($/lb)
US$1.54
Gold Cash Cost
Co-Product ($/oz)
US$799
Low strip ratio reduces the amount of waste tonnes moved,
resulting in lower hauling costs (the largest component of
mining costs)
Deposit sits on a hilltop, single large open-pit
Haul profiles are favourable (portion of the planned hauls are
downhill loaded)
Processing costs benefit from medium-softer ore
Throughput of 120,000 tpd, benefits from economies of scale
Note: Based on Casino Copper-Gold 2022 Feasibility Study at base case metal prices. See “Notes” in Appendix.
27.
TSX | NYSEAMERICAN | WRN
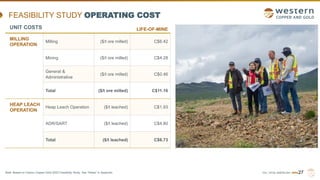
FEASIBILITY STUDY OPERATING COST
27
Note: Based on Casino Copper-Gold 2022 Feasibility Study. See “Notes” in Appendix.
UNIT COSTS LIFE-OF-MINE
MILLING
OPERATION
Milling ($/t ore milled) C$6.42
Mining ($/t ore milled) C$4.28
General &
Administrative
($/t ore milled) C$0.46
Total ($/t ore milled) C$11.16
HEAP LEACH
OPERATION
Heap Leach Operation ($/t leached) C$1.93
ADR/SART ($/t leached) C$4.80
Total ($/t leached) C$6.73
28.
TSX | NYSEAMERICAN | WRN
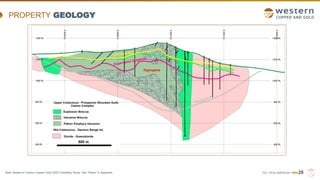
PROPERTY GEOLOGY
28
Note: Based on Casino Copper-Gold 2022 Feasibility Study. See “Notes” in Appendix.
29.
TSX | NYSEAMERICAN | WRN
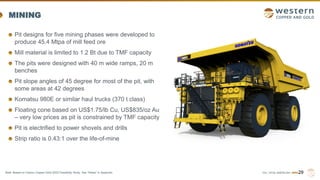
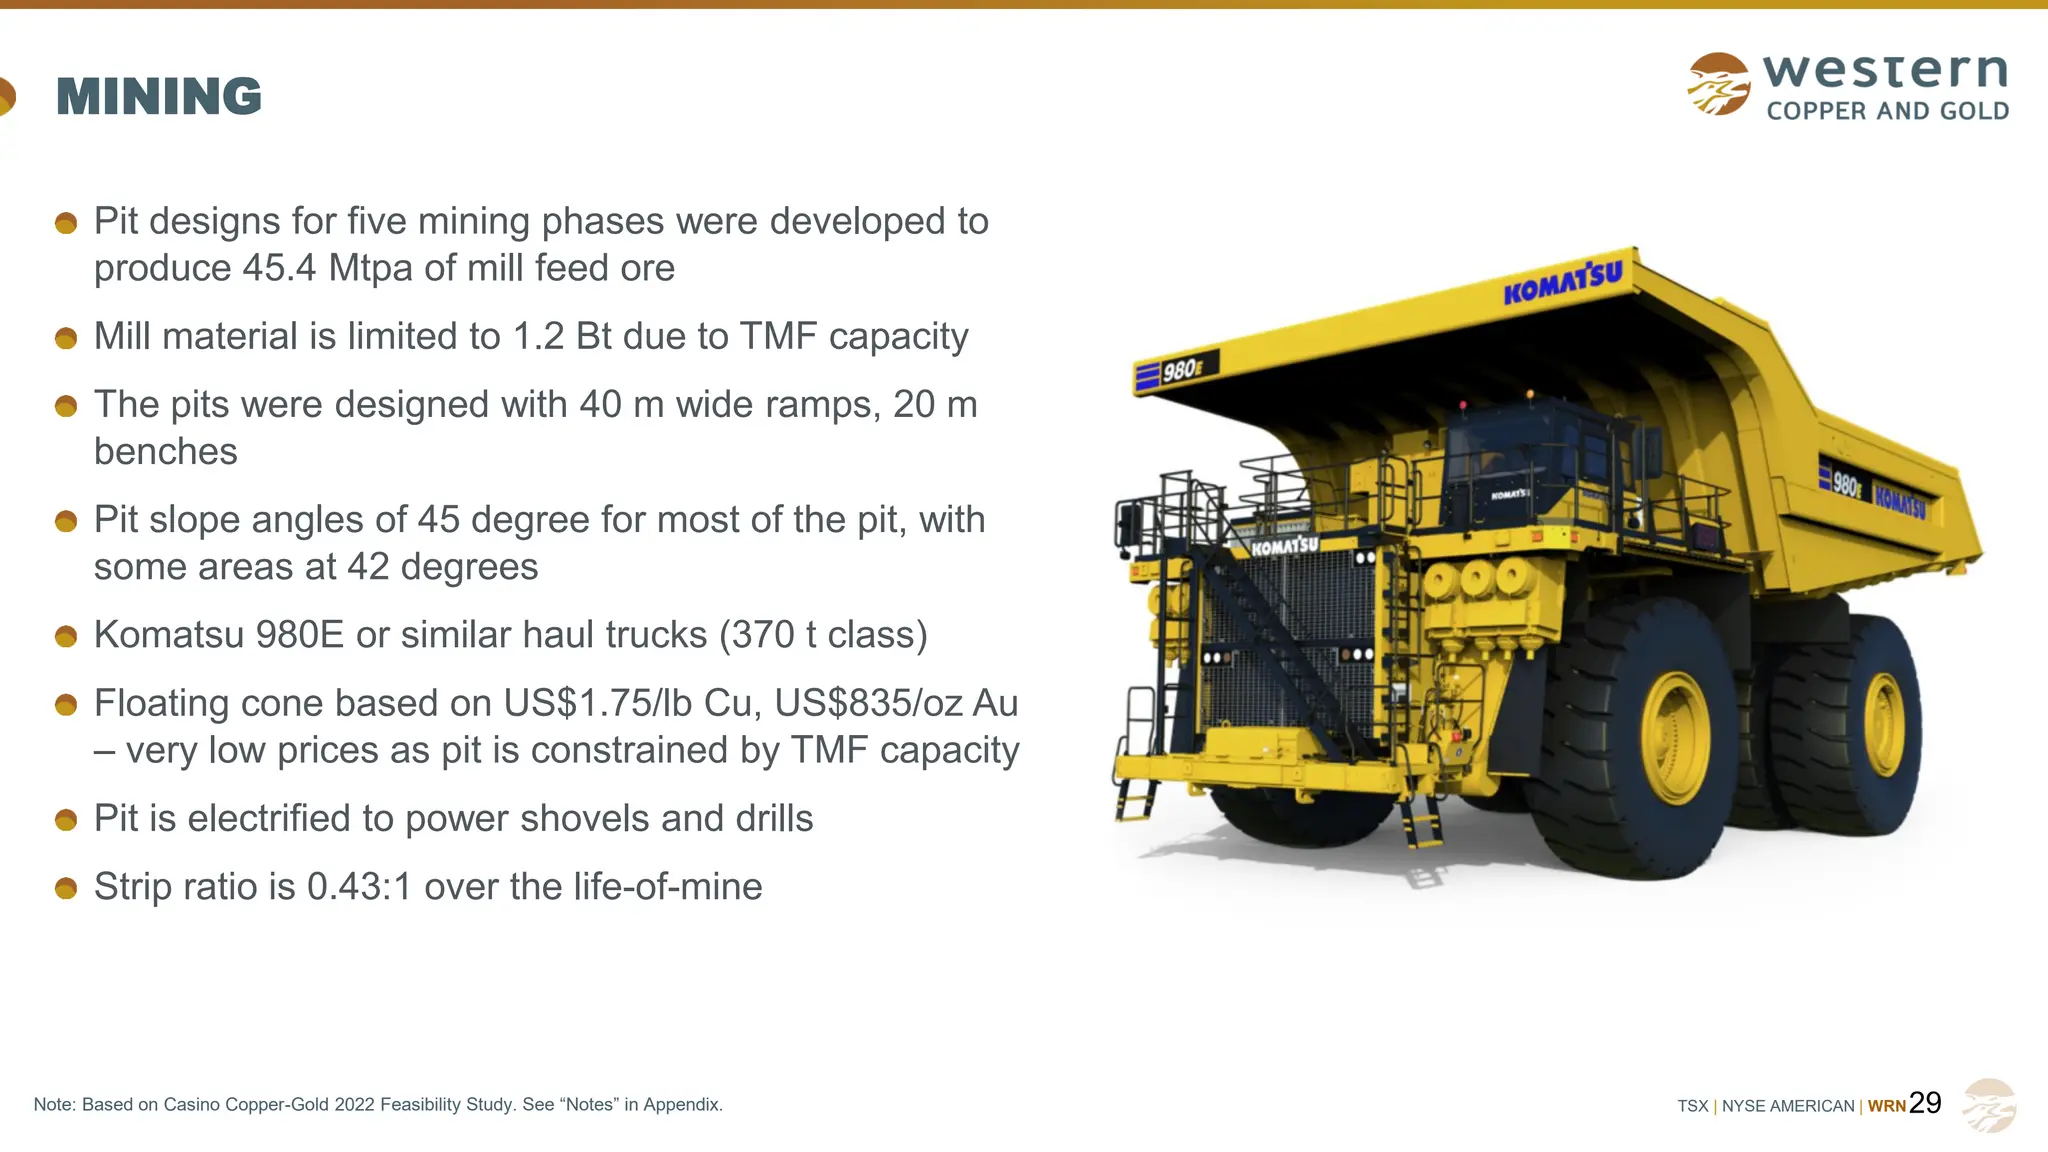
MINING
Pit designs for five mining phases were developed to
produce 45.4 Mtpa of mill feed ore
Mill material is limited to 1.2 Bt due to TMF capacity
The pits were designed with 40 m wide ramps, 20 m
benches
Pit slope angles of 45 degree for most of the pit, with
some areas at 42 degrees
Komatsu 980E or similar haul trucks (370 t class)
Floating cone based on US$1.75/lb Cu, US$835/oz Au
– very low prices as pit is constrained by TMF capacity
Pit is electrified to power shovels and drills
Strip ratio is 0.43:1 over the life-of-mine
29
Note: Based on Casino Copper-Gold 2022 Feasibility Study. See “Notes” in Appendix.
30.
TSX | NYSEAMERICAN | WRN
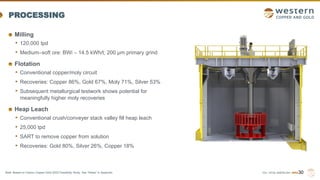
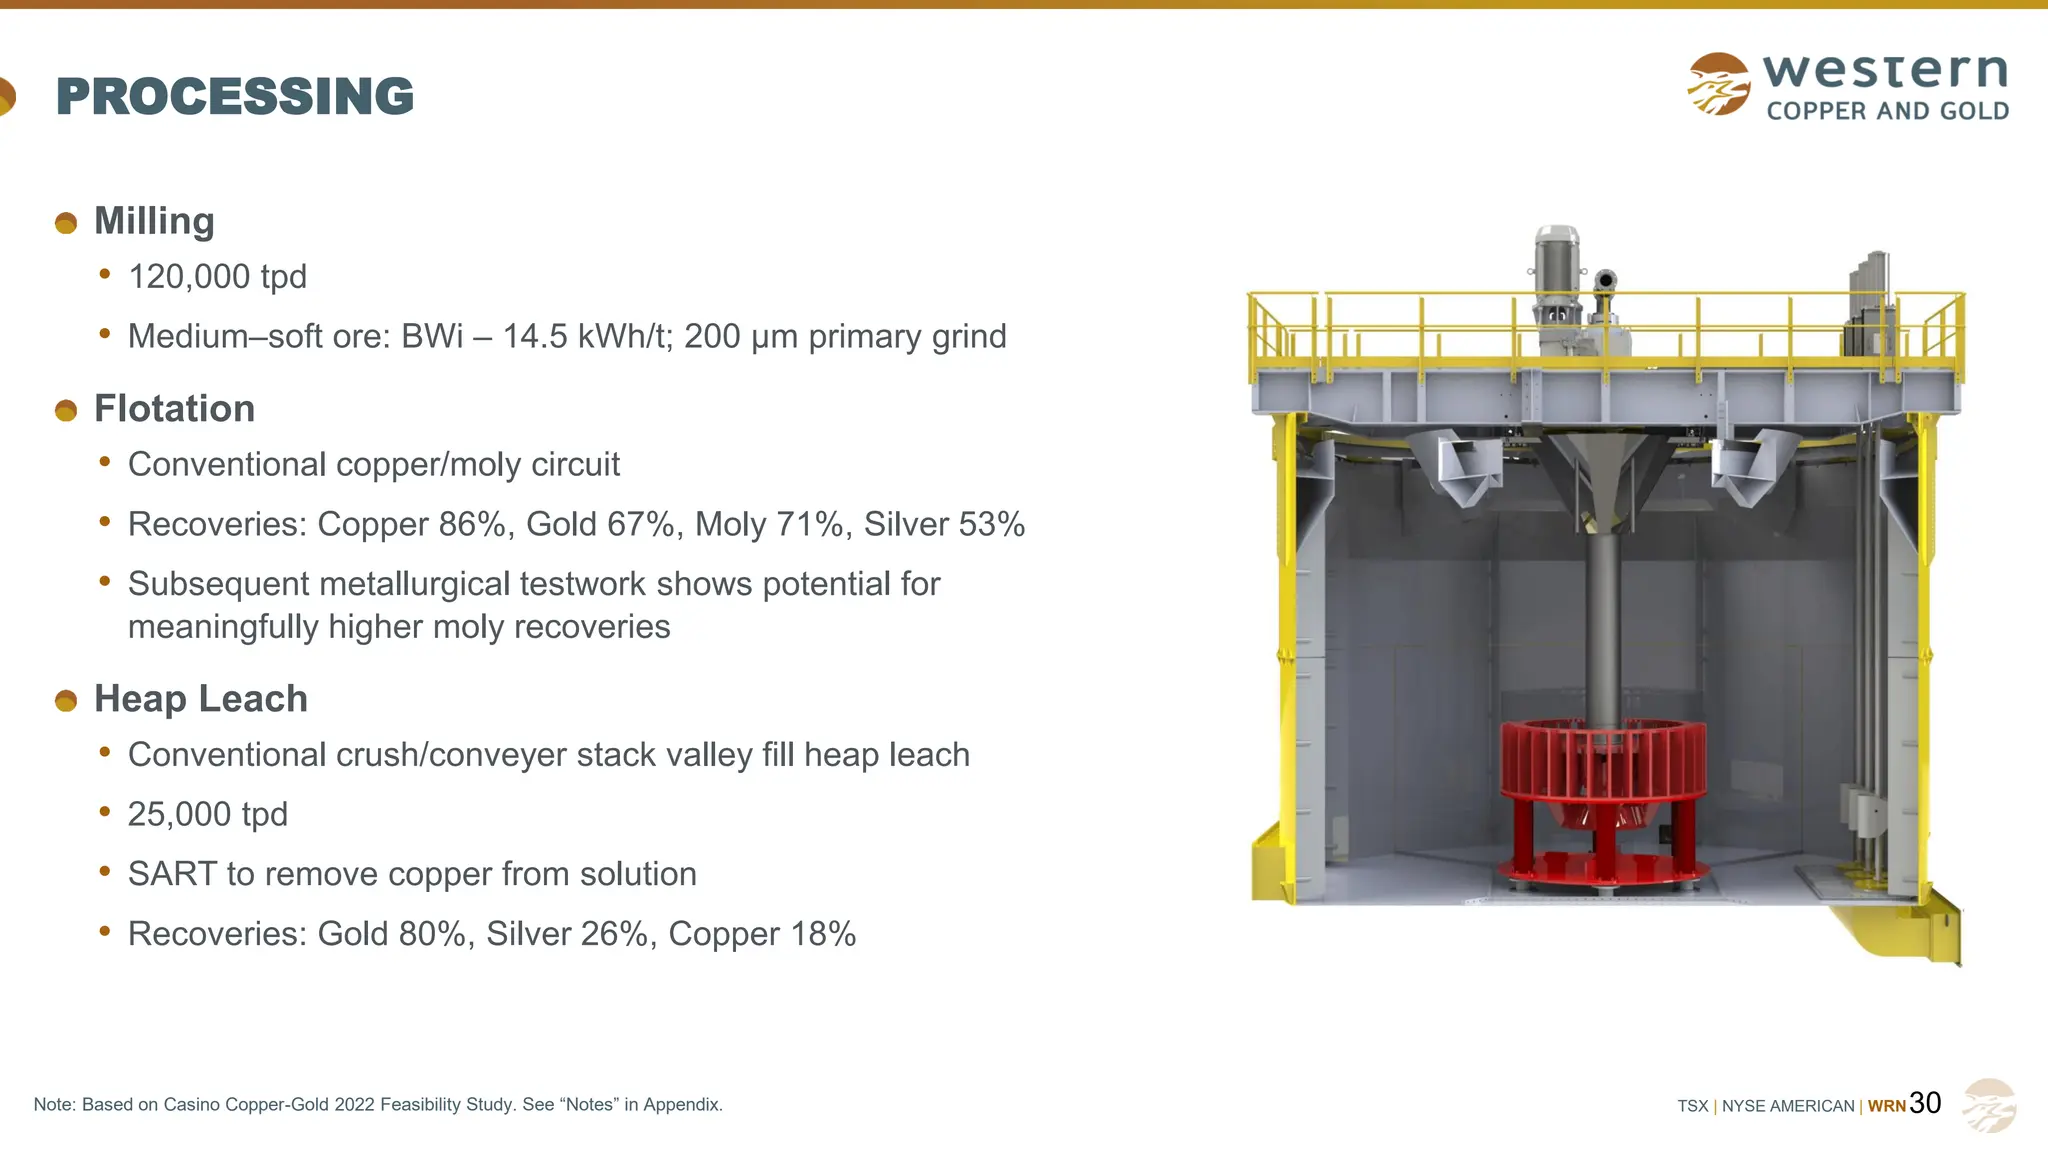
PROCESSING
Milling
• 120,000 tpd
• Medium–soft ore: BWi – 14.5 kWh/t; 200 µm primary grind
Flotation
• Conventional copper/moly circuit
• Recoveries: Copper 86%, Gold 67%, Moly 71%, Silver 53%
• Subsequent metallurgical testwork shows potential for
meaningfully higher moly recoveries
Heap Leach
• Conventional crush/conveyer stack valley fill heap leach
• 25,000 tpd
• SART to remove copper from solution
• Recoveries: Gold 80%, Silver 26%, Copper 18%
30
Note: Based on Casino Copper-Gold 2022 Feasibility Study. See “Notes” in Appendix.
TSX | NYSEAMERICAN | WRN
NOTES
Technical report entitled “Casino Copper-Gold Project, Form 43-101 F1
Technical Report Feasibility Study” dated June 13, 2022, a copy of which is
available on the Company's website at www.westerncopperandgold.com.
Prepared by: Daniel Roth, P.Eng.; Laurie Tahija, MMSA-QP; Patrick Dugan,
P.E.; Mike Hester, F Aus IMM; John M. Marek, P.Eng.; Carl Schulze, P.Geo.;
Daniel Friedman, P.Eng; Scott Weston, P.Geo; each of whom is a qualified
person pursuant to National Instrument 43-101 ("Qualified Person")
Mineral Resources
• The Mineral Resources have an effective date of 29 April 2022 and
the estimate was prepared using the definitions in CIM Definition Standards
(10 May 2014).
• All figures are rounded to reflect the relative accuracy of the estimate and
therefore numbers may not appear to add precisely.
• Mineral Resources that are not Mineral Reserves do not have demonstrated
economic viability.
• Mineral Resources for leach material are based on prices of US$3.50/lb
copper, US$1,650/oz gold and US$22/oz silver
• Mineral Resources for mill material are based on prices of US$3.50/lb
copper, US$1,650/oz gold, US$22/oz silver, and US$12.00/lb moly.
• Mineral Resources are based on NSR cut-off of C$6.61/t for leach material
and C$6.11/t for mill material.
• NSR value for leach material is as follows:
- NSR (C$/t) = $15.21 x copper (%) + $50.51 x gold (g/t) + $0.210 x silver (g/t), based
on copper recovery of 18%, gold recovery of 80% and silver recovery of 26%.
34
“Casino Copper-Gold Feasibility Study” • NSR value for hypogene sulphide mill material is:
- NSR (C$/t) = $73.81 x copper (%) + $41.16 x gold (g/t) + $213.78 x moly (%) +
0.386 x silver (g/t), based on recoveries of 92.2% copper, 66% gold, 50% silver
and 78.6% moly.
• NSR value for supergene mill material is:
- NSR (C$/t) = $80.06 x recoverable copper (%) + $43.03 x gold (g/t) + $142.11 x
moly (%) + 0.464 x silver (g/t), based on recoveries of 69% gold, 60% silver and
52.3% moly. Recoverable copper = 0.94 x (total copper – soluble copper).
• Mineral Resources are reported in relation to a conceptual constraining
pit shell in order to demonstrate reasonable prospects for eventual
economic extraction, as required by the definition of Mineral Resource in
NI 43-101; mineralization lying outside of the pit shell is excluded from
the Mineral Resource.
• AuEq and CuEq values are based on prices of US$3.50/lb copper,
US$1,650/oz gold, US$22/oz silver, and US$12.00/lb moly, and account
for all metal recoveries and smelting/refining charges.
• The NSR calculations also account for smelting and refining charges and
payables.
35.
TSX | NYSEAMERICAN | WRN
NOTES
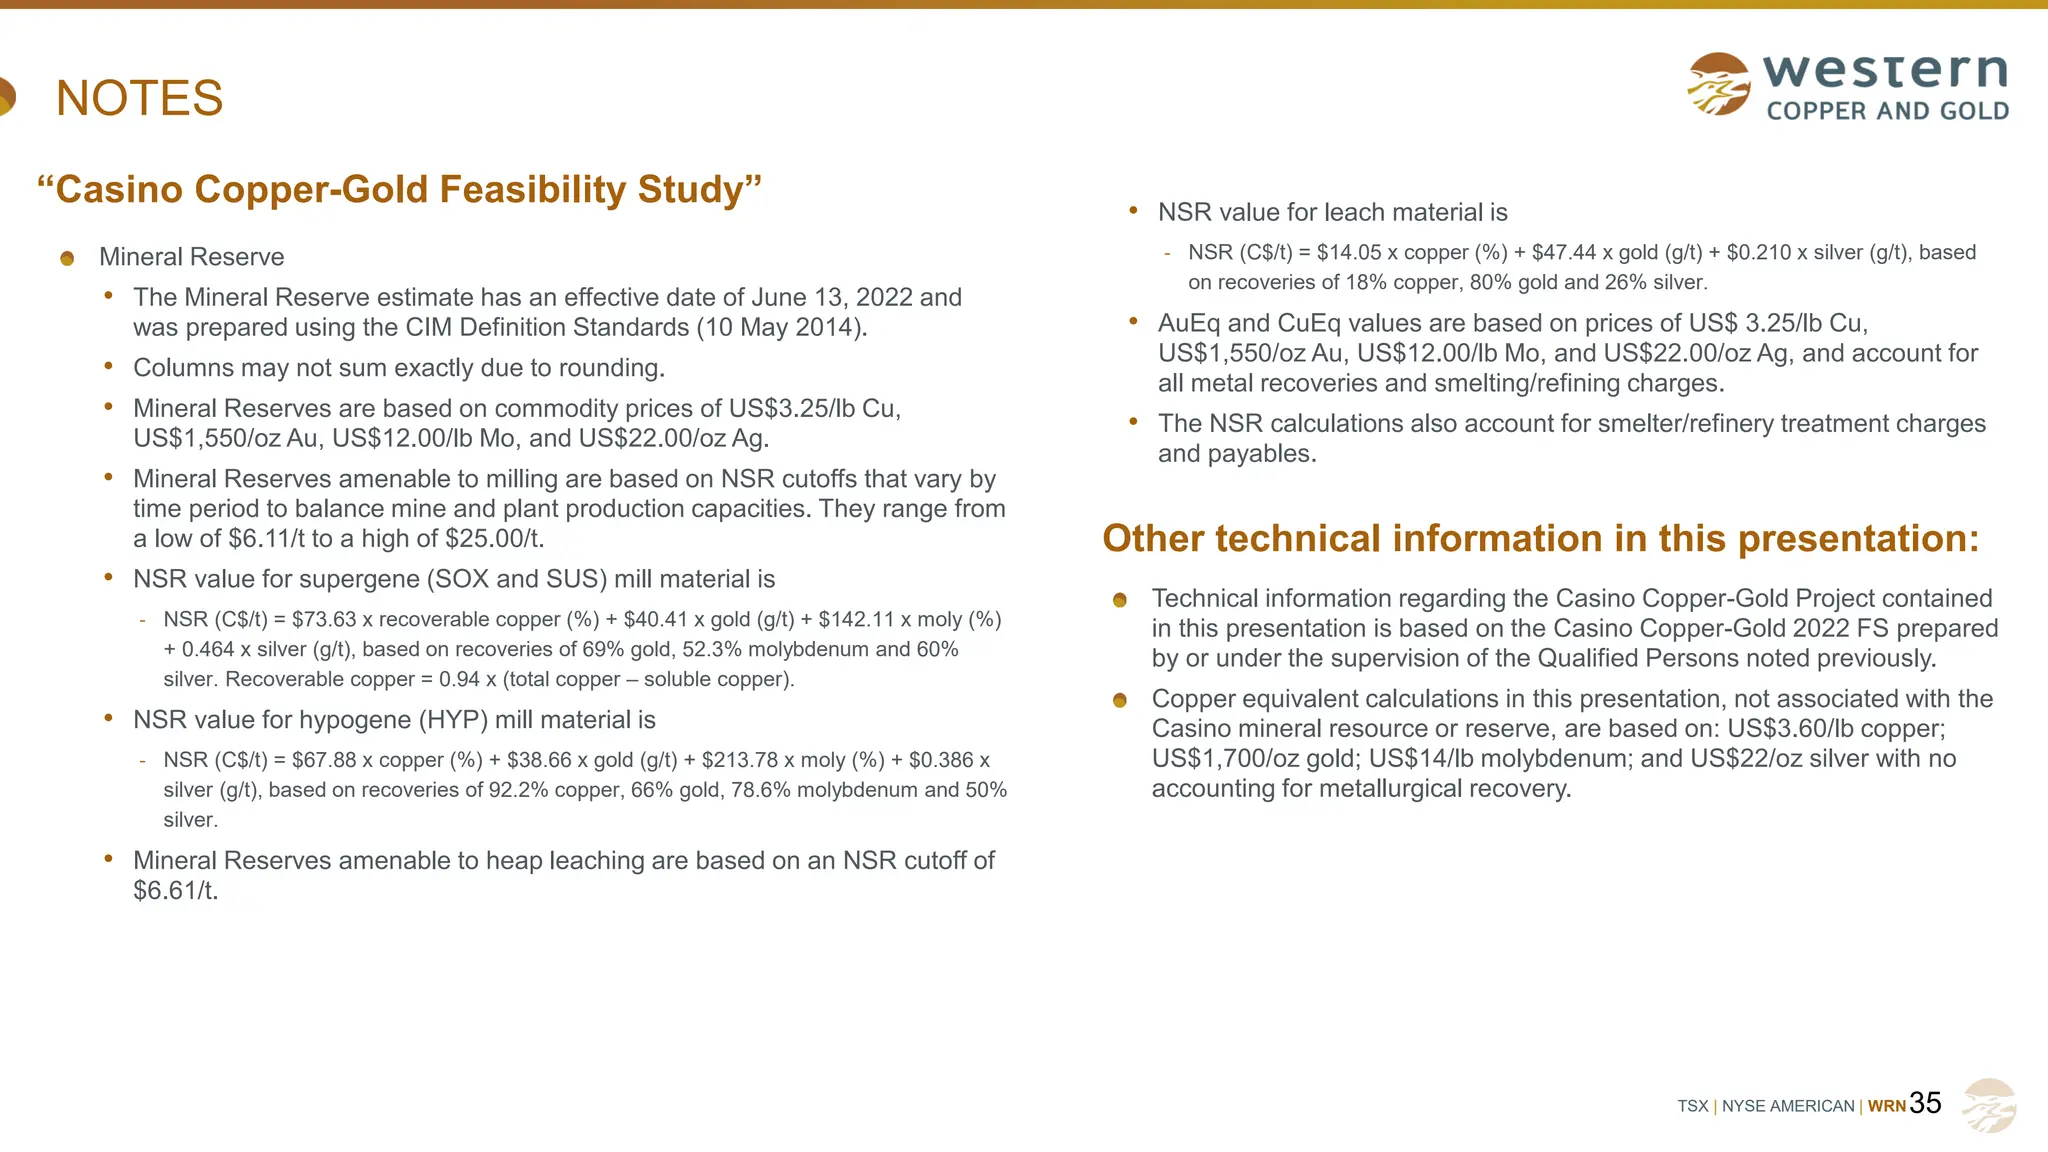
Mineral Reserve
• The Mineral Reserve estimate has an effective date of June 13, 2022 and
was prepared using the CIM Definition Standards (10 May 2014).
• Columns may not sum exactly due to rounding.
• Mineral Reserves are based on commodity prices of US$3.25/lb Cu,
US$1,550/oz Au, US$12.00/lb Mo, and US$22.00/oz Ag.
• Mineral Reserves amenable to milling are based on NSR cutoffs that vary by
time period to balance mine and plant production capacities. They range from
a low of $6.11/t to a high of $25.00/t.
• NSR value for supergene (SOX and SUS) mill material is
- NSR (C$/t) = $73.63 x recoverable copper (%) + $40.41 x gold (g/t) + $142.11 x moly (%)
+ 0.464 x silver (g/t), based on recoveries of 69% gold, 52.3% molybdenum and 60%
silver. Recoverable copper = 0.94 x (total copper – soluble copper).
• NSR value for hypogene (HYP) mill material is
- NSR (C$/t) = $67.88 x copper (%) + $38.66 x gold (g/t) + $213.78 x moly (%) + $0.386 x
silver (g/t), based on recoveries of 92.2% copper, 66% gold, 78.6% molybdenum and 50%
silver.
• Mineral Reserves amenable to heap leaching are based on an NSR cutoff of
$6.61/t.
35
“Casino Copper-Gold Feasibility Study”
Other technical information in this presentation:
• NSR value for leach material is
- NSR (C$/t) = $14.05 x copper (%) + $47.44 x gold (g/t) + $0.210 x silver (g/t), based
on recoveries of 18% copper, 80% gold and 26% silver.
• AuEq and CuEq values are based on prices of US$ 3.25/lb Cu,
US$1,550/oz Au, US$12.00/lb Mo, and US$22.00/oz Ag, and account for
all metal recoveries and smelting/refining charges.
• The NSR calculations also account for smelter/refinery treatment charges
and payables.
Technical information regarding the Casino Copper-Gold Project contained
in this presentation is based on the Casino Copper-Gold 2022 FS prepared
by or under the supervision of the Qualified Persons noted previously.
Copper equivalent calculations in this presentation, not associated with the
Casino mineral resource or reserve, are based on: US$3.60/lb copper;
US$1,700/oz gold; US$14/lb molybdenum; and US$22/oz silver with no
accounting for metallurgical recovery.