Download to read offline

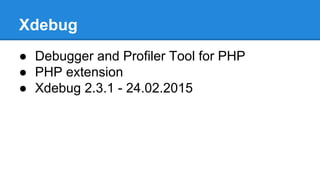
![Advanced config
[XDebug]
zend_extension="/<path>/xdebug.so"
xdebug.remote_enable=true
xdebug.remote_host=127.0.0.1
xdebug.remote_port=9000
xdebug.remote_handler=dbgp
xdebug.profiler_enable=1
xdebug.profiler_output_dir=/tmp](https://image.slidesharecdn.com/xdebugdrupalmeetup-150226155938-conversion-gate01/85/Xdebug-as-a-Drupal-debugging-tool-4-320.jpg)


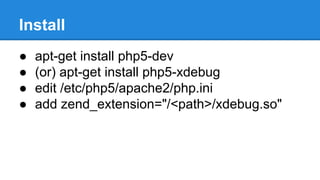
![Advanced config
[XDebug]
zend_extension="/<path>/xdebug.so"
xdebug.remote_enable=true
xdebug.remote_host=127.0.0.1
xdebug.remote_port=9000
xdebug.remote_handler=dbgp
xdebug.profiler_enable=1
xdebug.profiler_output_dir=/tmp](https://image.slidesharecdn.com/xdebugdrupalmeetup-150226155938-conversion-gate01/75/Xdebug-as-a-Drupal-debugging-tool-4-2048.jpg)


This document discusses using Xdebug as a debugging tool for Drupal. It provides instructions for installing Xdebug as a PHP extension, configuring advanced Xdebug settings, using PHPStorm as an IDE, and alternative debugging tools like debug(), dpq(), dpm(), and dvm(). Additional resources for Xdebug, PHPStorm configuration, and Drupal debugging are listed in the bibliography.


