Why Performance Matters in Python Development

This is a guest post from Dido Grigorov, a deep learning engineer and Python programmer with 17 years of experience in the field.
Python’s flexibility and ease of use make it a go-to language for developers, but its interpreted nature and global interpreter lock (GIL) can lead to performance bottlenecks, especially in large-scale or resource-intensive applications. Whether you’re building web servers, data pipelines, or real-time systems, optimizing Python code can save time, reduce costs, and improve the user experience.
Drawing from practical examples and insights from the Python community, this article explores proven performance hacks to help your applications run faster and more smoothly.
Understanding Python’s performance characteristics
Python’s interpreted nature fundamentally shapes its performance profile. Unlike compiled languages, like C, C++, or Rust, that translate source code directly into machine code before execution, Python follows a multi-step process that introduces inherent overhead.
When you run a Python script, the interpreter first compiles your source code into bytecode – a lower-level, platform-independent representation. This bytecode is then executed by the Python Virtual Machine (PVM), which translates each instruction into machine code at runtime.
This interpretation layer, while providing Python’s trademark flexibility and cross-platform compatibility, comes with a performance cost. Each line of code must be processed and translated during execution, creating a bottleneck that becomes particularly pronounced in computation-heavy scenarios.
The global interpreter lock challenge
Compounding Python’s interpreted nature is the global interpreter lock (GIL) – arguably one of the most significant performance limitations in CPython. The GIL is a mutex (mutual exclusion lock) that ensures only one thread can execute Python bytecode at any given moment, even on multi-core systems. While this design simplifies memory management and prevents race conditions in CPython’s internals, it effectively serializes execution for CPU-bound tasks.
The GIL’s impact varies significantly depending on your workload. I/O-bound operations – such as file reading, network requests, or database queries – can release the GIL during blocking operations, allowing other threads to proceed. However, CPU-intensive tasks like mathematical computations, data processing, or algorithmic operations remain largely single-threaded, unable to leverage multiple CPU cores through traditional threading.
With and without GIL
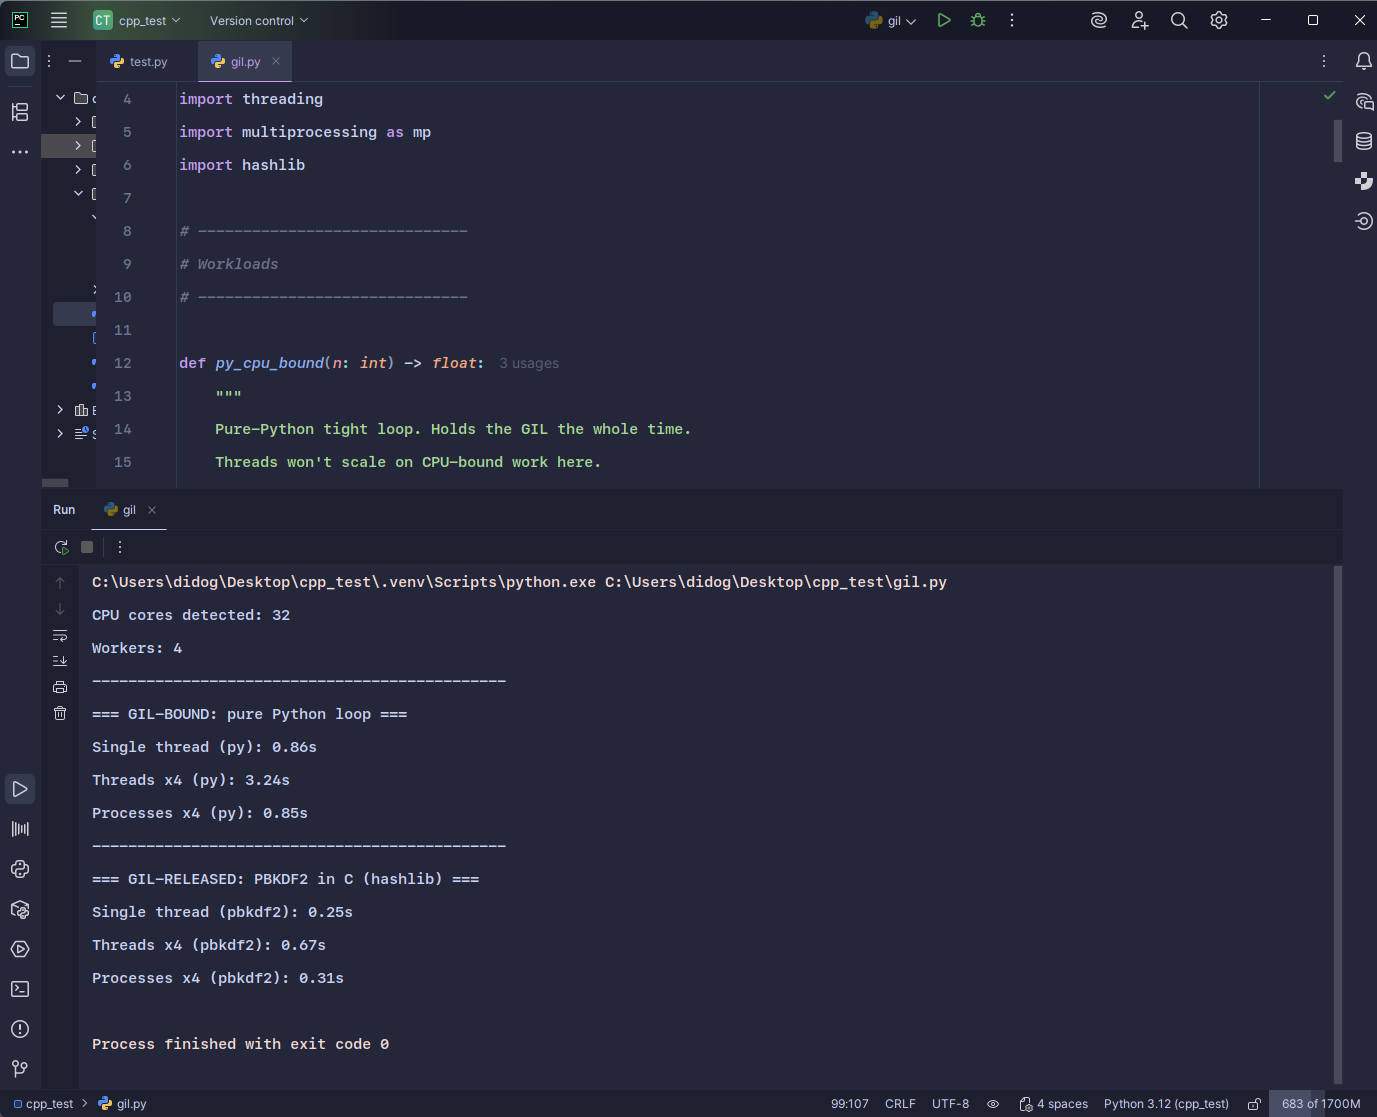
CPU cores detected: 32
Workers: 4
———————————————-
=== GIL-BOUND: pure Python loop ===
Single thread (py): 0.86s
Threads x4 (py): 3.24s
Processes x4 (py): 0.85s
———————————————-
=== GIL-RELEASED: PBKDF2 in C (hashlib) ===
Single thread (pbkdf2): 0.25s
Threads x4 (pbkdf2): 0.67s
Processes x4 (pbkdf2): 0.31s
Beyond language limitations: Code-level performance issues
While Python’s architectural constraints are well-documented, many performance problems stem from suboptimal coding practices that are entirely within developers’ control. These inefficiencies can dwarf the overhead introduced by interpretation and the GIL, making code optimization both critical and highly impactful.
Common performance pitfalls include:
- Unnecessary looping
- String concatenation in loops
- Not using built-in functions or libraries
- Misusing lists instead of appropriate data structures
- Overusing global variables
- Not using generators for large datasets
- Ignoring the GIL in CPU-bound tasks
- Excessive function calls or recursion
- Not profiling or benchmarking
- Overusing list comprehensions for side effects
- Repeatedly accessing object attributes
- Not using
enumerate()for index tracking - Inefficient dictionary key checks
- Copying large data structures unnecessarily
- Ignoring exception handling overhead
- Overusing regular expressions
- Not batching I/O operations
- Dynamic type checking overhead
- Not using context managers for resources
The critical importance of optimization
Understanding why performance optimization matters requires examining its impact across multiple dimensions of software development and deployment.
Resource efficiency and infrastructure costs
Unoptimized code creates a cascading effect on system resources. CPU-intensive operations that could run in seconds might take minutes, tying up processors and preventing other tasks from executing efficiently. Memory inefficiencies can lead to excessive RAM usage, forcing systems to rely on slower disk-based virtual memory. Poor I/O patterns can saturate network connections or overwhelm storage systems.
In cloud environments, these inefficiencies translate directly into financial costs. Cloud providers charge based on resource consumption – CPU time, memory usage, storage operations, and network bandwidth.
A poorly optimized algorithm that runs 10 times slower doesn’t just delay results; it increases your cloud bill by an order of magnitude. For organizations processing large datasets or serving high-traffic applications, these costs can quickly escalate from hundreds to thousands of dollars monthly.
Scalability and system limits
Performance issues that seem manageable during development or small-scale testing become exponentially worse under production loads. An application that handles dozens of users might crumble under thousands. A data processing pipeline that works with gigabytes of data might fail entirely when faced with terabytes.
Scalability challenges often emerge at predictable inflection points. Database queries that perform adequately with thousands of records may time out with millions. Web applications that respond quickly to individual requests may become unresponsive when handling concurrent users. Background processing jobs that complete within acceptable timeframes during off-peak hours may fall behind during high-demand periods, creating growing backlogs that eventually overwhelm the system.
Poor performance characteristics make horizontal scaling – adding more servers or instances – less effective and more expensive. Instead of smoothly distributing load across additional resources, inefficient code often creates bottlenecks that prevent proper load distribution. This forces organizations to over-provision resources or implement complex workarounds that increase system complexity and operational overhead.
User experience and competitive advantage
In user-facing applications, performance directly impacts user satisfaction and business outcomes. Research consistently shows that users abandon applications and websites that respond slowly, with abandonment rates increasing dramatically for delays exceeding 2–3 seconds. Mobile applications face even stricter performance expectations, as users expect instant responsiveness despite potentially limited processing power and network connectivity.
Development velocity and technical debt
Counter-intuitively, investing in performance optimization often accelerates development velocity over time. Slow test suites discourage frequent testing, leading to longer feedback cycles and increased bug detection costs. Development environments that respond sluggishly reduce programmer productivity and increase context-switching overhead. Build and deployment processes that take excessive time slow down iteration cycles and delay feature releases.
Performance problems also compound over time, creating technical debt that becomes increasingly expensive to address. Code that performs adequately during initial development may degrade as features are added, data volumes grow, or usage patterns evolve. Early investment in performance-conscious design and optimization practices prevents this degradation and maintains system responsiveness as complexity increases.
Operational stability and reliability
Performance and reliability are intimately connected. Systems operating near their performance limits are inherently fragile, with little headroom to handle traffic spikes, data volume increases, or unexpected load patterns. What appears to be a reliability issue – application crashes, timeouts, or service unavailability – often traces back to performance problems that exhaust system resources or exceed operational thresholds.
Optimized code provides operational resilience by maintaining acceptable performance even under stressful conditions. This resilience translates into better uptime, fewer emergency interventions, and more predictable system behavior. Organizations with performance-optimized systems spend less time firefighting production issues and more time delivering value to users.
The strategic imperative
Performance optimization isn’t merely a technical consideration – it’s a strategic business imperative that affects costs, user satisfaction, competitive positioning, and operational efficiency. While Python’s interpreted nature and GIL limitations create inherent performance constraints, the majority of performance issues stem from code-level inefficiencies that skilled developers can identify and address.
The key is approaching performance optimization systematically, with clear metrics, targeted improvements, and continuous monitoring. Rather than premature optimization that complicates code without measurable benefit, effective performance work focuses on identifying actual bottlenecks, implementing proven optimization techniques, and measuring results to ensure improvements deliver real value.
Dispelling common performance myths
Before exploring optimization techniques, it’s crucial to address widespread misconceptions that can lead developers down unproductive paths or cause them to dismiss Python entirely for performance-critical applications.
Myth 1: Python is universally slow
This oversimplification ignores Python’s nuanced performance characteristics and the critical distinction between different types of computational workloads. Python’s performance varies dramatically depending on the nature of the task and how the code leverages the broader Python ecosystem.
For I/O-bound operations – tasks that spend most of their time waiting for external resources like file systems, databases, or network services – Python’s interpreted overhead becomes largely irrelevant. When your program spends 95% of its time waiting for a database query to complete or a web API to respond, the few milliseconds of interpretation overhead pale in comparison to the I/O latency. In these scenarios, Python’s expressiveness and rapid development capabilities far outweigh any performance concerns.
Myth 2: The GIL eliminates all concurrency benefits
The global interpreter lock’s impact on performance is frequently misunderstood, leading developers to either avoid threading entirely or attempt inappropriate parallelization strategies. The reality is more nuanced and depends heavily on workload characteristics.
For I/O-bound tasks, threading remains highly effective despite the GIL. When a thread initiates an I/O operation – whether reading from disk, making a network request, or querying a database – it releases the GIL, allowing other threads to execute Python code. This means that a multi-threaded web scraper can achieve significant performance improvements by processing multiple requests concurrently, even though each individual request involves Python code execution.
The distinction is clear when comparing CPU-bound versus I/O-bound scenarios. A single-threaded program making sequential HTTP requests will be limited by network latency, regardless of CPU speed. Adding threads allows multiple requests to proceed simultaneously, dramatically reducing total execution time. Conversely, a CPU-intensive calculation like computing prime numbers or processing images will see minimal benefit from threading due to GIL contention.
Understanding this distinction enables appropriate tool selection. Threading excels for I/O-bound parallelism, while CPU-bound tasks benefit from multiprocessing (which bypasses the GIL by using separate processes) or specialized libraries that release the GIL during computation-intensive operations.
Myth 3: Hardware upgrades substitute for code optimization
The temptation to solve performance problems by upgrading hardware is understandable, but often ineffective and economically wasteful. While faster processors, additional memory, or improved storage can provide linear performance improvements, they cannot overcome fundamental algorithmic inefficiencies that exhibit quadratic, cubic, or exponential time complexity.
Consider a sorting algorithm comparison: Upgrading from a 2GHz to a 4GHz processor will make Bubble Sort run twice as fast, but switching from Bubble Sort (O(n²)) to Quick Sort (O(n log n)) provides exponentially greater improvements as data size increases. For sorting 10,000 elements, the algorithmic improvement might yield a 100x speed gain, while the hardware upgrade provides only a 2x improvement.
This principle scales to real-world applications. A database query with poor indexing won’t be significantly helped by faster hardware, but adding appropriate indexes can reduce execution time from minutes to milliseconds. A web application that loads entire datasets into memory for simple filtering operations will struggle regardless of available RAM, but implementing database-level filtering can reduce both memory usage and execution time by orders of magnitude.
Hardware upgrades also carry ongoing costs in cloud environments. A poorly optimized application might require a server instance with 16 CPU cores and 64GB of RAM, while an optimized version could run efficiently on 2 cores and 8GB of RAM. Over time, the cost difference becomes substantial, especially when multiplied across multiple environments or scaled to handle increasing load.
Myth 4: Performance optimization is about intuition and experience
The belief that experienced developers can reliably identify performance bottlenecks through code review or intuition leads to wasted effort and suboptimal results. Human intuition about code performance is notoriously unreliable, especially in high-level languages like Python where the relationship between source code and actual execution patterns is complex.
Profiling tools provide objective, quantitative data about where programs actually spend their time, often revealing surprising results. That nested loop you suspected was the bottleneck might account for only 2% of execution time, while an innocuous-looking string operation consumes 60% of runtime. Library calls that appear lightweight might involve substantial overhead, while seemingly expensive operations might be highly optimized.
Tools like cProfile, line_profiler, and memory_profiler remove guesswork by providing detailed breakdowns of function call frequency, execution time, and resource usage. These tools not only identify actual bottlenecks but also quantify the potential impact of optimizations, helping prioritize improvement efforts.
Profiling also reveals performance patterns that aren’t immediately obvious from source code inspection. Garbage collection overhead, import costs, attribute access patterns, and memory allocation behavior all contribute to runtime performance in ways that static analysis cannot predict. Data-driven optimization based on profiling results consistently outperforms intuition-based approaches.
Moving beyond misconceptions
Recognizing these myths enables more strategic thinking about Python performance optimization. Rather than dismissing Python for performance-sensitive applications or attempting blanket optimizations, developers can make informed decisions about when and how to optimize based on actual usage patterns and measured performance characteristics.
The key insight is that Python performance optimization is contextual and empirical. Understanding your specific workload characteristics, measuring actual performance bottlenecks, and selecting appropriate optimization strategies based on data rather than assumptions will yield far better results than following generic performance advice or avoiding Python entirely due to perceived limitations.
The critical role of profiling and benchmarking
Effective performance optimization relies on measurement, not guesswork. Without systematic profiling and benchmarking, optimization efforts often miss the actual bottlenecks and waste valuable development time on improvements that don’t matter.
Why intuition fails
Developer intuition about performance is notoriously unreliable. We naturally focus on complex-looking code, assuming it’s slow, while overlooking simple operations that actually dominate runtime. Python’s high-level abstractions make this worse – an innocent list comprehension might trigger massive memory allocations, while an apparently expensive algorithm contributes negligibly to total execution time.
Profiling: Finding the real bottlenecks
Profiling tools provide objective data about where your program actually spends time. Tools like cProfile show which functions are called most frequently and consume the most time, while line_profiler pinpoints specific statements within functions. Memory profilers track allocation patterns and identify memory leaks that trigger excessive garbage collection.
This data-driven approach replaces guesswork with facts. Instead of optimizing code that looks slow, you optimize the functions that actually dominate your application’s runtime.
Benchmarking: Measuring success
Benchmarking quantifies whether your optimizations actually work. Without systematic measurement, you can’t know if changes improve performance, by how much, or under what conditions.
Effective benchmarking requires running multiple iterations to account for system variability, using representative datasets that match production workloads, and testing both isolated functions (microbenchmarks) and complete workflows (end-to-end benchmarks).
Benchmarking with cProfile
Benchmarking with cProfile reveals slow functions and call counts. For example, profiling a naive Fibonacci function shows millions of recursive calls, but memoization reduces this dramatically:
# Naive Fibonacci
def fib(n):
    if n <= 1:
        return n
    return fib(n-1) + fib(n-2)

def process_data(n):
    results = []
    for i in range(n):
        results.append(fib(i) * 2)
    return results

import cProfile
cProfile.run("process_data(30)")
# Output: 4356620 function calls in 4.239 seconds

# With memoization
def fib_memo(n, memo={}):
    if n in memo:
        return memo[n]
    if n <= 1:
        return n
    memo[n] = fib_memo(n-1, memo) + fib_memo(n-2, memo)
    return memo[n]

def process_data_fast(n):
    return [fib_memo(i) * 2 for i in range(n)]

cProfile.run("process_data_fast(30)")
# Output: 91 function calls in 0.000 seconds
Time measured:
Naive Fibonacci: Output: 4,356,620 function calls in 4.239 seconds
4356620 function calls (64 primitive calls) in 1.646 seconds

   Ordered by: standard name

   ncalls  tottime  percall  cumtime  percall filename:lineno(function)
4356586/30    1.646    0.000    1.646    0.055 <ipython-input-45-6e8c229d1114>:3(fib)
        1    0.000    0.000    1.646    1.646 <ipython-input-45-6e8c229d1114>:8(process_data)
        1    0.000    0.000    1.646    1.646 <string>:1(<module>)
        1    0.000    0.000    1.646    1.646 {built-in method builtins.exec}
       30    0.000    0.000    0.000    0.000 {method 'append' of 'list' objects}
        1    0.000    0.000    0.000    0.000 {method 'disable' of '_lsprof.Profiler' objects}
With memoization: 91 function calls in 0.000 seconds – Memoization helps by storing the results of expensive function calls and reusing them when the same inputs occur again.
91 function calls (35 primitive calls) in 0.000 seconds
Ordered by: standard name

   ncalls  tottime  percall  cumtime  percall filename:lineno(function)
        1    0.000    0.000    0.000    0.000 <ipython-input-46-d2e1a597ad5b>:12(process_data_fast)
        1    0.000    0.000    0.000    0.000 <ipython-input-46-d2e1a597ad5b>:13(<listcomp>)
    86/30    0.000    0.000    0.000    0.000 <ipython-input-46-d2e1a597ad5b>:4(fib_memo)
        1    0.000    0.000    0.000    0.000 <string>:1(<module>)
        1    0.000    0.000    0.000    0.000 {built-in method builtins.exec}
        1    0.000    0.000    0.000    0.000 {method 'disable' of '_lsprof.Profiler' objects}
Benchmarking with time and timeit
- time: Offers quick runtime estimates for rough comparisons.
- timeit: Ideal for benchmarking small snippets and running them multiple times for accuracy. For instance, comparing summation methods shows
sum(range(n))is fastest:
import timeit
n = 1000000
setup = "n = 1000000"
loop_time = timeit.timeit("total = 0\nfor i in range(n): total += i", setup=setup, number=10)
sum_time = timeit.timeit("sum(range(n))", setup=setup, number=10)
print(f"Loop: {loop_time:.4f}s, Built-in Sum: {sum_time:.4f}s")
Time measured:
- Loop: 2.0736s
- Built-in sum: 0.9875s
How to optimize Python code with PyCharm
Steps to profile Python code in PyCharm
1. Open your project
Open the Python project you want to analyze in PyCharm.
2. Choose the file or function to profile
Open the Python file you want to profile. You can profile a full script or specific test functions.
3. Run with the PyCharm profiler
You have two main options:
Option A: Profile a script
- Right-click the Python script (e.g.
main.py). - Select: Profile ‘<script name>’
Option B: Use the menu
- Go to Run | Profile…
- Choose your script or configuration.
4. Wait for execution
The script will run normally, but PyCharm will collect profiling data in the background.
5. View profiling results
Once execution completes:
- PyCharm will open the Profiler window.
- You’ll then see:
- The function call hierarchy
- The execution time per function
- The number of calls
- CPU time vs. wall time
- Call graphs (optional)
- The function call hierarchy
You can sort by time, filter functions, and drill down into nested calls.
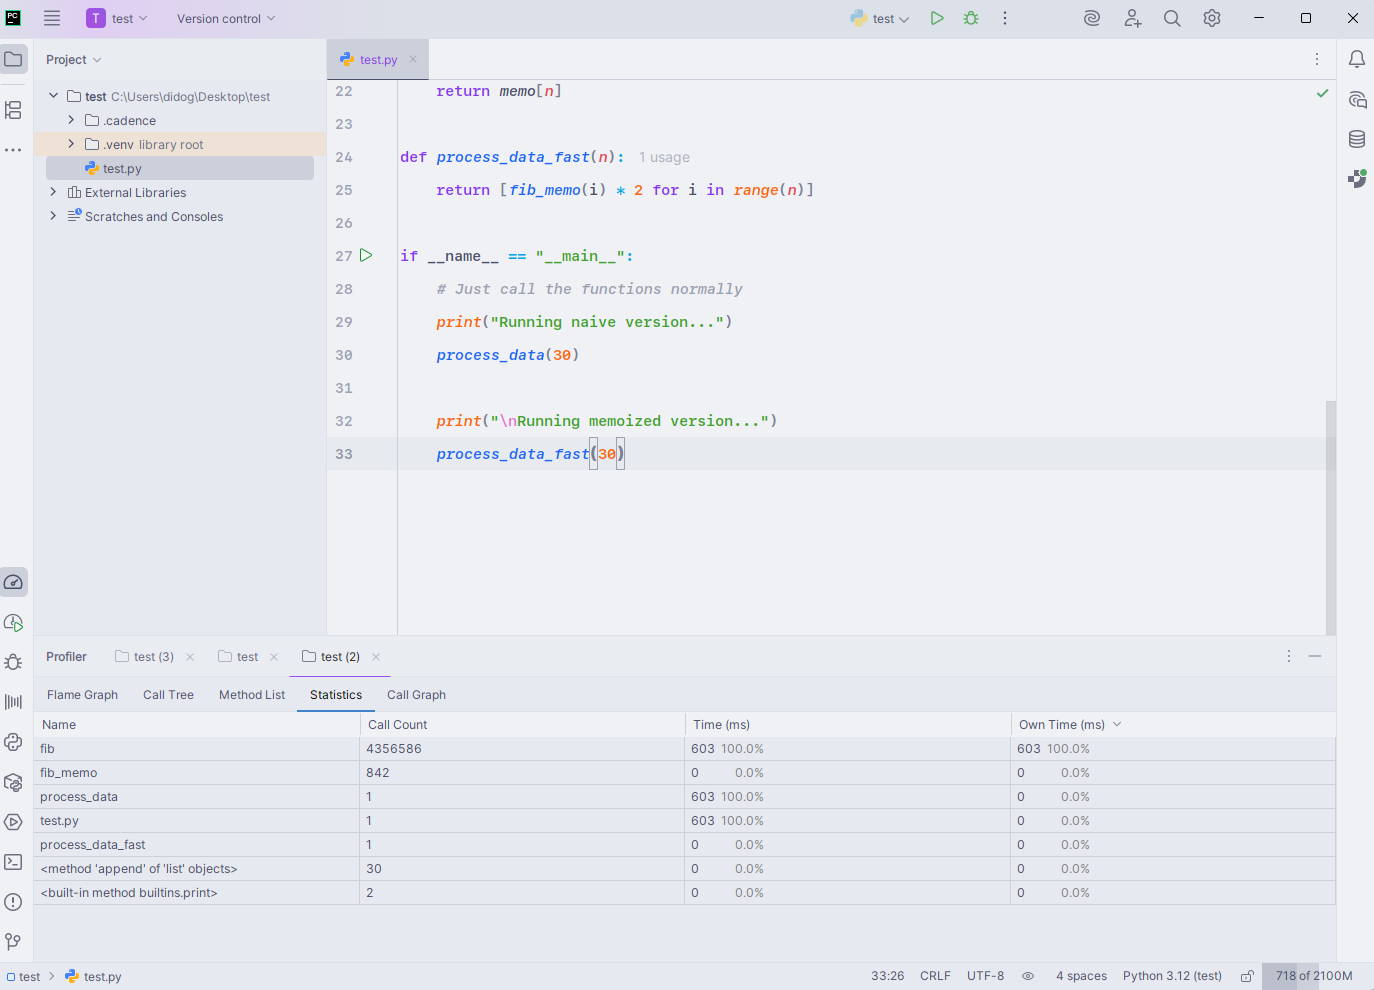
Understanding the profiling report
The PyCharm IDE runs a Python script (test.py) that compares the performance of a naive Fibonacci implementation with a memoized version. The built-in profiler’s Statistics tab is open, revealing that the naive fib function was called over 4.3 million times, taking 603 ms in total, while the memoized version completed almost instantly.
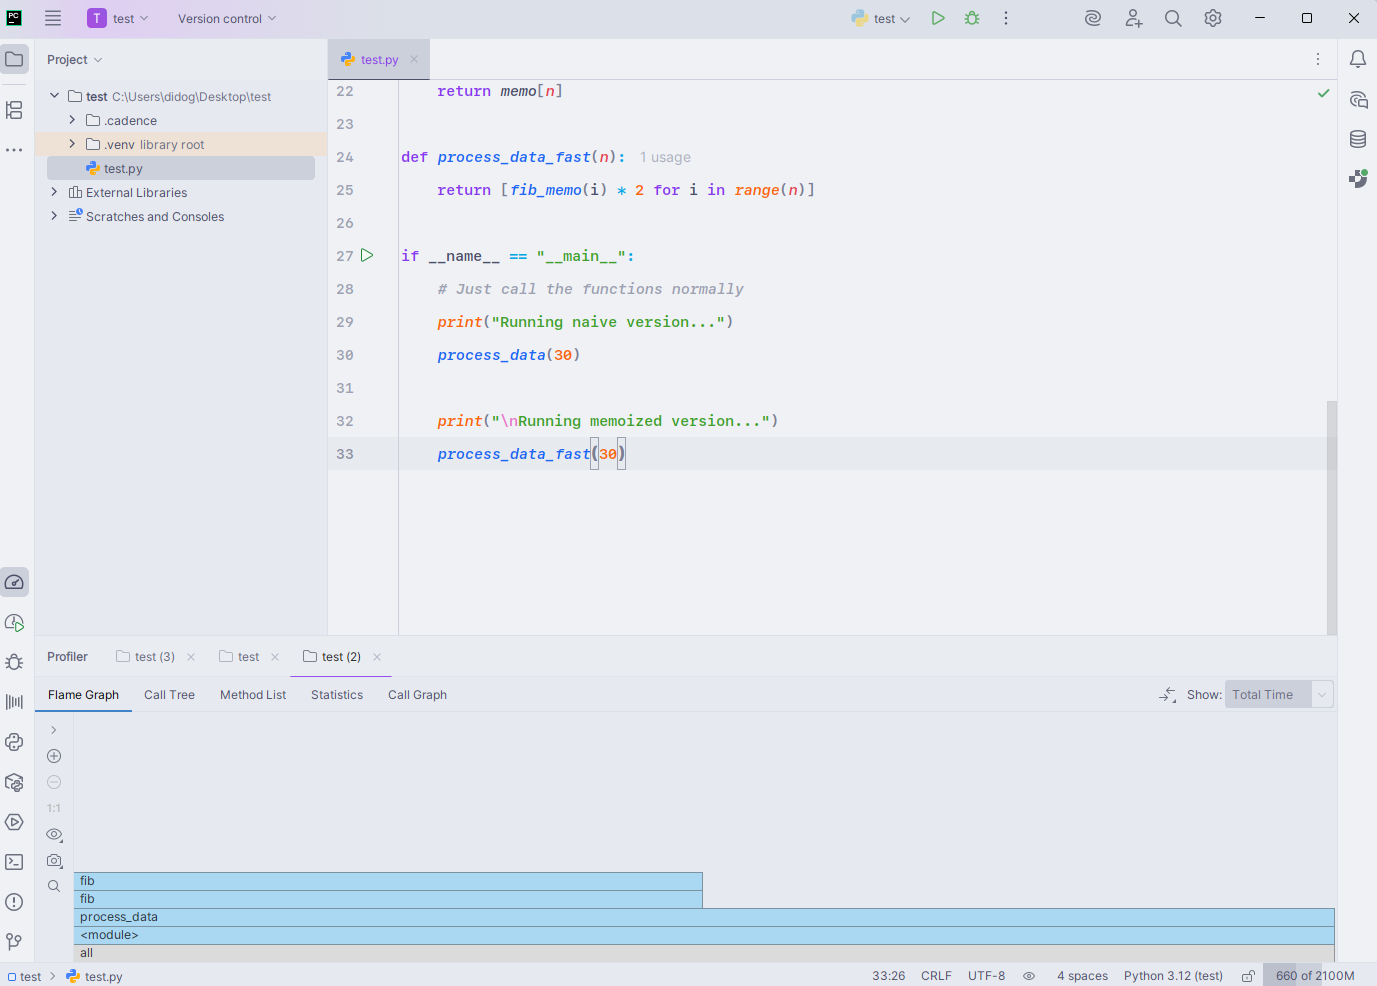
We benchmark naive versus memoized Fibonacci calculations. The built-in profiler is open in the Flame Graph view, visually illustrating that the naive fib function dominates the execution time, while the memoized version’s impact is negligible, highlighting the performance gains from memoization.
PyCharm spotlights a classic bottleneck: A naive Fibonacci thrashes in recursion while the memoized path sails through. The Call Tree view lays it bare – two deep fib branches swallow essentially the entire 603 ms runtime:
- It attributes ~100% of total time to
process_data()→fib(), split across the left/right recursive calls (~301 ms each).
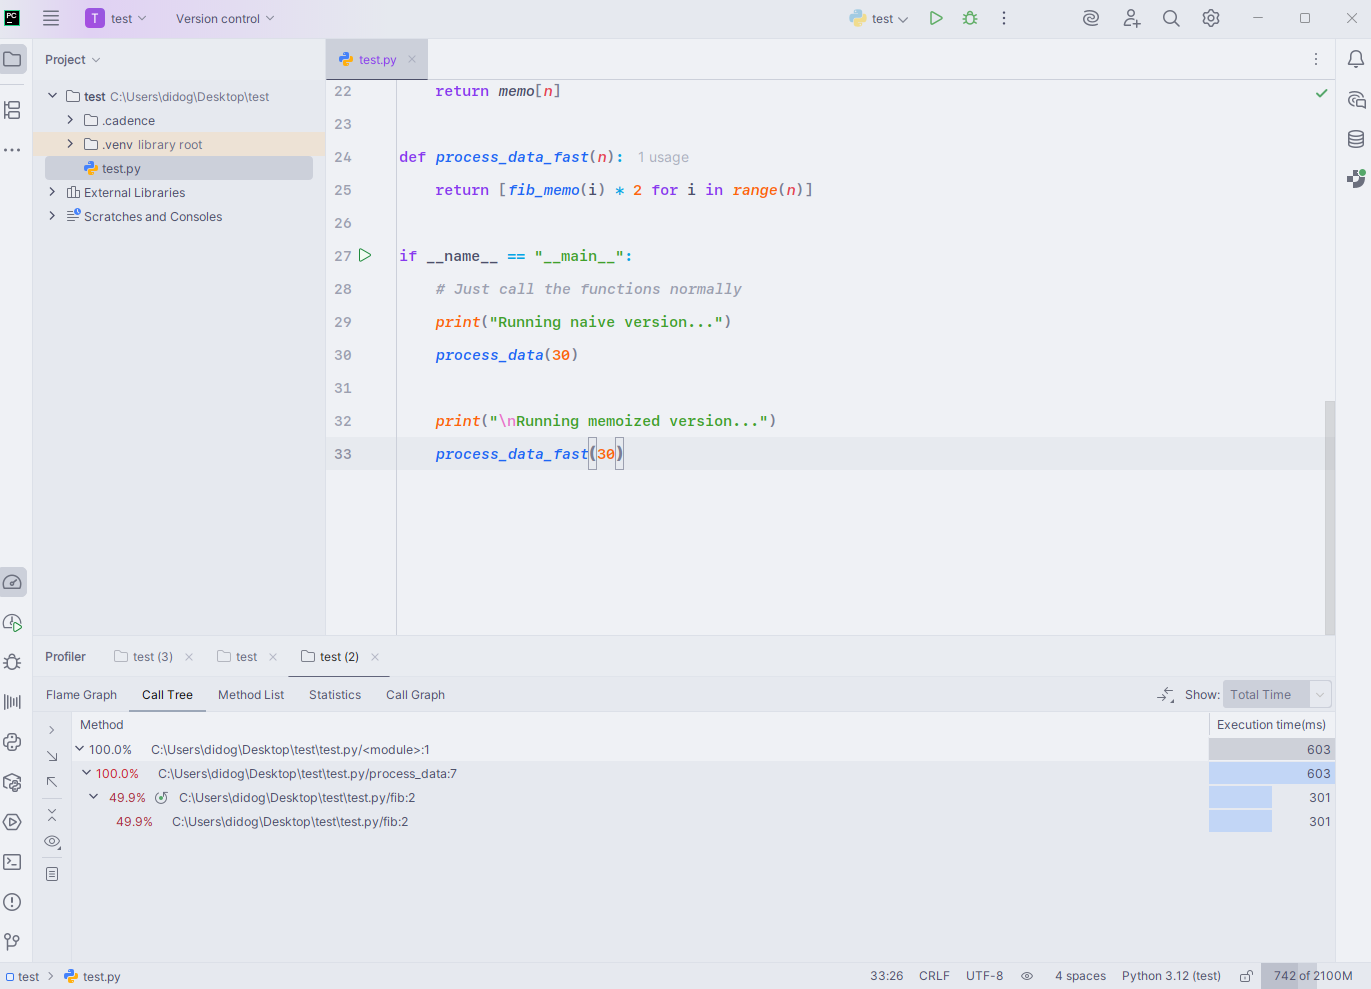
- This symmetry is typical of the exponential
fib(n-1) + fib(n-2)pattern without caching. - Since the memoized version doesn’t meaningfully appear in the tree, it indicates near-zero overhead after warm-up – evidence that memoization collapses the exponential recursion into linear-time lookups.
- Takeaway: for overlapping subproblems (like Fibonacci), memoization transforms runtime from O(φ^n) to O(n) and eliminates the recursion-dominated hotspots you see here.
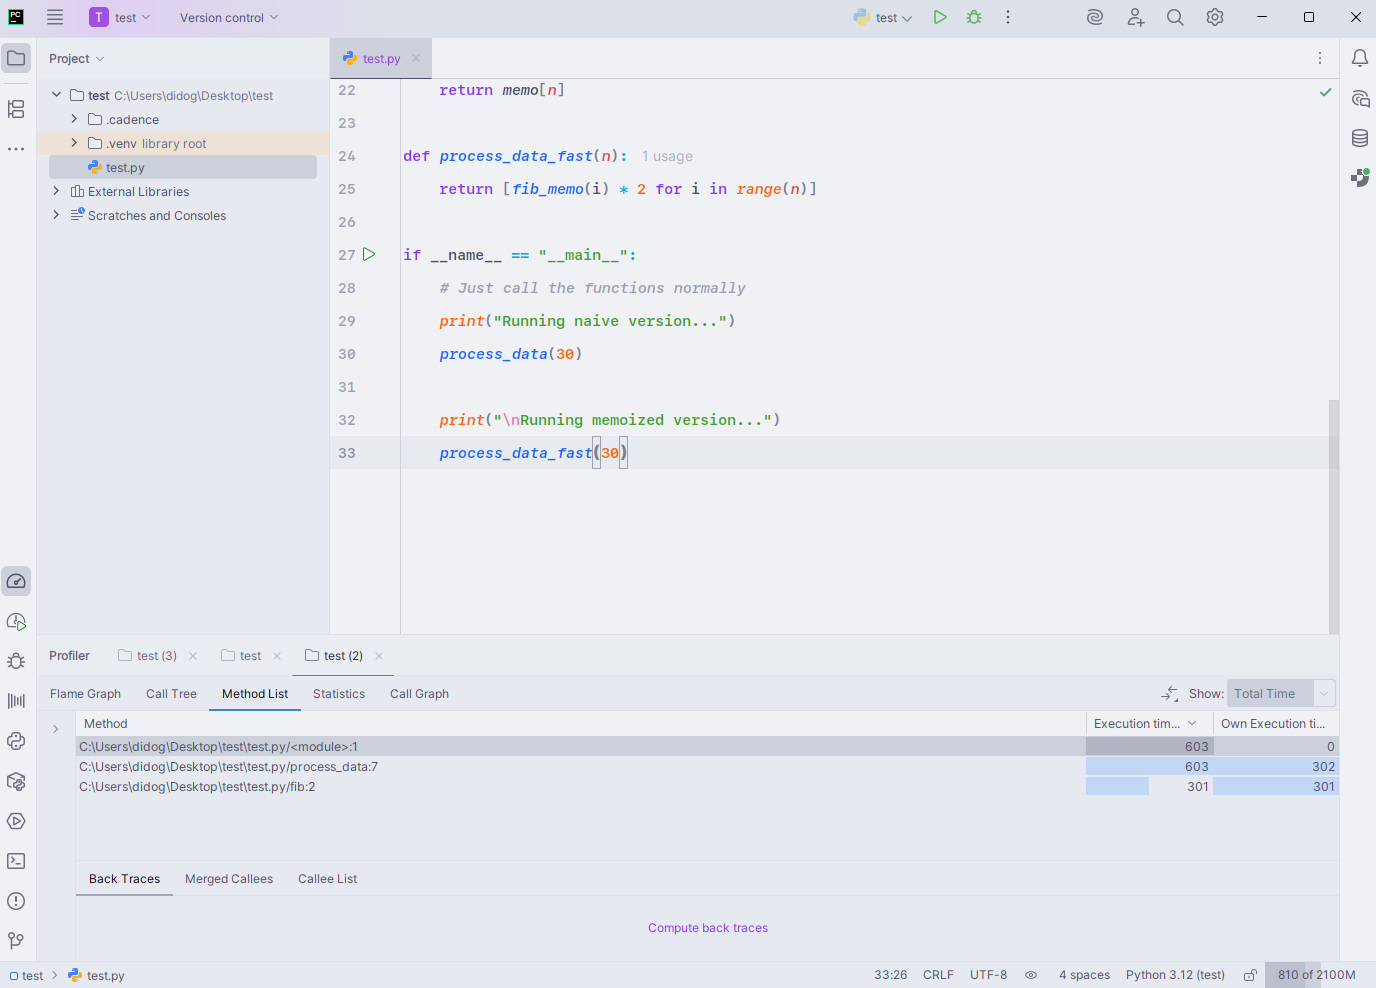
In the PyCharm profiler’s Method List view, the naive Fibonacci routine makes its dominance clear – fib() consumes nearly all of the 603 ms execution time, while process_data() and the module’s entry point simply act as conduits:
The table shows fib() at 301 ms per branch, totaling the full runtime, which aligns with the exponential recursion tree where both subcalls expand almost equally.
The “Own Execution Time” column confirms that most of the cost is in the recursive body itself, not in overhead from process_data() or I/O.
No memoized calls appear here because the fast version runs so quickly it barely registers on the profiler. The pattern is a textbook example of performance profiling – identifying the hotspot and confirming that optimization should target the recursive core rather than the surrounding code.
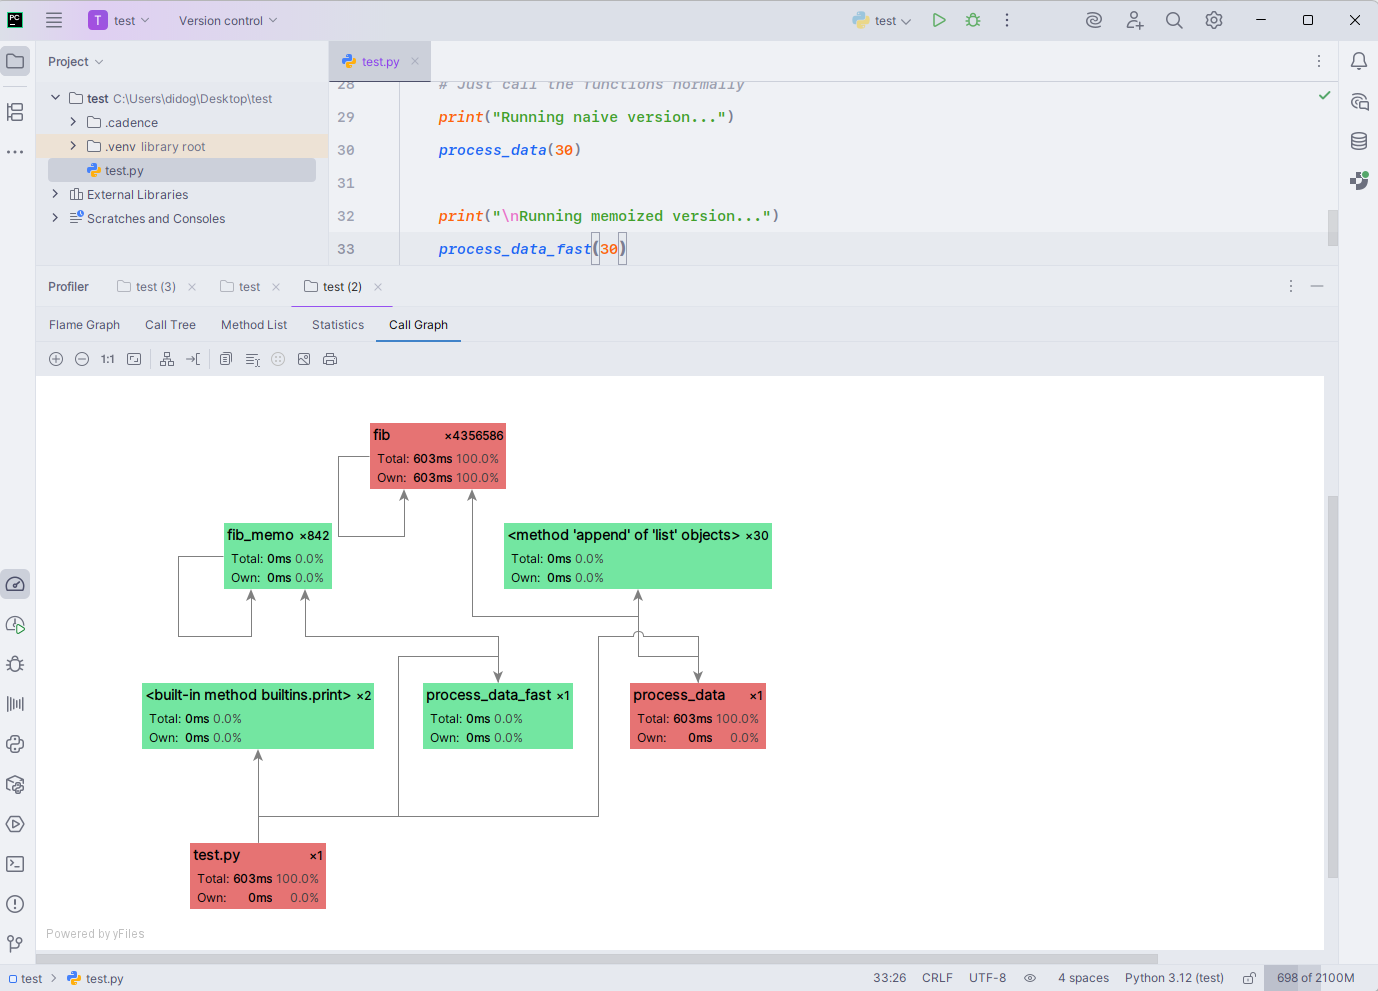
The PyCharm profiler’s Call Graph view paints a clear picture –fib() dominates the execution time in bright red, clocking 603 ms over 4.3 million calls, while everything else barely registers.
The red nodes in the graph highlight performance hotspots, with fib() responsible for 100% of the total runtime. Both process_data() and the module’s main entry point route directly into this costly recursion, confirming there’s no other significant time sink.
Green nodes like fib_mem0() and append() in lists indicate negligible runtime impact, which aligns with the near-instant memoized execution path.
The visualization makes the optimization priority obvious – replace or cache the expensive fib() calls, and the program’s runtime collapses from hundreds of milliseconds to near zero.
In summary
Optimize when your code creates noticeable bottlenecks in critical processes, especially as workloads grow. Key triggers include rising cloud costs from inefficient resource usage, user-facing delays (even 100 ms can hurt engagement), and when moving from prototype to production.
Performance optimization delivers efficiency gains, enables scalability for growth, controls costs, provides competitive advantages, ensures reliability under pressure, and improves user satisfaction.
How to approach optimization
Follow a systematic approach. Profile first to identify real bottlenecks rather than guessing, leverage established libraries like NumPy and pandas, prioritize algorithmic improvements (better Big O complexity beats micro-optimizations), and always measure results to verify improvements.
CPU-bound vs I/O-bound operations
- CPU-bound tasks are limited by processor speed and include computations like mathematical calculations, image processing, and machine learning training. Python’s global interpreter lock (GIL) restricts true multithreading for these tasks.
- I/O-bound operations involve waiting for input/output like file reads, network requests, or database queries. The CPU remains mostly idle during these operations, making them less affected by the GIL.
General optimization principles
- Measure first: Use profiling tools (
cProfile,timeit,line_profiler) to identify bottlenecks. Optimizing without data is guesswork. - Choose the right tool: Match algorithms, data structures, and concurrency models to your task (CPU-bound vs. I/O-bound).
- Minimize overhead: Reduce Python’s interpretive and dynamic nature where it slows you down.
- Trade-offs: Balance speed, memory, and readability based on your needs.
About the author


Subscribe to PyCharm Blog updates