[DebuggerV2] Flesh out graph execution data display #3528
Conversation
| this.store.select(getGraphExecutionDisplayCount) | ||
| ), | ||
| filter(([, runId, numGraphExecutions]) => { | ||
| return runId !== null && numGraphExecutions > 0; |
There was a problem hiding this comment.
To make it a tiny bit readable, can we only select the things we need here? i.e., move L565-566 to L588?
| for (const {dataExists, page3Size, loadingPages} of [ | ||
| {dataExists: false, page3Size: 0, loadingPages: [3]}, | ||
| {dataExists: false, page3Size: 0, loadingPages: []}, | ||
| {dataExists: true, page3Size: 2, loadingPages: []}, | ||
| ]) { | ||
| it('triggers GraphExecution loading', fakeAsync(() => { |
There was a problem hiding this comment.
Unsure about jasmine, but for at least mocha, you need to have unique spec name in order for tests to be run as a separate spec. Please generate a unique name for these. Please try changing value of L917 to something faulty and see if it fails.
| ); | ||
|
|
||
| action.next(graphExecutionScrollToIndex({index: newScrollBeginIndex})); | ||
| tick(100); |
There was a problem hiding this comment.
What does this achieve? Is this to sequentialize promise returned by the data source? Can we instead use proper async/await?
There was a problem hiding this comment.
tick(100) is needed because of the debounceTime(100) in the effect created by onGraphExecutionScroll(). This test won't pass without it. 100 is therefore not an arbitrary number.
Using fakeAsync() with tick() is better than async/await because it is simulated passage of time and hence should make the test run in shorter period of time.
| const pageIndex = Math.floor(i / pageSize); | ||
| if (graphExecutionDataLoadingPages.indexOf(pageIndex) !== -1) { | ||
| graphExecutionDataLoadingPages.splice( | ||
| graphExecutionDataLoadingPages.indexOf(pageIndex), | ||
| 1 | ||
| ); | ||
| } |
There was a problem hiding this comment.
Is there a reason why we chose array for graphExecutionDataLoadingPages instead of an object?
There was a problem hiding this comment.
graphExecutionDataLoadingPages maintains the pages that are currently being loaded. An object could serve the same purpose, perhaps a little more performantly if the number of pages is large. But the downside is that the key type will be a little arbitrary (perhaps just null?) We don't want to keep track of all the pages, because the number of pages can be large (consider a debugger run with 500k graph executions, which leads to 500k / 200 = 2500 keys in the object if we did that). In practice, the performance shouldn't matter either, because the amount of loading pages should usually be small (the size of the array grows with user scrolling the list, at a debounced rate).
| begin: 2, | ||
| end: 4, | ||
| graph_executions: [ | ||
| createTestGraphExecution({op_name: 'TestOp_2'}), |
There was a problem hiding this comment.
Can you change this name so I can know whether we are expecting to overwrite or not?
There was a problem hiding this comment.
Done. It is supposed to be overwritten. The test now reflects that.
| } | ||
|
|
||
| .tensor-name-and-op-type { | ||
| direction: rtl; |
There was a problem hiding this comment.
why do we use rtl in this file? What is this achieving? Is it abusing a11y for UI purposes? If so, how can we make these properly a11y complaint?
There was a problem hiding this comment.
So the rationale for rtl is as follows. We often see very long node/tensor names in tf problems, e.g.,
resnet/residual_block_50/conv_30/Conv2D_0resnet/residual_block_50/conv_31/Conv2D_0
When the space is limited, we want to omit some parts of the strings with ellipsis (...). But often the most interest part of a node/tensor name is at the end or toward the end. So we want to omit the beginning part of the name. Using rtl together with text-overflow: ellipsis and white-space: nowrapachieves that purpose.
There was a problem hiding this comment.
Ah, about that. While I am okay for this to merge as is, I would like to talk about nicer approach. Let's chat offline (I want to show you something)
|
|
||
| <!-- TODO(cais): Add cdk-virtual-scroll-viewport for graph executions --> | ||
| <cdk-virtual-scroll-viewport | ||
| #executionsScroll |
There was a problem hiding this comment.
Is this used? I do not see any references to this.
There was a problem hiding this comment.
You're right. It's unused. Removed.
| </div> | ||
| <div *ngIf="graphExecutionData[i]; else dataLoading"> | ||
| <div class="tensor-name-and-op-type"> | ||
| <div class="tensor-name"> |
There was a problem hiding this comment.
No AI: you probably mean span in a lot of these places. I cannot tell by just reading these though.
There was a problem hiding this comment.
In these cases here I do want div, because I want them to be one separate lines (e.g., tensor-name and op-type) and be nested (e.g., tensor-name-and-op-type and tensor-name). But follow-up CLs will indeed use a lot of spans. Stay tuned.
| numGraphExecutions: number | null = null; | ||
|
|
||
| @Input() | ||
| graphExecutionData: {[index: number]: GraphExecution} = {}; |
There was a problem hiding this comment.
components should not define default values. Prefer to use graphExecutionData!: {[index: number]: GraphExecution};
(it forces container to pass the input or remove unused input in the component)
There was a problem hiding this comment.
Done here and elsewhere in this component file.
| it('does not render execs viewport if # execs = 0', fakeAsync(() => { | ||
| const fixture = TestBed.createComponent(GraphExecutionsContainer); | ||
| store.overrideSelector(getNumGraphExecutions, 0); | ||
| fixture.autoDetectChanges(); |
There was a problem hiding this comment.
interesting but prefer to use store.refreshState() and fixture.detectChanges() without tick and fakeAsync (is this for the virtual scrolling on @angular/material/cdk)?
Nonetheless, 500 in tick(500) feels very arbitrary.
There was a problem hiding this comment.
Yes, the special test patterns you see here (including autoDetectChanges(), tick() and fakeAsync()) are used because of the virtual scrolling used by the component.
autoDetectChanges()seems to be required by the cdk scrolling. I couldn't get the test to pass by usingrefreshState()anddetectChanges().- As for
tick(500), I found it can be replaced with simplytick(). Done. fakeAsync()is required fortick(). See https://angular.io/api/core/testing/tick.
| this.store.select(getGraphExecutionDisplayCount) | ||
| ), | ||
| filter(([, runId, numGraphExecutions]) => { | ||
| return runId !== null && numGraphExecutions > 0; |
|
|
||
| <!-- TODO(cais): Add cdk-virtual-scroll-viewport for graph executions --> | ||
| <cdk-virtual-scroll-viewport | ||
| #executionsScroll |
There was a problem hiding this comment.
You're right. It's unused. Removed.
| </div> | ||
| <div *ngIf="graphExecutionData[i]; else dataLoading"> | ||
| <div class="tensor-name-and-op-type"> | ||
| <div class="tensor-name"> |
There was a problem hiding this comment.
In these cases here I do want div, because I want them to be one separate lines (e.g., tensor-name and op-type) and be nested (e.g., tensor-name-and-op-type and tensor-name). But follow-up CLs will indeed use a lot of spans. Stay tuned.
| numGraphExecutions: number | null = null; | ||
|
|
||
| @Input() | ||
| graphExecutionData: {[index: number]: GraphExecution} = {}; |
There was a problem hiding this comment.
Done here and elsewhere in this component file.
| it('does not render execs viewport if # execs = 0', fakeAsync(() => { | ||
| const fixture = TestBed.createComponent(GraphExecutionsContainer); | ||
| store.overrideSelector(getNumGraphExecutions, 0); | ||
| fixture.autoDetectChanges(); |
There was a problem hiding this comment.
Yes, the special test patterns you see here (including autoDetectChanges(), tick() and fakeAsync()) are used because of the virtual scrolling used by the component.
autoDetectChanges()seems to be required by the cdk scrolling. I couldn't get the test to pass by usingrefreshState()anddetectChanges().- As for
tick(500), I found it can be replaced with simplytick(). Done. fakeAsync()is required fortick(). See https://angular.io/api/core/testing/tick.
| } | ||
|
|
||
| .tensor-name-and-op-type { | ||
| direction: rtl; |
There was a problem hiding this comment.
So the rationale for rtl is as follows. We often see very long node/tensor names in tf problems, e.g.,
resnet/residual_block_50/conv_30/Conv2D_0resnet/residual_block_50/conv_31/Conv2D_0
When the space is limited, we want to omit some parts of the strings with ellipsis (...). But often the most interest part of a node/tensor name is at the end or toward the end. So we want to omit the beginning part of the name. Using rtl together with text-overflow: ellipsis and white-space: nowrapachieves that purpose.
| for (const {dataExists, page3Size, loadingPages} of [ | ||
| {dataExists: false, page3Size: 0, loadingPages: [3]}, | ||
| {dataExists: false, page3Size: 0, loadingPages: []}, | ||
| {dataExists: true, page3Size: 2, loadingPages: []}, | ||
| ]) { | ||
| it('triggers GraphExecution loading', fakeAsync(() => { |
| ); | ||
|
|
||
| action.next(graphExecutionScrollToIndex({index: newScrollBeginIndex})); | ||
| tick(100); |
There was a problem hiding this comment.
tick(100) is needed because of the debounceTime(100) in the effect created by onGraphExecutionScroll(). This test won't pass without it. 100 is therefore not an arbitrary number.
Using fakeAsync() with tick() is better than async/await because it is simulated passage of time and hence should make the test run in shorter period of time.
| begin: 2, | ||
| end: 4, | ||
| graph_executions: [ | ||
| createTestGraphExecution({op_name: 'TestOp_2'}), |
There was a problem hiding this comment.
Done. It is supposed to be overwritten. The test now reflects that.
| const pageIndex = Math.floor(i / pageSize); | ||
| if (graphExecutionDataLoadingPages.indexOf(pageIndex) !== -1) { | ||
| graphExecutionDataLoadingPages.splice( | ||
| graphExecutionDataLoadingPages.indexOf(pageIndex), | ||
| 1 | ||
| ); | ||
| } |
There was a problem hiding this comment.
graphExecutionDataLoadingPages maintains the pages that are currently being loaded. An object could serve the same purpose, perhaps a little more performantly if the number of pages is large. But the downside is that the key type will be a little arbitrary (perhaps just null?) We don't want to keep track of all the pages, because the number of pages can be large (consider a debugger run with 500k graph executions, which leads to 500k / 200 = 2500 keys in the object if we did that). In practice, the performance shouldn't matter either, because the amount of loading pages should usually be small (the size of the array grows with user scrolling the list, at a debounced rate).
* Motivation for features / changes * Continue developing DebuggerV2 plugin, specifically its GraphExecutionContainer that visualizes the details of the intra-graph execution events. * Technical description of changes * Add necessary actions, selectors, reducers and effects to support the lazy, paged loading of `GraphExecution`s * Add a `cdk-virtual-scroll-viewport` to `GraphExecutionComponent` * The lazy loading is triggered by scrolling events on the `cdk-virtual-scroll-viewport` * The displaying detailed debug-tensor summaries such as dtype, rank, shape, and numeric breakdown will be added in the follow PRs. This PR just adds displaying of the tensor name and op type in the `cdk-virtual-scroll-viewport`. * Screenshots of UI changes * Loaded state: 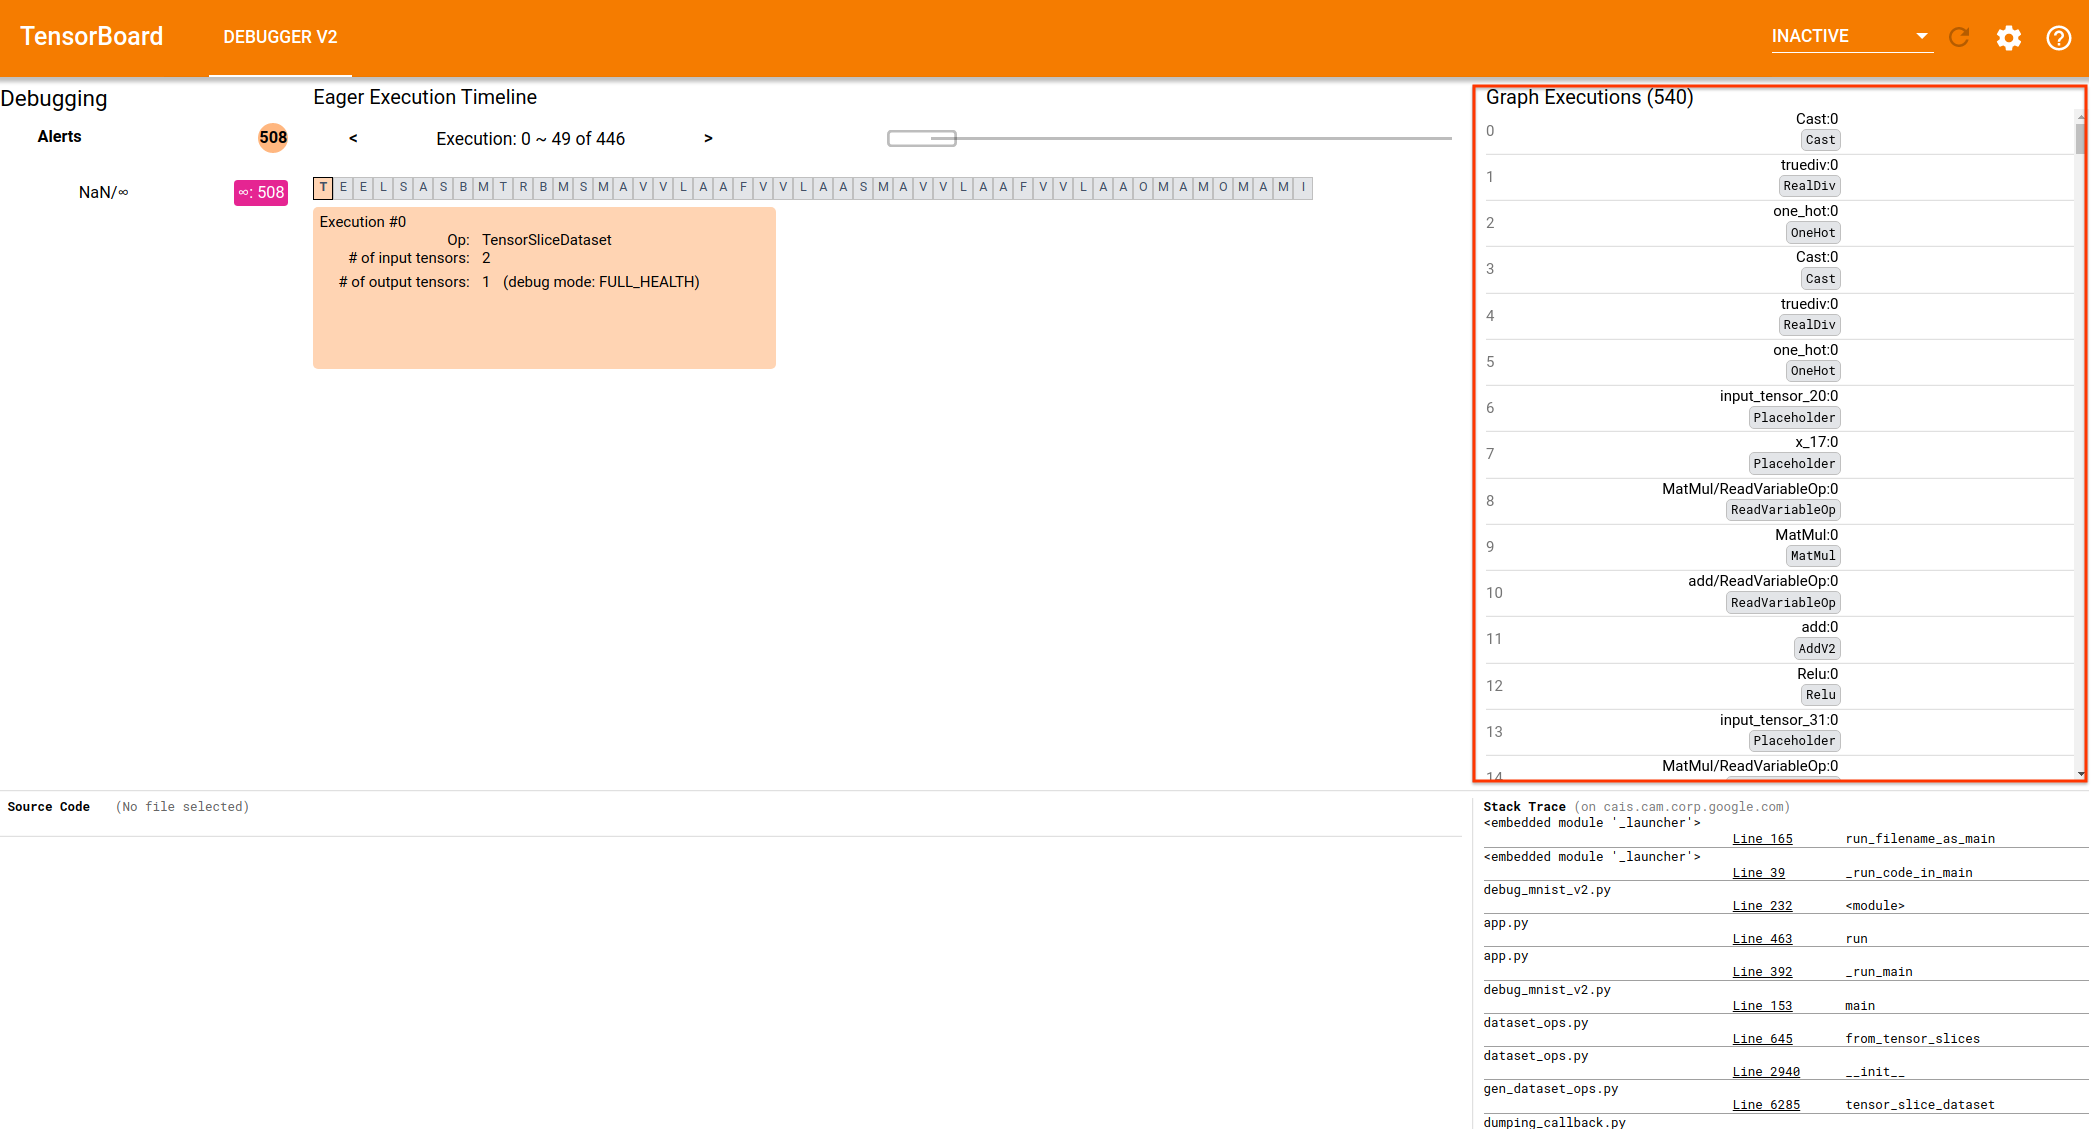 * Loading state (mat-spinner to be added in follow-up CLs): 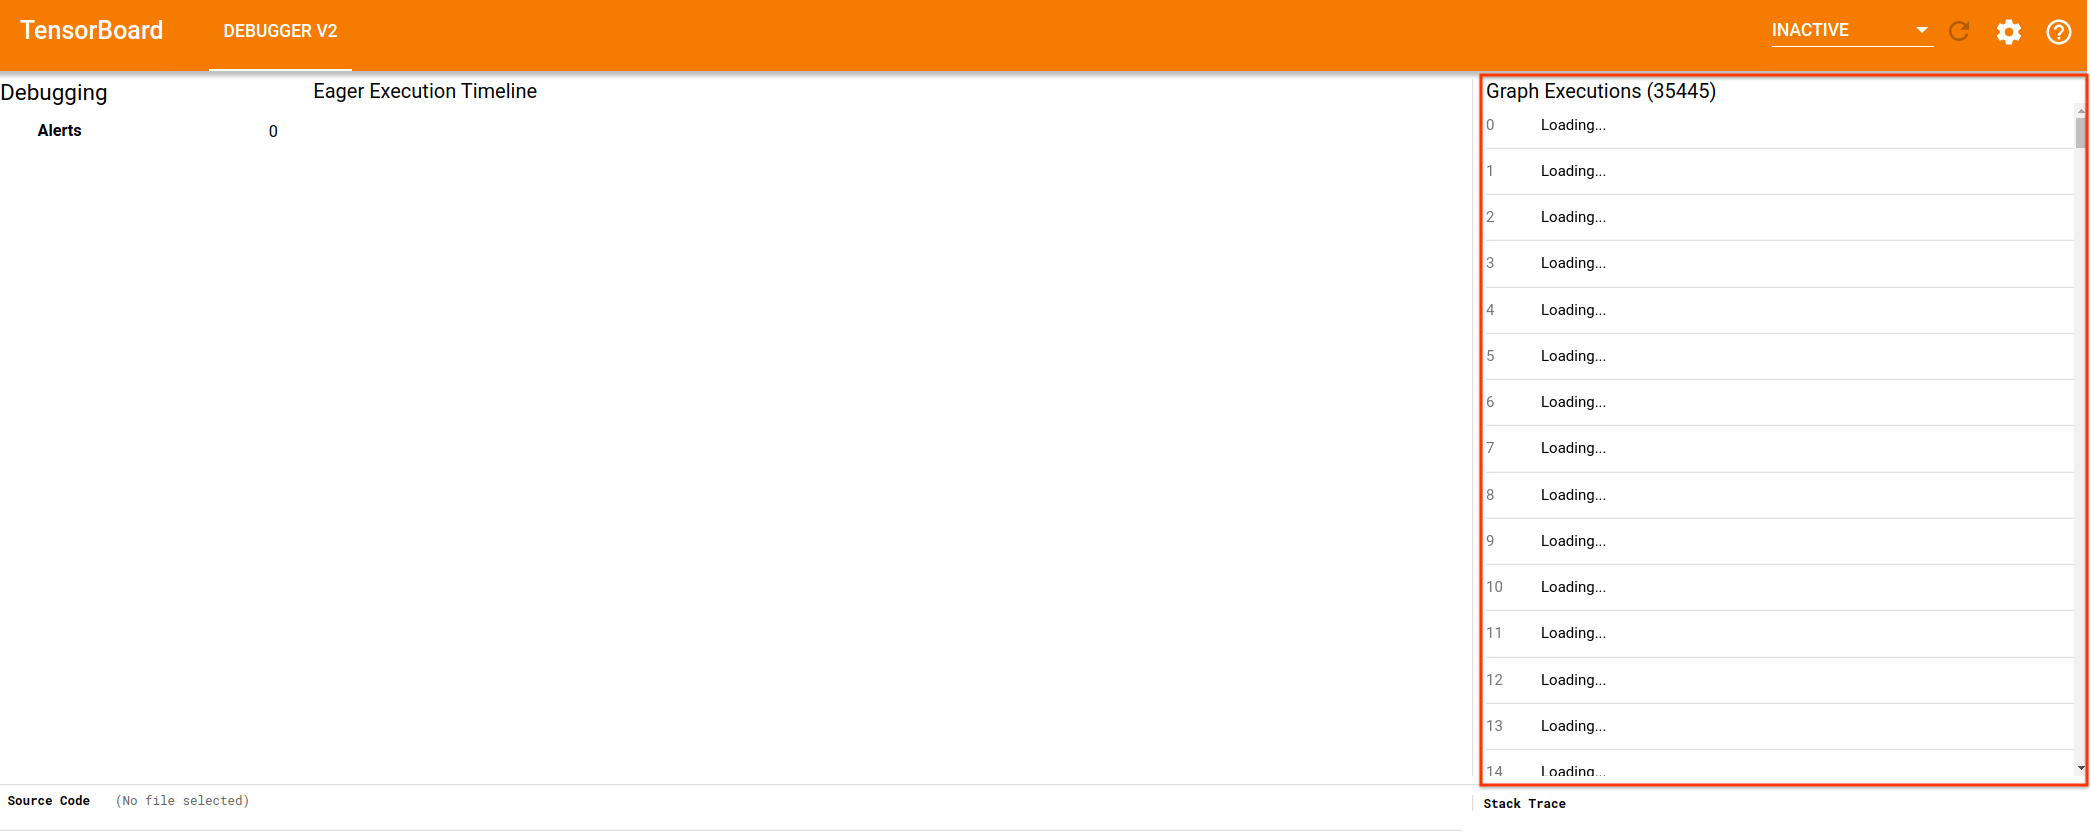 * Detailed steps to verify changes work correctly (as executed by you) * Unit tests added * Manual testing against logdirs with real tfdbg2 data of different sizes
* Motivation for features / changes * Continue developing DebuggerV2 plugin, specifically its GraphExecutionContainer that visualizes the details of the intra-graph execution events. * Technical description of changes * Add necessary actions, selectors, reducers and effects to support the lazy, paged loading of `GraphExecution`s * Add a `cdk-virtual-scroll-viewport` to `GraphExecutionComponent` * The lazy loading is triggered by scrolling events on the `cdk-virtual-scroll-viewport` * The displaying detailed debug-tensor summaries such as dtype, rank, shape, and numeric breakdown will be added in the follow PRs. This PR just adds displaying of the tensor name and op type in the `cdk-virtual-scroll-viewport`. * Screenshots of UI changes * Loaded state:  * Loading state (mat-spinner to be added in follow-up CLs):  * Detailed steps to verify changes work correctly (as executed by you) * Unit tests added * Manual testing against logdirs with real tfdbg2 data of different sizes
GraphExecutionscdk-virtual-scroll-viewporttoGraphExecutionComponentcdk-virtual-scroll-viewportcdk-virtual-scroll-viewport.