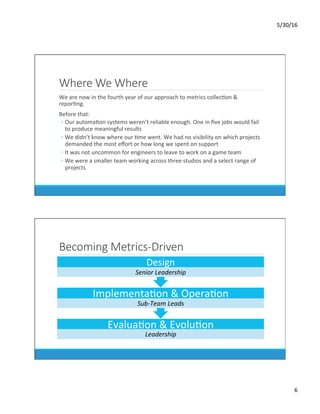
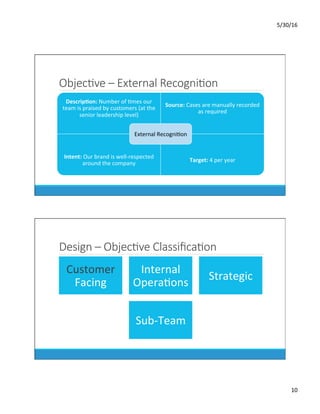
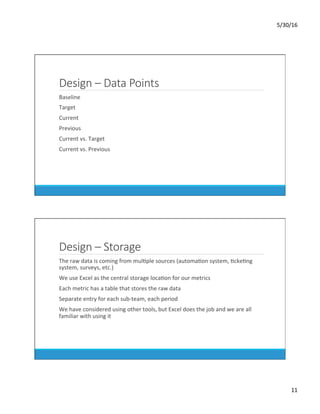
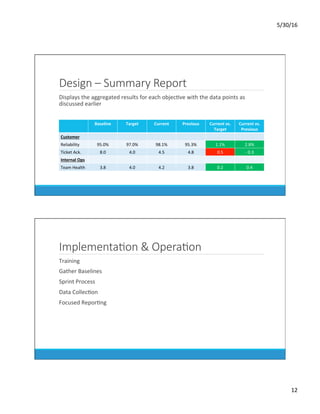
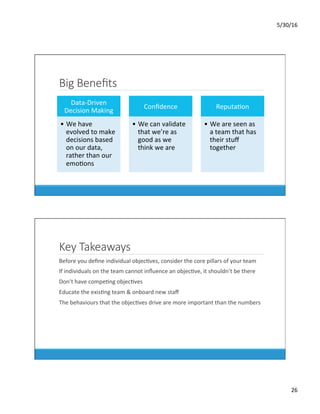
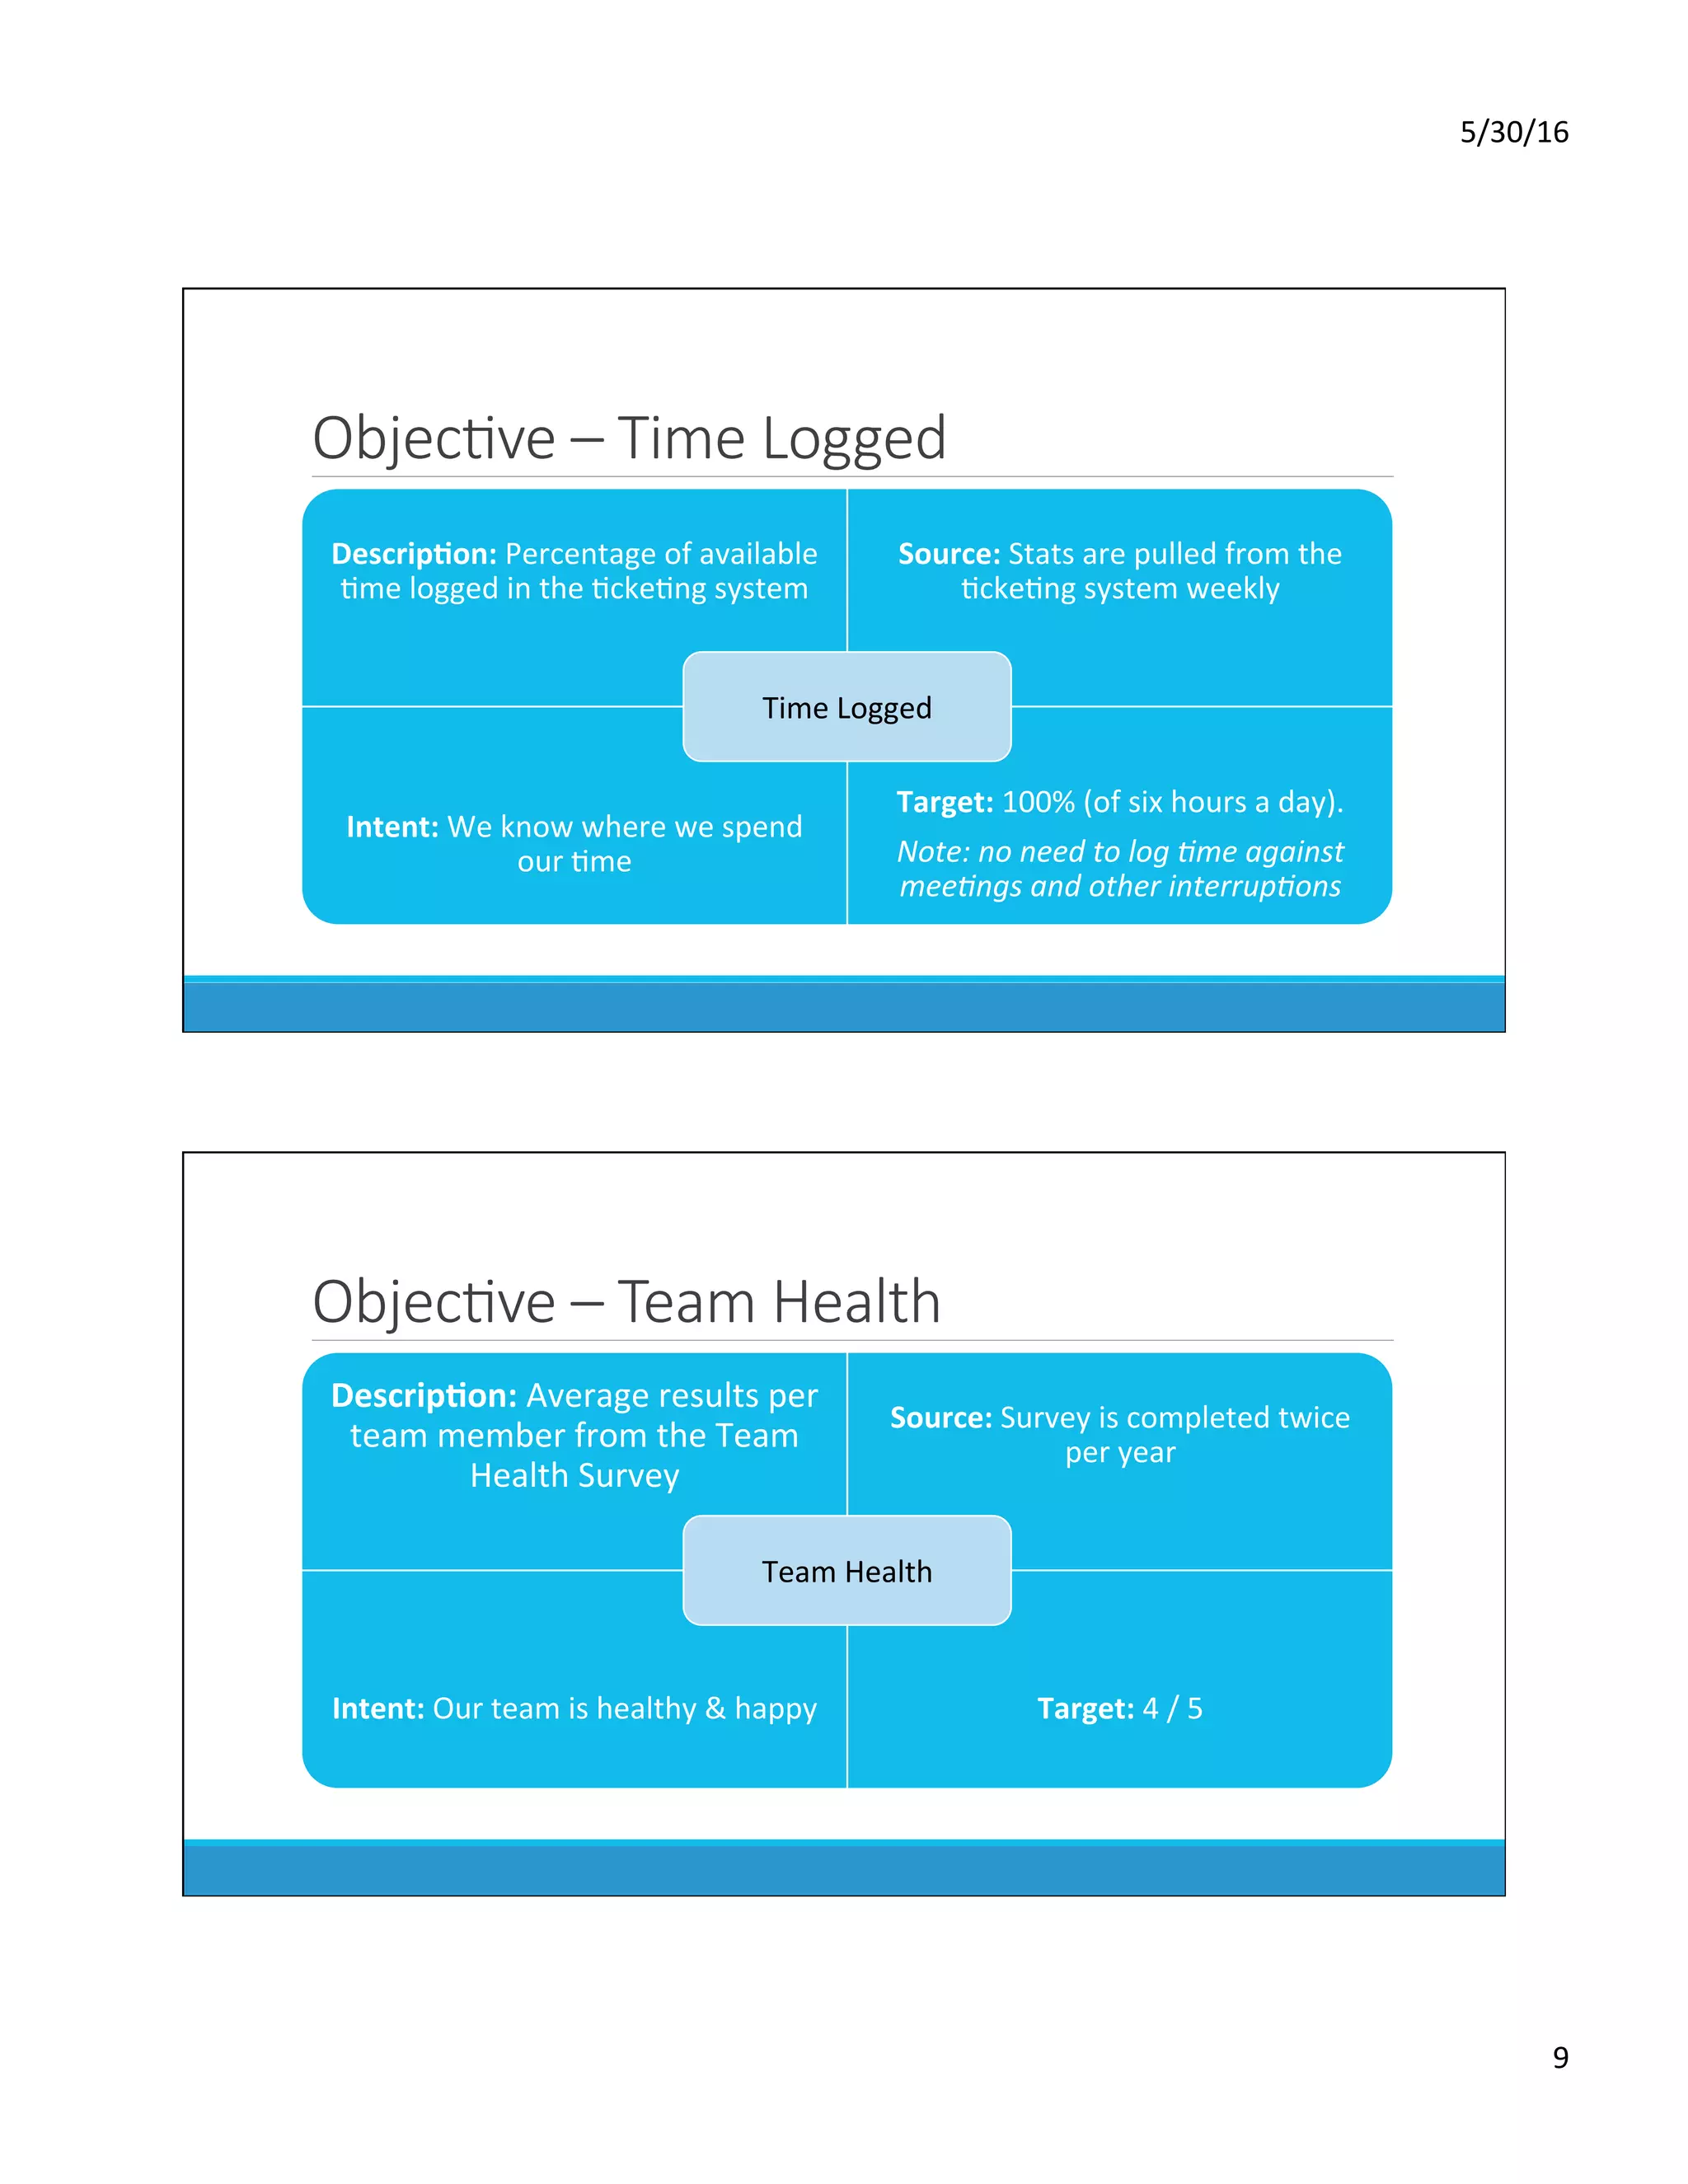
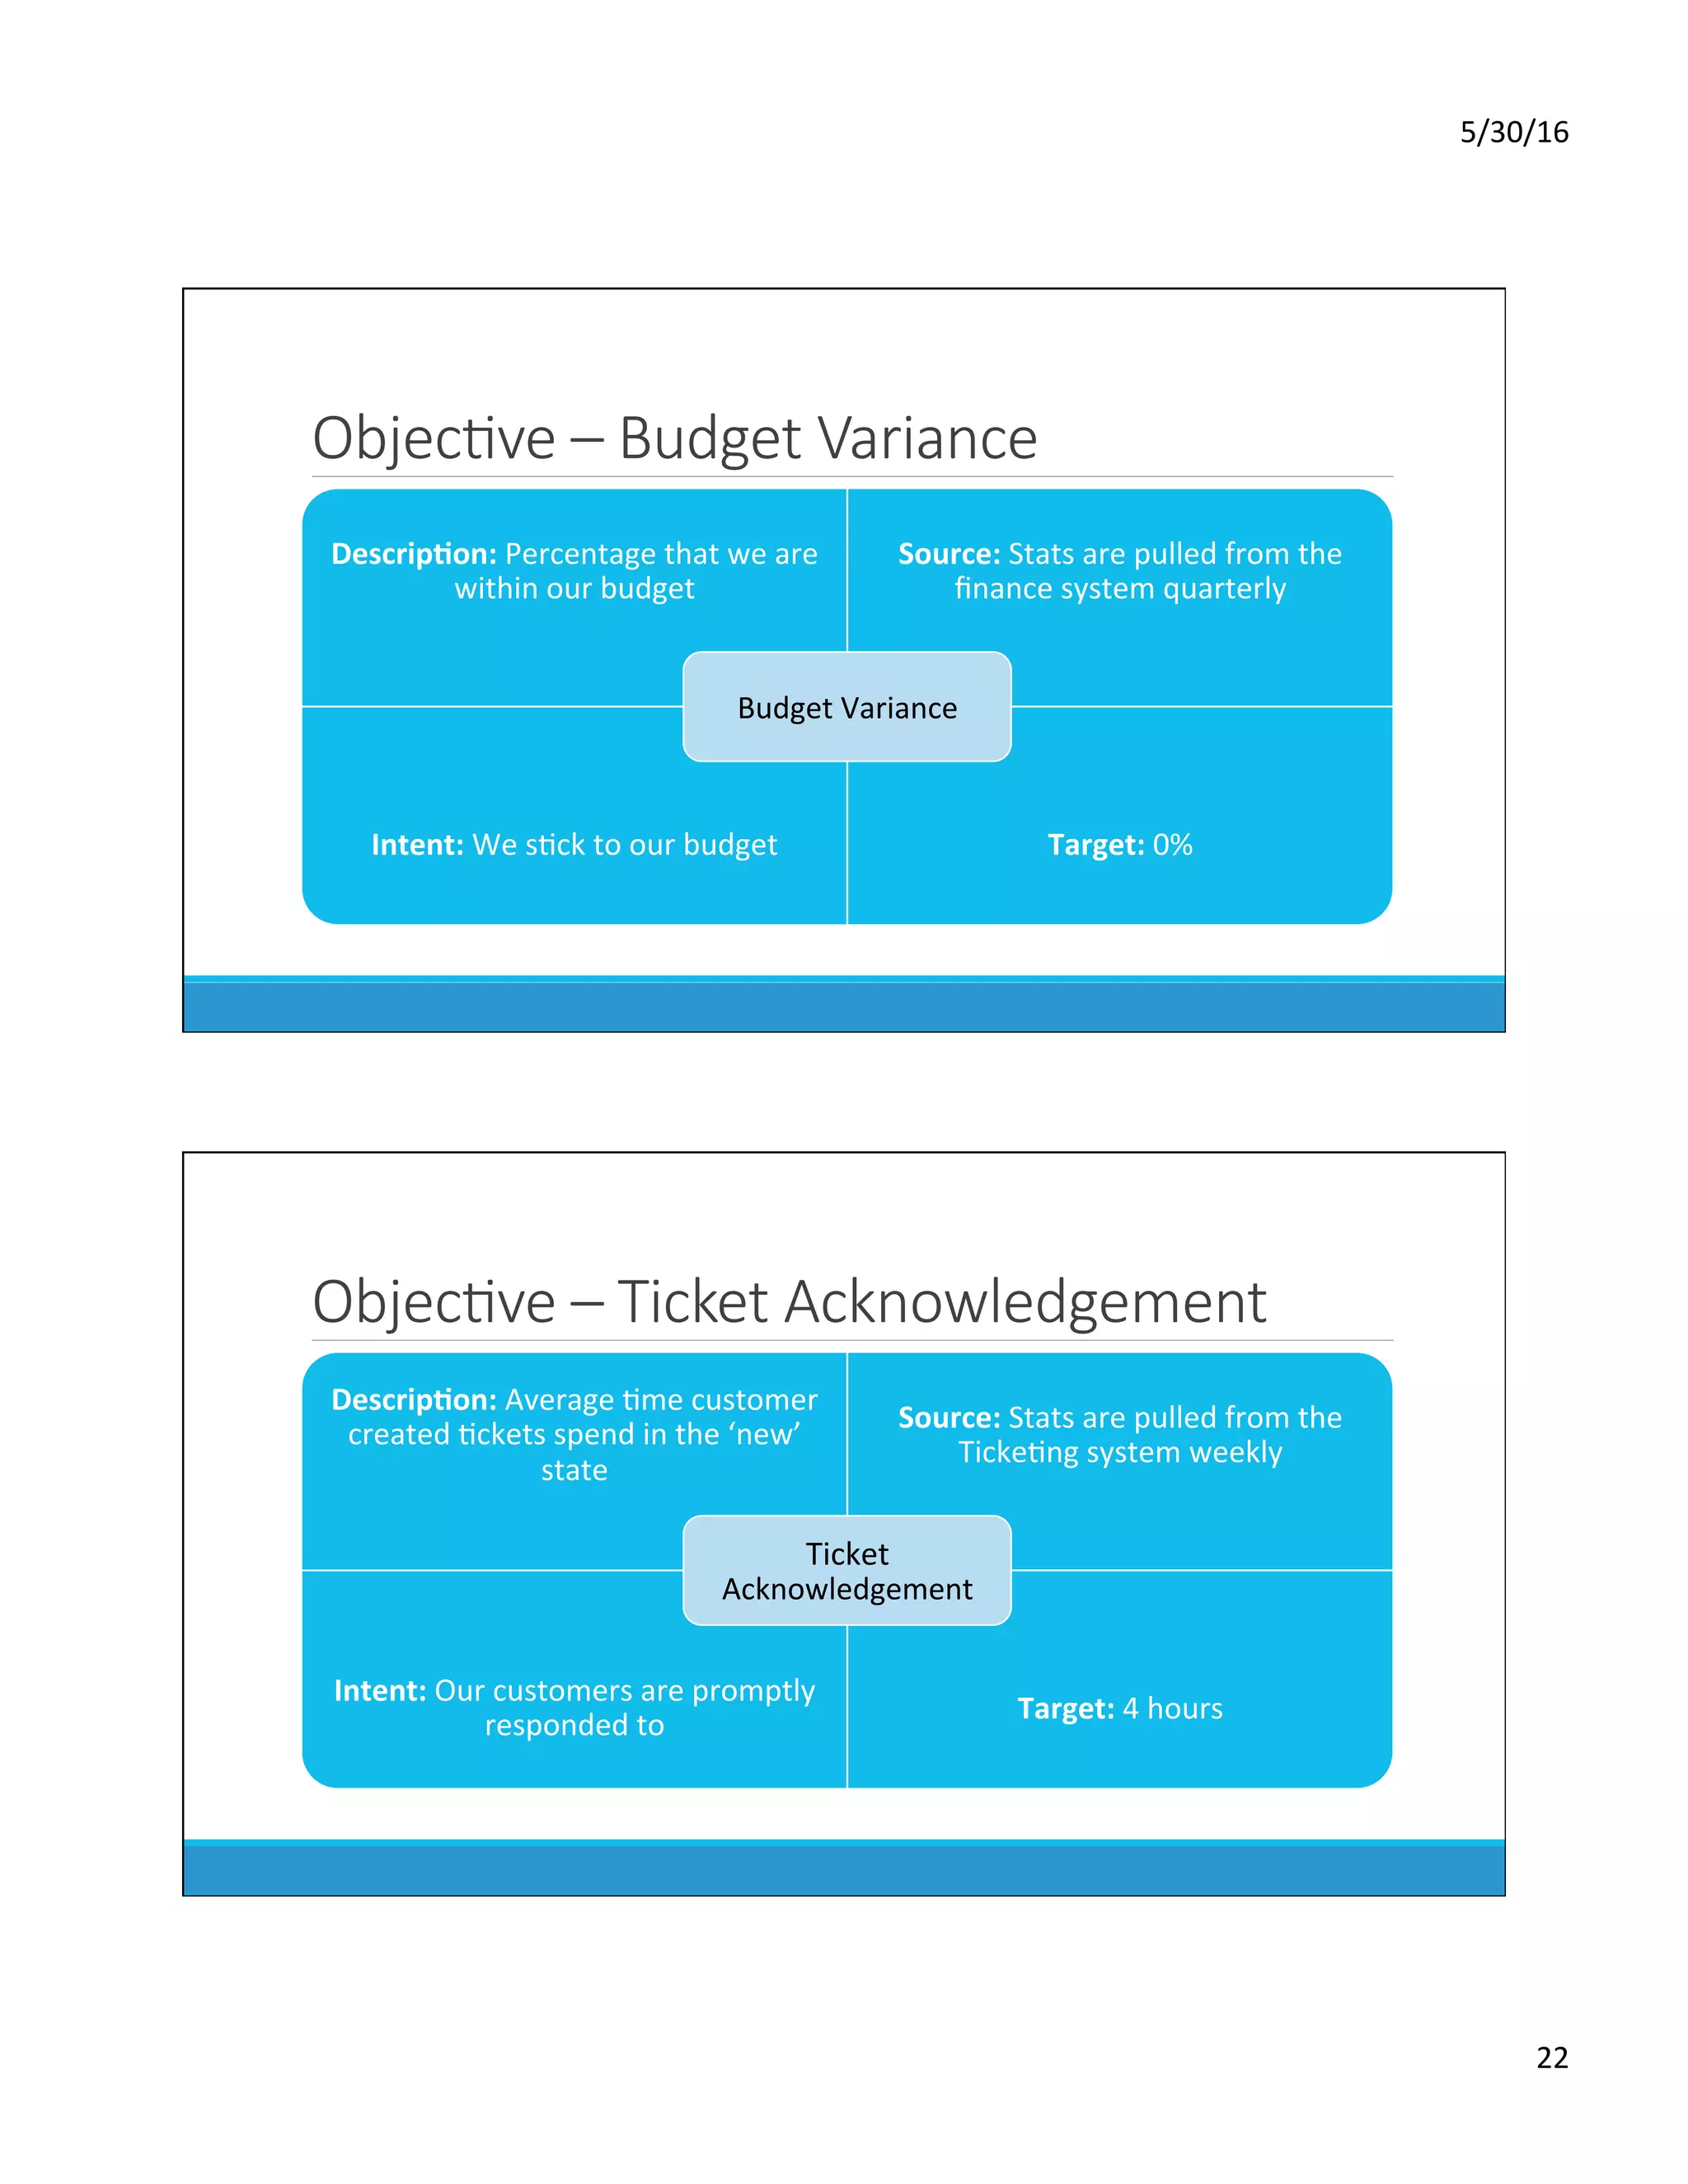
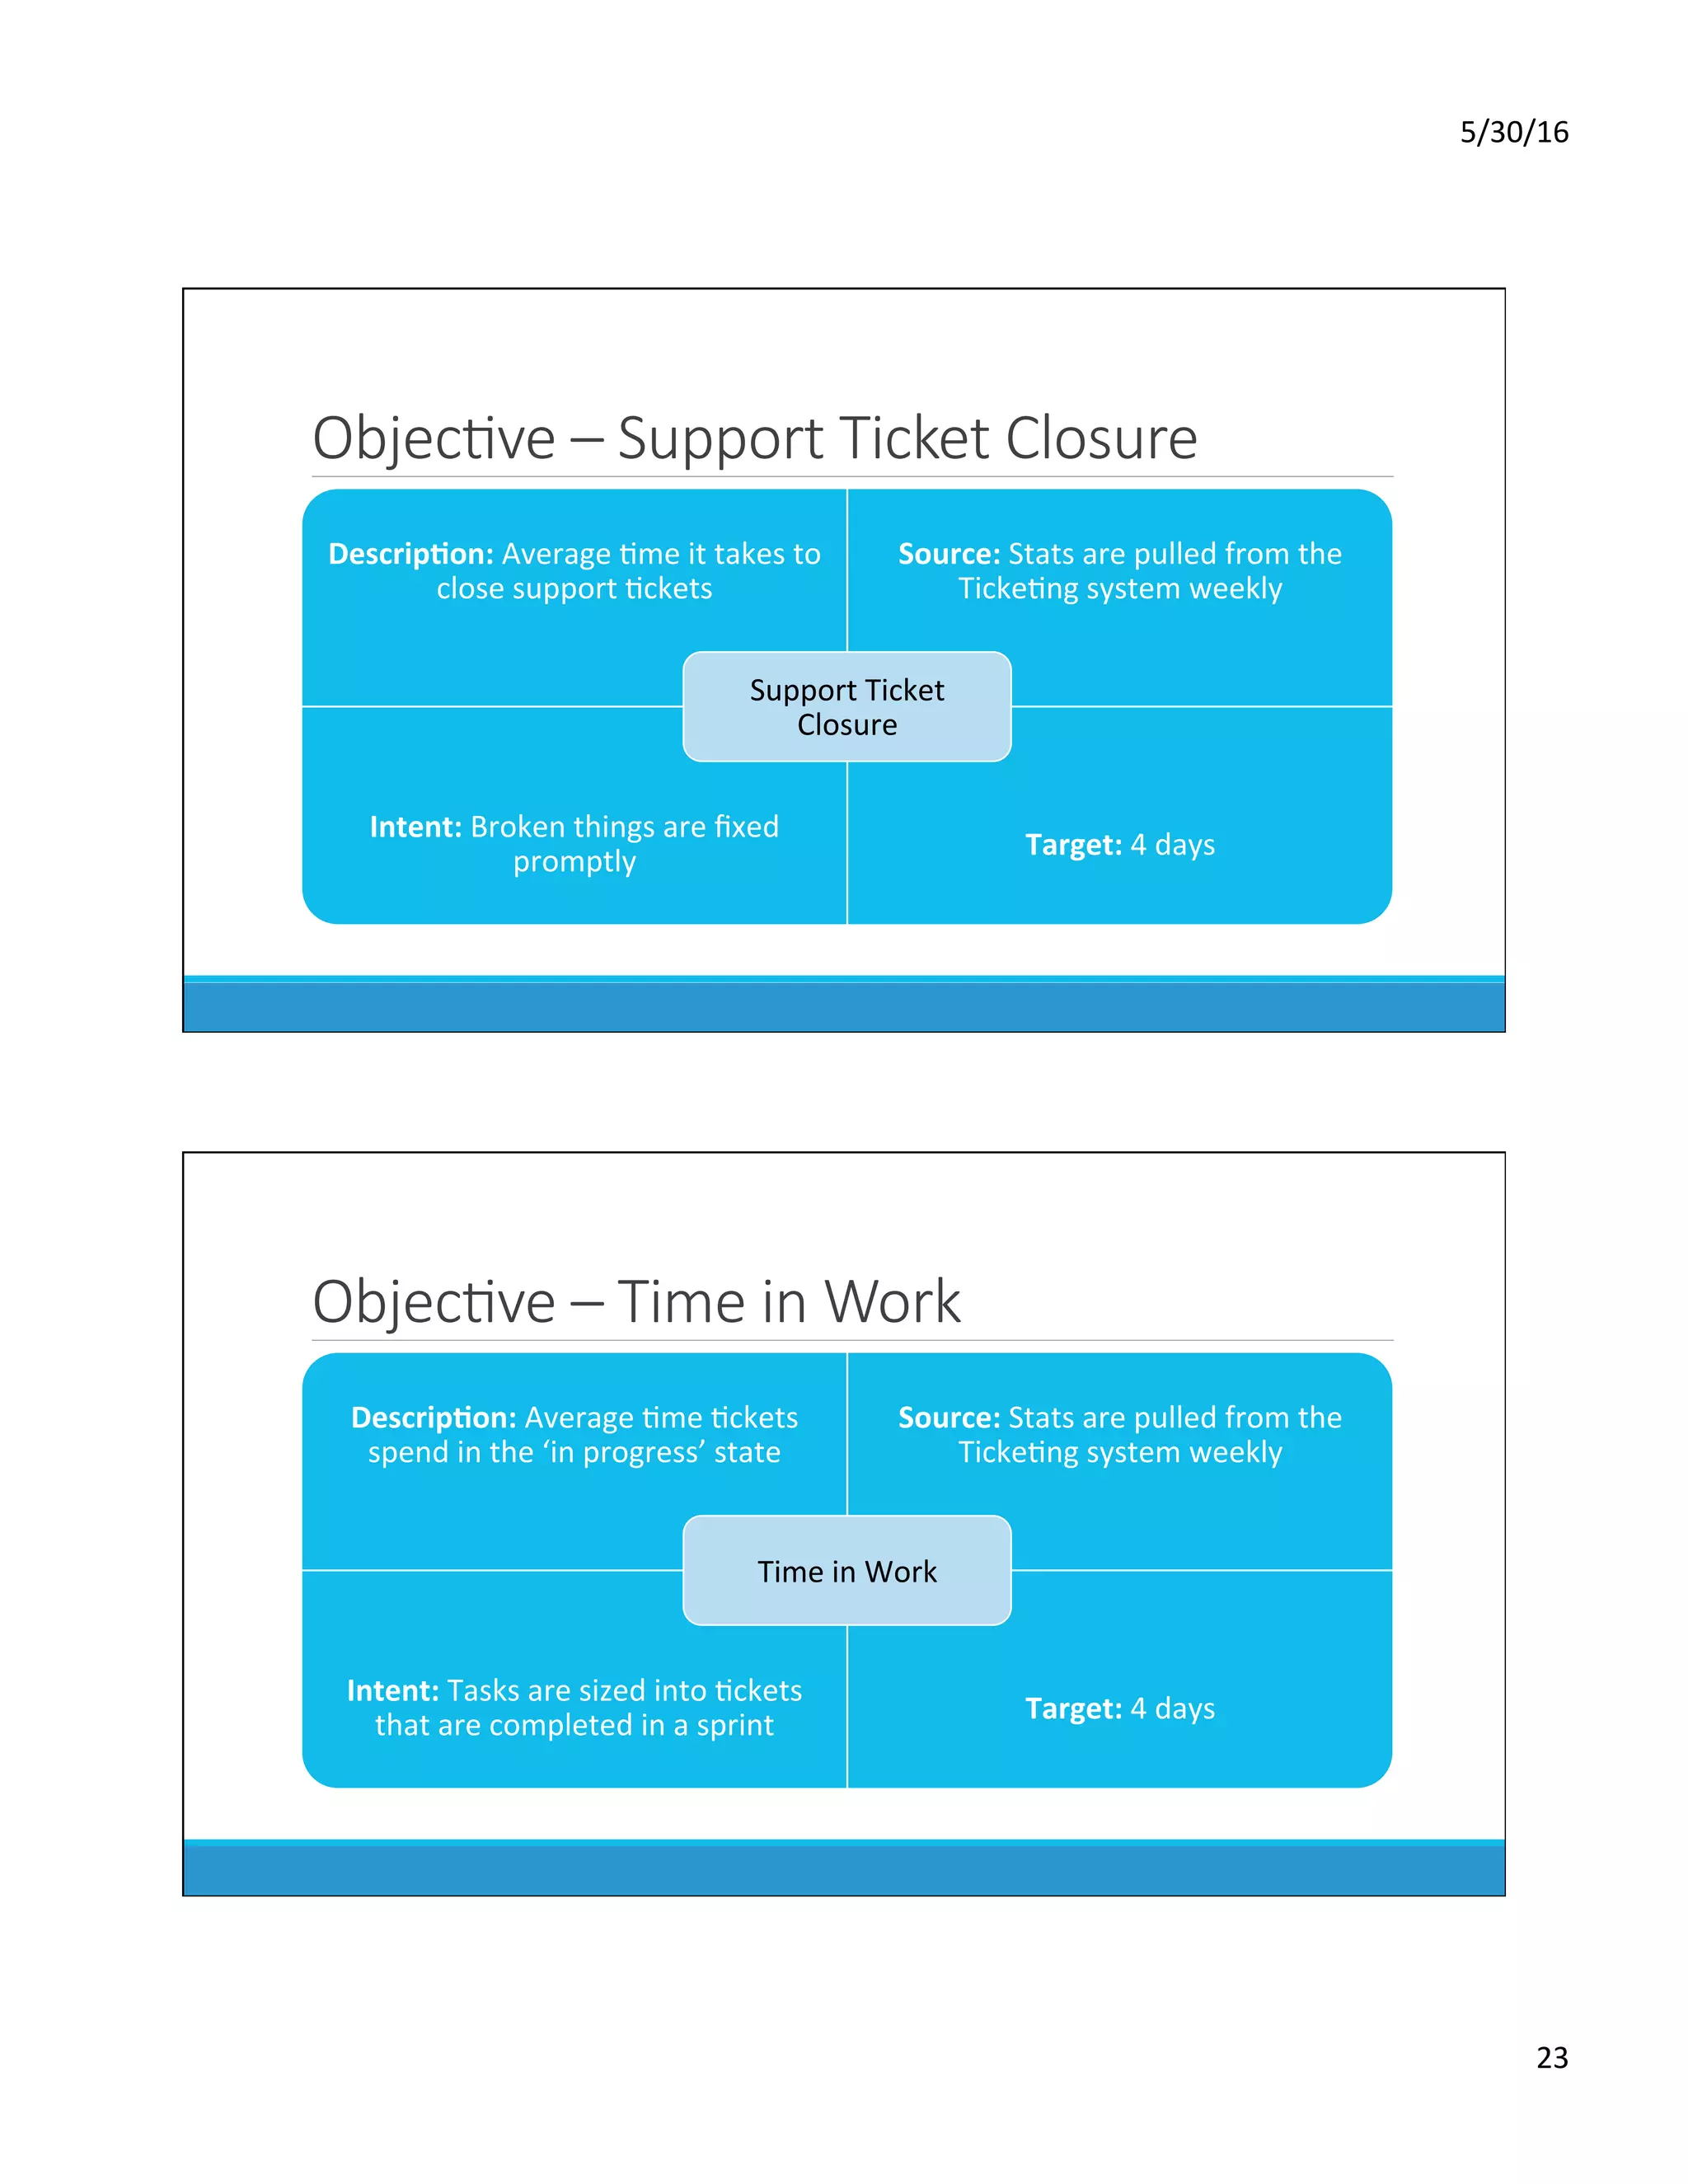
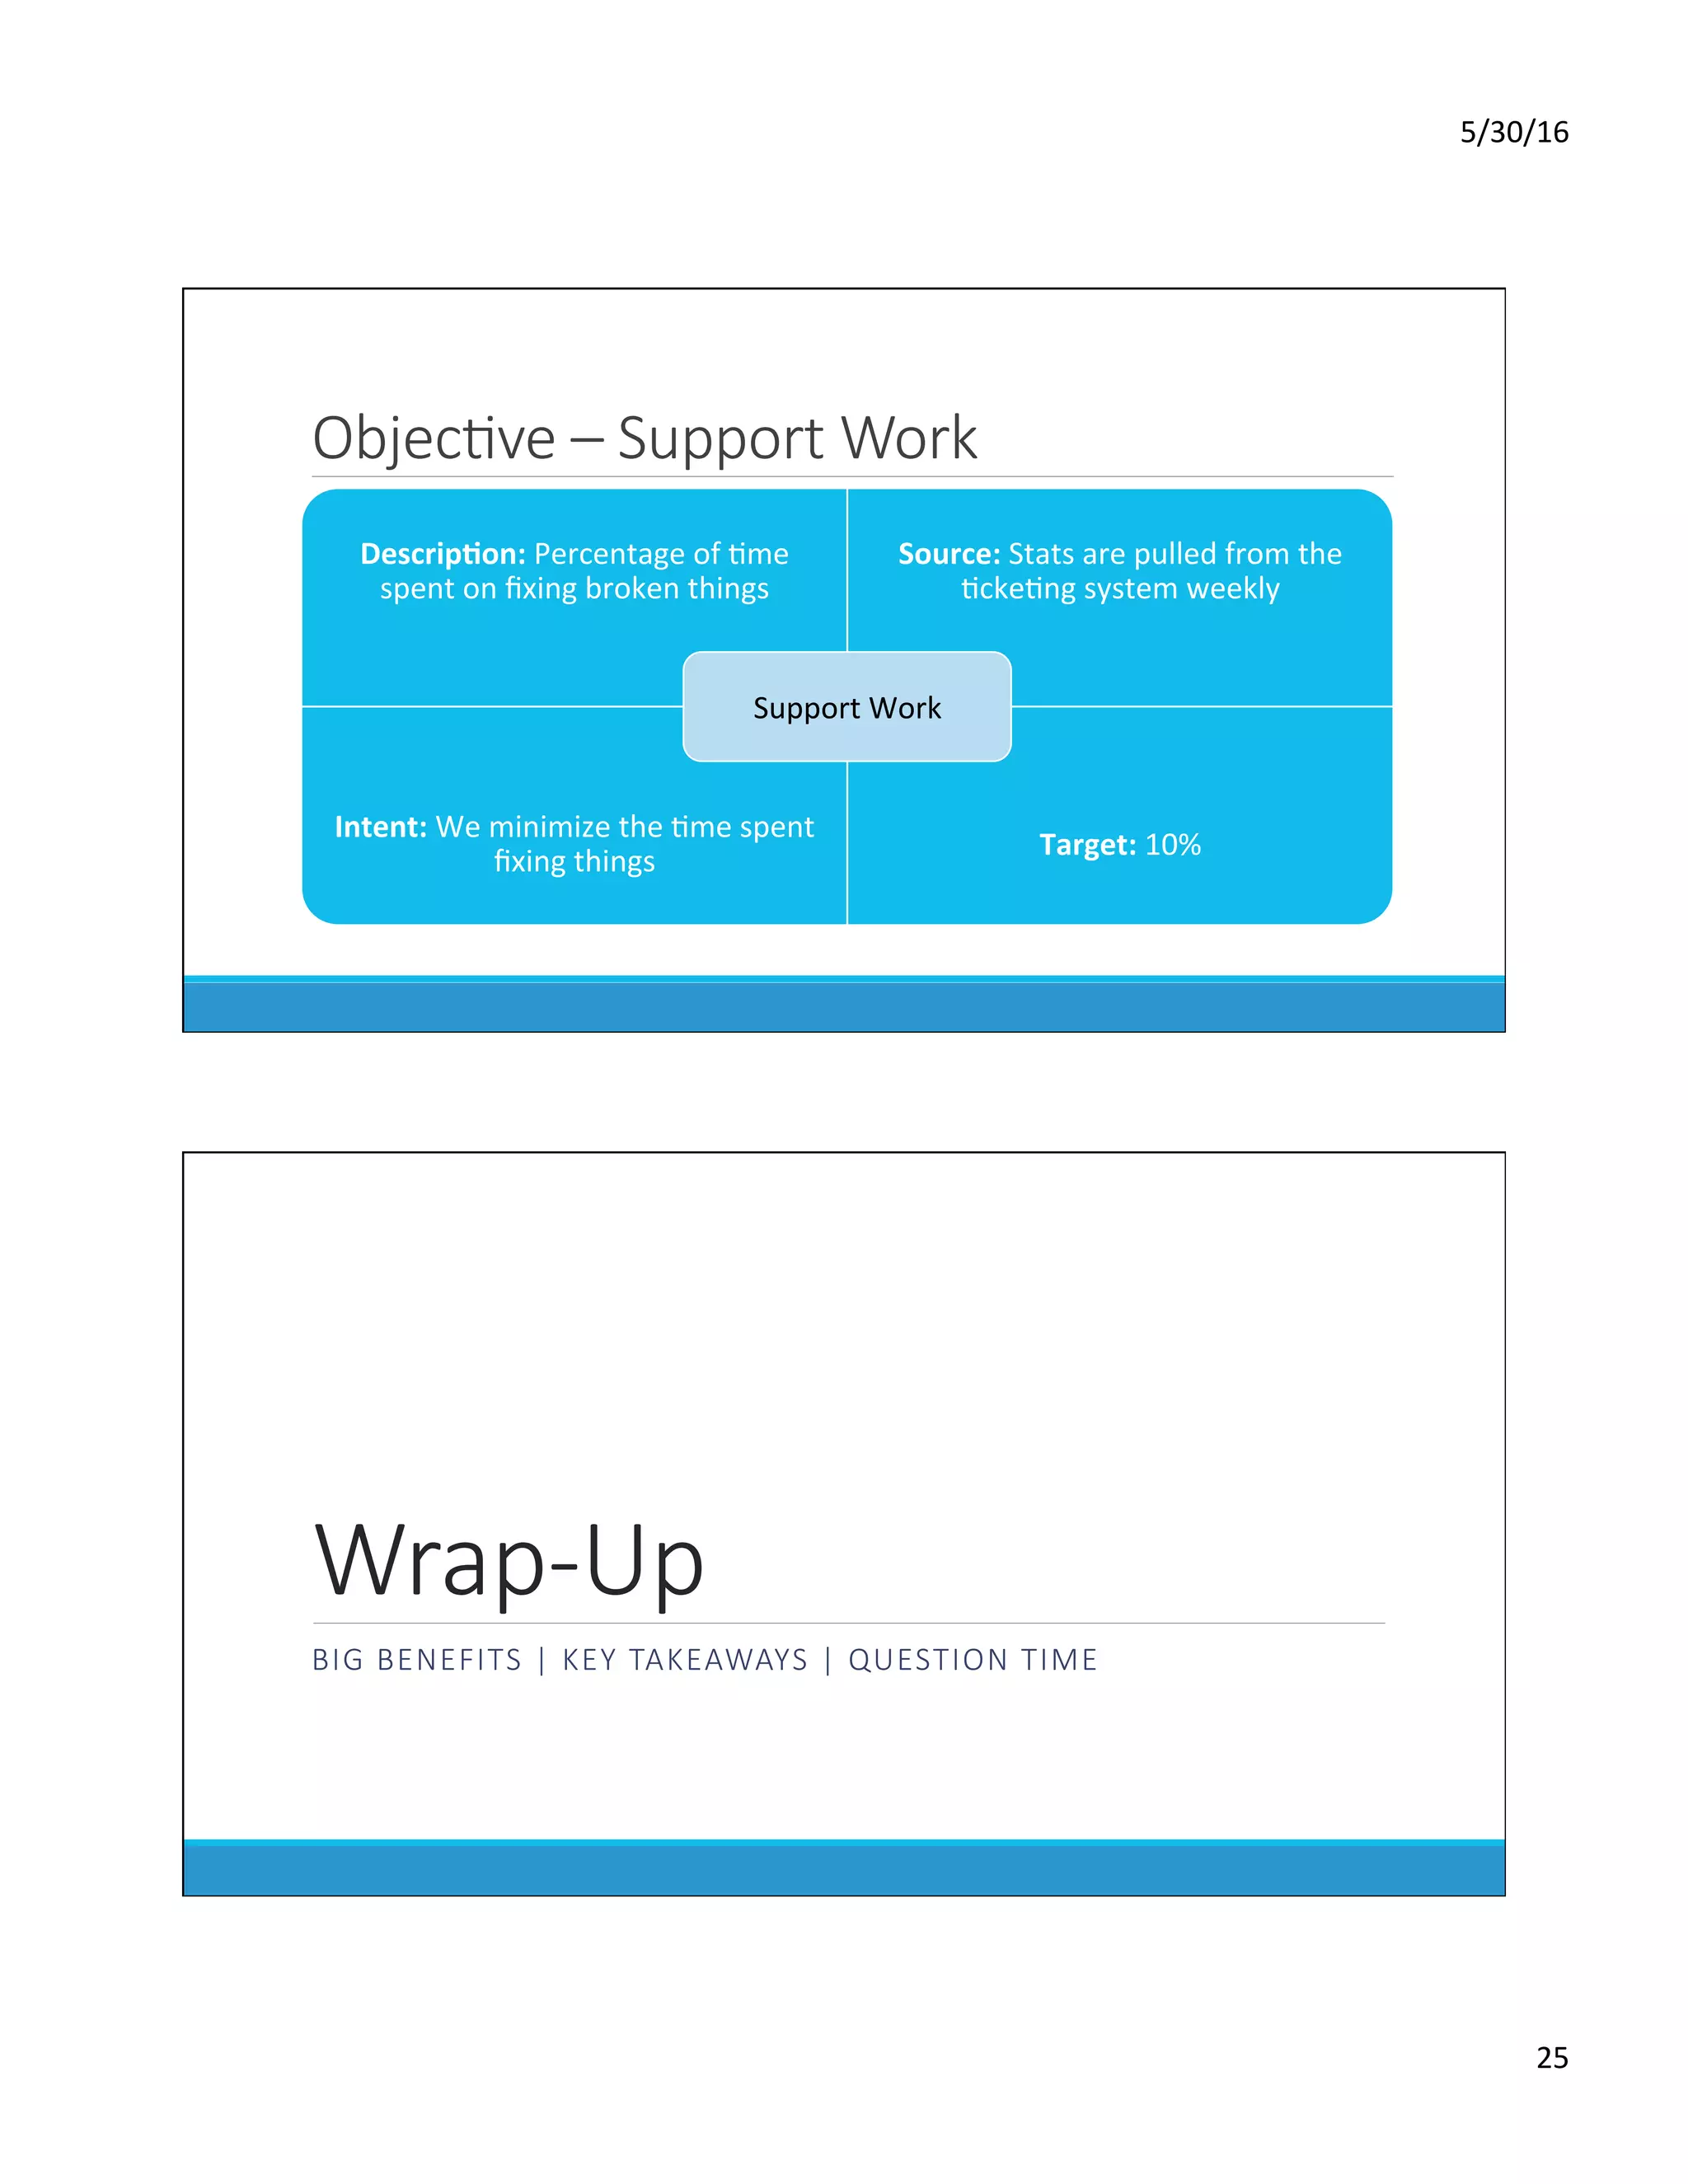
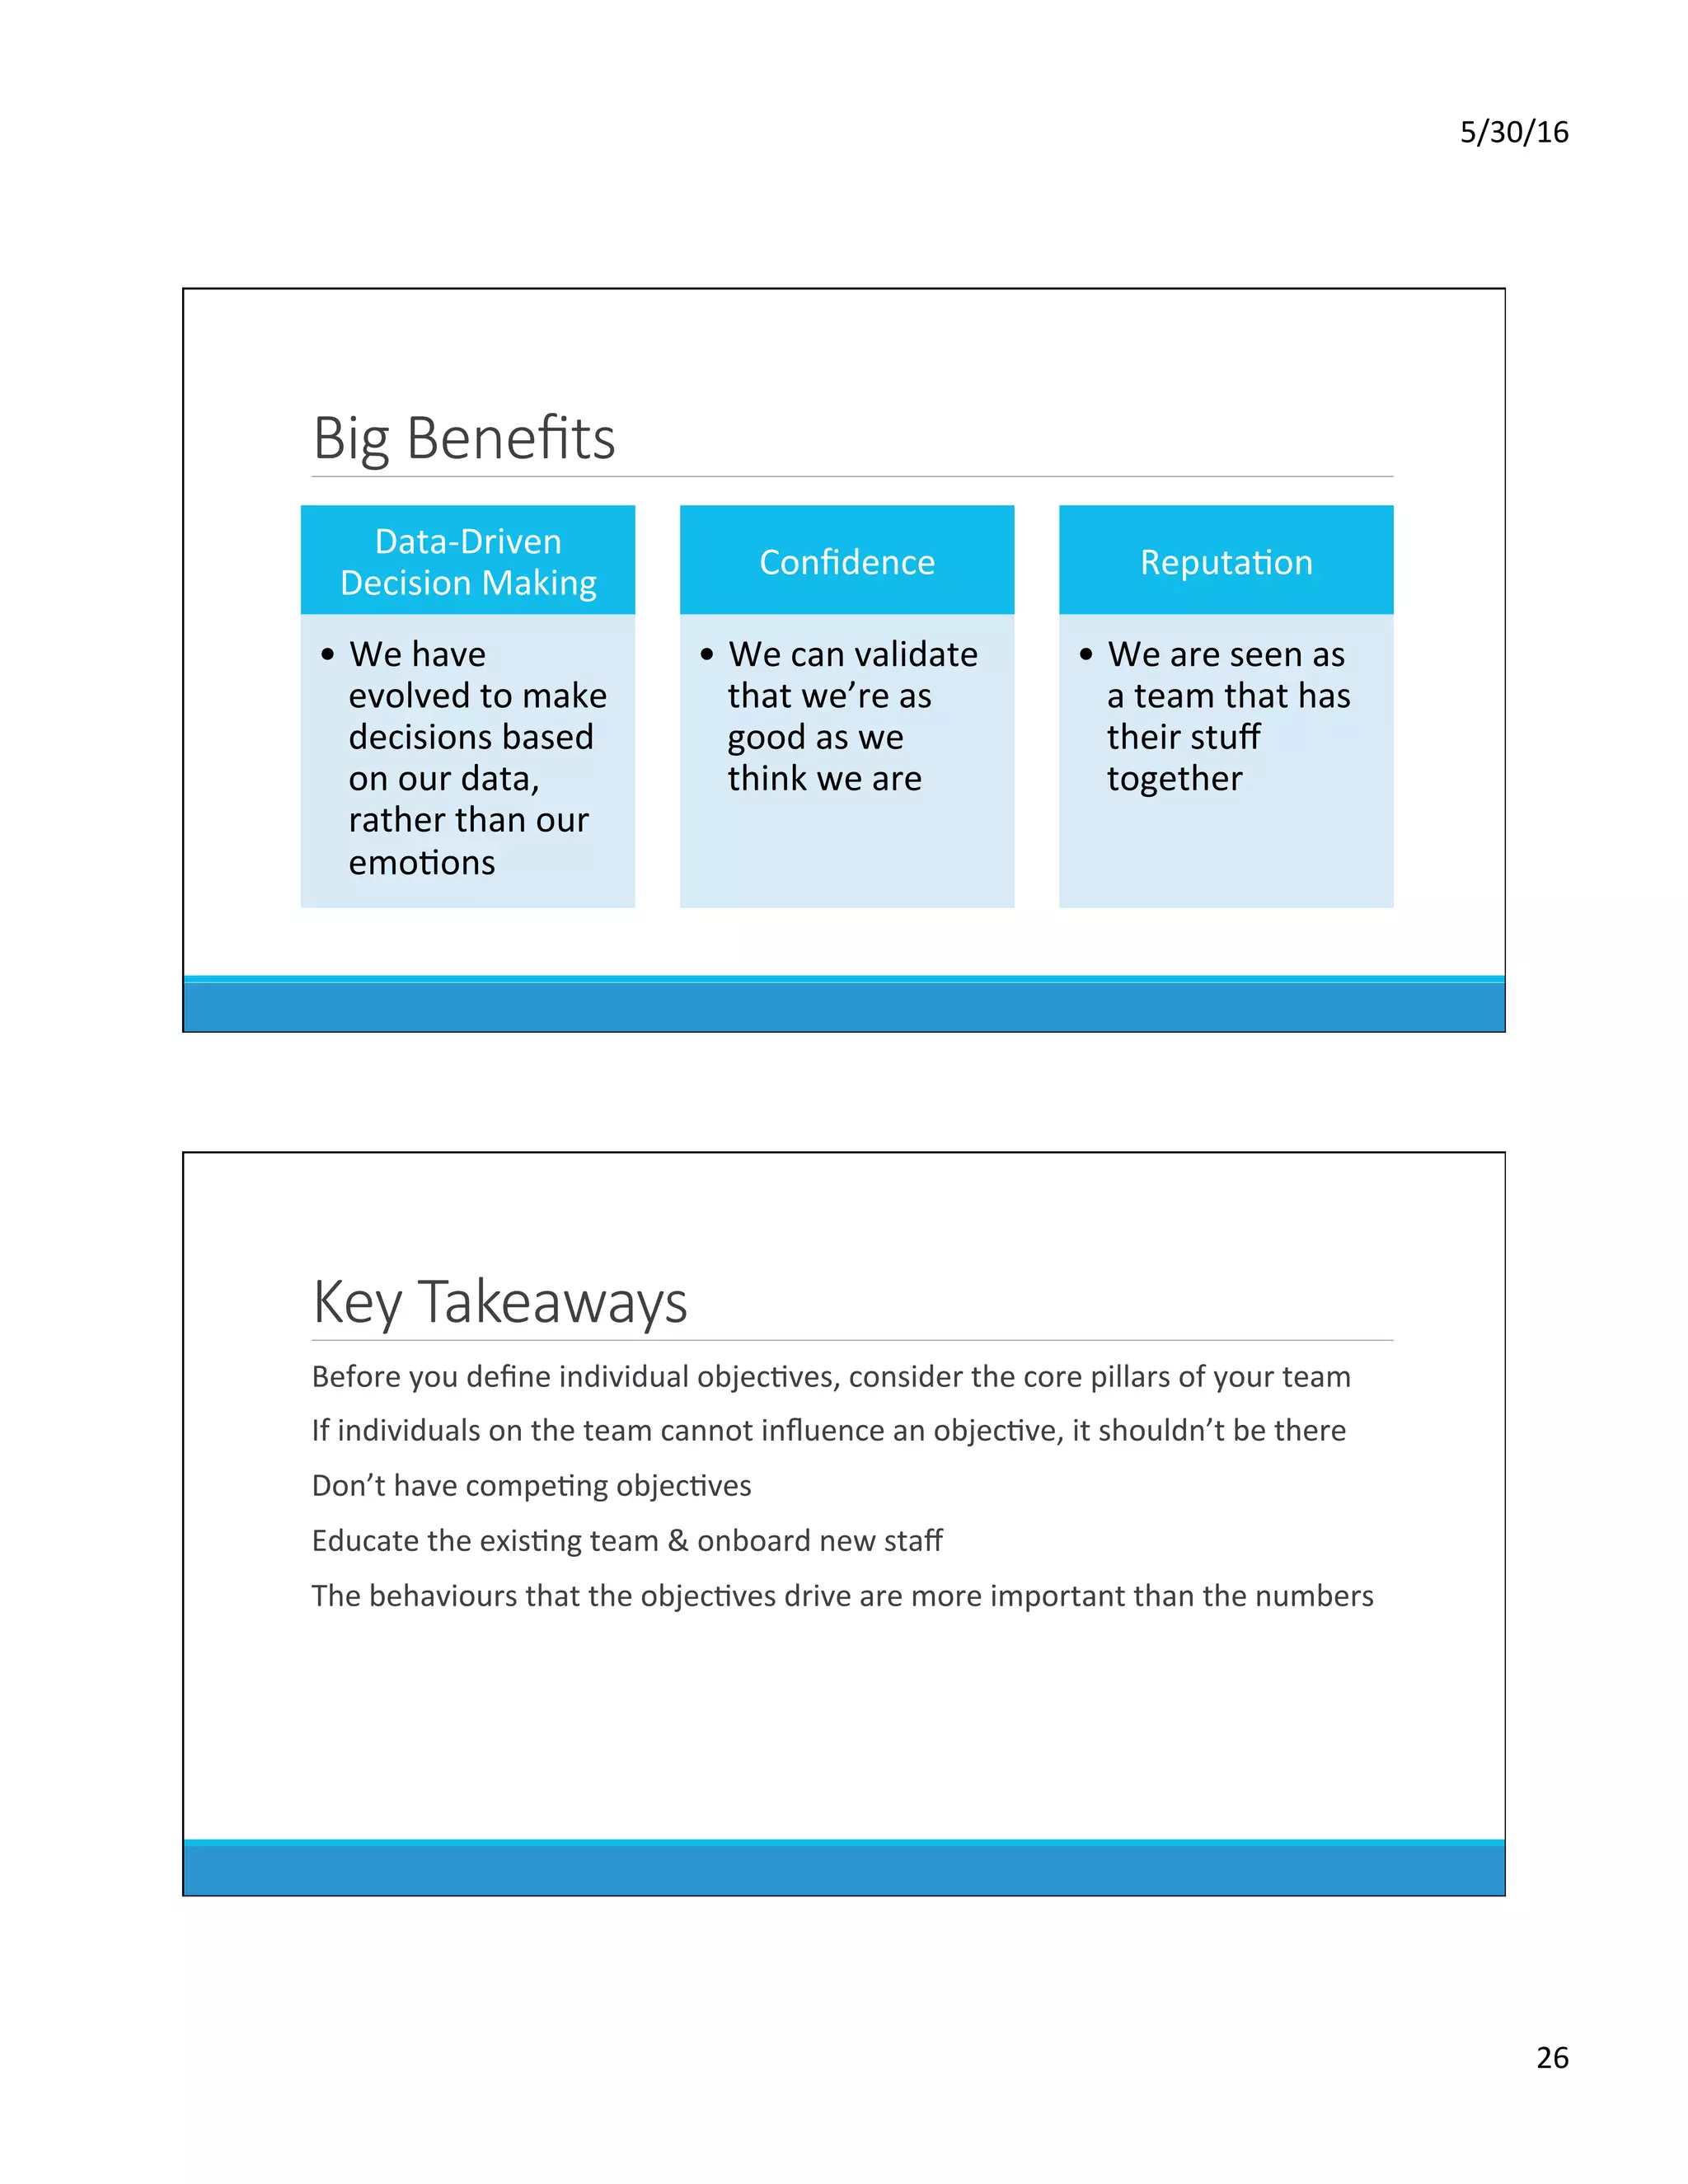
KEMBAR78
A Case Study in Metrics-Driven DevOps | PDF
DT2	
Session	
6/9/16	11:30	AM	


A	Case	Study	in	Metrics-Driven	DevOps			
	
Presented	by:	
	
Ben	Vining	
Electronic	Arts	
	
	
Brought	to	you	by:		


350	Corporate	Way,	Suite	400,	Orange	Park,	FL	32073		
888---268---8770	··	904---278---0524	-	info@techwell.com	-	http://www.techwell.com/
Ben	Vining	
Electronic	Arts	
	
Ben	Vining	is	a	development	manager	of	a	DevOps	team	at	Vancouver-based	
Electronic	Arts.	Ben	has	worked	on	games	for	EA	franchises	such	as	FIFA,	NHL,	
UFC,	and	Plants	vs.	Zombies.	In	a	previous	life,	he	was	a	business	systems	analyst	
with	JELD-WEN	Windows	&	Doors	in	Australia,	helping	to	develop,	implement,	
and	maintain	their	in-house	ERP	system.	Ben	believes	in	working	smart,	taking	
time	to	celebrate	wins,	and	learning	from	mistakes.	This	is	Ben's	first	time	
presenting	at	a	conference,	so	please	go	easy	on	him.	You	can	find	him	on	
LinkedIn.
5/30/16	
1	
A Case Study in Metrics-
Driven DevOps
BEN VINING | ELECTRONIC ARTS
DEVOPS WEST | JUNE 2016

Overview
WHY	YOU’RE	HERE	
	 You’re	interested	in	using	
metrics	to	improve	your	
team’s:	
◦ Performance	
◦ ReputaDon	
◦ Happiness	
WHAT	TO	EXPECT	
	 IntroducDon	
	 The	Case	Study	
	 Example	ObjecDves	
	 Big	Benefits	&	Key	
Takeaways	
	 QuesDon	Time	(at	the	end)
5/30/16	
2	
IntroducKon
BEN VINING | ELECTRONIC ARTS
IntroducKon – Ben Vining
3	years	
B.	Science	in	
InformaDon	
Systems	
University	of	
New	South	
Wales	
Sydney,	AU	
8	years	
Business	
Systems	
Analyst	
JELD-WEN	
Windows	&	
Doors	
Gold	Coast,	AU	
3	years	
Development	
Manager	
	
Electronic	Arts	
	
Vancouver,	CA
5/30/16	
3	
IntroducKon – Electronic Arts (EA)
	 Electronic	Arts	Inc.	is	a	leading	global	interacDve	entertainment	soeware	
company.	EA	delivers	games,	content	and	online	services	for	Internet-connected	
consoles,	personal	computers,	mobile	phones	and	tablets.	
The Case Study
THE TEAM | WHERE WE WERE | BECOMING METRICS-DRIVEN |
WHERE WE ARE NOW
5/30/16	
4	
Development & Release Engineering
(DRE)
	 We	provide	build	&	test	automaDon	
services	to	our	customers.	
	 Our	customers	are	game,	content,	and	
engine	teams	at	EA.	
	 70	staff	in	6	locaDons	around	the	
globe.	
	 Our	vision:	EA	developers	can	work	to	
their	fullest	potenDal,	because	our	
systems	take	care	of	everything	else.	
	 Our	mission:	make	life	simpler	for	
developers.	
Overall Team Structure
Sub-Team	Leads	
Leadership	
Senior	Leadership	 Group	
DD	&	TD	
DDs	&	
TDs	
Canada	 USA	 Europe	 Engine	 Infra.
5/30/16	
5	
Sub-Team Structure
Projects	
Sub-Team	Leads	 Canada	
1	x	Large	
4	x	
Medium	
4	x	
Medium	
6	x	Small	
Project Structure
	 Each	customer	is	treated	as	a	unique	
project	
	 Many	team-members	are	assigned	to	
each	project	
	 Each	team-member	is	assigned	to	
many	projects	
	 Frequency	of	interacDons	(meeDngs,	
reports,	communicaDons,	etc.)	is	
dependant	on	size	and	culture	of	the	
customer	team	
Point	of	Contact	
Leads	
AddiDonal	SEs
5/30/16	
6	
Where We Where
	 We	are	now	in	the	fourth	year	of	our	approach	to	metrics	collecDon	&	
reporDng.	
	 Before	that:	
◦ Our	automaDon	systems	weren’t	reliable	enough.	One	in	five	jobs	would	fail	
to	produce	meaningful	results	
◦ We	didn’t	know	where	our	Dme	went.	We	had	no	visibility	on	which	projects	
demanded	the	most	effort	or	how	long	we	spent	on	support	
◦ It	was	not	uncommon	for	engineers	to	leave	to	work	on	a	game	team	
◦ We	were	a	smaller	team	working	across	three	studios	and	a	select	range	of	
projects	
Becoming Metrics-Driven
EvaluaDon	&	EvoluDon	
Leadership	
ImplementaDon	&	OperaDon	
Sub-Team	Leads	
Design	
Senior	Leadership
5/30/16	
7	
Design
	 Core	Pillars	
	 ObjecDves	DefiniDons	
	 ClassificaDon	
	 Data	Points	
	 Storage	
	 Summary	Report	
Design – Core Pillars
Healthy	 Reliable	 Efficient	 Responsible	
Predictable	 Responsive	 InnovaDve	 Respected
5/30/16	
8	
Design – ObjecKve DefiniKons
DescripDon	 Source	
Intent	 Target	
Name	
ObjecKve – AutomaKon Reliability
Descrip0on:	Percentage	of	
automaDon	runs	that	are	successful	
Source:	Stats	are	pulled	from	the	
automaDon	system	weekly	
Intent:	Our	automaDon	system	is	
closely	monitored	and	maintained	
Target:	97%	
Note:	failures	due	to	the	game	code	
count	as	a	success	to	us	
AutomaDon	
Reliability
5/30/16	
9	
ObjecKve – Time Logged
Descrip0on:	Percentage	of	available	
Dme	logged	in	the	DckeDng	system	
Source:	Stats	are	pulled	from	the	
DckeDng	system	weekly	
Intent:	We	know	where	we	spend	
our	Dme	
Target:	100%	(of	six	hours	a	day).	
Note:	no	need	to	log	:me	against	
mee:ngs	and	other	interrup:ons	
Time	Logged	
ObjecKve – Team Health
Descrip0on:	Average	results	per	
team	member	from	the	Team	
Health	Survey	
Source:	Survey	is	completed	twice	
per	year	
Intent:	Our	team	is	healthy	&	happy	 Target:	4	/	5	
Team	Health
5/30/16	
10	
ObjecKve – External RecogniKon
Descrip0on:	Number	of	Dmes	our	
team	is	praised	by	customers	(at	the	
senior	leadership	level)	
Source:	Cases	are	manually	recorded	
as	required	
Intent:	Our	brand	is	well-respected	
around	the	company	
Target:	4	per	year	
External	RecogniDon	
Design – ObjecKve ClassificaKon
Customer	
Facing	
Internal	
OperaDons	
Strategic	
Sub-Team
5/30/16	
11	
Design – Data Points
	 Baseline	
	 Target	
	 Current	
	 Previous	
	 Current	vs.	Target	
	 Current	vs.	Previous	
Design – Storage
	 The	raw	data	is	coming	from	mulDple	sources	(automaDon	system,	DckeDng	
system,	surveys,	etc.)	
	 We	use	Excel	as	the	central	storage	locaDon	for	our	metrics	
	 Each	metric	has	a	table	that	stores	the	raw	data	
	 Separate	entry	for	each	sub-team,	each	period	
	 We	have	considered	using	other	tools,	but	Excel	does	the	job	and	we	are	all	
familiar	with	using	it
5/30/16	
12	
Design – Summary Report
	 Displays	the	aggregated	results	for	each	objecDve	with	the	data	points	as	
discussed	earlier		
Baseline	 Target	 Current	 Previous	 Current	vs.	
Target	
Current	vs.	
Previous	
Customer	
Reliability	 95.0%	 97.0%	 98.1%	 95.3%	 1.1%	 2.8%	
Ticket	Ack.	 8.0	 4.0	 4.5	 4.8	 0.5	 -	0.3	
Internal	Ops	
Team	Health	 3.8	 4.0	 4.2	 3.8	 0.2	 0.4	
ImplementaKon & OperaKon
	 Training	
	 Gather	Baselines	
	 Sprint	Process	
	 Data	CollecDon	
	 Focused	ReporDng
5/30/16	
13	
ImplementaKon – Training
	 Get	everyone	on	the	team	on-board	
◦ Why	we	are	doing	this?	
◦ ExpectaDons	
◦ Workflow	changes	
◦ System	changes	
ImplementaKon – Gather Baselines
	 Before	we	started	regularly	recording	the	metrics,	we	first	gathered	the	
baselines	to	understand	where	we	are	now	
	 Determining	the	baseline	was	tricky	for	certain	metrics:	
◦ Inaccurate	tracking	
◦ No	tracking	at	all	
◦ No	focus	on	it	
◦ Data	is	there,	but	collecDng	it	is	inefficient	
	 SDll,	having	these	baselines	made	it	easy	to	show	improvements	early	in	the	
process
5/30/16	
14	
ImplementaKon – Sprint Process
	 Sub-team	runs	a	weekly	sprint	
	 Fibonacci	Sequence	(1,2,3,5)	for	esDmaDng	complexity	of	tasks	
	 Tasks	in	the	sprint	cover	the	range	of	projects	that	sub-team	is	responsible	for	
	 Only	commit	tasks	that	we	promise	to	finish	
	 We’re	a	DevOps	team	–	be	realisDc	in	how	much	work	we	commit	to	
	 Combined	sprint	is	internal,	i.e.	not	shared	with	customers	
ImplementaKon – Sprint Admin (Time)
Name	 Days	 Hours/Day	 Logged	Hours	
Angus	 4.5	 6	 29	
Julia	 4	 6	 22
5/30/16	
15	
ImplementaKon – Sprint Admin (Tasks)
Name	 Task	 Points	 Status	
Angus	 TASK-1	 3	 Complete	
Angus	 TASK-2	 3	 UnderesDmated	
Julia	 TASK-3	 5	 De-prioriDzed	
Julia	 TASK-4	 2	 Complete	
OperaKon – Data CollecKon
	 Warning:	metrics	data	collecDon	introduces	overhead	
	 We	automate	what	we	can,	but	the	data	comes	from	mulDple	sources	and	is	
manually	entered	
	 It’s	important	for	each	objecDve	to	have	a	clear	owner	
	 ObjecDve	owners:	just	get	in	and	do	it.	Once	you	let	it	slip	one	week,	it’s	easy	to	
let	it	slip	again.	And	again…
5/30/16	
16	
OperaKon – Focused ReporKng
	 The	results	of	each	automaDon	run	are	stored	in	a	central	database.	
	 This	allows	us	to	closely	monitor	the	results	with	focused	reporDng	via:	
◦ InteracDve	Reports	
◦ TV	Dashboard	
◦ Daily	Automated	Emails	
Reliability ReporKng – InteracKve Reports
AutomaDon	Reliability	
Success	 Game	Fail	 Infra	Fail	
Failure	
Count	
Failure	Descrip0on	
70	 GAME	–	compile	error	
20	 INFRA	–	no	disc	space	
10	 INFRA	–	network	error
5/30/16	
17	
Reliability ReporKng – TV Dashboards
Perceived	
100%	
Tests	
93.1%	
Builds	
98.1%	
Reliability ReporKng – Automated Emails
0%	
10%	
20%	
30%	
40%	
50%	
60%	
70%	
80%	
90%	
100%	
Project	A	 Project	B	 Project	C	 Project	D	
Test	Reliability	-	Yesterday	
Success	 Failure
5/30/16	
18	
EvaluaKon & EvoluKon
	 Sub-Team	Reviews	
	 Quarterly	Updates	
	 Annual	Refresh	
EvaluaKon – Sub-Team Reviews
	 Leadership	meets	regularly,	rotaDng	amongst	the	sub-teams	
	 Compare	current	results	vs.	previous	&	target	
	 What	acDons	have	been	taken	since	the	previous	review?	
	 What	acDons	will	be	taken	in	the	future?	
	 Focus	is	not	necessarily	on	the	numbers,	but	more	on	the	acDons
5/30/16	
19	
EvaluaKon – Quarterly Updates
	 An	update	on	the	trend	of	key	metrics	
is	presented	in	the	team’s	quarterly	
town	hall	meeDng	
	 Followed-up	with	email	
91%	
92%	
93%	
94%	
95%	
96%	
97%	
98%	
99%	
100%	
Q1	 Q2	 Q3	 Q4	
AutomaDon	Reliability	
CAN	 USA	 EUR	 Target	
EvoluKon – Annual Refresh
	 Towards	the	end	of	the	year,	the	team	has	the	opportunity	to	update	the	
objecDves:	
◦ Add	new	objecDves	
◦ Remove	stale	objecDves	
◦ Move	objecDves	between	core	&	sub-team	
◦ Modify	targets	
◦ Re-baseline
5/30/16	
20	
Where We Are Now
	 We	are	now	in	the	fourth	year	of	our	approach	to	metrics	collecDon	&	
reporDng.	
	 Improvements	we’ve	seen:	
◦ Our	automaDon	systems	are	reliable.	We	regularly	hit	our	targets	and	97%	of	
runs	produce	meaningful	results	to	the	customer	
◦ We	know	where	our	Dme	goes.	We	can	track	Dme	spent	per	project,	type	
(support	vs.	value-add),	or	area	(builds,	test,	infrastructure,	reporDng,	etc.)	
◦ The	team	is	happy	and	consistently	scores	over	4/5	in	the	team	health	survey	
◦ The	team	has	expanded	to	work	on	addiDonal	projects	in	other	studios	
Example ObjecKves
OVERVIEW | DETAIL
5/30/16	
21	
Overview of Example ObjecKves
	 AutomaDon	Reliability	
	 Time	Logged	
	 Team	Health	
	 External	RecogniDon	
	 Customer	SaDsfacDon	
	 Budget	Variance	
	 Ticket	Acknowledgement	
	 Support	Ticket	Closure	
	 Time	in	Work	
	 Overhang	
	 Planned	Work	
	 Support	Work	
ObjecKve – Customer SaKsfacKon
Descrip0on:	Average	results	per	
respondent	from	the	Customer	
SaDsfacDon	Survey	
Source:	Survey	is	completed	twice	
per	year	
Intent:	Our	customers	are	happy	 Target:	4	/	5	
Customer	SaDsfacDon
5/30/16	
22	
ObjecKve – Budget Variance
Descrip0on:	Percentage	that	we	are	
within	our	budget	
Source:	Stats	are	pulled	from	the	
finance	system	quarterly	
Intent:	We	sDck	to	our	budget	 Target:	0%	
Budget	Variance	
ObjecKve – Ticket Acknowledgement
Descrip0on:	Average	Dme	customer	
created	Dckets	spend	in	the	‘new’	
state	
Source:	Stats	are	pulled	from	the	
TickeDng	system	weekly	
Intent:	Our	customers	are	promptly	
responded	to	
Target:	4	hours	
Ticket	
Acknowledgement
5/30/16	
23	
ObjecKve – Support Ticket Closure
Descrip0on:	Average	Dme	it	takes	to	
close	support	Dckets	
Source:	Stats	are	pulled	from	the	
TickeDng	system	weekly	
Intent:	Broken	things	are	fixed	
promptly	
Target:	4	days	
Support	Ticket	
Closure	
ObjecKve – Time in Work
Descrip0on:	Average	Dme	Dckets	
spend	in	the	‘in	progress’	state	
Source:	Stats	are	pulled	from	the	
TickeDng	system	weekly	
Intent:	Tasks	are	sized	into	Dckets	
that	are	completed	in	a	sprint	
Target:	4	days	
Time	in	Work
5/30/16	
24	
ObjecKve – Overhang
Descrip0on:	Percentage	of	
commited	tasks	that	are	incomplete	
at	the	end	of	a	sprint	
Source:	Stats	are	pulled	from	the	
DckeDng	system	weekly	
Intent:	We	complete	our	planned	
work	each	week	
Target:	10%	
Overhang	
ObjecKve – Planned Work
Descrip0on:	Percentage	of	Dme	
spent	on	the	commited	tasks	in	a	
sprint	
Source:	Stats	are	pulled	from	the	
DckeDng	system	weekly	
Intent:	We	maximize	the	Dme	spent	
on	commited	tasks		
Target:	40%	
Planned	Work
5/30/16	
25	
ObjecKve – Support Work
Descrip0on:	Percentage	of	Dme	
spent	on	fixing	broken	things	
Source:	Stats	are	pulled	from	the	
DckeDng	system	weekly	
Intent:	We	minimize	the	Dme	spent	
fixing	things	
Target:	10%	
Support	Work	
Wrap-Up
BIG BENEFITS | KEY TAKEAWAYS | QUESTION TIME
5/30/16	
26	
Big Benefits
Data-Driven	
Decision	Making	
•  We	have	
evolved	to	make	
decisions	based	
on	our	data,	
rather	than	our	
emoDons	
Confidence	
•  We	can	validate	
that	we’re	as	
good	as	we	
think	we	are	
ReputaDon	
•  We	are	seen	as	
a	team	that	has	
their	stuff	
together	
Key Takeaways
	 Before	you	define	individual	objecDves,	consider	the	core	pillars	of	your	team	
	 If	individuals	on	the	team	cannot	influence	an	objecDve,	it	shouldn’t	be	there	
	 Don’t	have	compeDng	objecDves	
	 Educate	the	exisDng	team	&	onboard	new	staff	
	 The	behaviours	that	the	objecDves	drive	are	more	important	than	the	numbers
5/30/16	
27	
QuesKon Time
PRESENTATION	TITLE	
	 A	Case	Study	in	Metrics-
Driven	DevOps	
CONTACT	INFO	
	 Ben	Vining	
	 Electronic	Arts	
	 bvining@ea.com

A Case Study in Metrics-Driven DevOps