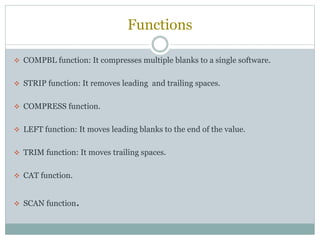
KEMBAR78
Applications of sas and minitab in data analysis | PPTX
VEENA.V
4TH YEAR B.PHARMACY
SRI.K.V.COLLEGE OF
PHARMACY
APPLICATIONS OF SAS AND
MINITAB IN DATA ANALYSIS
SAS
Introduction Functions Applications
Overview
Introduction
 SAS is basically termed as ‘Statistical Analysis system’.
 It is a software used for statistical analysis, graphing and presenting
data since 1970 provided by statistical institute.
 It performs a wide variety of analysis on data those are retrieved and
transformed from the DATA step.
 This software intended for management and analysis of agriculture
field experiments and now most widely used commercial statistical
software.
Functions
 COMPBL function: It compresses multiple blanks to a single software.
 STRIP function: It removes leading and trailing spaces.
 COMPRESS function.
 LEFT function: It moves leading blanks to the end of the value.
 TRIM function: It moves trailing spaces.
 CAT function.
 SCAN function.
Function of Data Step and procedure step
 The data step reads data from external sources are read, manipulated by data
step.
 Data step combines the external resources with other data set and prints
reports.
 The data step is used to prepare data for use by ne of the procedures.
 The procedure steps perform analysis on the data and produce output.
Applications
 The main application is to process complex raw data and generate meaningful
insights.
 This helps the organisation to make better decisions.
 It helps us to mine data from various sources, compile it and analyze it.
 It does the digging, cleaning, processing and packaging for statistical people.
MINITAB
1.
• Introduction
2.
• Applications
3.
• Uses
4.
• Features
Introduction
 MINITAB is a statistical software package that was designed especially for the
teaching of introductory statistics courses.
 It is easy to use statistical software package is a vital and significant component
of a course.
 This is designed essentially for the six sigma professionals to give effective
solutions for statistical analysis is most of six sigma projects.
 There are many versions of MINITAB such as Minitab Student Version 14,
Minitab Version 13 running under windows.
 The text based on Minitab Student Version 14 and Minitab Version 13.
Applications
 Minitab is simple, effective for input or manipulate the statistical data, identify
trends and patterns and easily find the solutions to the current issues.
 It provides standard statistical methods, regression, correlation, multivariable
analysis, quality control charts, DOE etc.
 Minitab has 2 main types of files such as projects and worksheets.
 Projects are made up of the commands graphs and worksheets.
 Ease of learning and use are the salient features of the package with obvious benefits
to the students and to the instructor who can relegate many details to the software.
 It serves as a perfectly adequate tool for many of the statistical problems that
students will encounter in their UG education.
 It is well suited for instructional applications, but is also powerful enough to be used
as a primary tool for analysing research data.
Uses
 It is very useful software for industry and research for the implementation of
six sigma projects.
 It is also used to prepare data in simple form and to visualise the data in simple
graphical output, scatter plots, box plots, histogram etc.
 Also useful foe calculation of clinical data.
 It can be used for learning about statistics as well as statistical research.
 Minitab also produces often software that can be used in conjunction with
Minitab, quality training is an e-Learning package that teaches statistical tools
and concepts in the context of quality improvement.
Features
 It also offers screening designs, factorial designs, response surface designs, mixture
designs and Taguchi robust designs.
 It also provides several analytical tools and graphs tools to interpret the results.
MINITAB for Data Management
 Entering data into a worksheet, Importing data, patterned data, printing data in the
session window, assigning constants, naming variables and constants, information
about a worksheet, editing a worksheet, saving, retrieving and printing etc.
MINITAB for Data Analysis
 Looking at data distributions, plotting data, normal distribution, probability,
sampling distribution, introduction to inference, Inference for two way tables,
multiple regression, one-way analysis of variance, two way analysis of variance,
bootstrap methods and permutation, control and capability, functions in Minitab,
Mathematical functions, matrix in algebra etc.
T H A N K Y O U

Applications of sas and minitab in data analysis

  • 1.
    VEENA.V 4TH YEAR B.PHARMACY SRI.K.V.COLLEGEOF PHARMACY APPLICATIONS OF SAS AND MINITAB IN DATA ANALYSIS
  • 2.
  • 3.
    Introduction  SAS isbasically termed as ‘Statistical Analysis system’.  It is a software used for statistical analysis, graphing and presenting data since 1970 provided by statistical institute.  It performs a wide variety of analysis on data those are retrieved and transformed from the DATA step.  This software intended for management and analysis of agriculture field experiments and now most widely used commercial statistical software.
  • 4.
    Functions  COMPBL function:It compresses multiple blanks to a single software.  STRIP function: It removes leading and trailing spaces.  COMPRESS function.  LEFT function: It moves leading blanks to the end of the value.  TRIM function: It moves trailing spaces.  CAT function.  SCAN function.
  • 5.
    Function of DataStep and procedure step  The data step reads data from external sources are read, manipulated by data step.  Data step combines the external resources with other data set and prints reports.  The data step is used to prepare data for use by ne of the procedures.  The procedure steps perform analysis on the data and produce output.
  • 6.
    Applications  The mainapplication is to process complex raw data and generate meaningful insights.  This helps the organisation to make better decisions.  It helps us to mine data from various sources, compile it and analyze it.  It does the digging, cleaning, processing and packaging for statistical people.
  • 7.
  • 8.
    Introduction  MINITAB isa statistical software package that was designed especially for the teaching of introductory statistics courses.  It is easy to use statistical software package is a vital and significant component of a course.  This is designed essentially for the six sigma professionals to give effective solutions for statistical analysis is most of six sigma projects.  There are many versions of MINITAB such as Minitab Student Version 14, Minitab Version 13 running under windows.  The text based on Minitab Student Version 14 and Minitab Version 13.
  • 9.
    Applications  Minitab issimple, effective for input or manipulate the statistical data, identify trends and patterns and easily find the solutions to the current issues.  It provides standard statistical methods, regression, correlation, multivariable analysis, quality control charts, DOE etc.  Minitab has 2 main types of files such as projects and worksheets.  Projects are made up of the commands graphs and worksheets.  Ease of learning and use are the salient features of the package with obvious benefits to the students and to the instructor who can relegate many details to the software.  It serves as a perfectly adequate tool for many of the statistical problems that students will encounter in their UG education.  It is well suited for instructional applications, but is also powerful enough to be used as a primary tool for analysing research data.
  • 10.
    Uses  It isvery useful software for industry and research for the implementation of six sigma projects.  It is also used to prepare data in simple form and to visualise the data in simple graphical output, scatter plots, box plots, histogram etc.  Also useful foe calculation of clinical data.  It can be used for learning about statistics as well as statistical research.  Minitab also produces often software that can be used in conjunction with Minitab, quality training is an e-Learning package that teaches statistical tools and concepts in the context of quality improvement.
  • 11.
    Features  It alsooffers screening designs, factorial designs, response surface designs, mixture designs and Taguchi robust designs.  It also provides several analytical tools and graphs tools to interpret the results. MINITAB for Data Management  Entering data into a worksheet, Importing data, patterned data, printing data in the session window, assigning constants, naming variables and constants, information about a worksheet, editing a worksheet, saving, retrieving and printing etc. MINITAB for Data Analysis  Looking at data distributions, plotting data, normal distribution, probability, sampling distribution, introduction to inference, Inference for two way tables, multiple regression, one-way analysis of variance, two way analysis of variance, bootstrap methods and permutation, control and capability, functions in Minitab, Mathematical functions, matrix in algebra etc.
  • 12.
    T H AN K Y O U