Downloaded 25 times
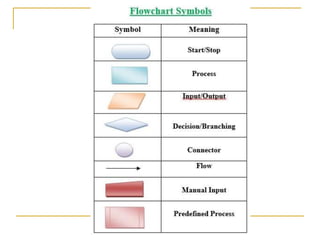

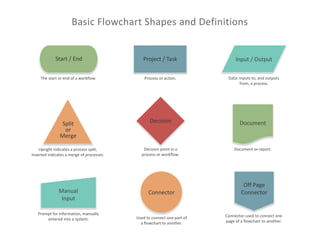


The document discusses problem-solving techniques including defining a problem statement, creating algorithms, and using flowcharts. It emphasizes the importance of a clear problem statement, the characteristics of algorithms, and the advantages of flowcharts as a visual representation of processes. Additionally, it outlines various flowchart shapes and provides examples, while noting limitations such as complexity and the need for redrawing when modifications occur.
Overview of algorithms, flowcharts, and problem-solving techniques.
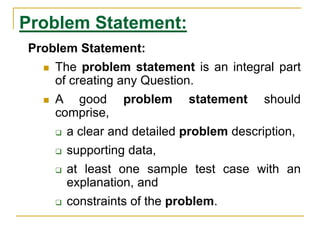
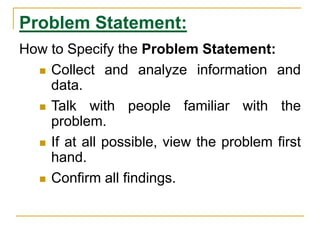
Importance of a clear problem statement, including description, data, test cases, and constraints.
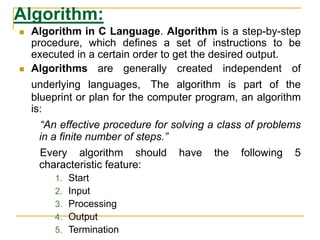
Definition of algorithms as step-by-step procedures, characteristics including start, input, processing, output, and termination.
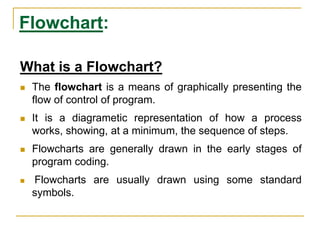
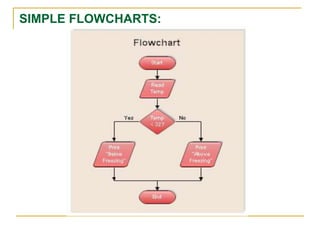
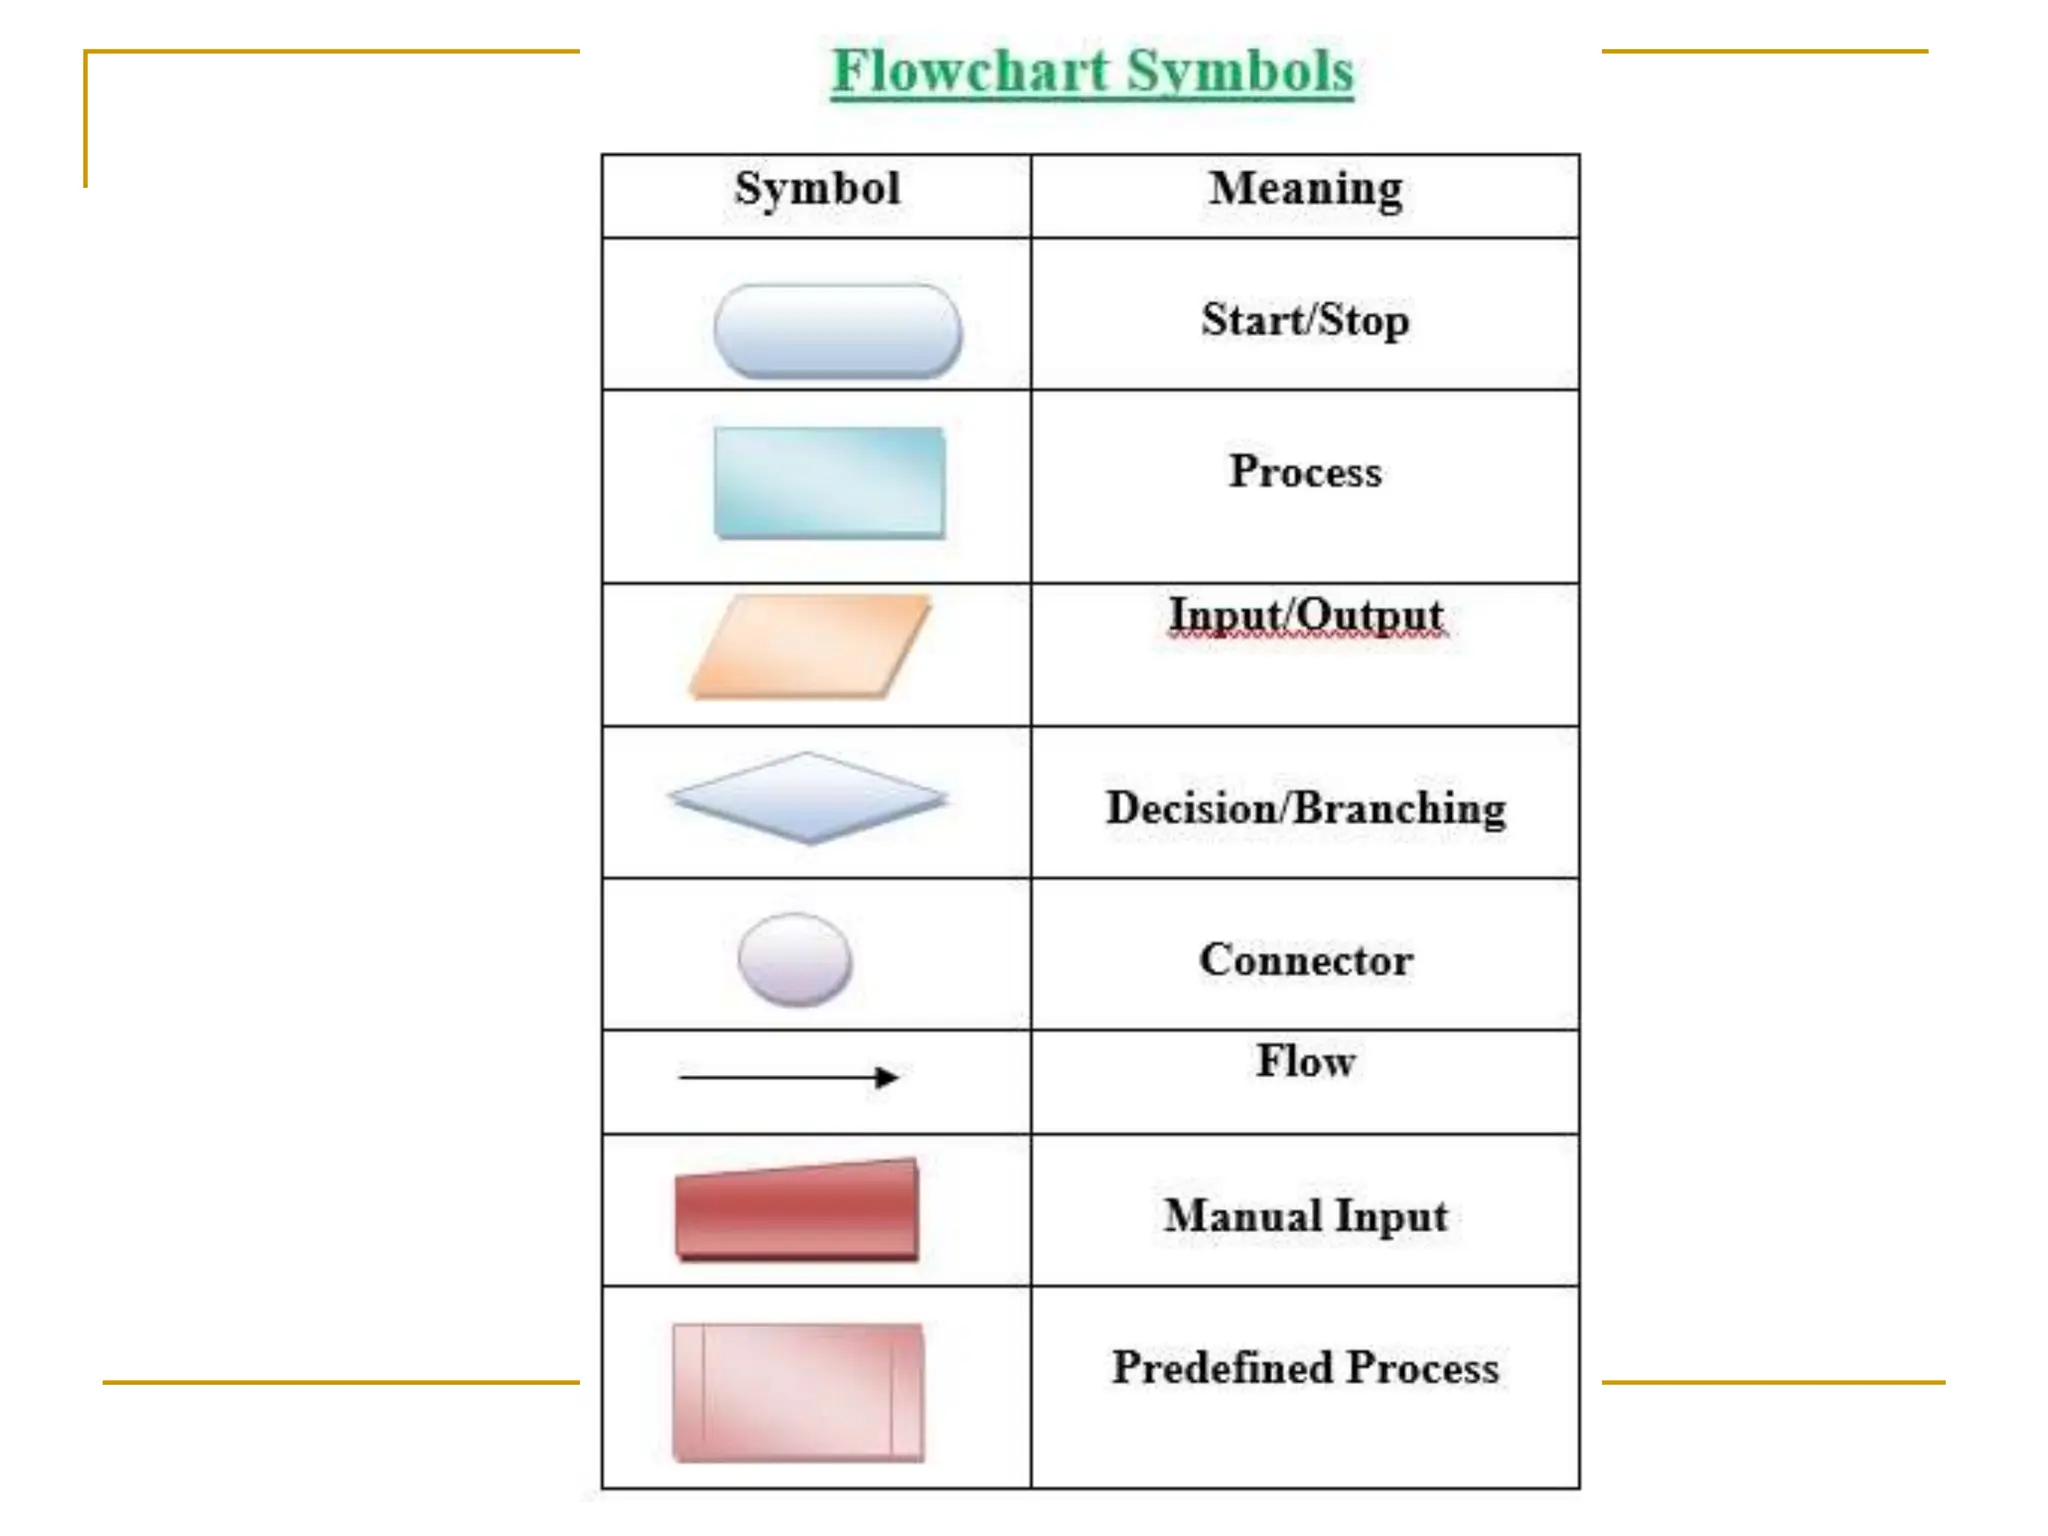
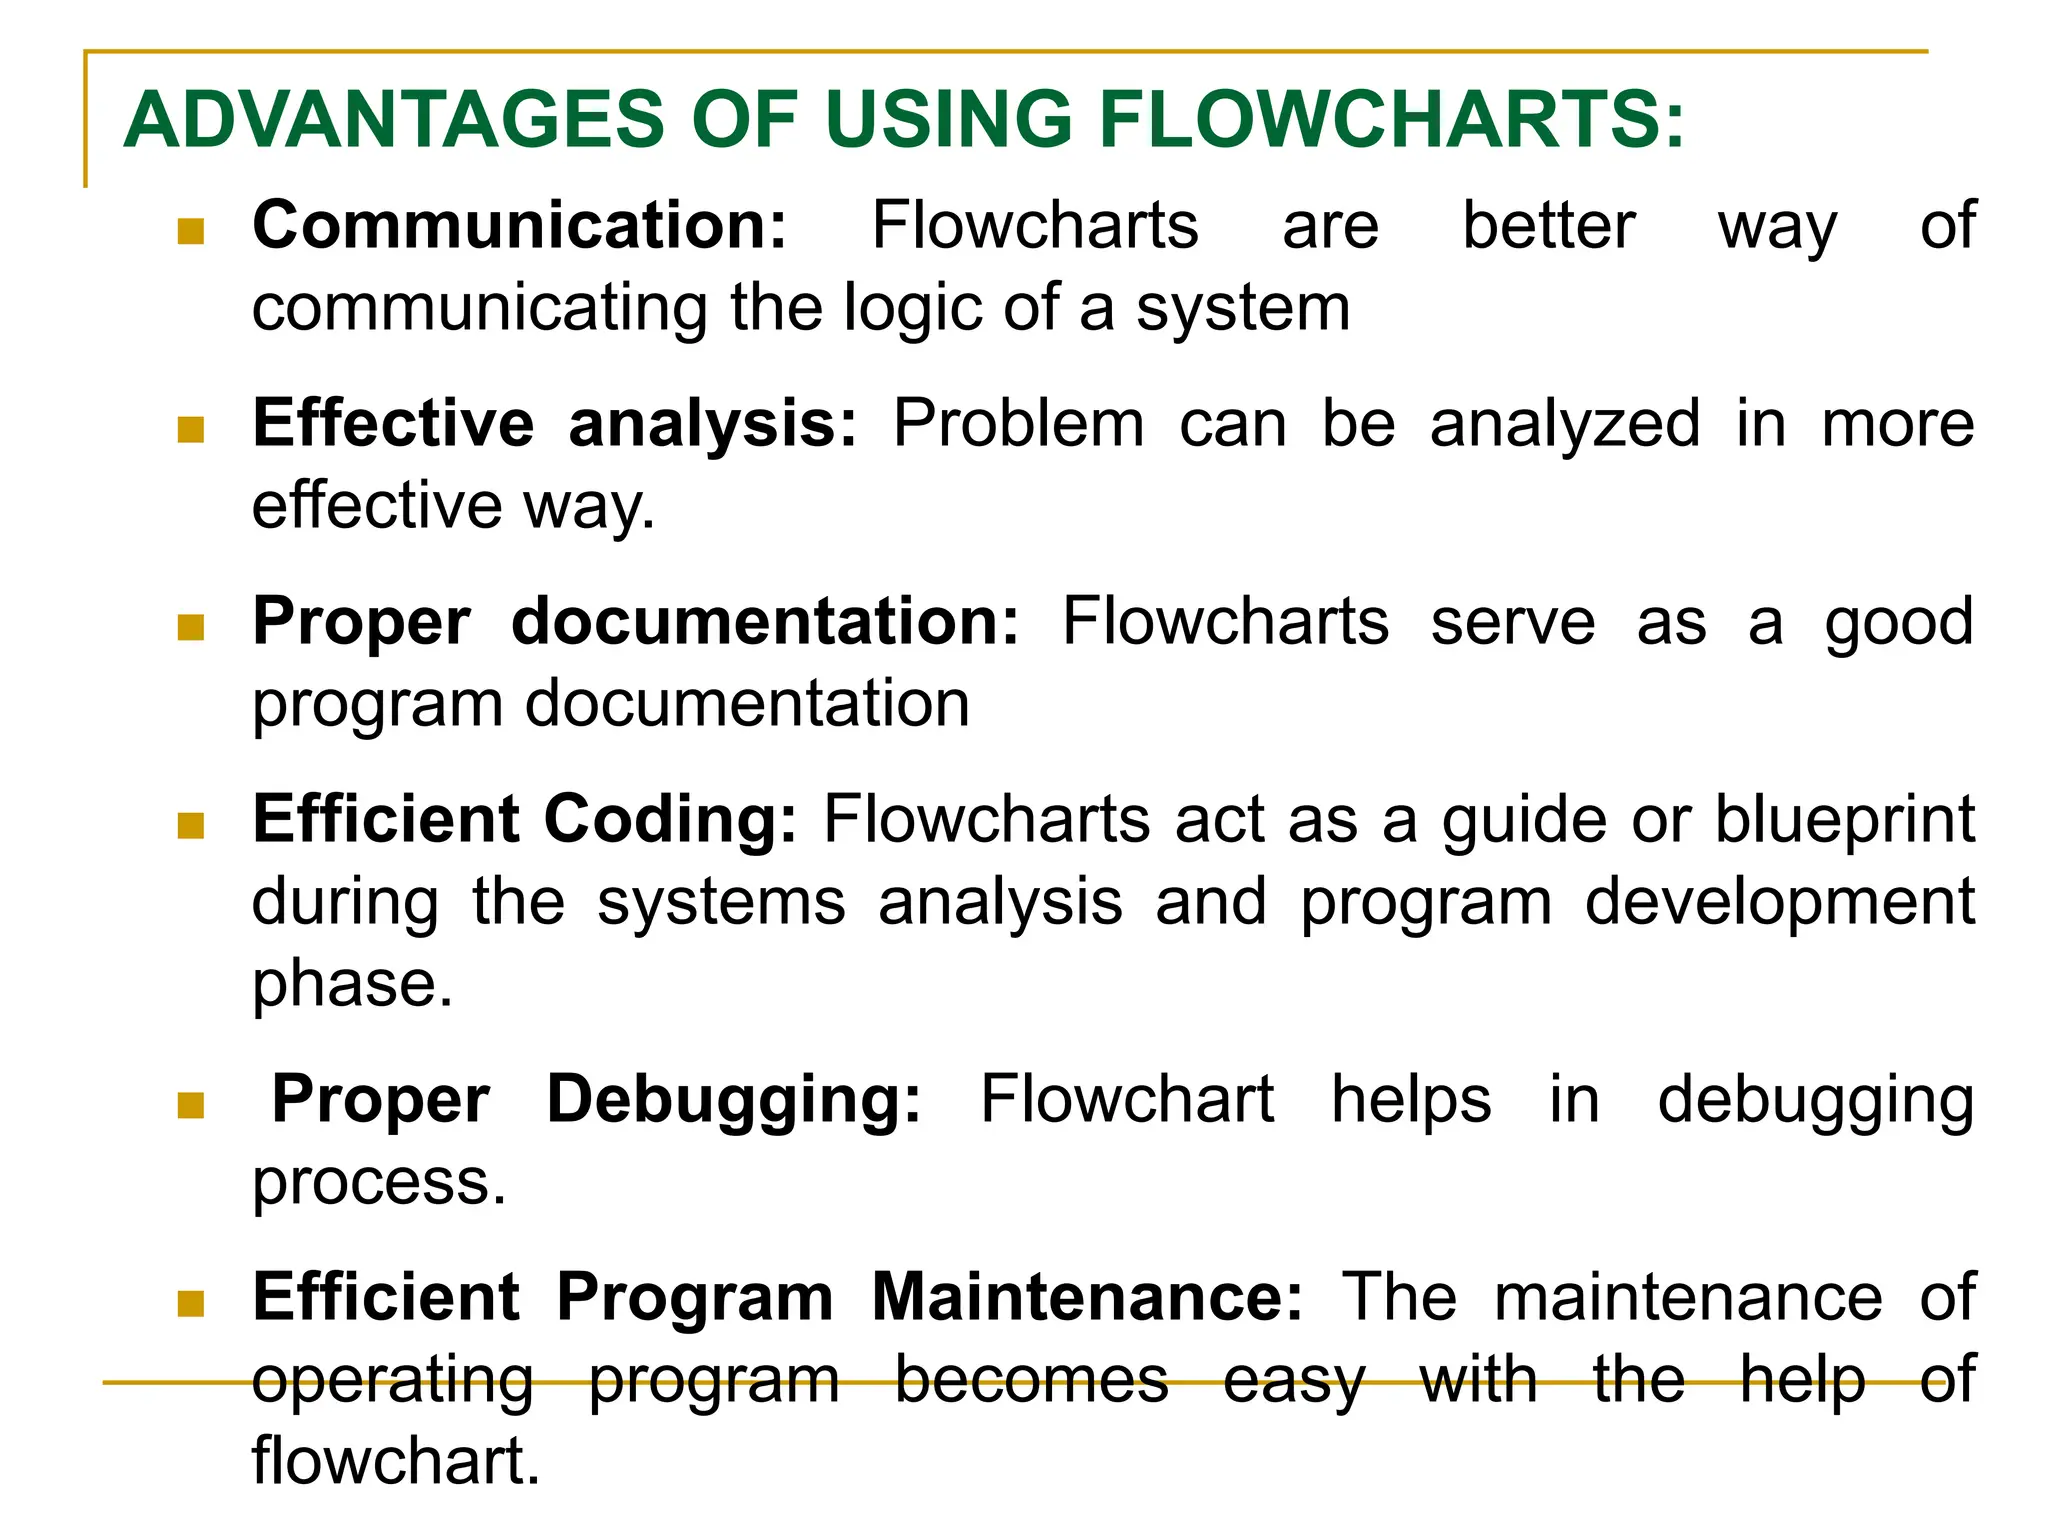
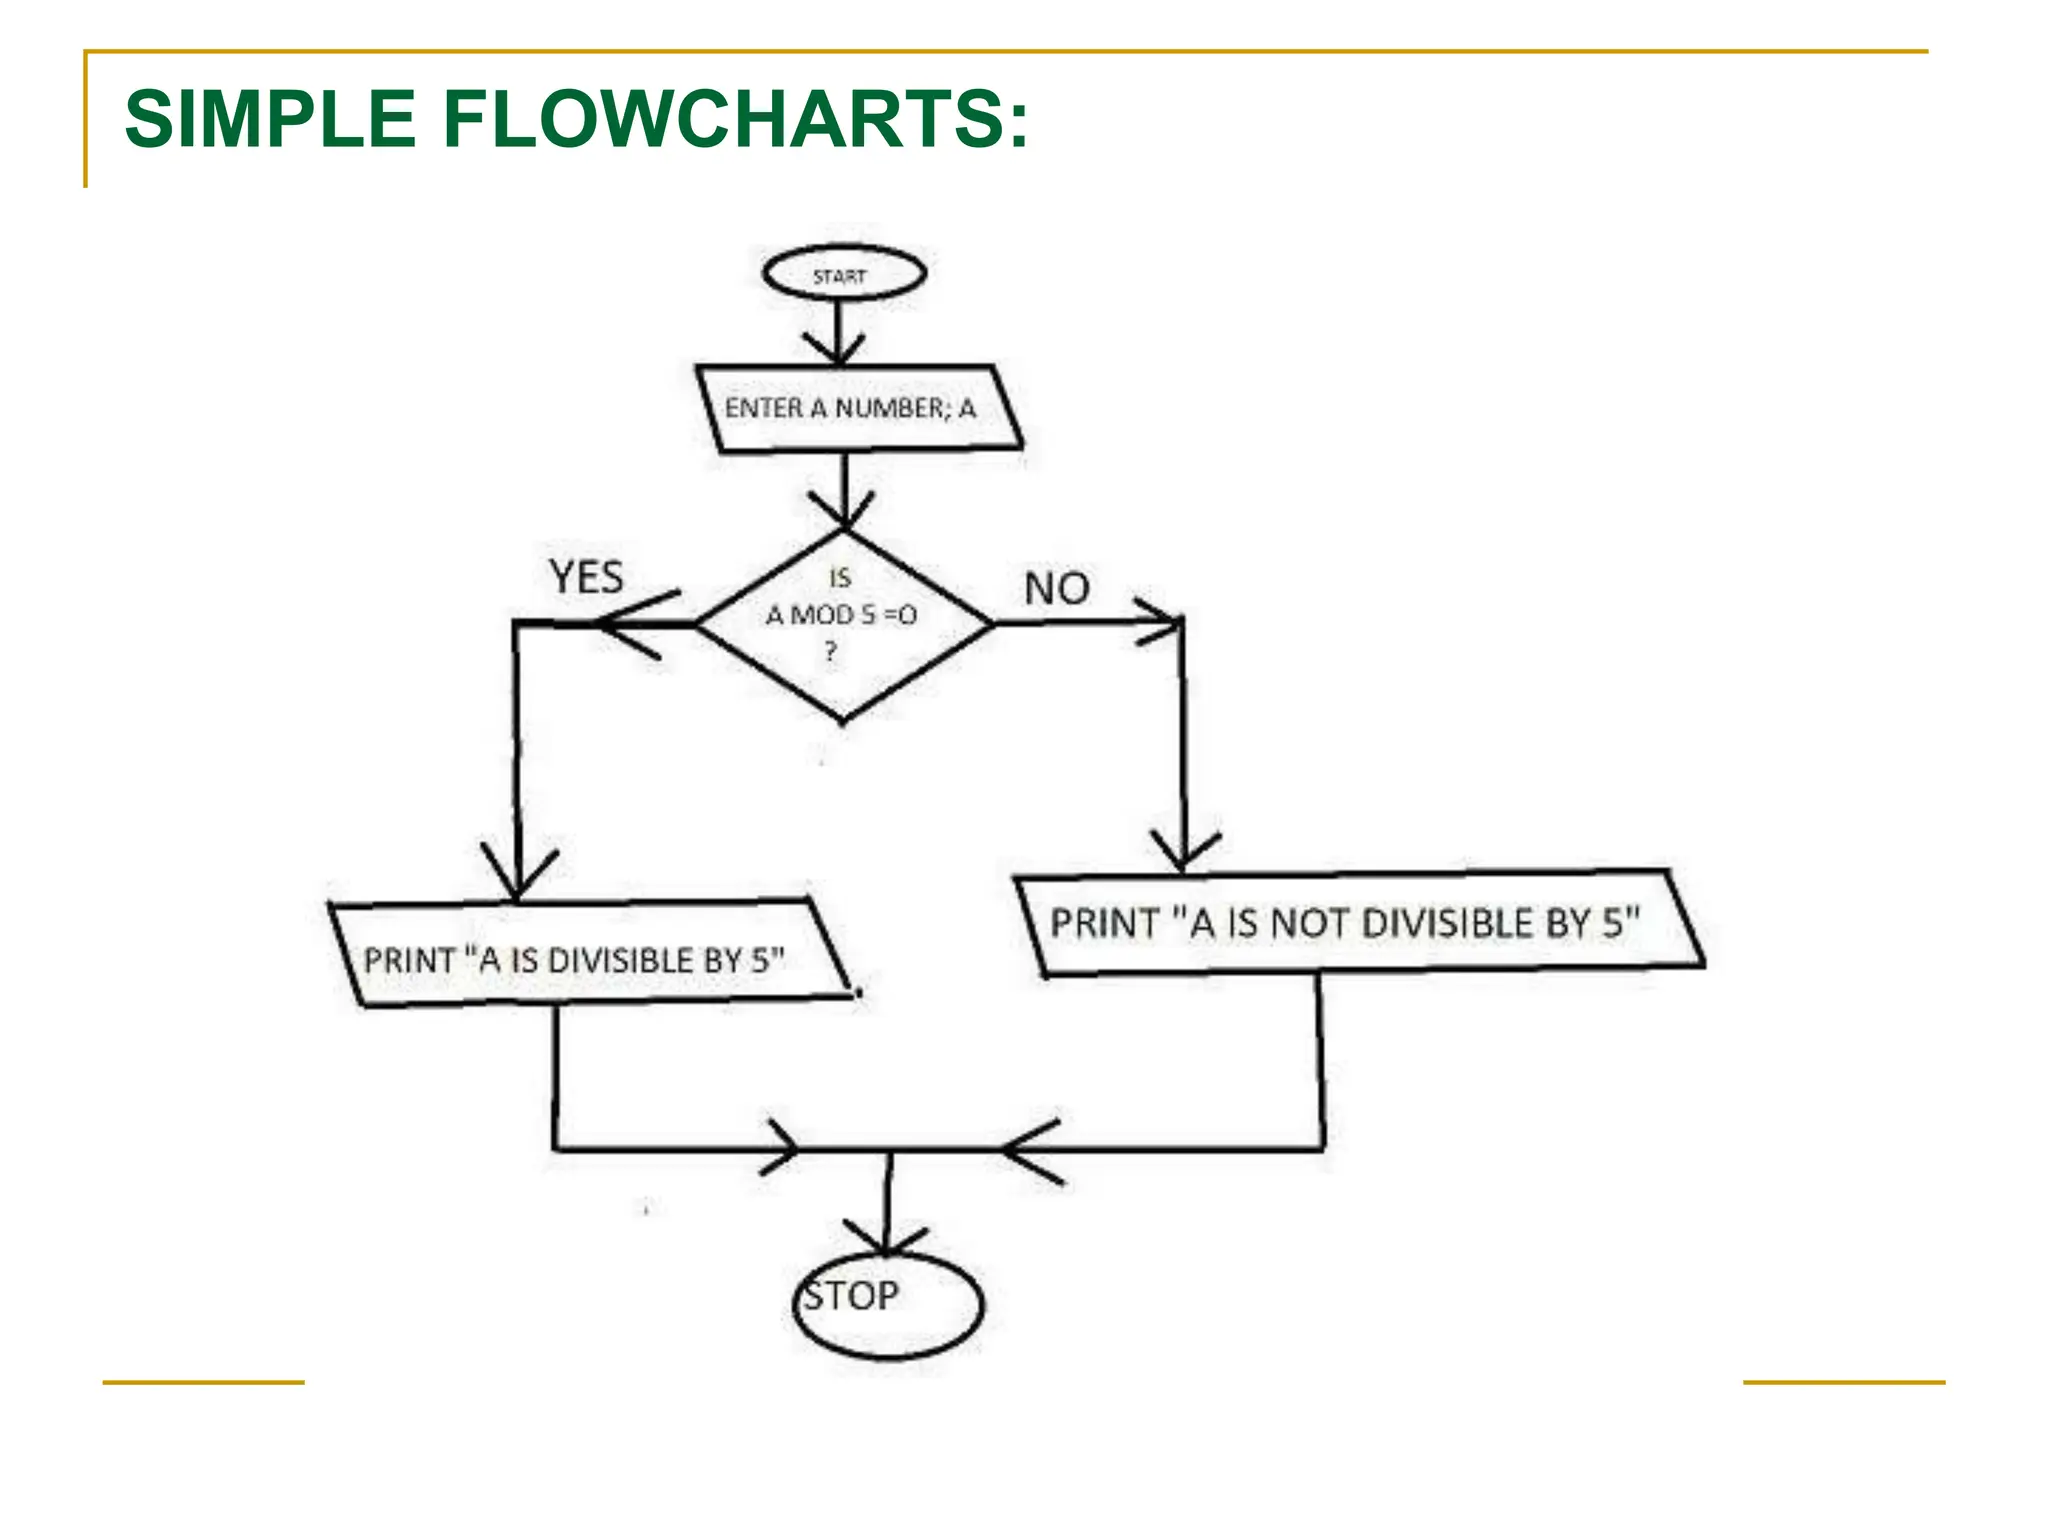
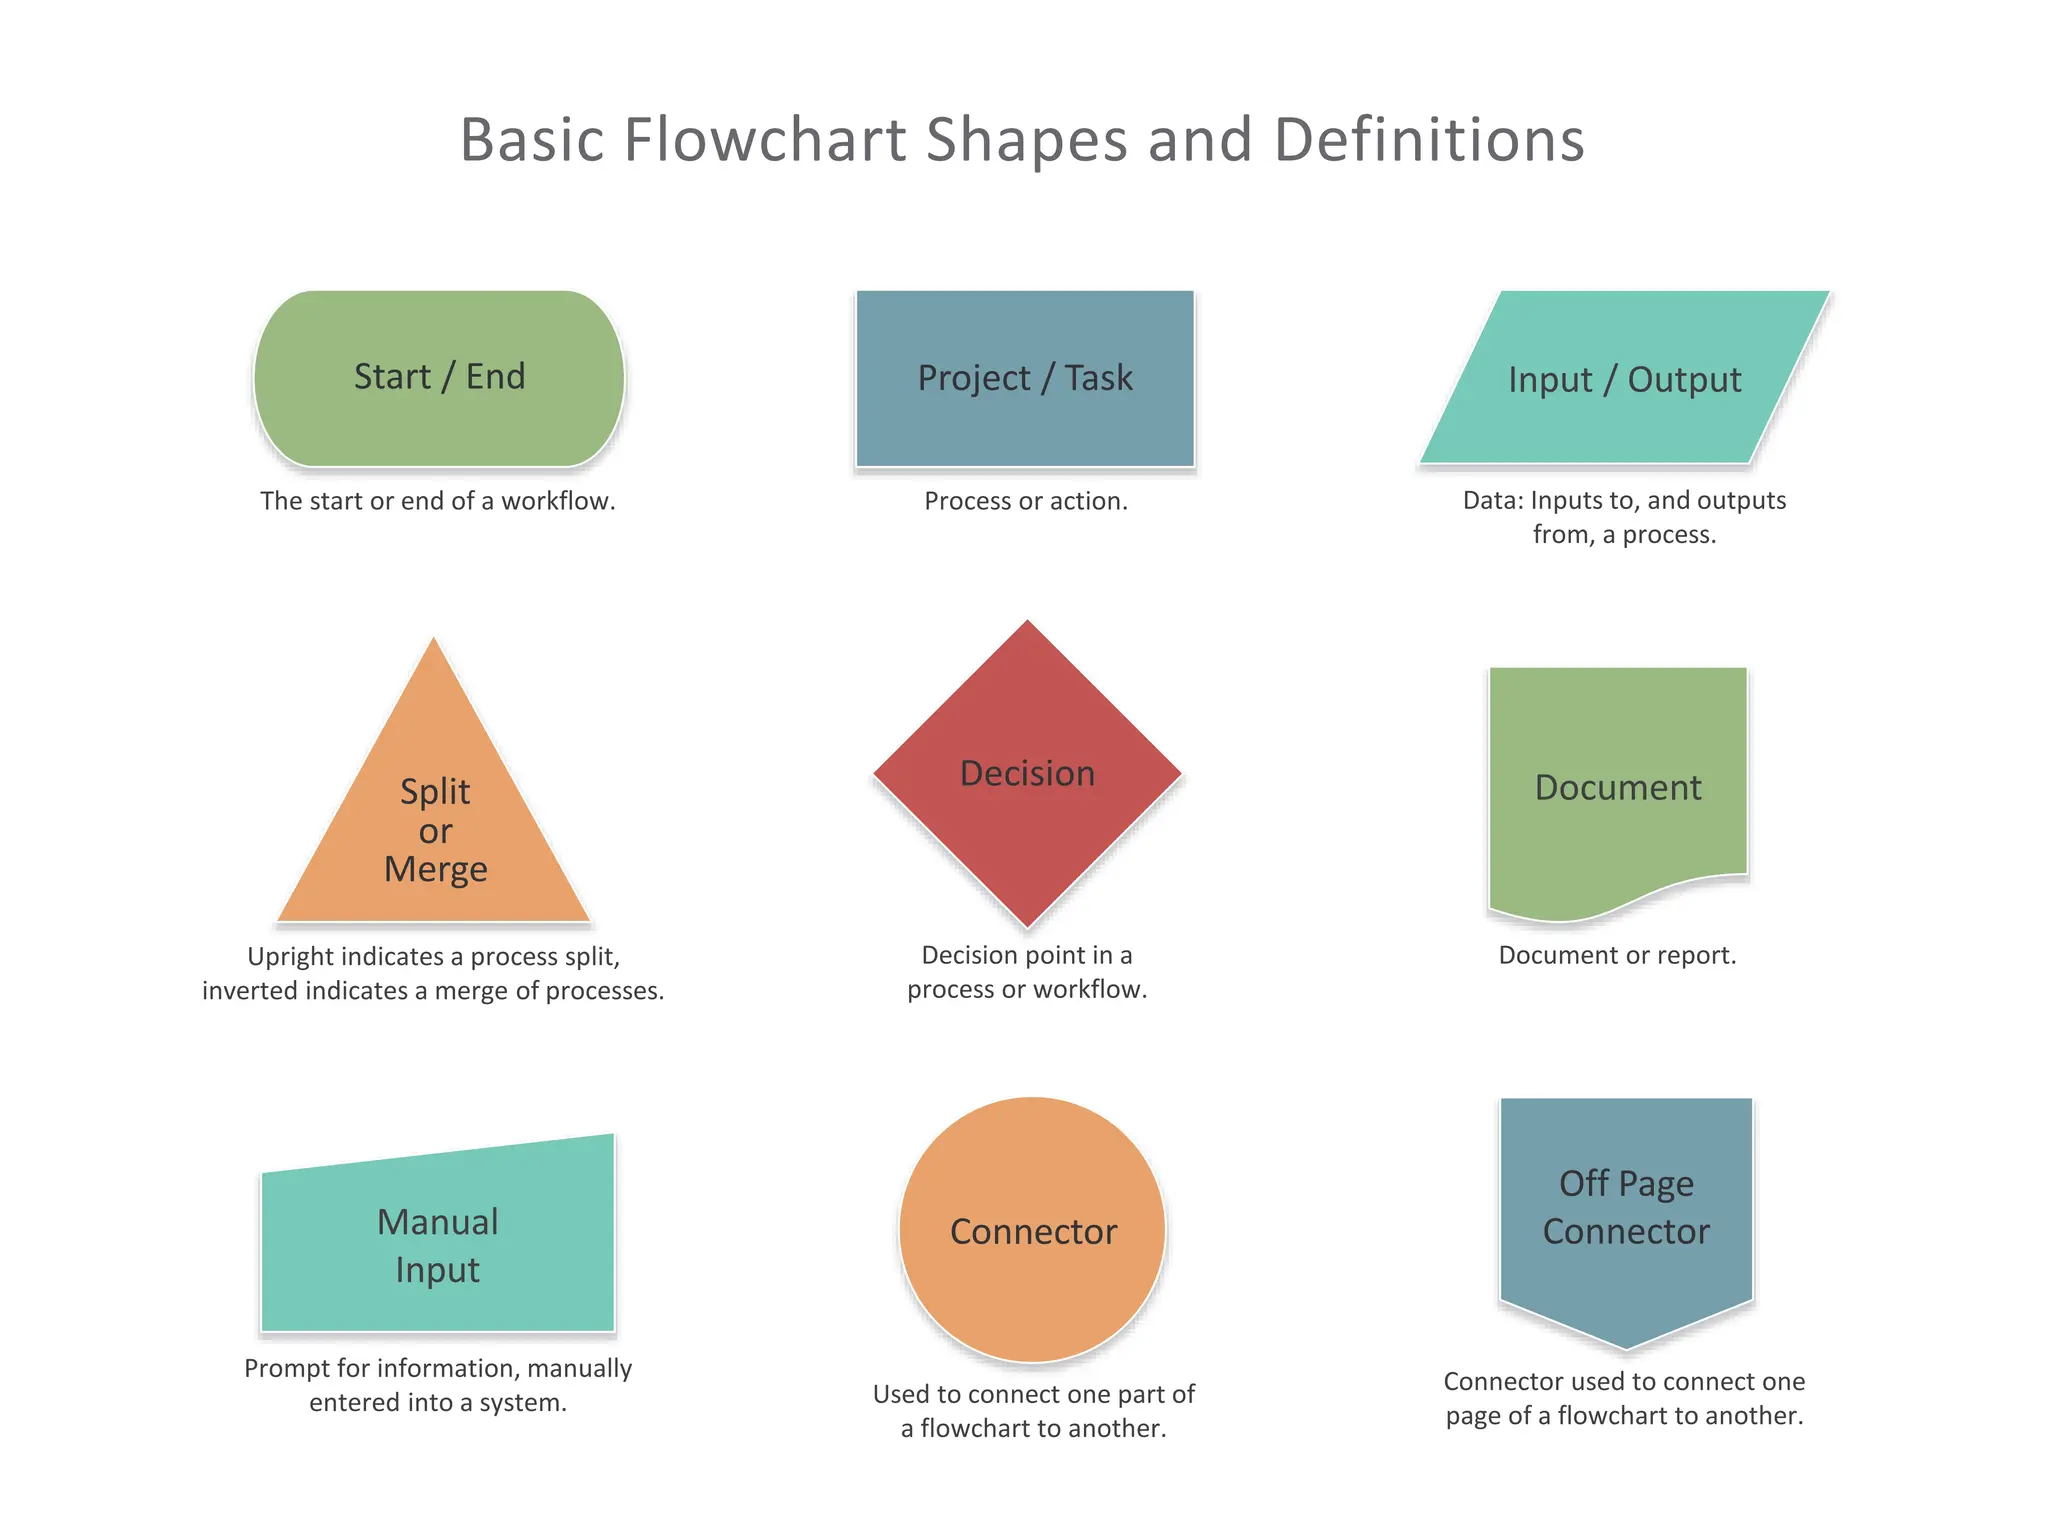
Flowcharts as graphical representations of processes, advantages in communication, analysis, documentation, coding, debugging, and maintenance.
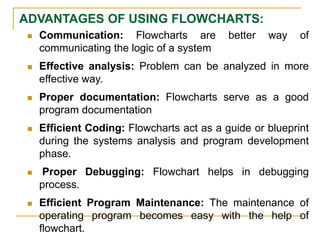
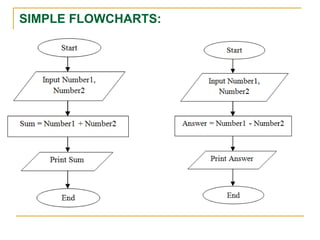
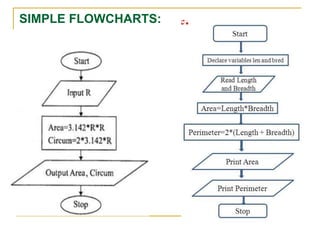
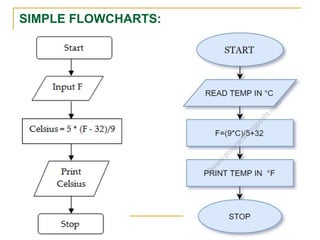
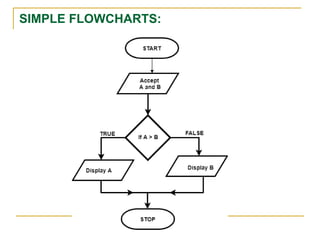
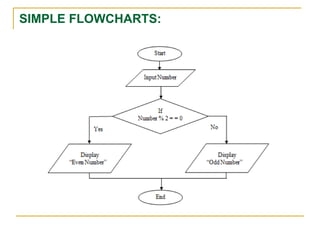
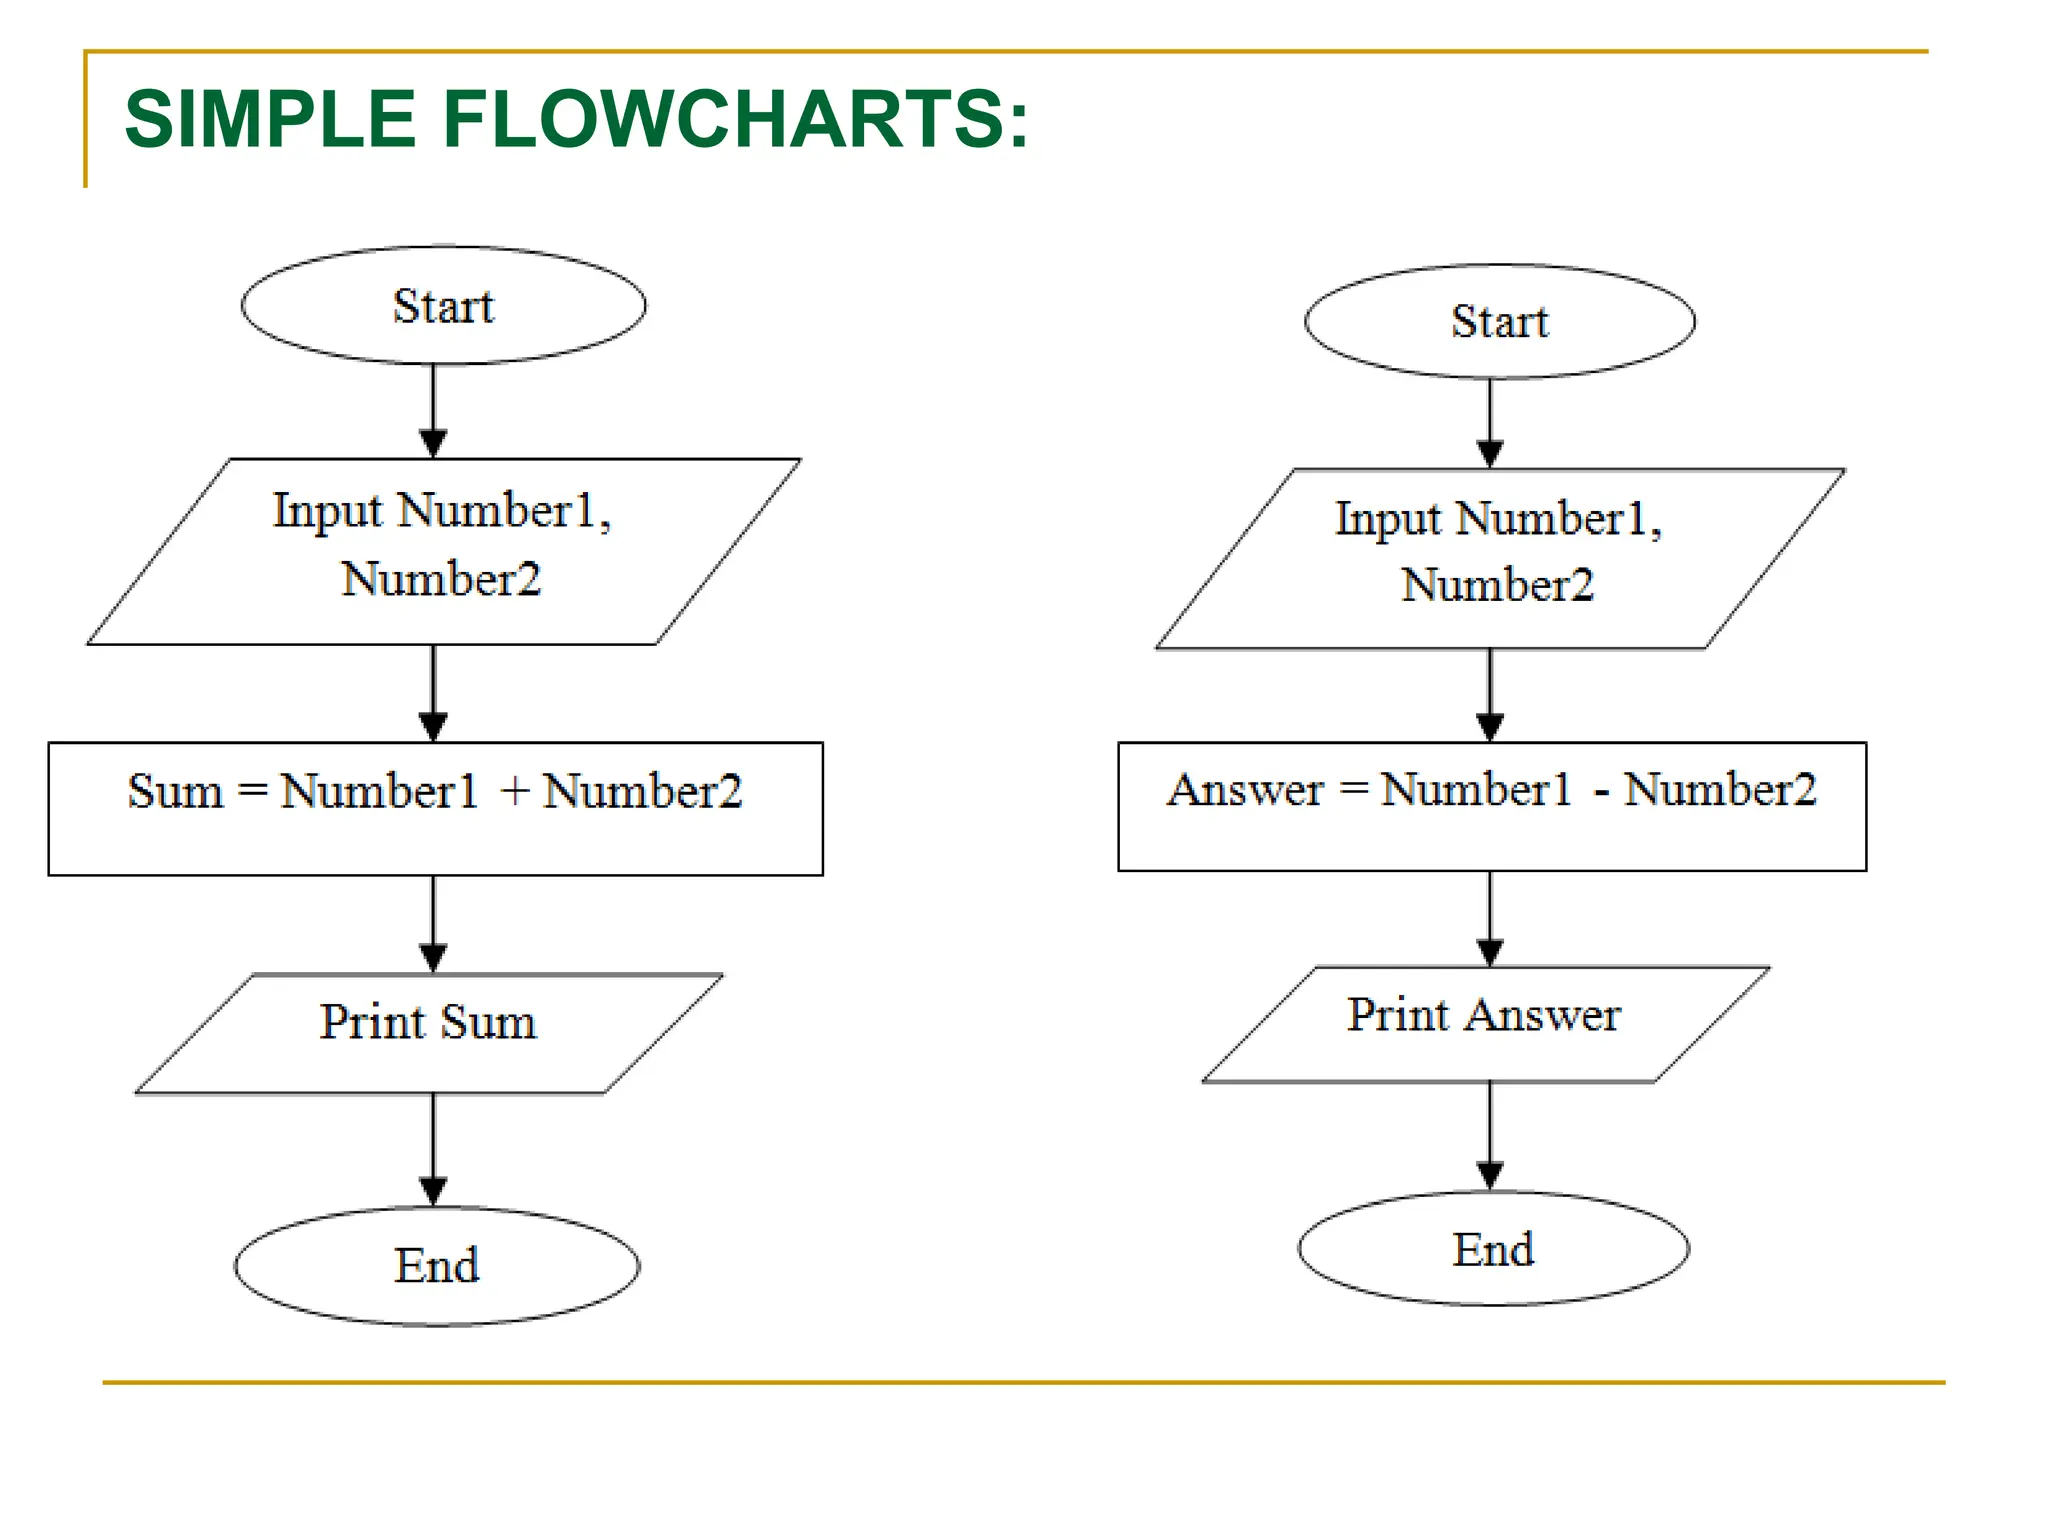
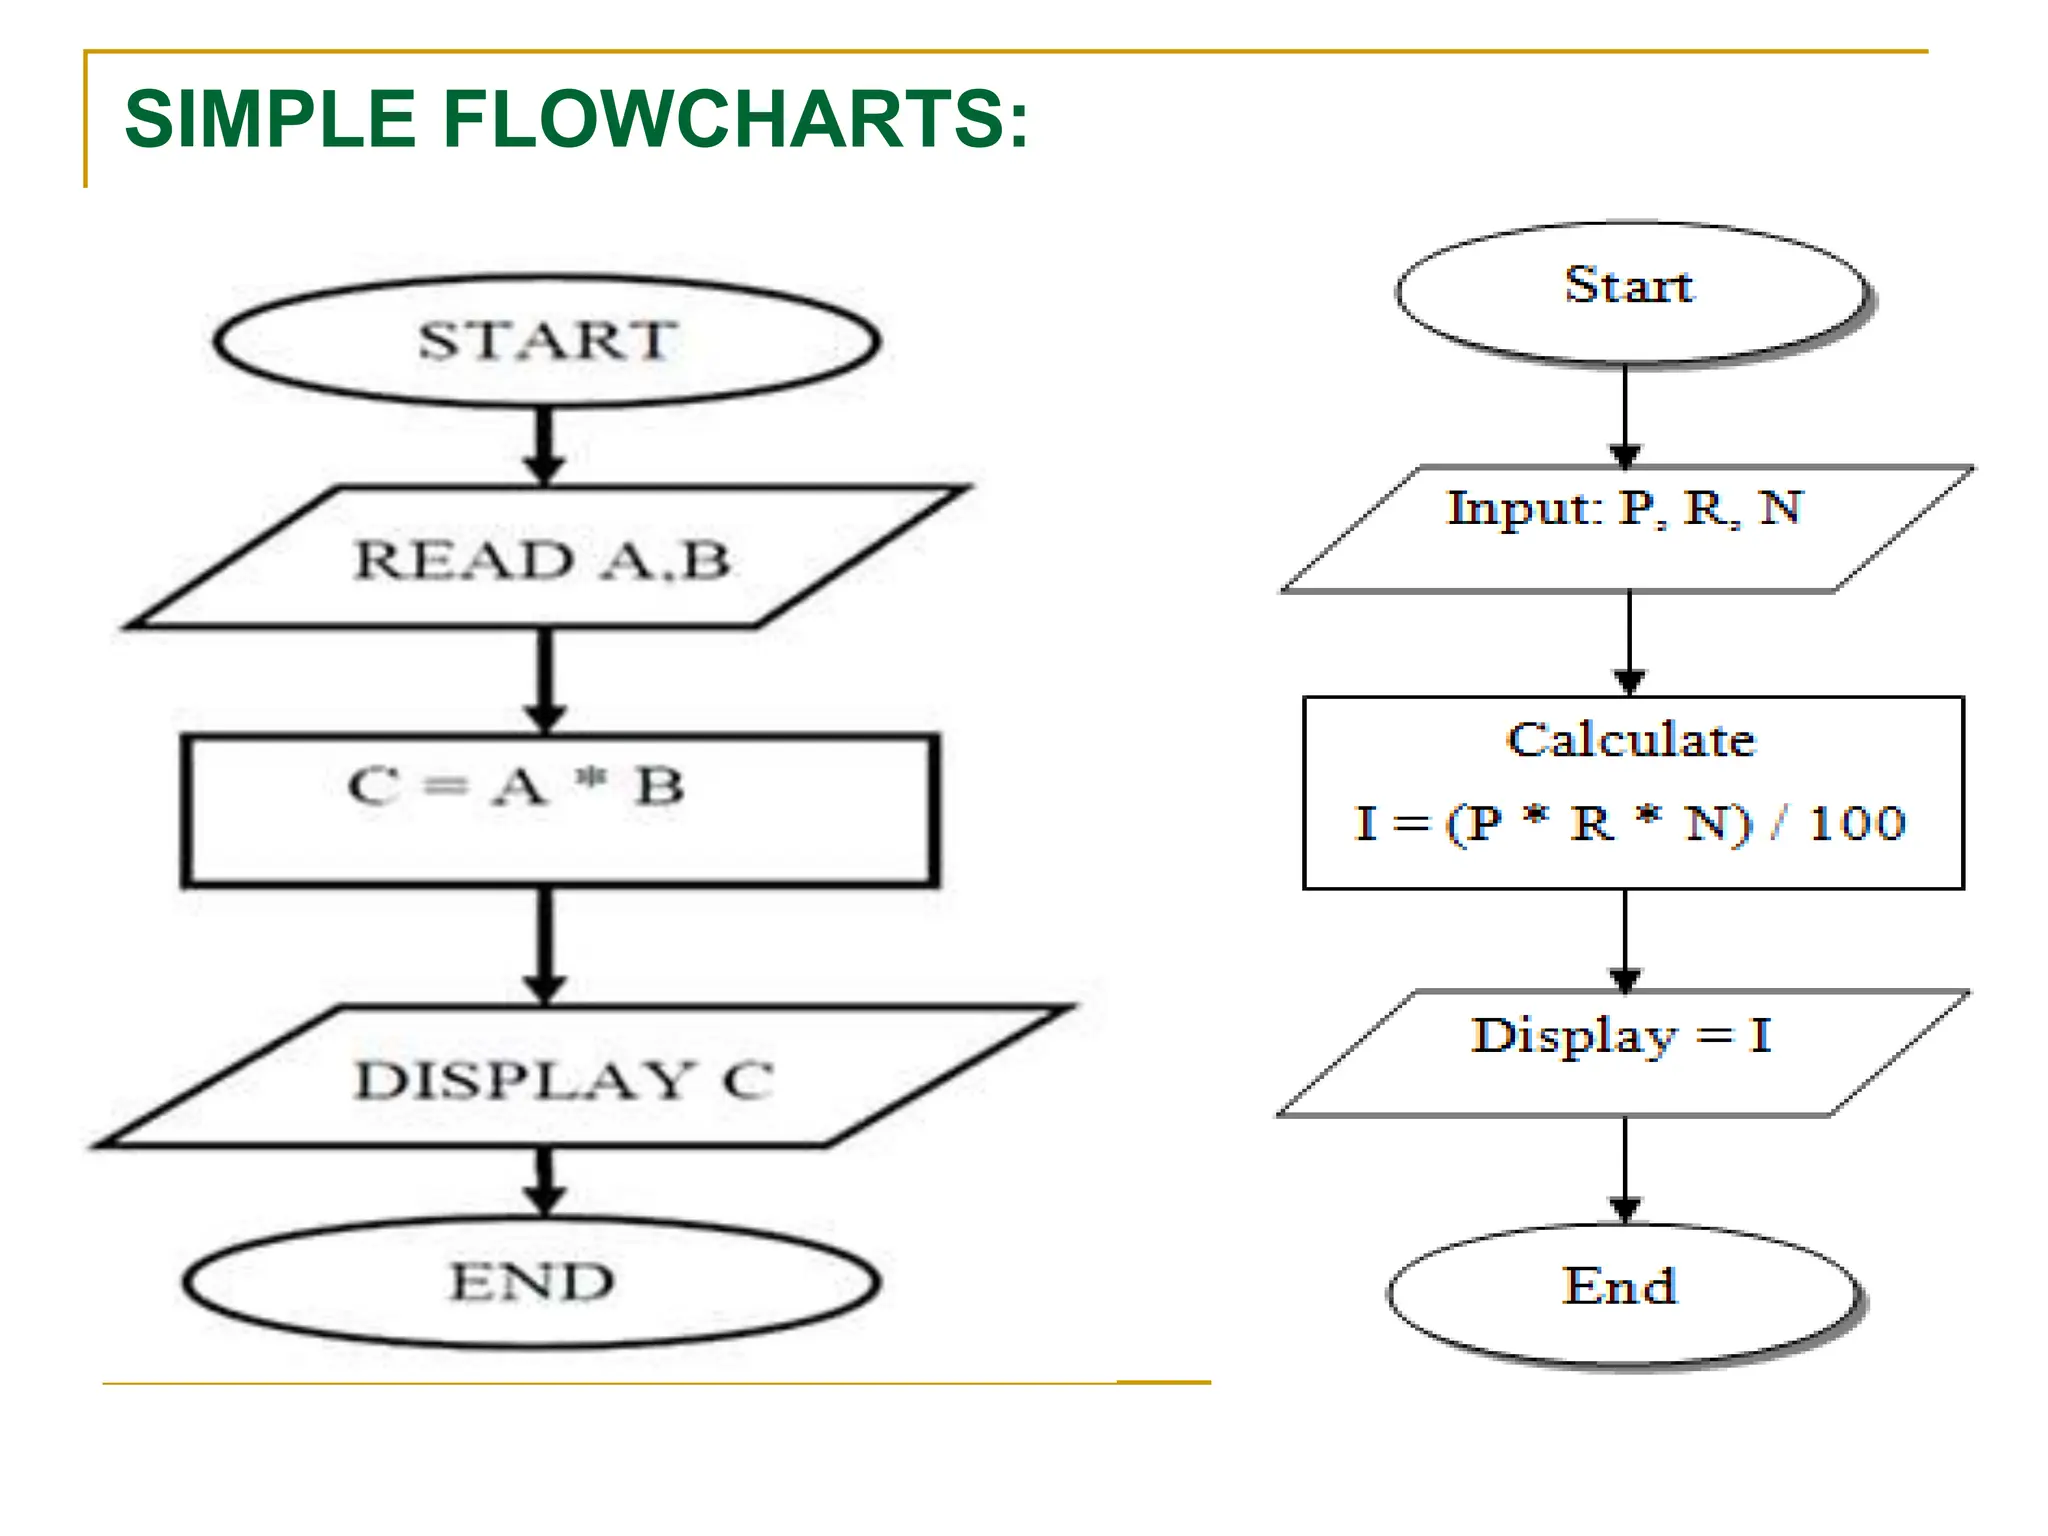
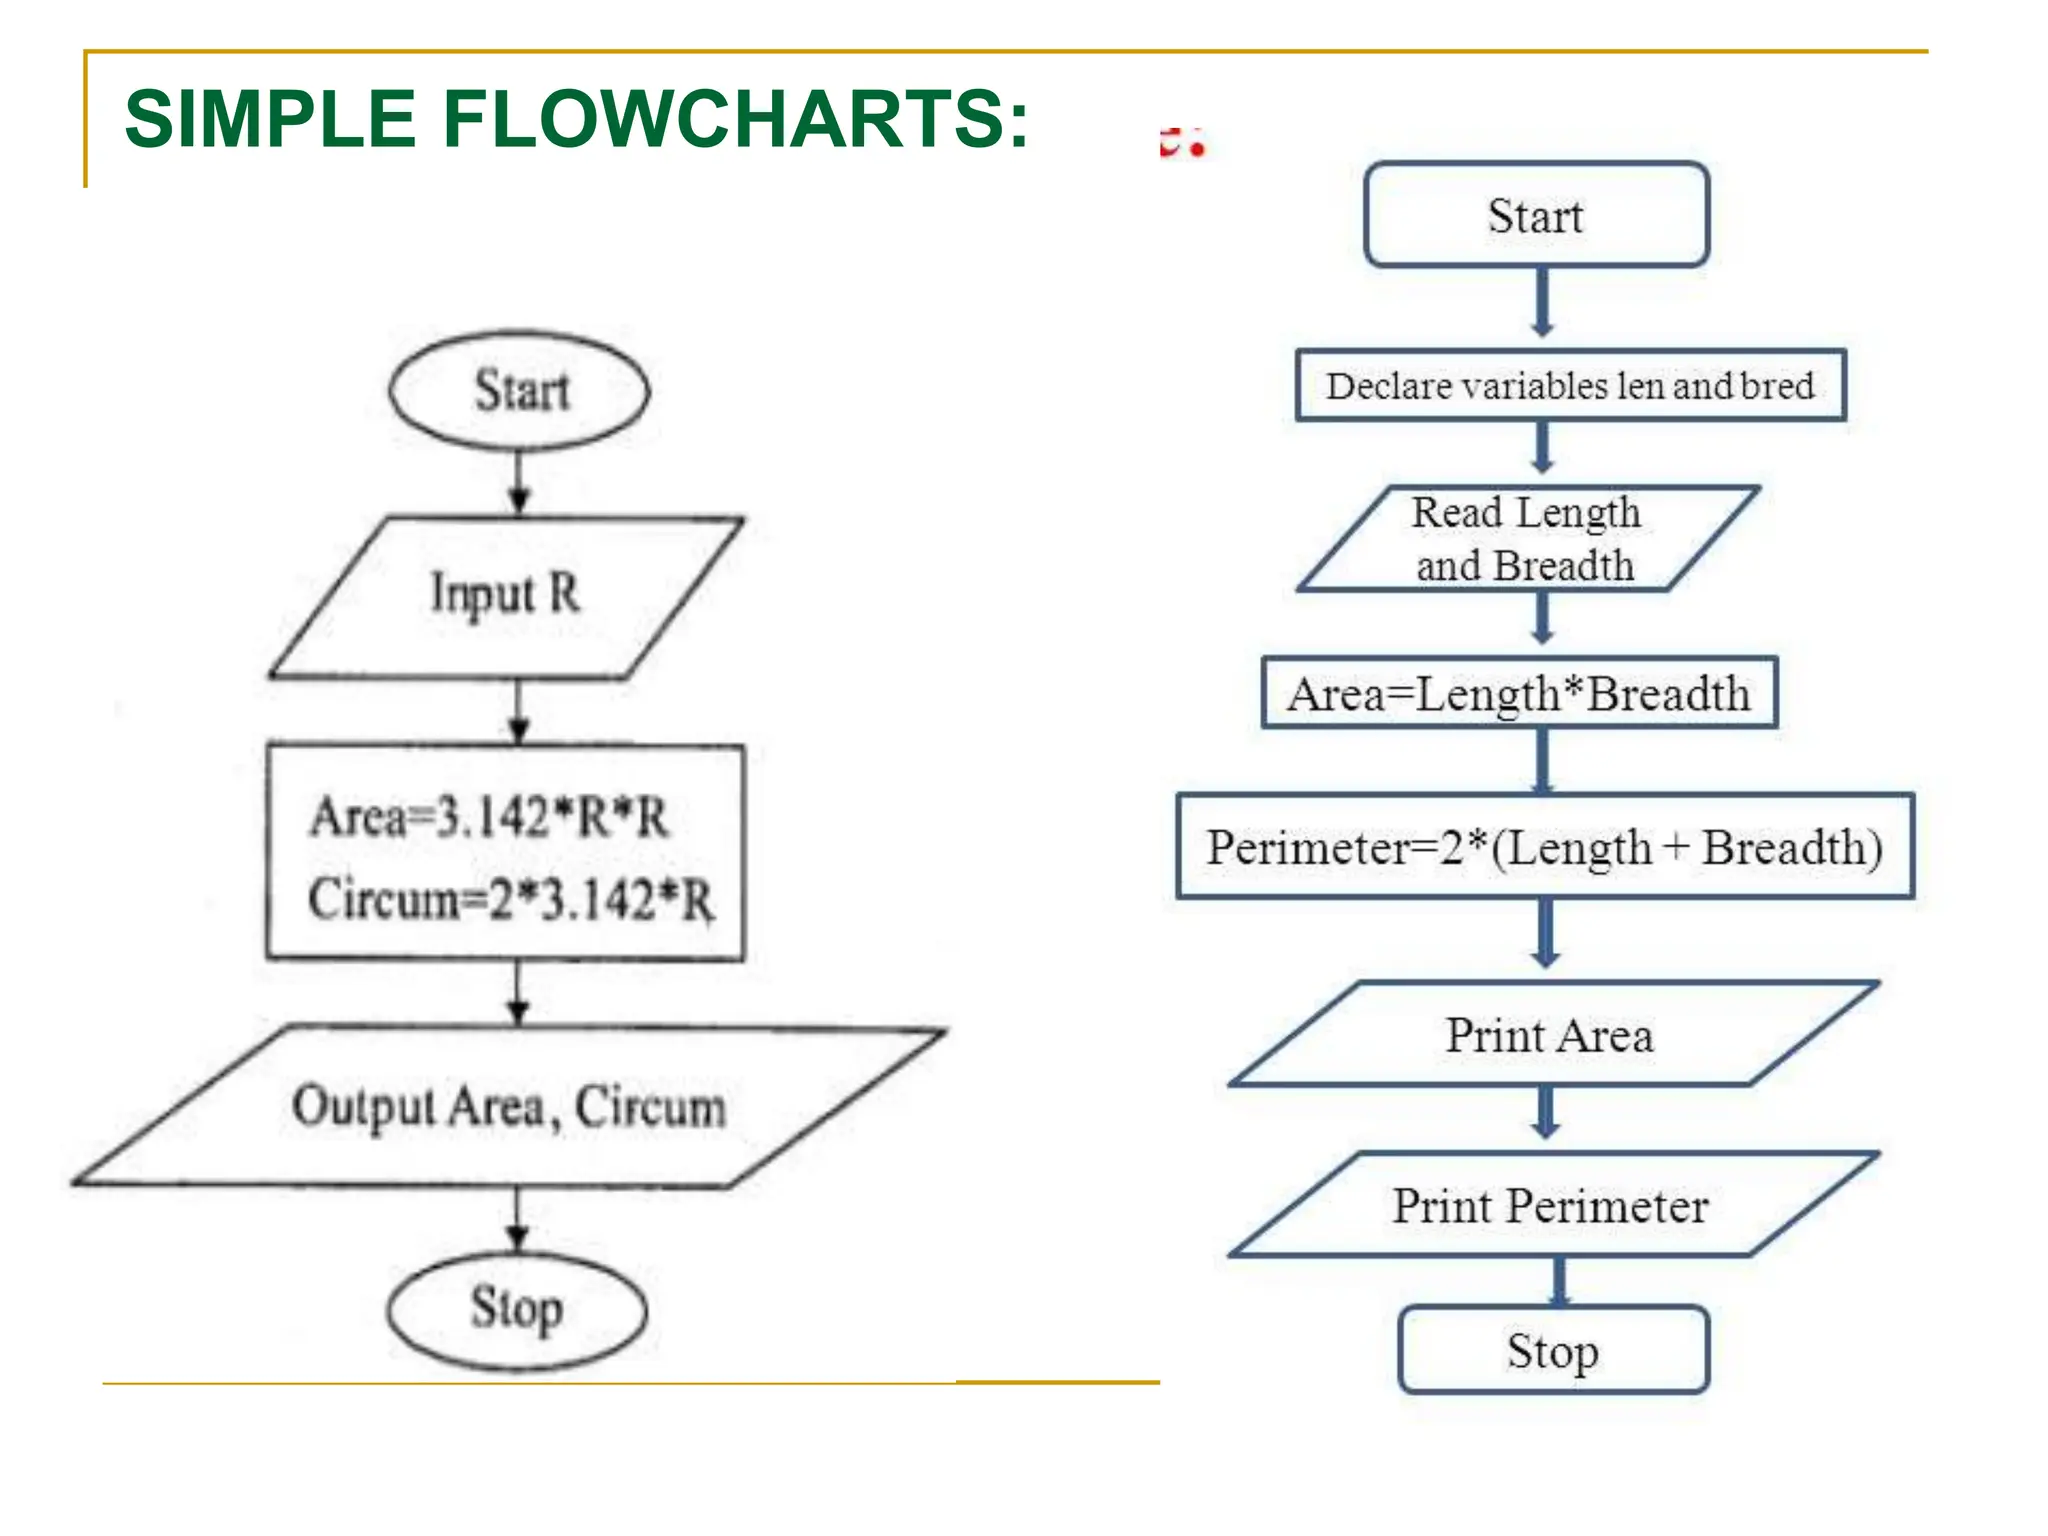
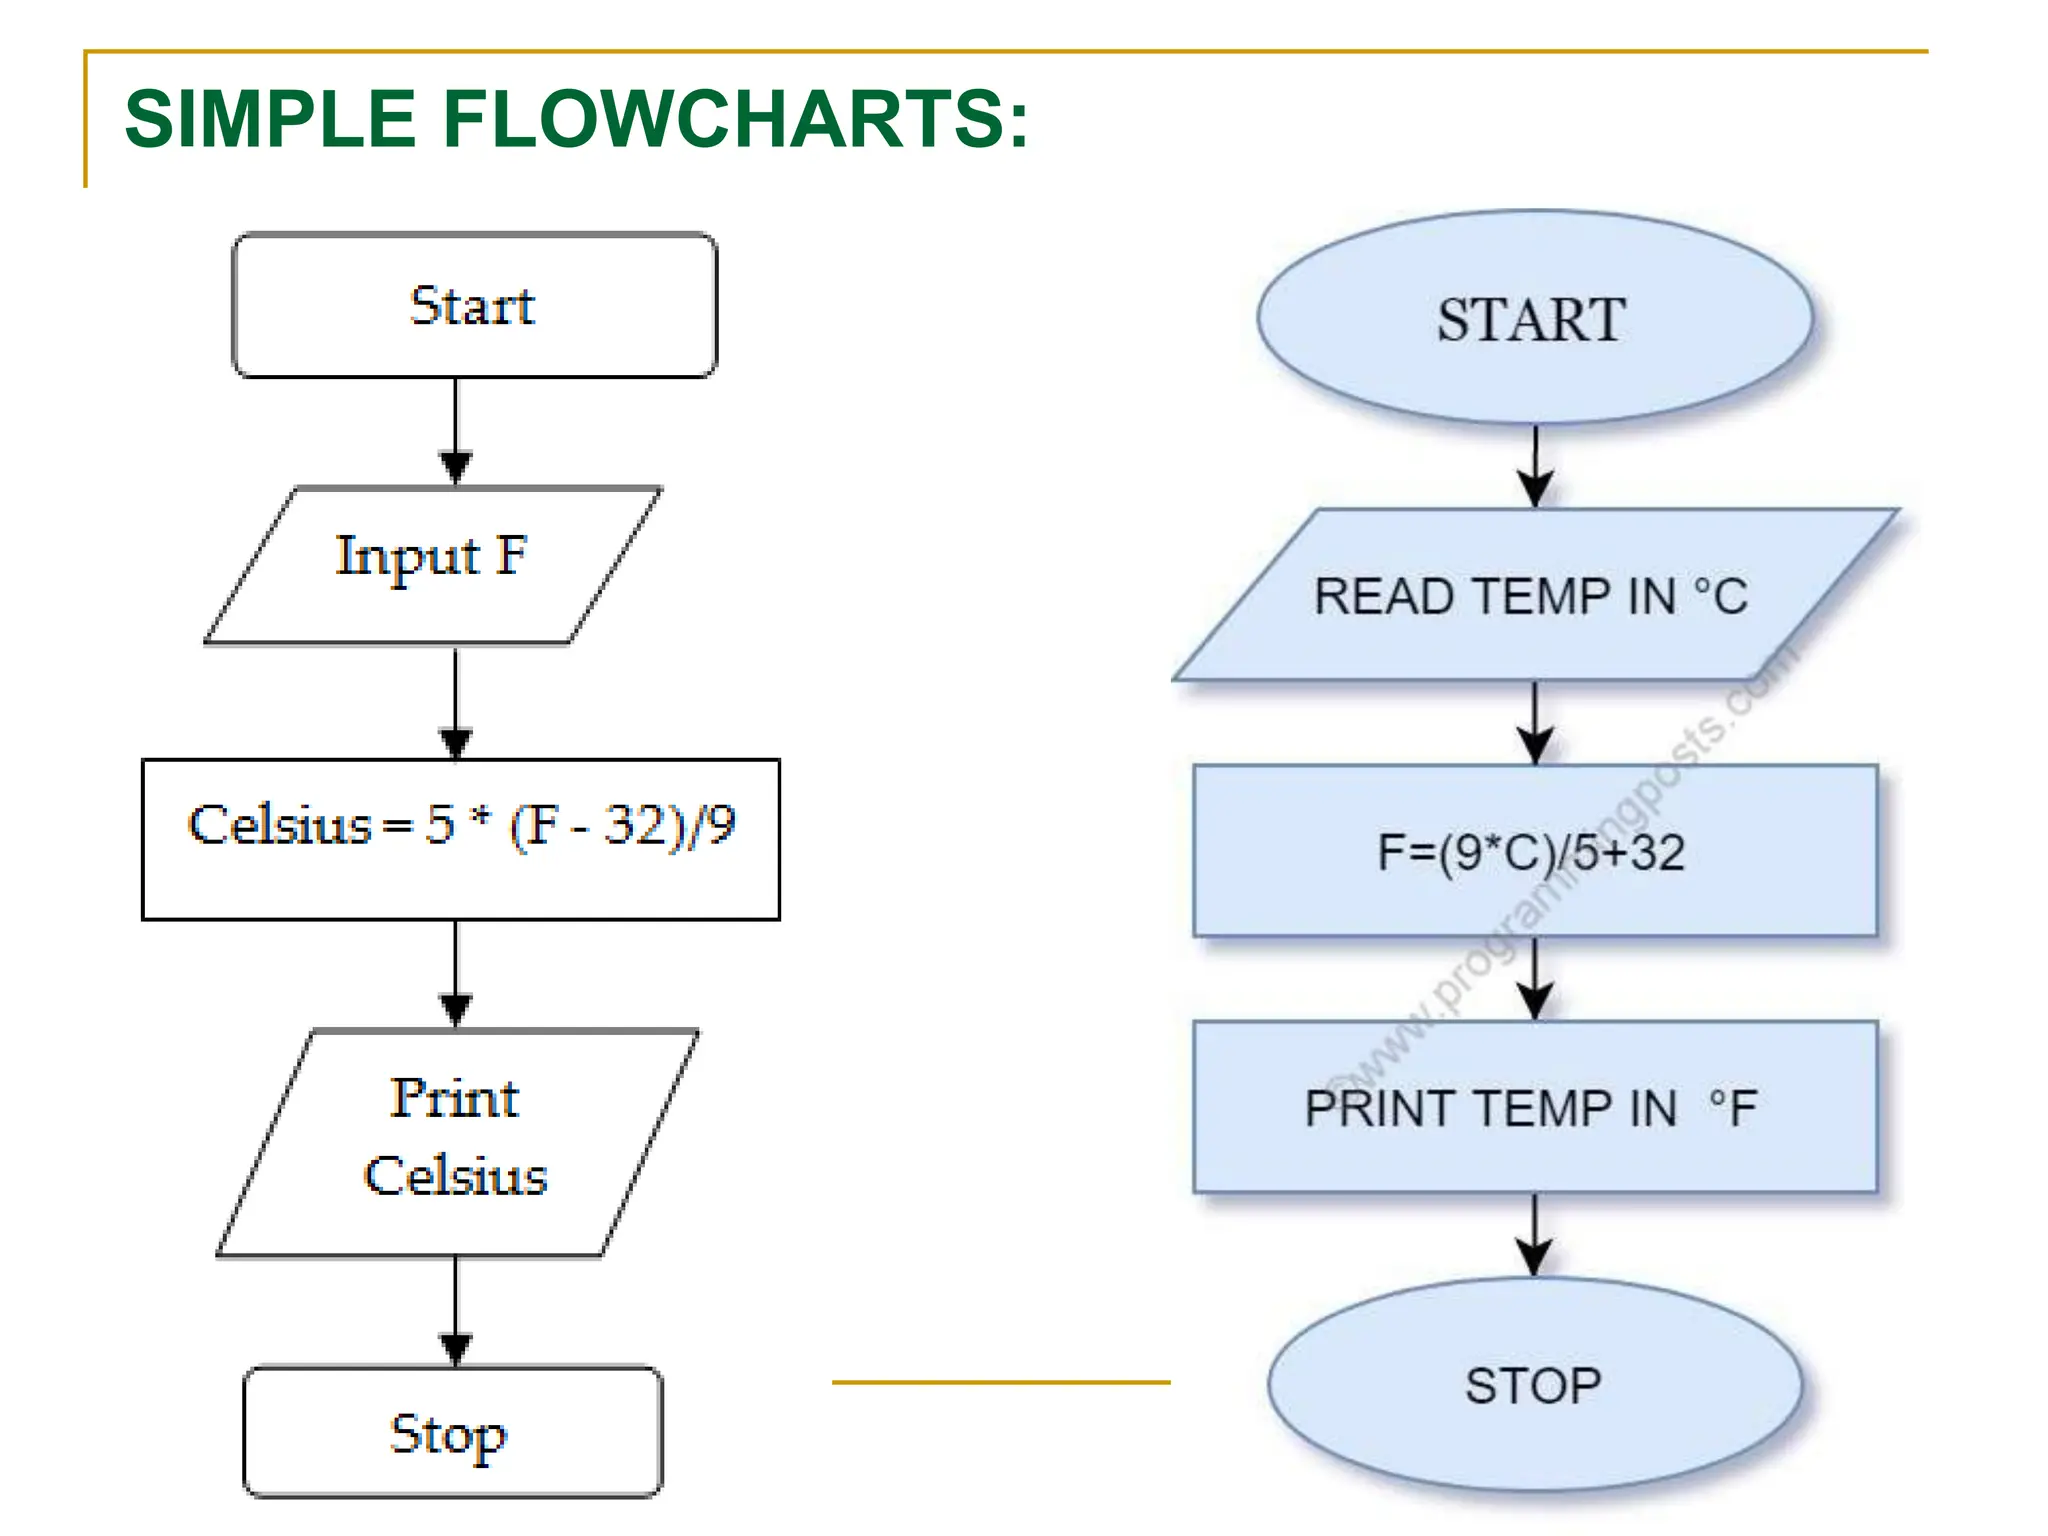
Multiple slides dedicated to illustrating simple flowchart examples.
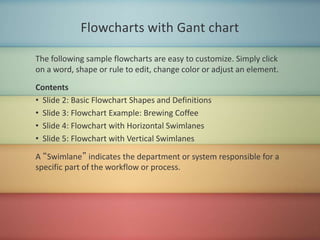
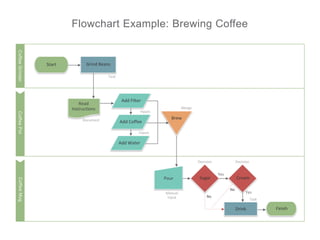
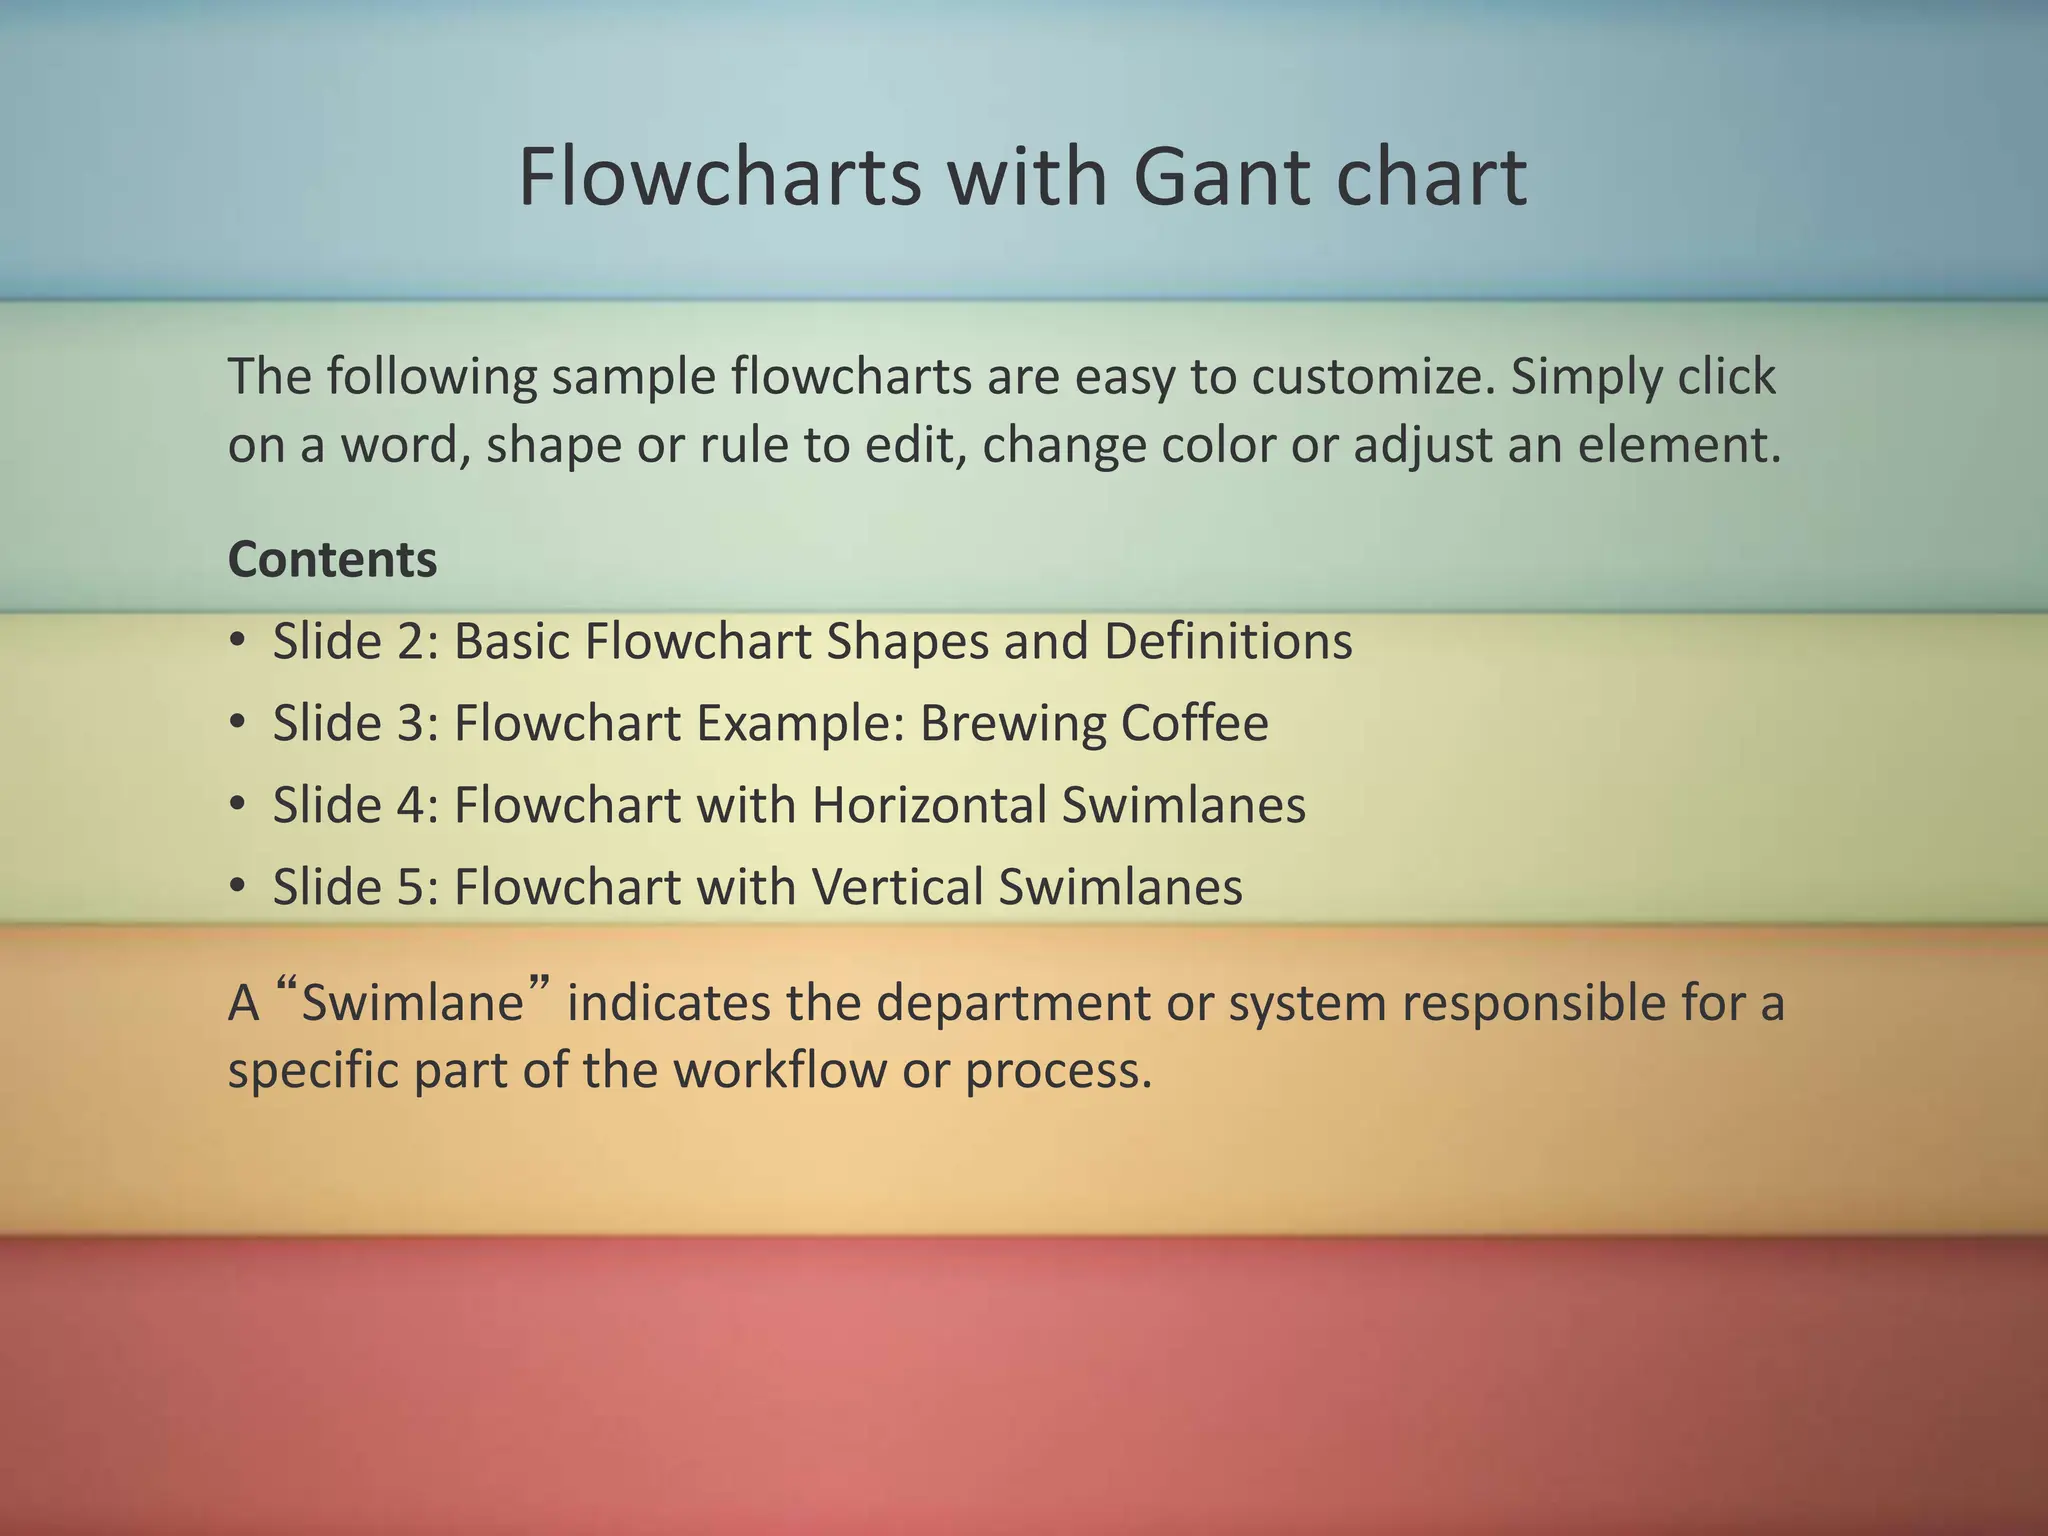
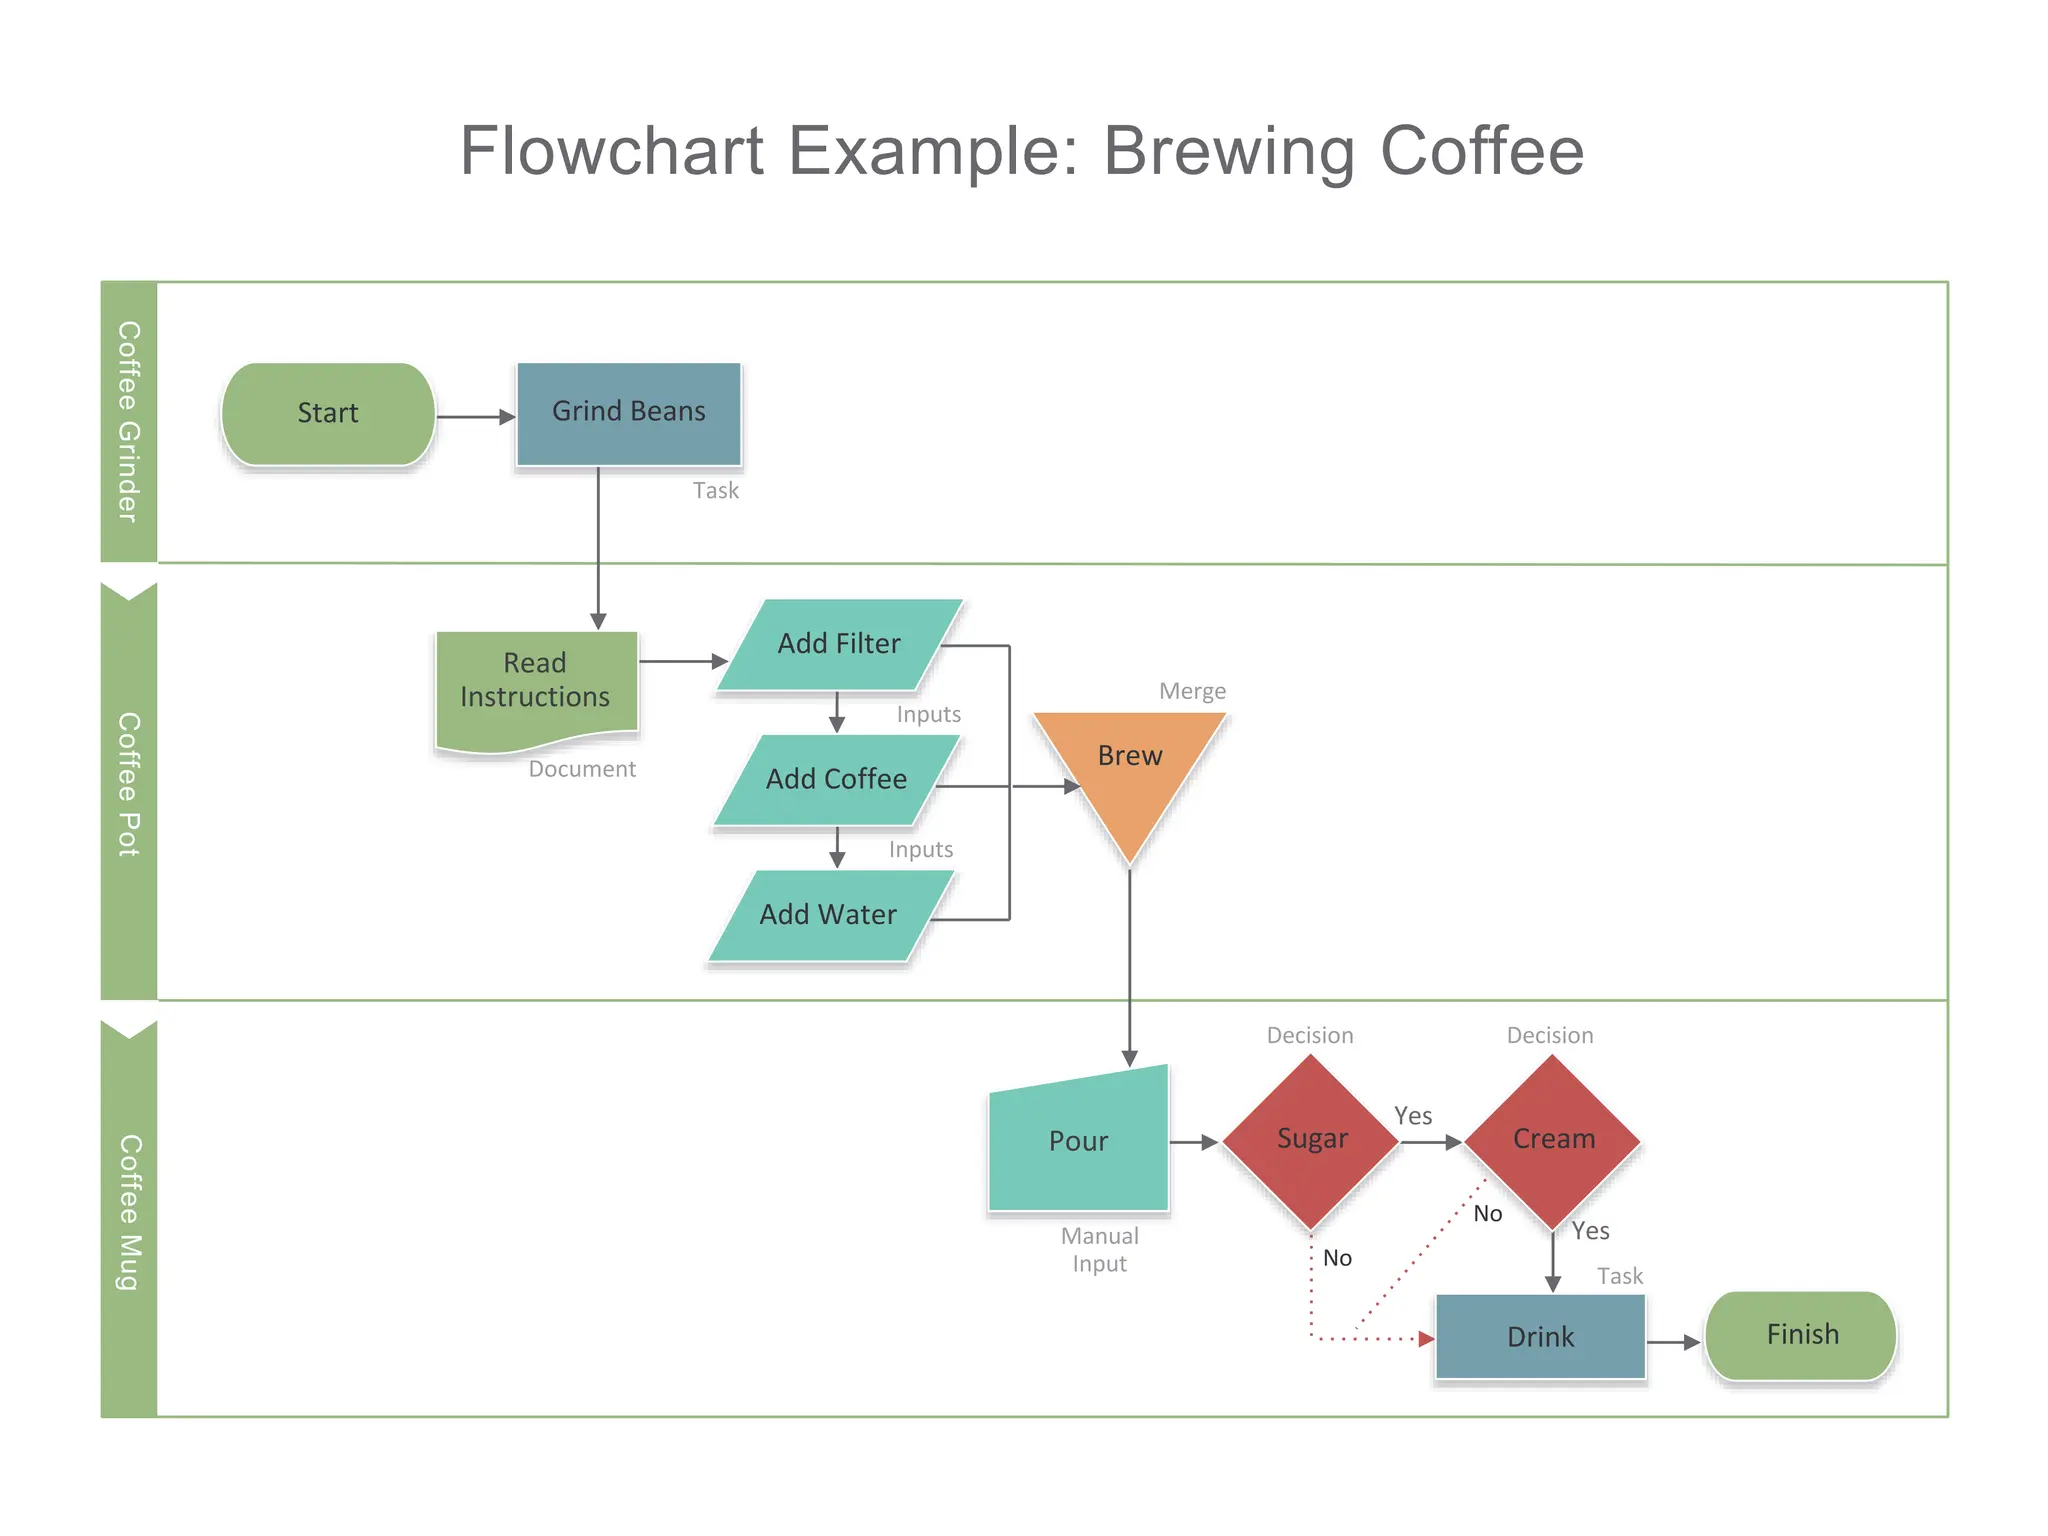
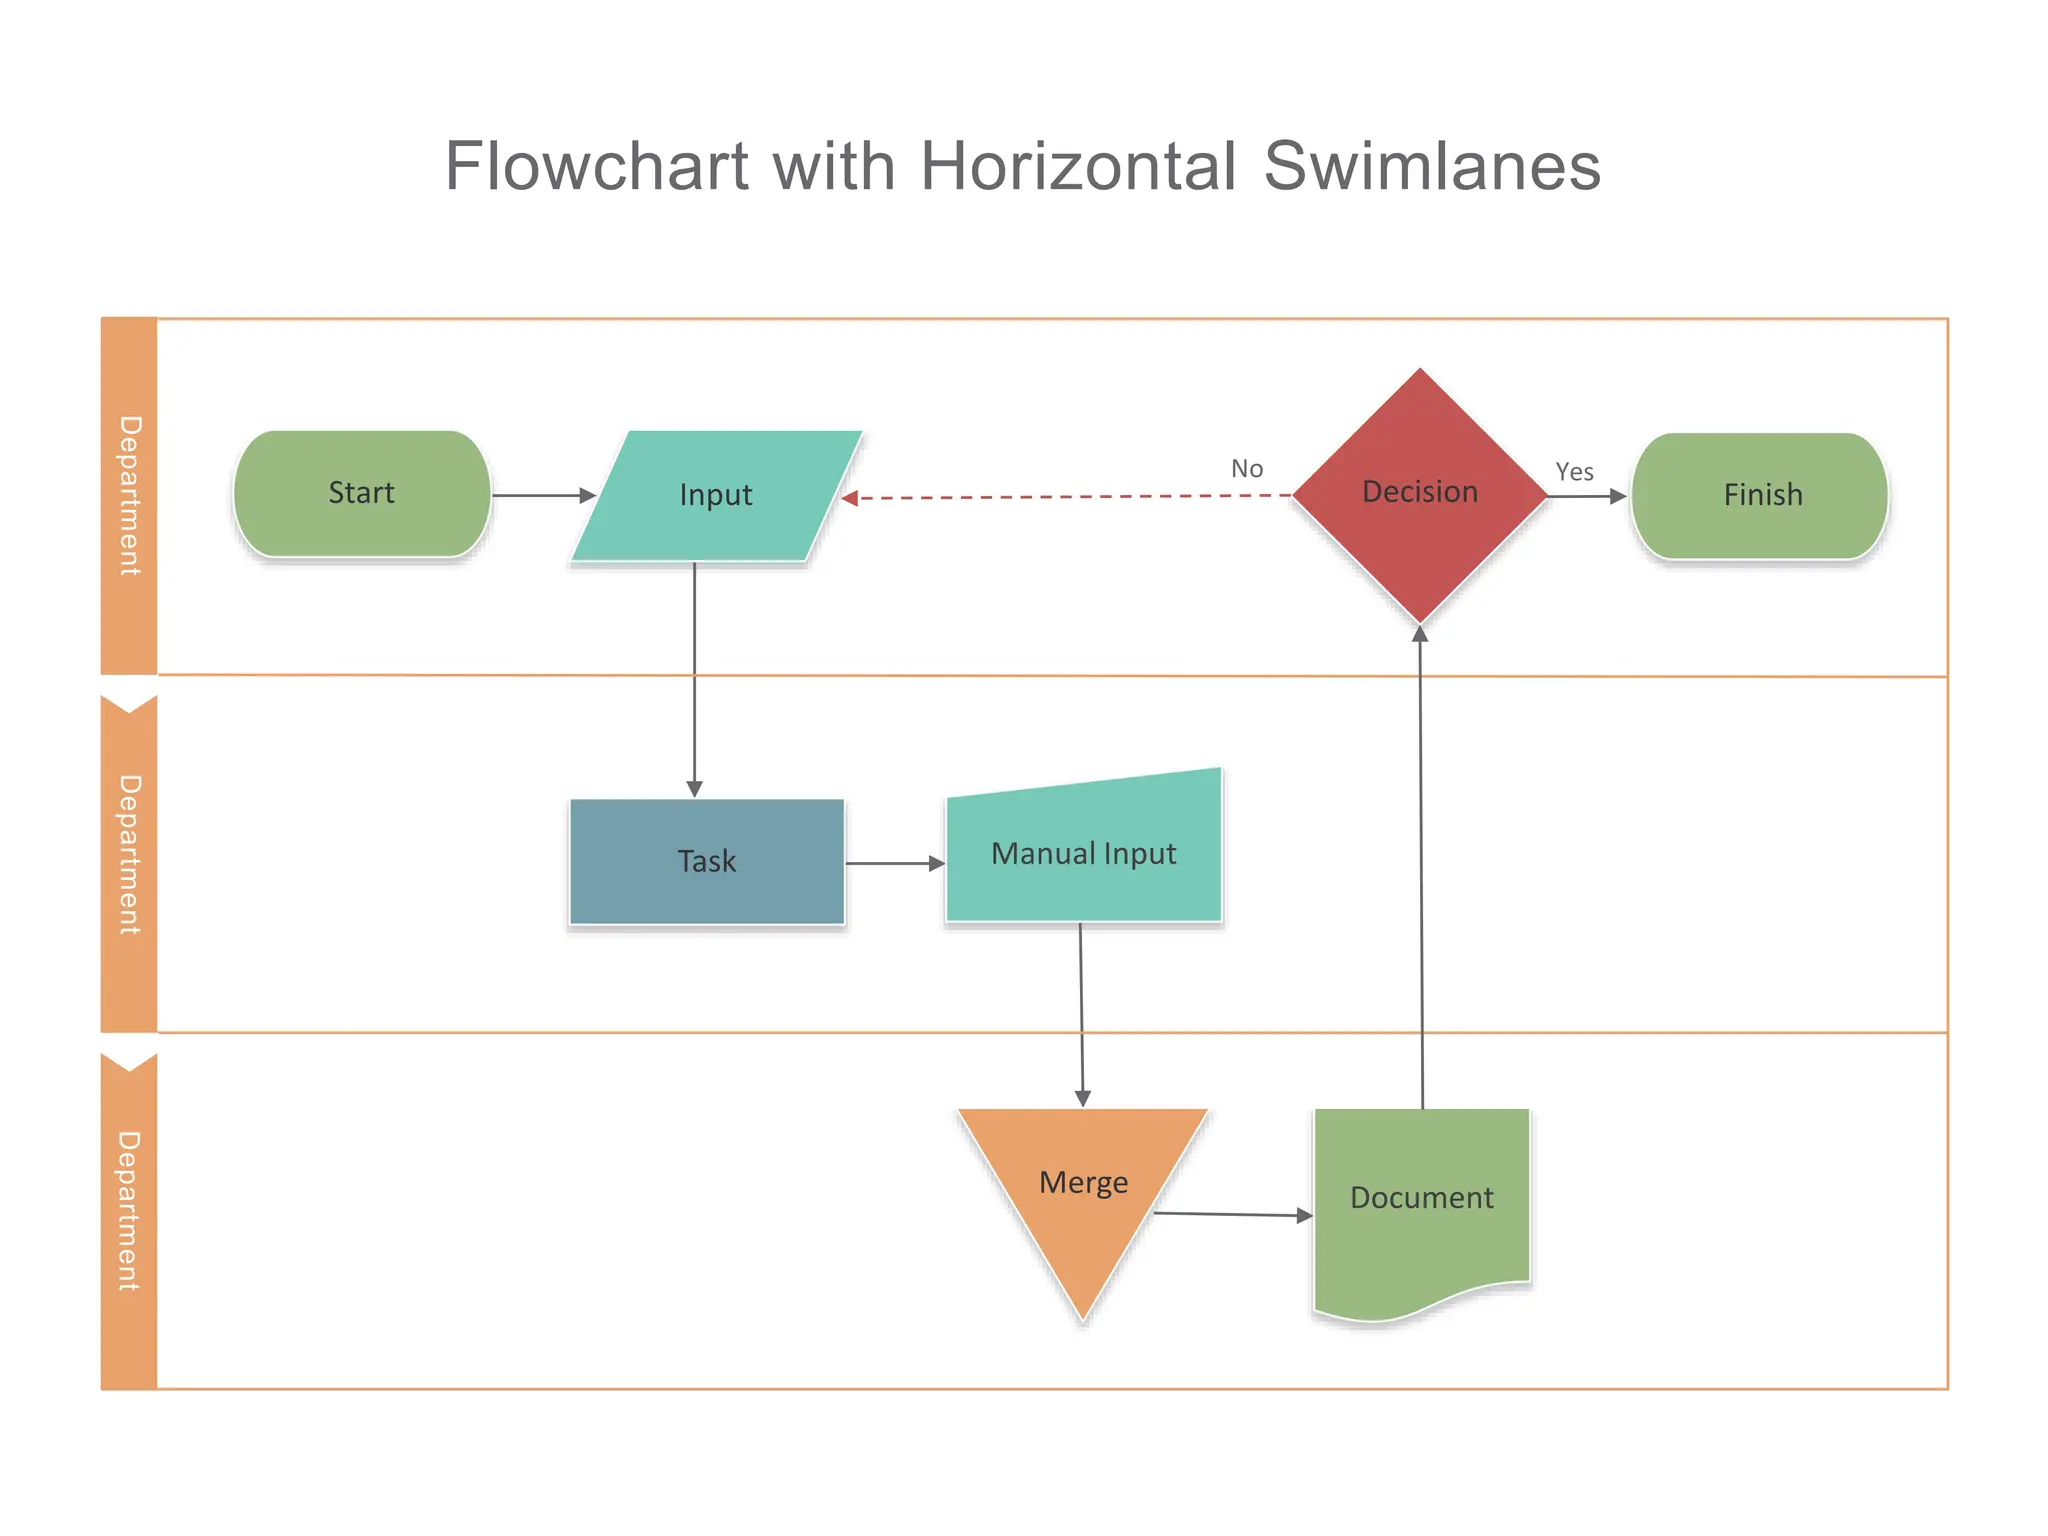
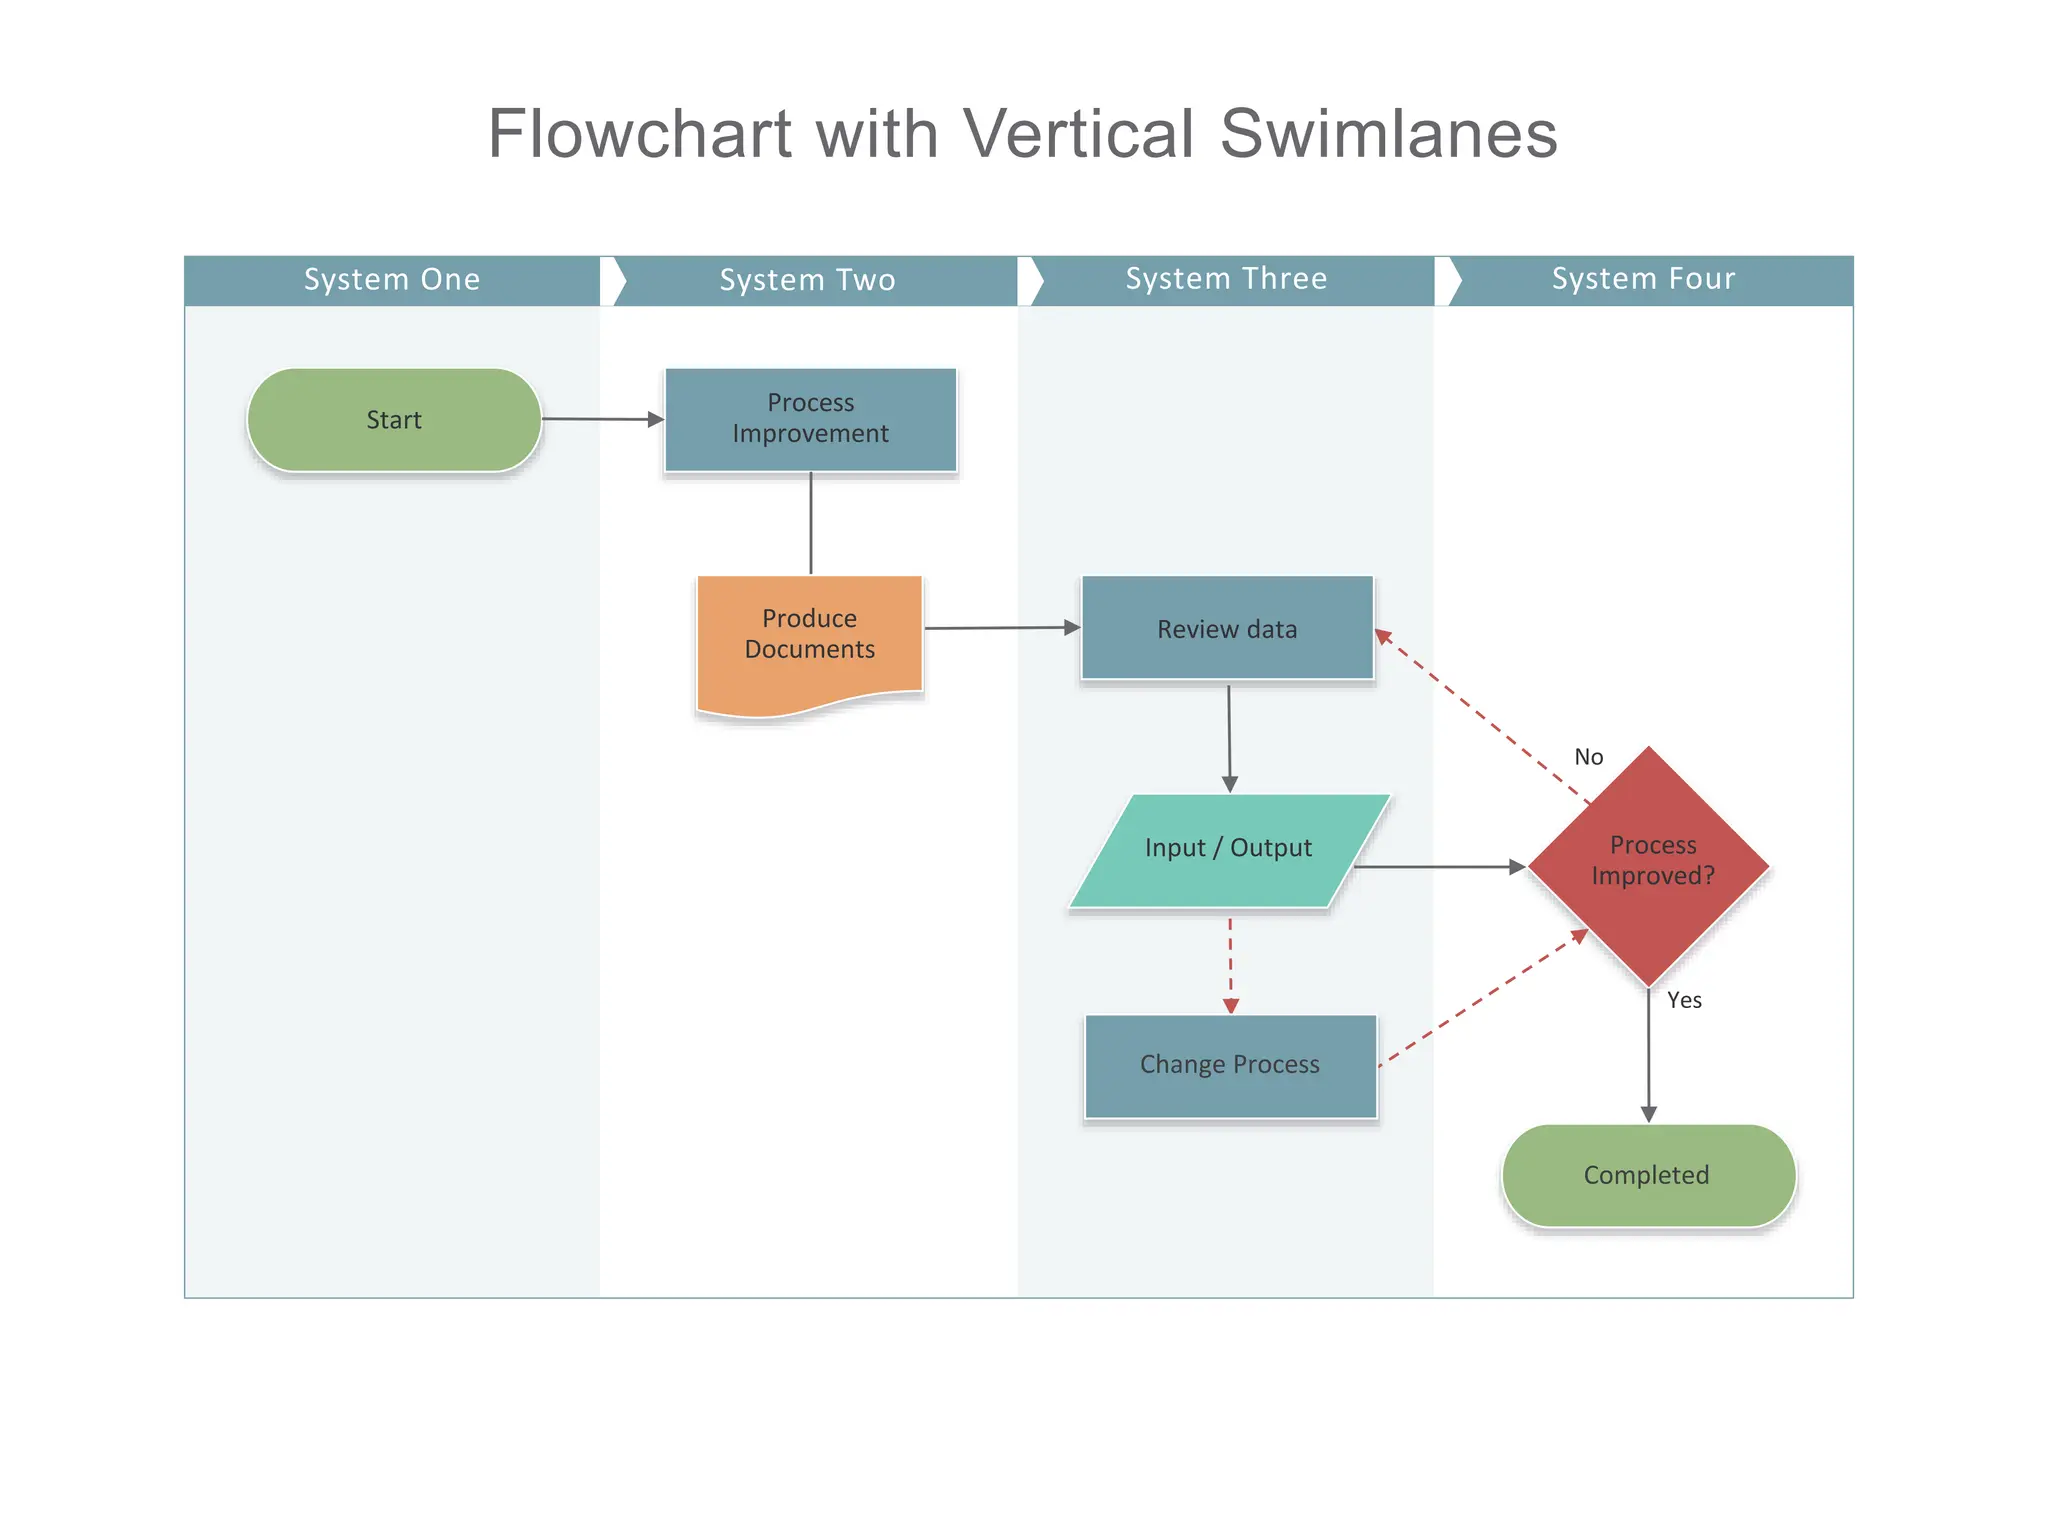
Examples of flowcharts with swimlanes and Gantt charts, indicating responsibility for specific workflow parts.
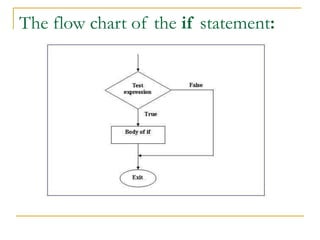
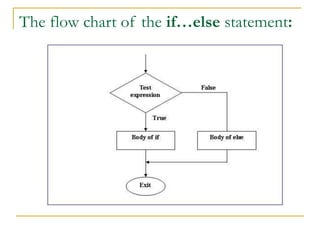
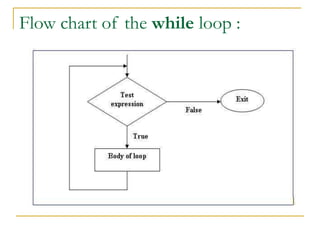
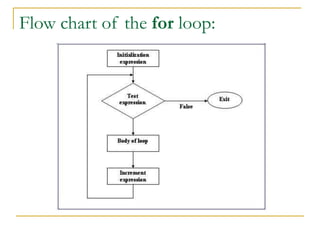
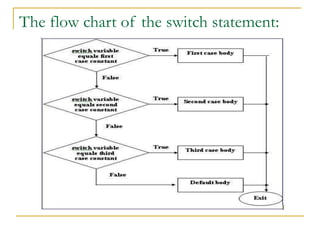
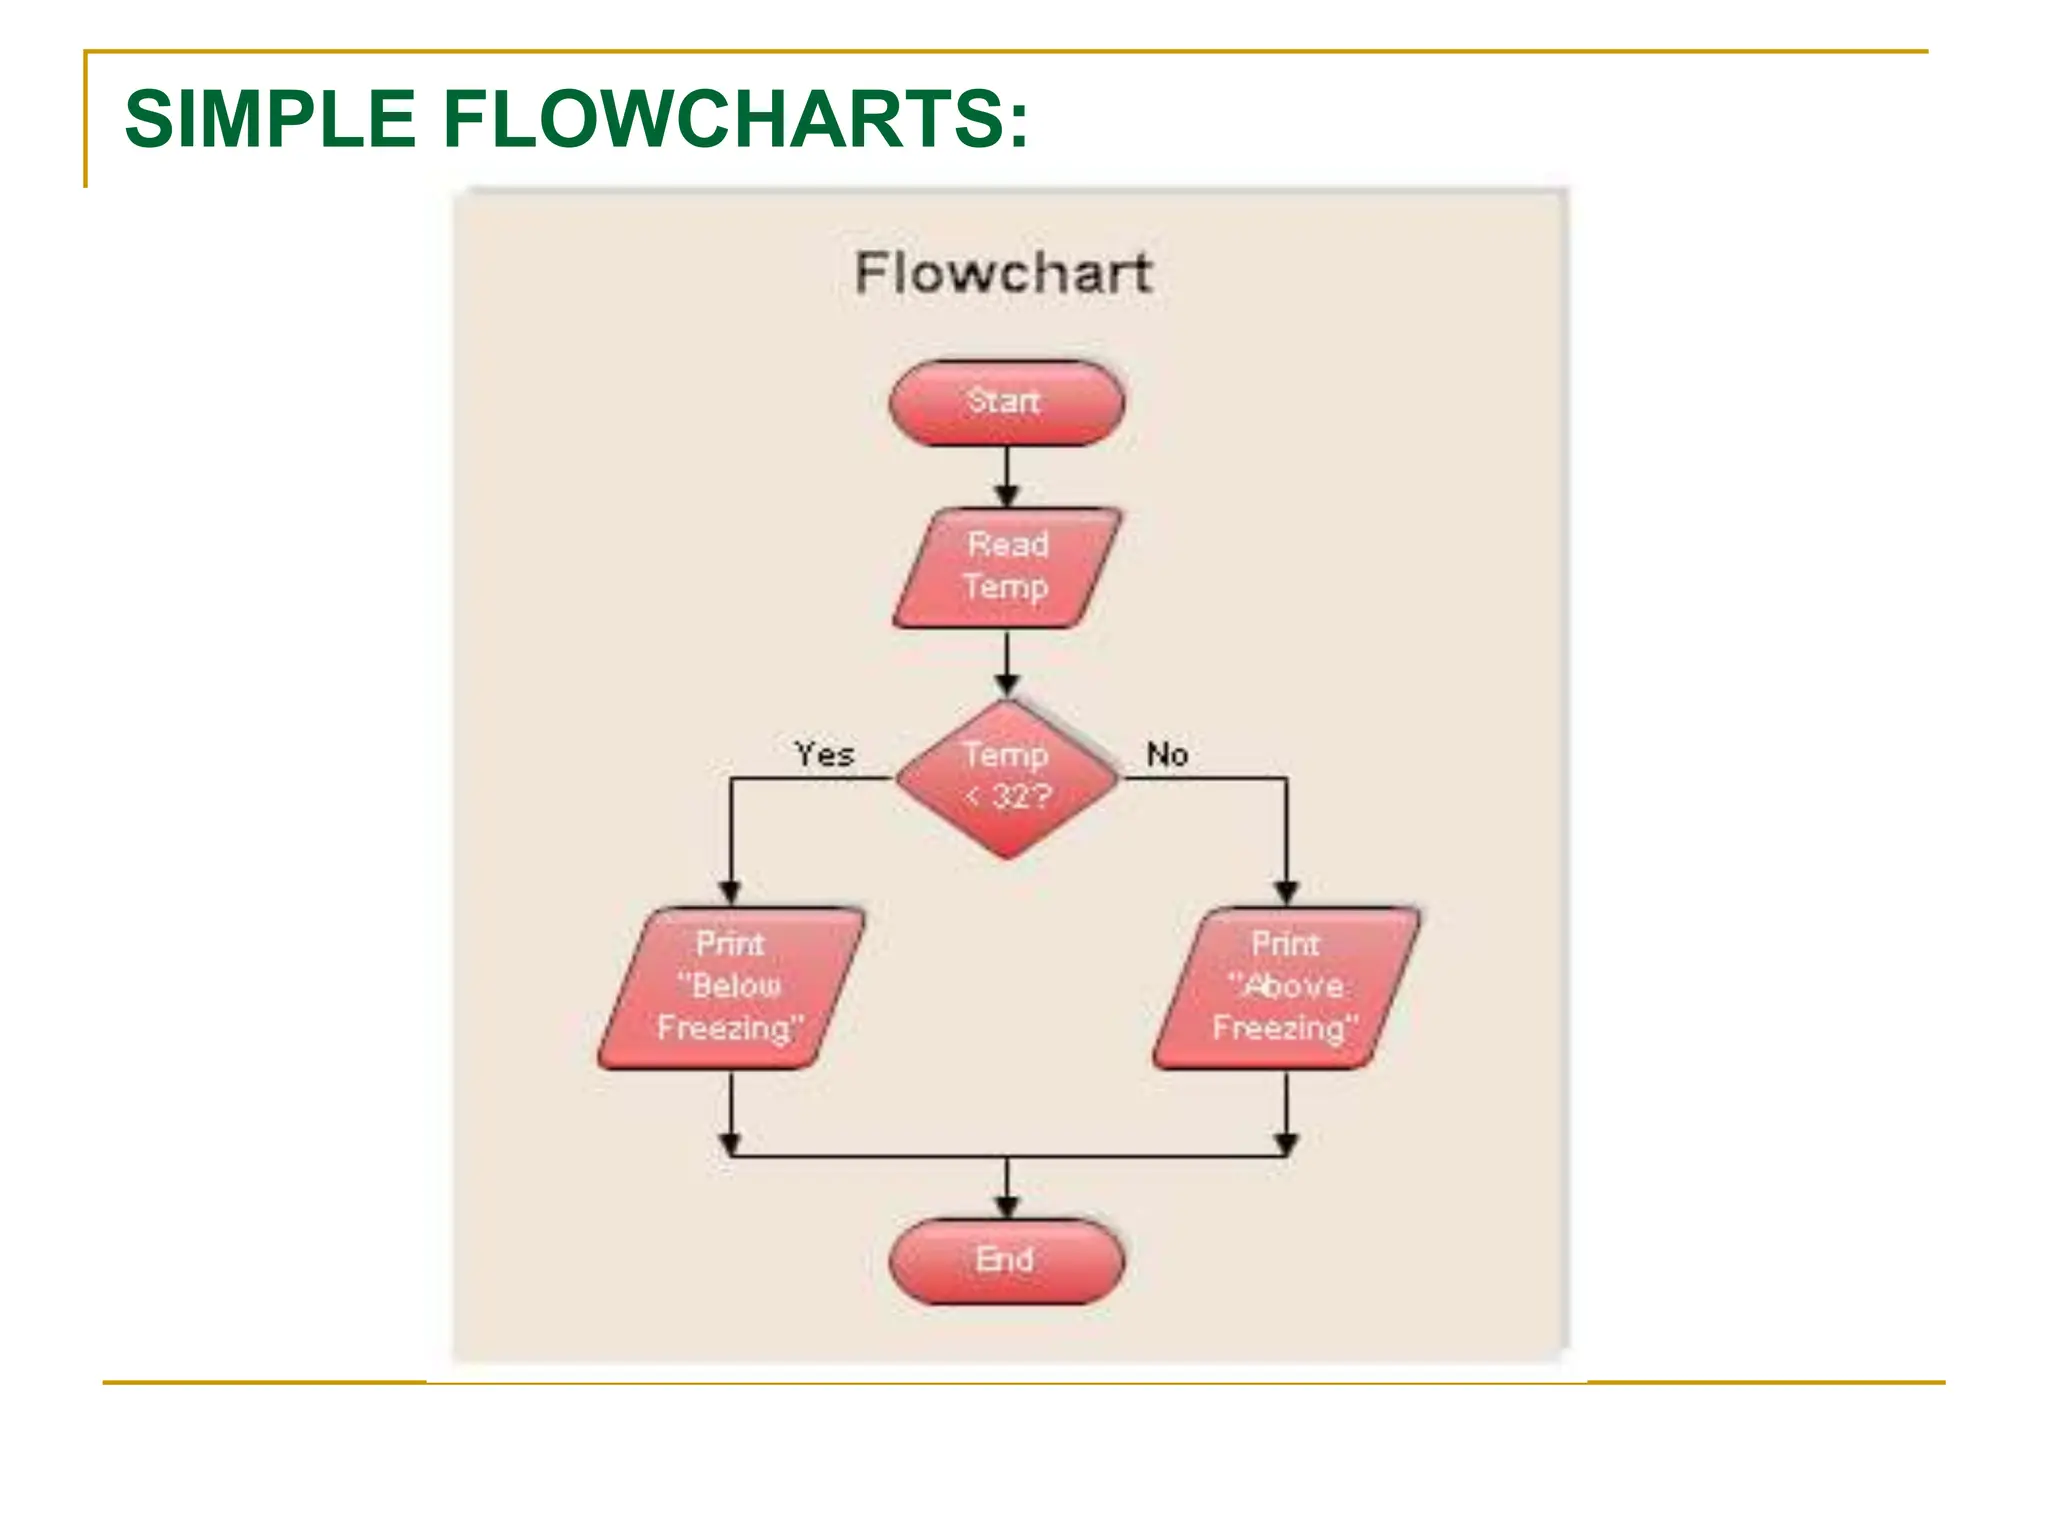
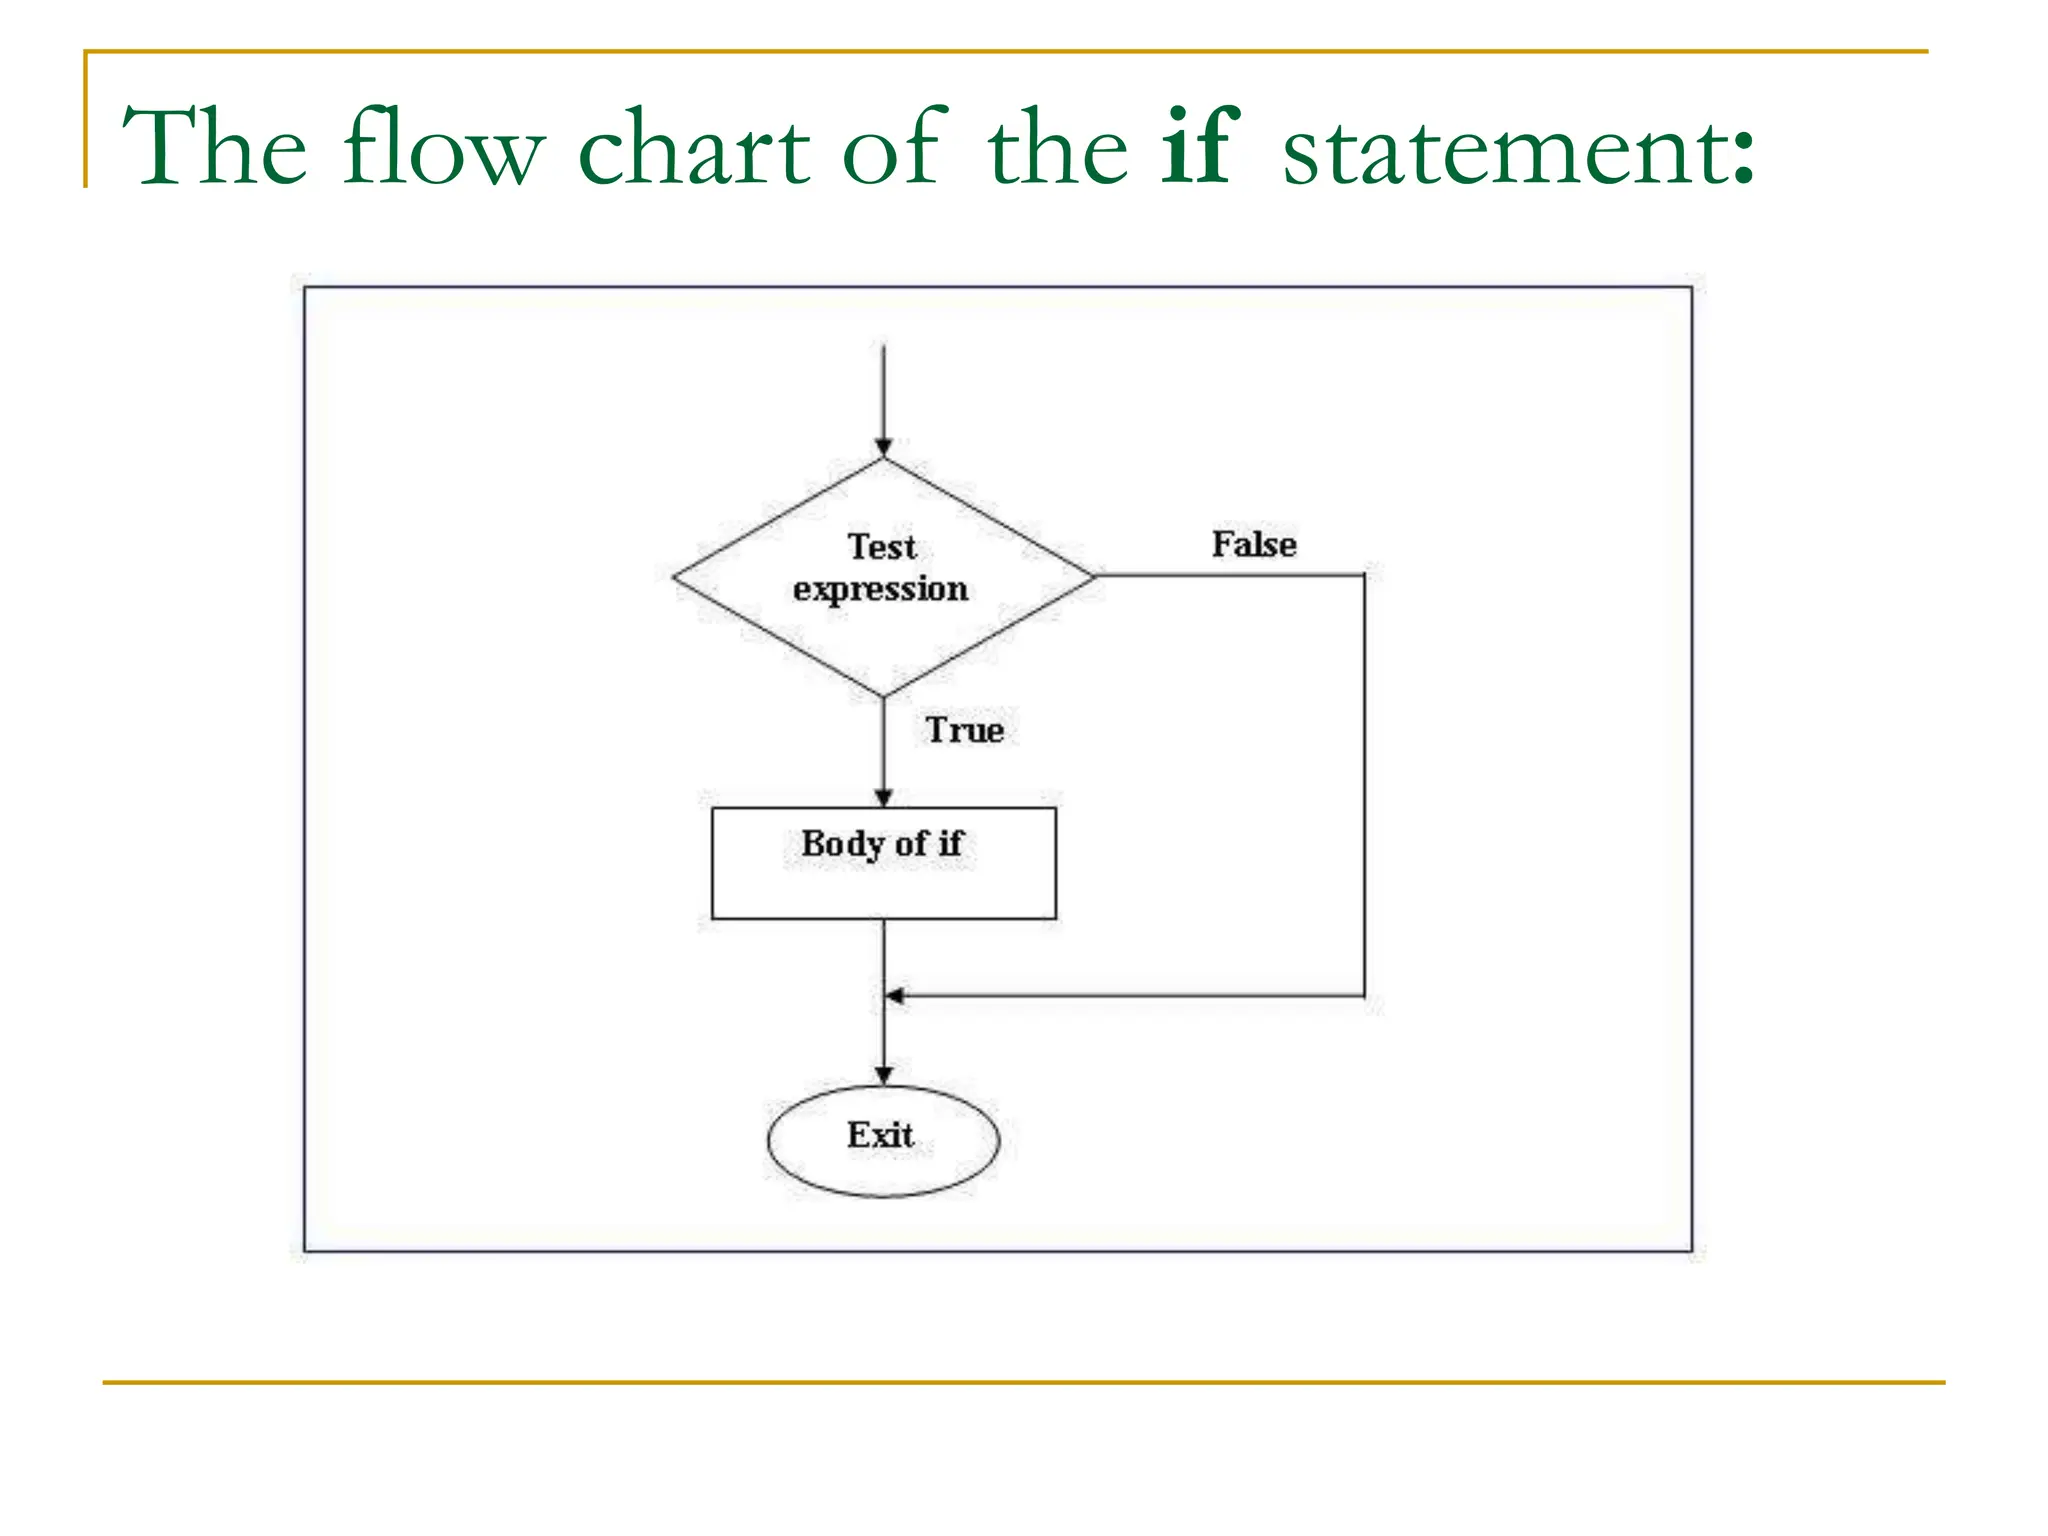
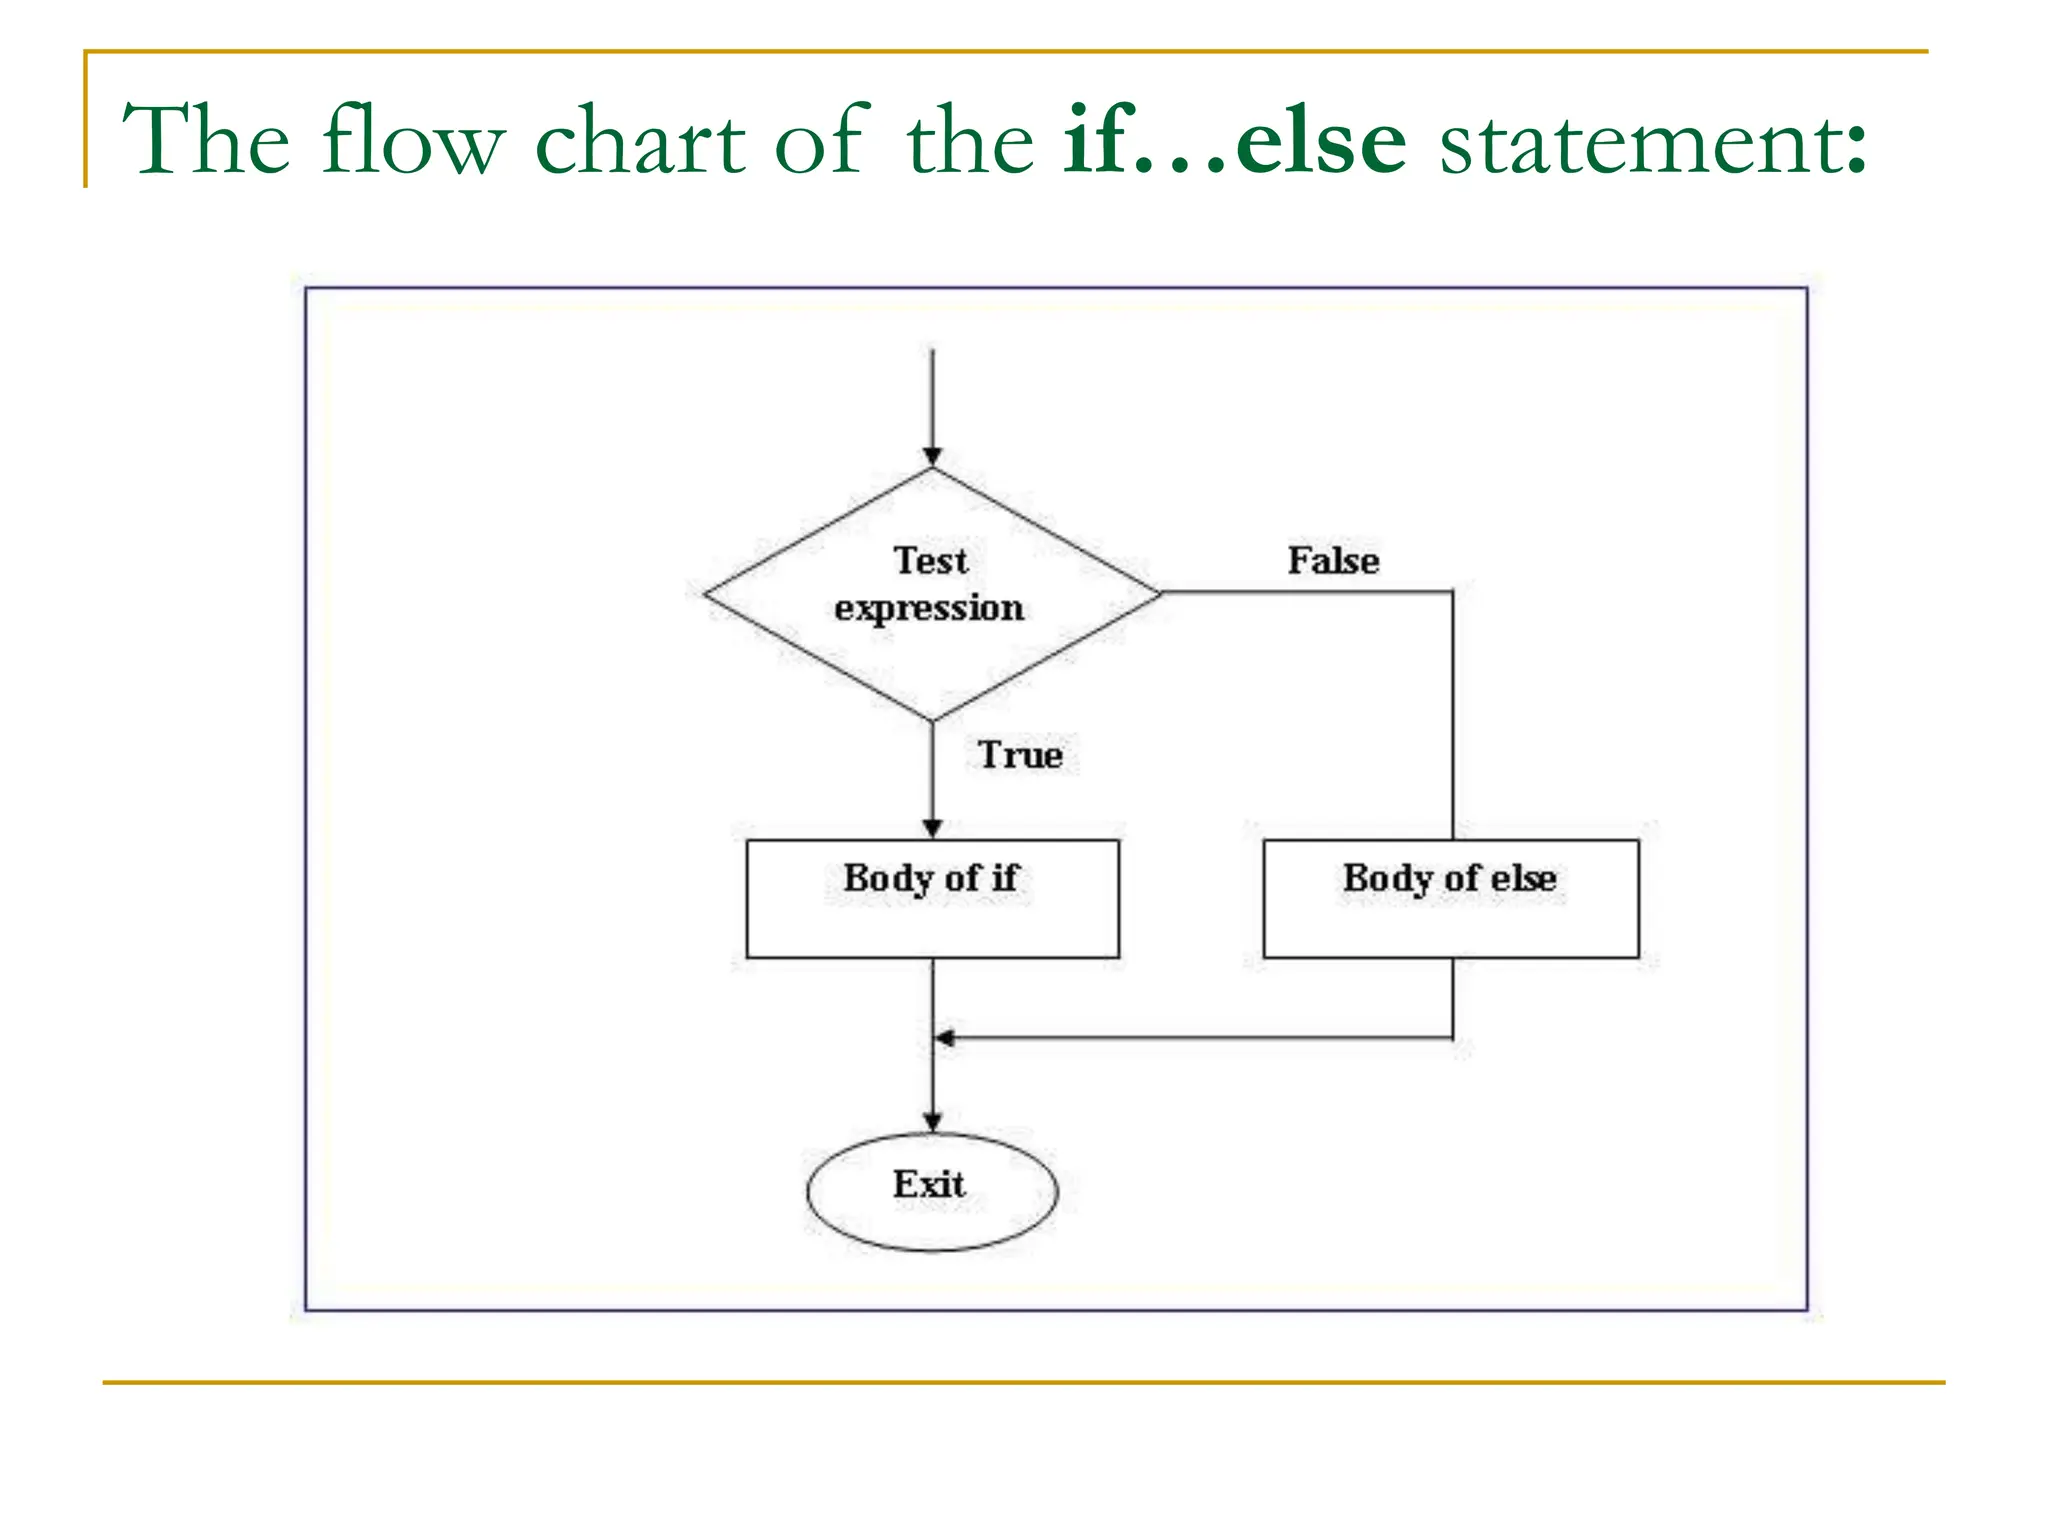
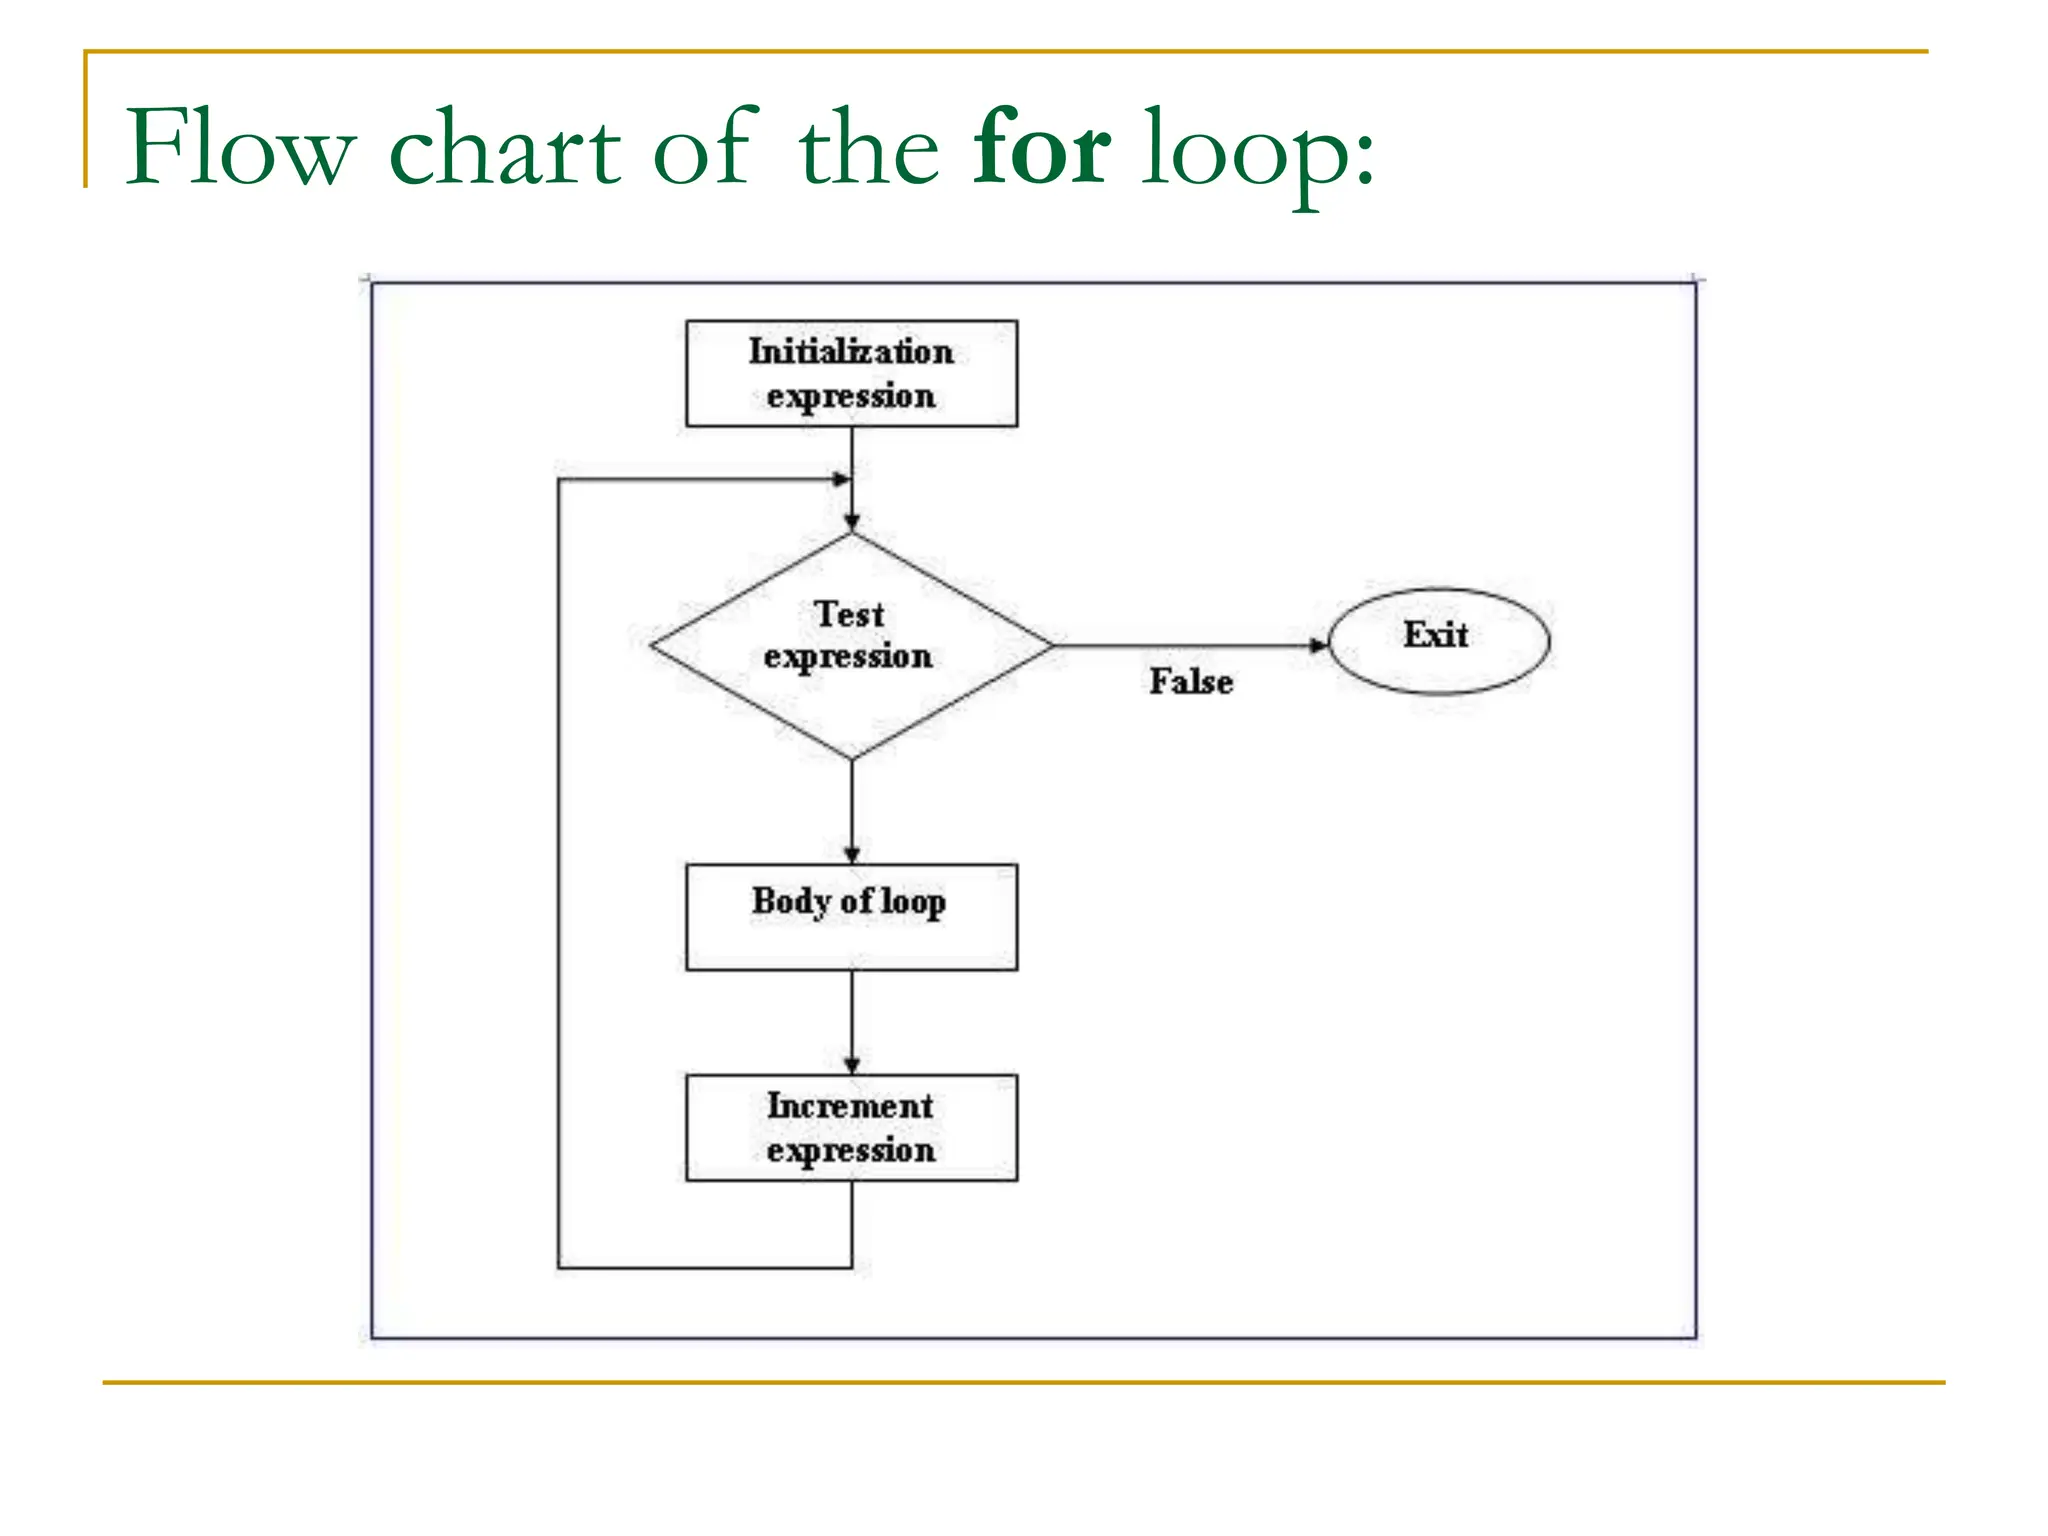
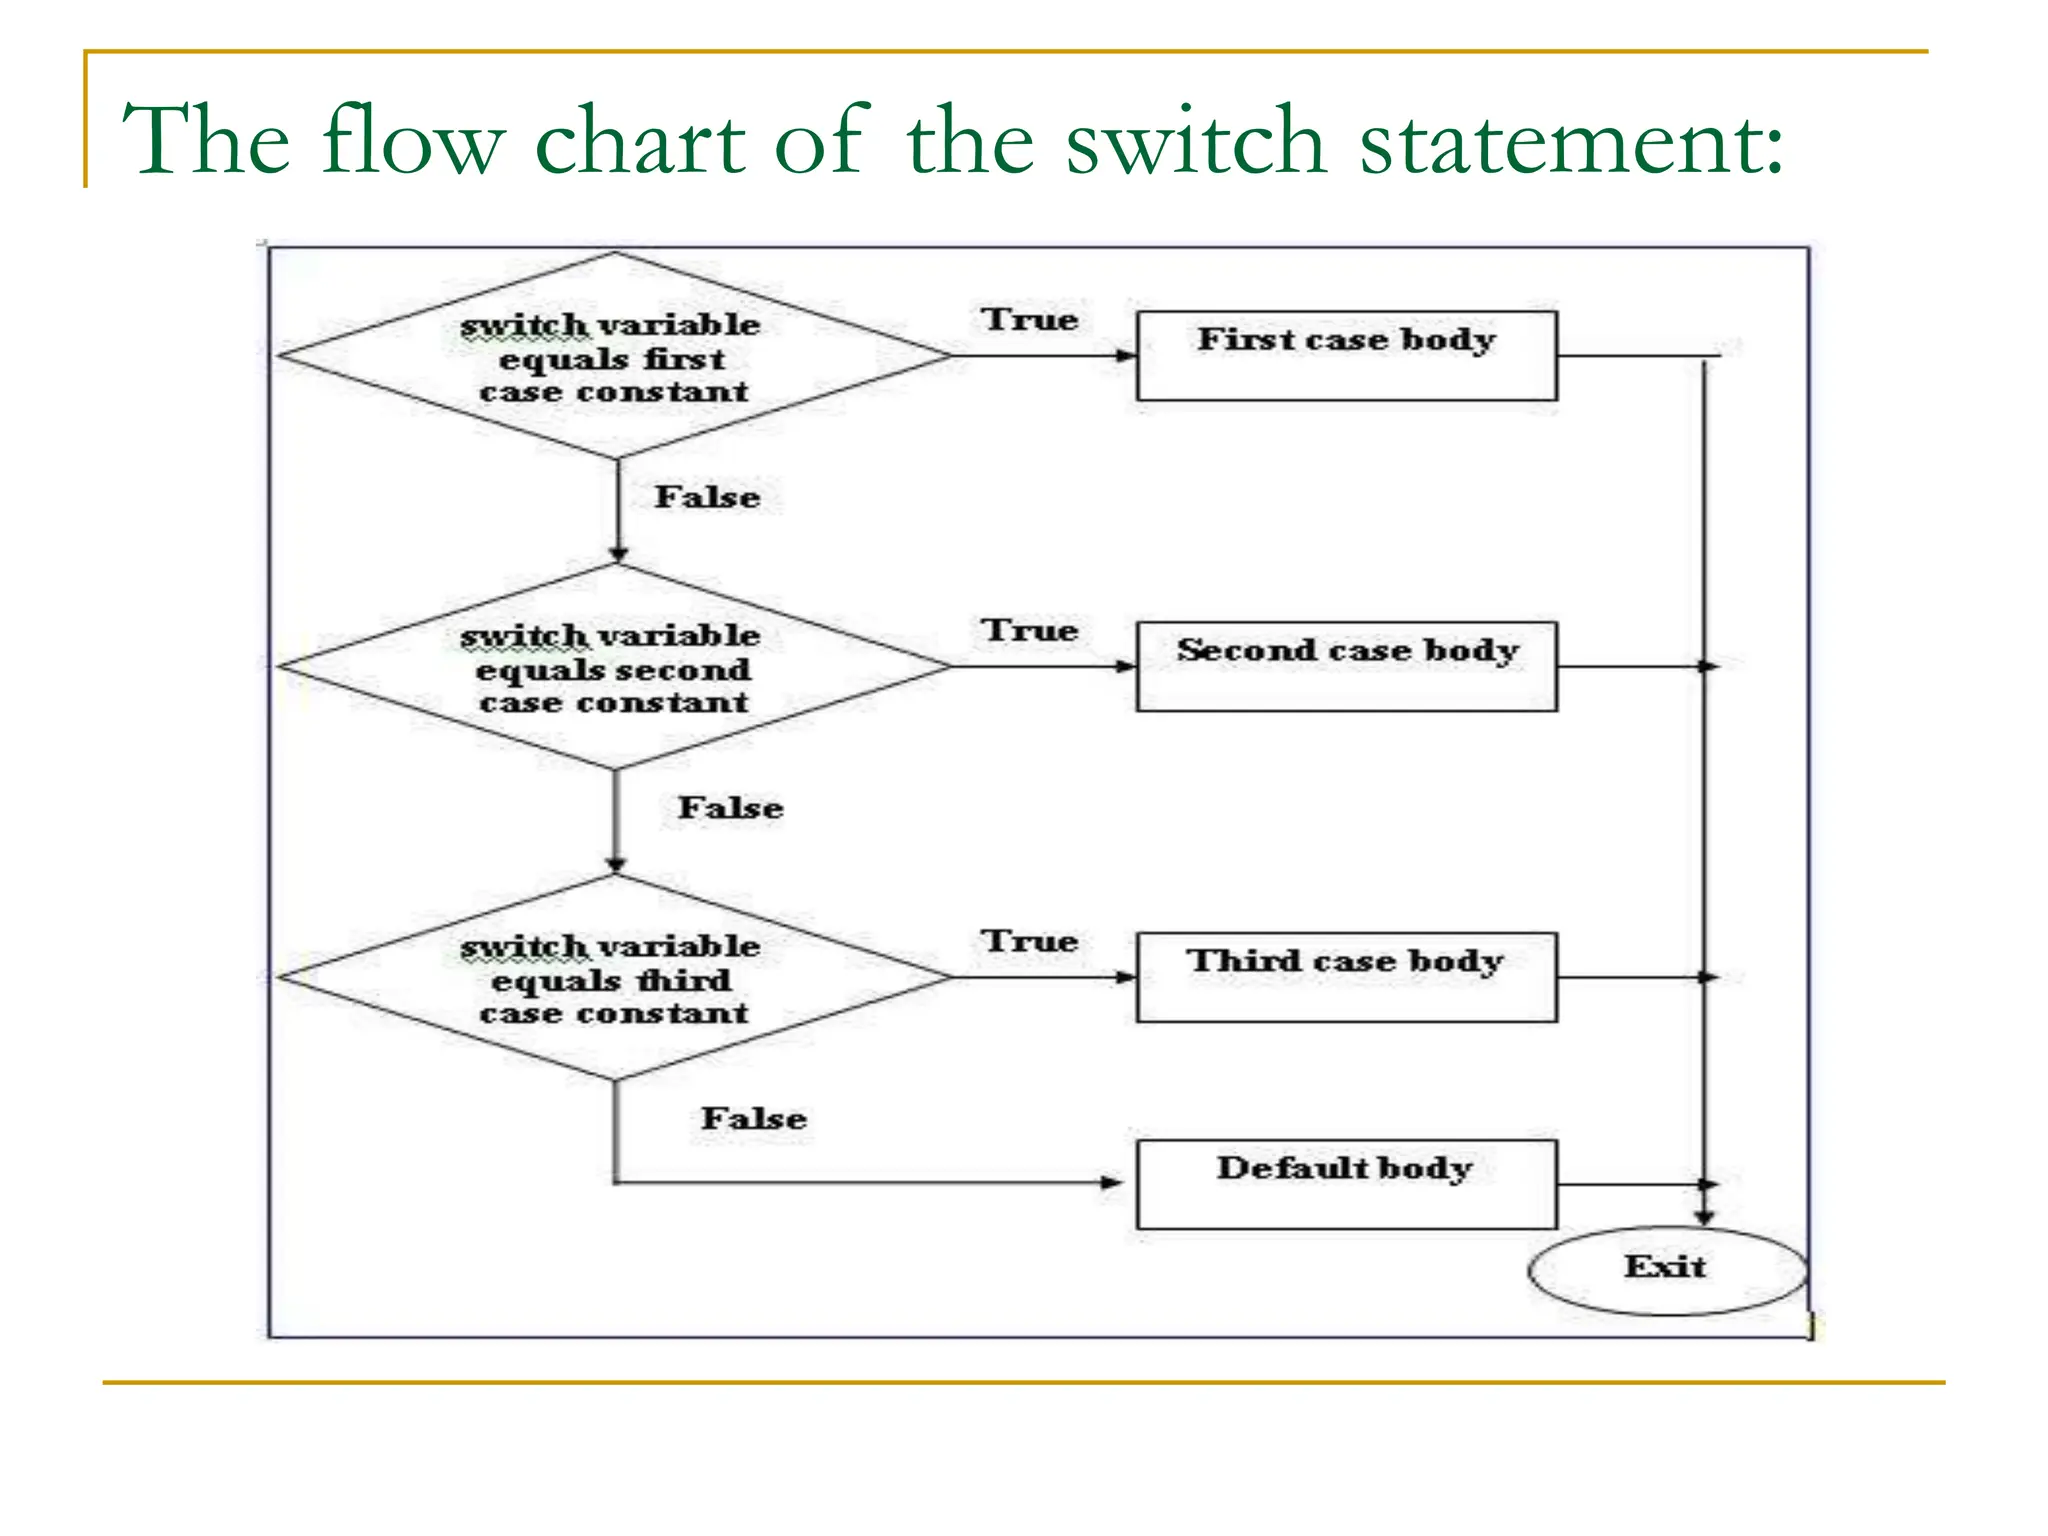
Flowchart representations for various control structures: if, if-else, while loop, for loop, and switch statement.
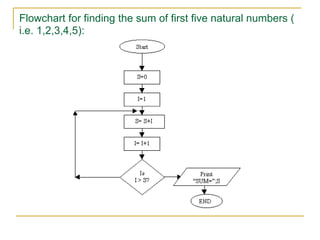
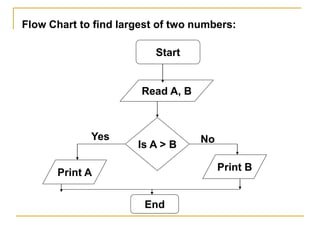
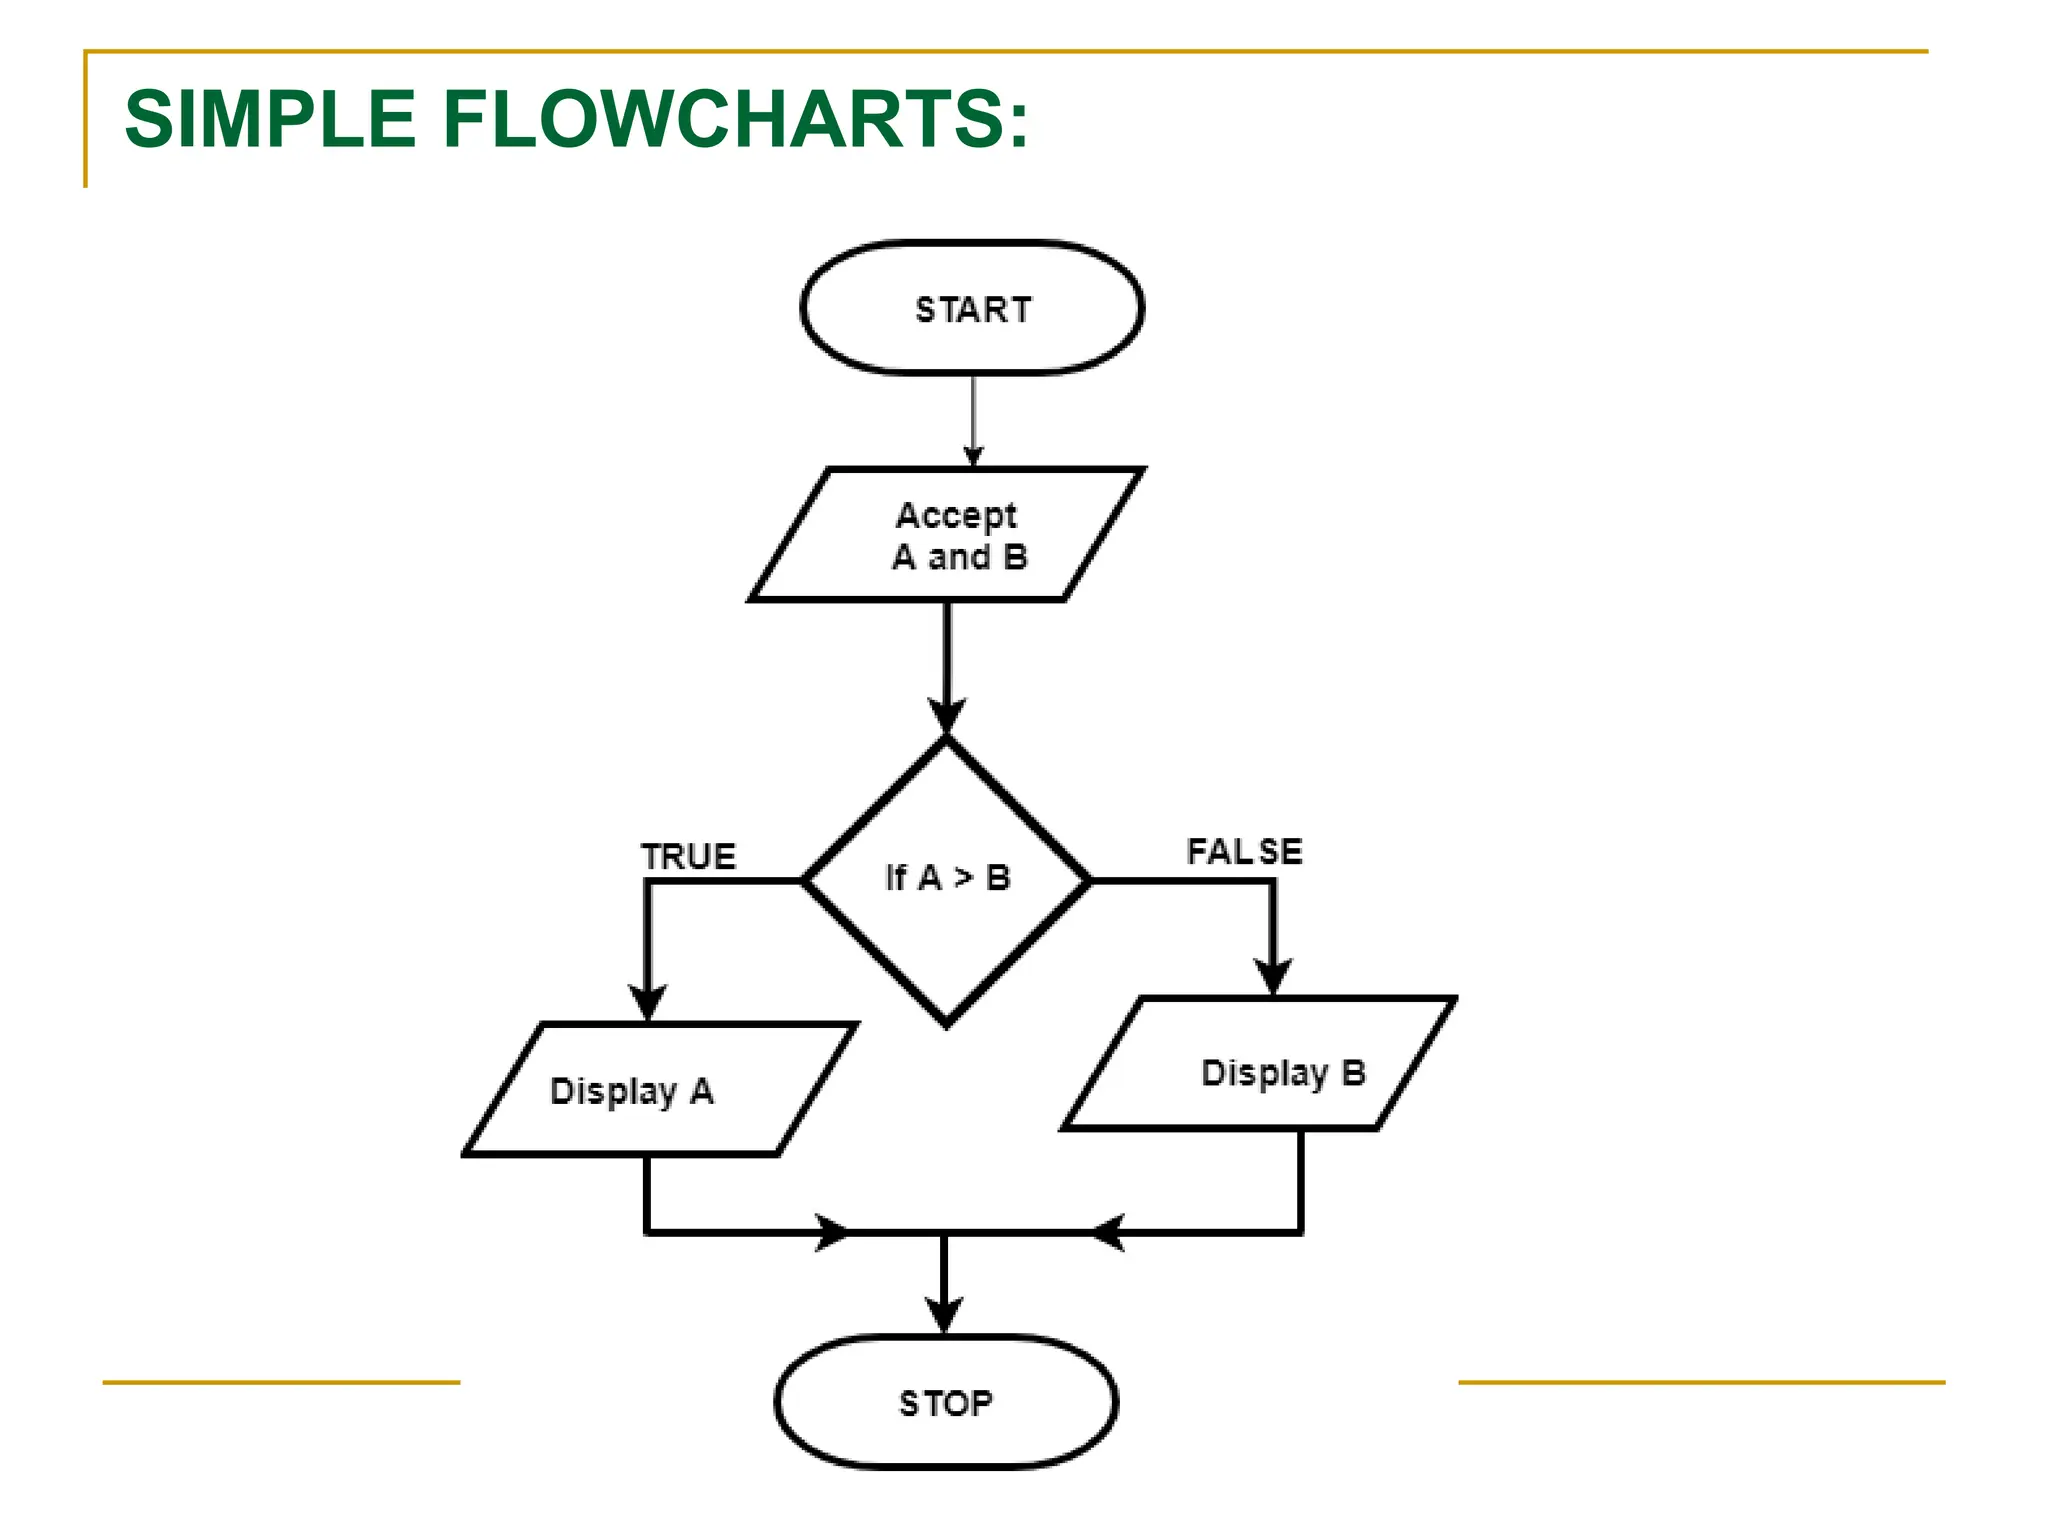
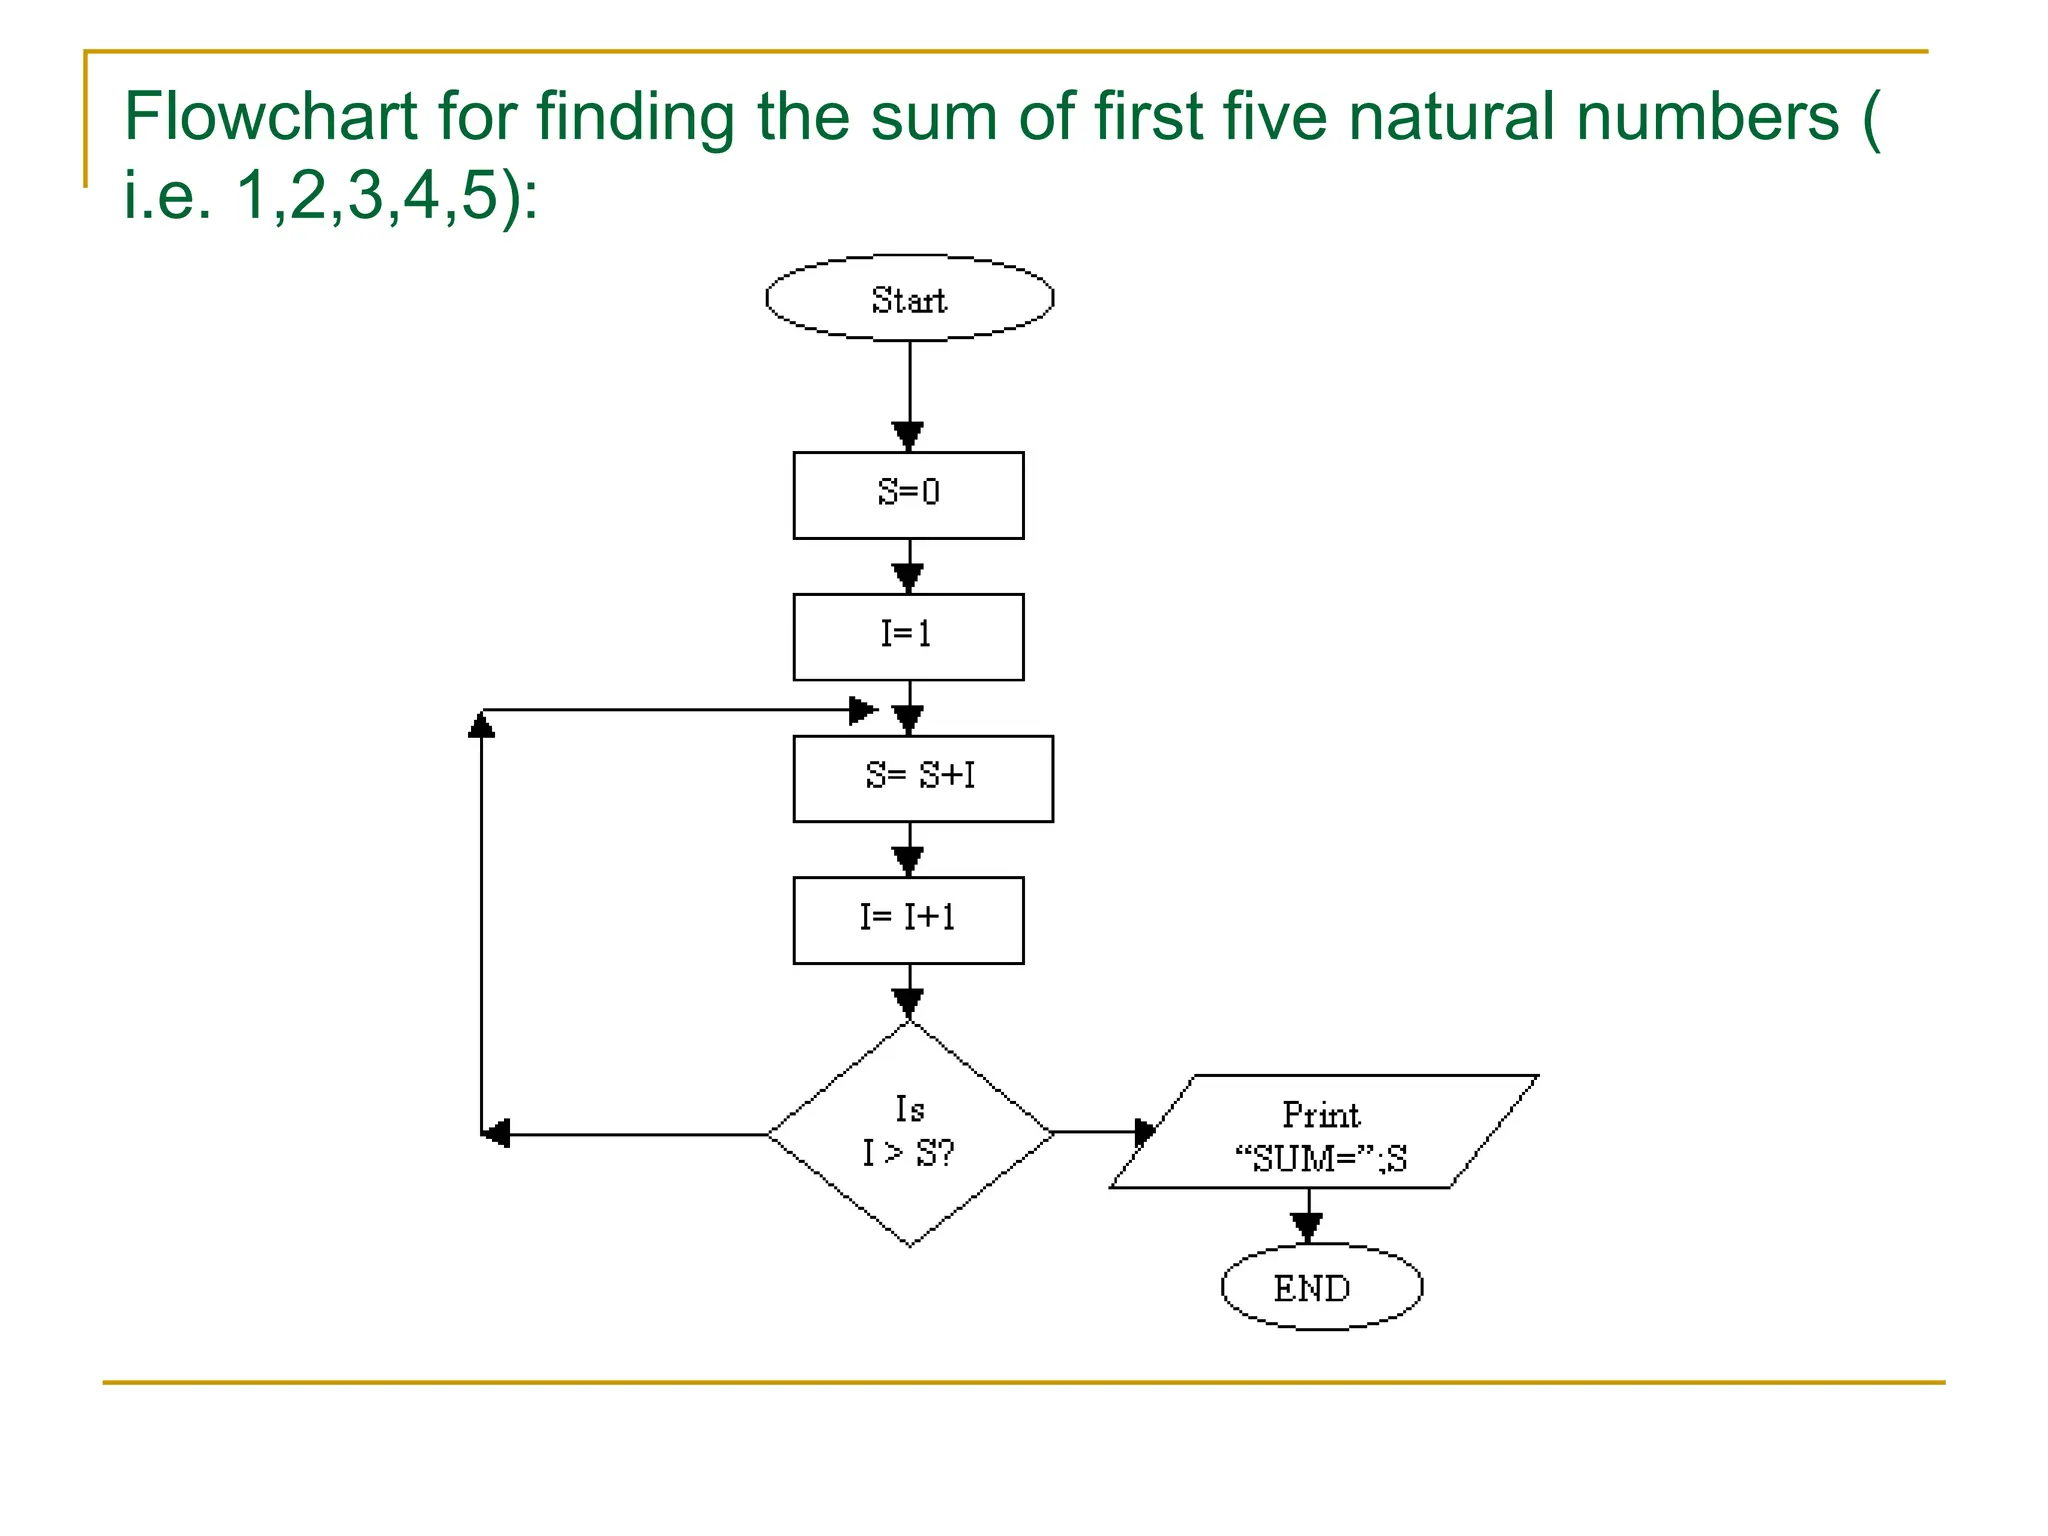
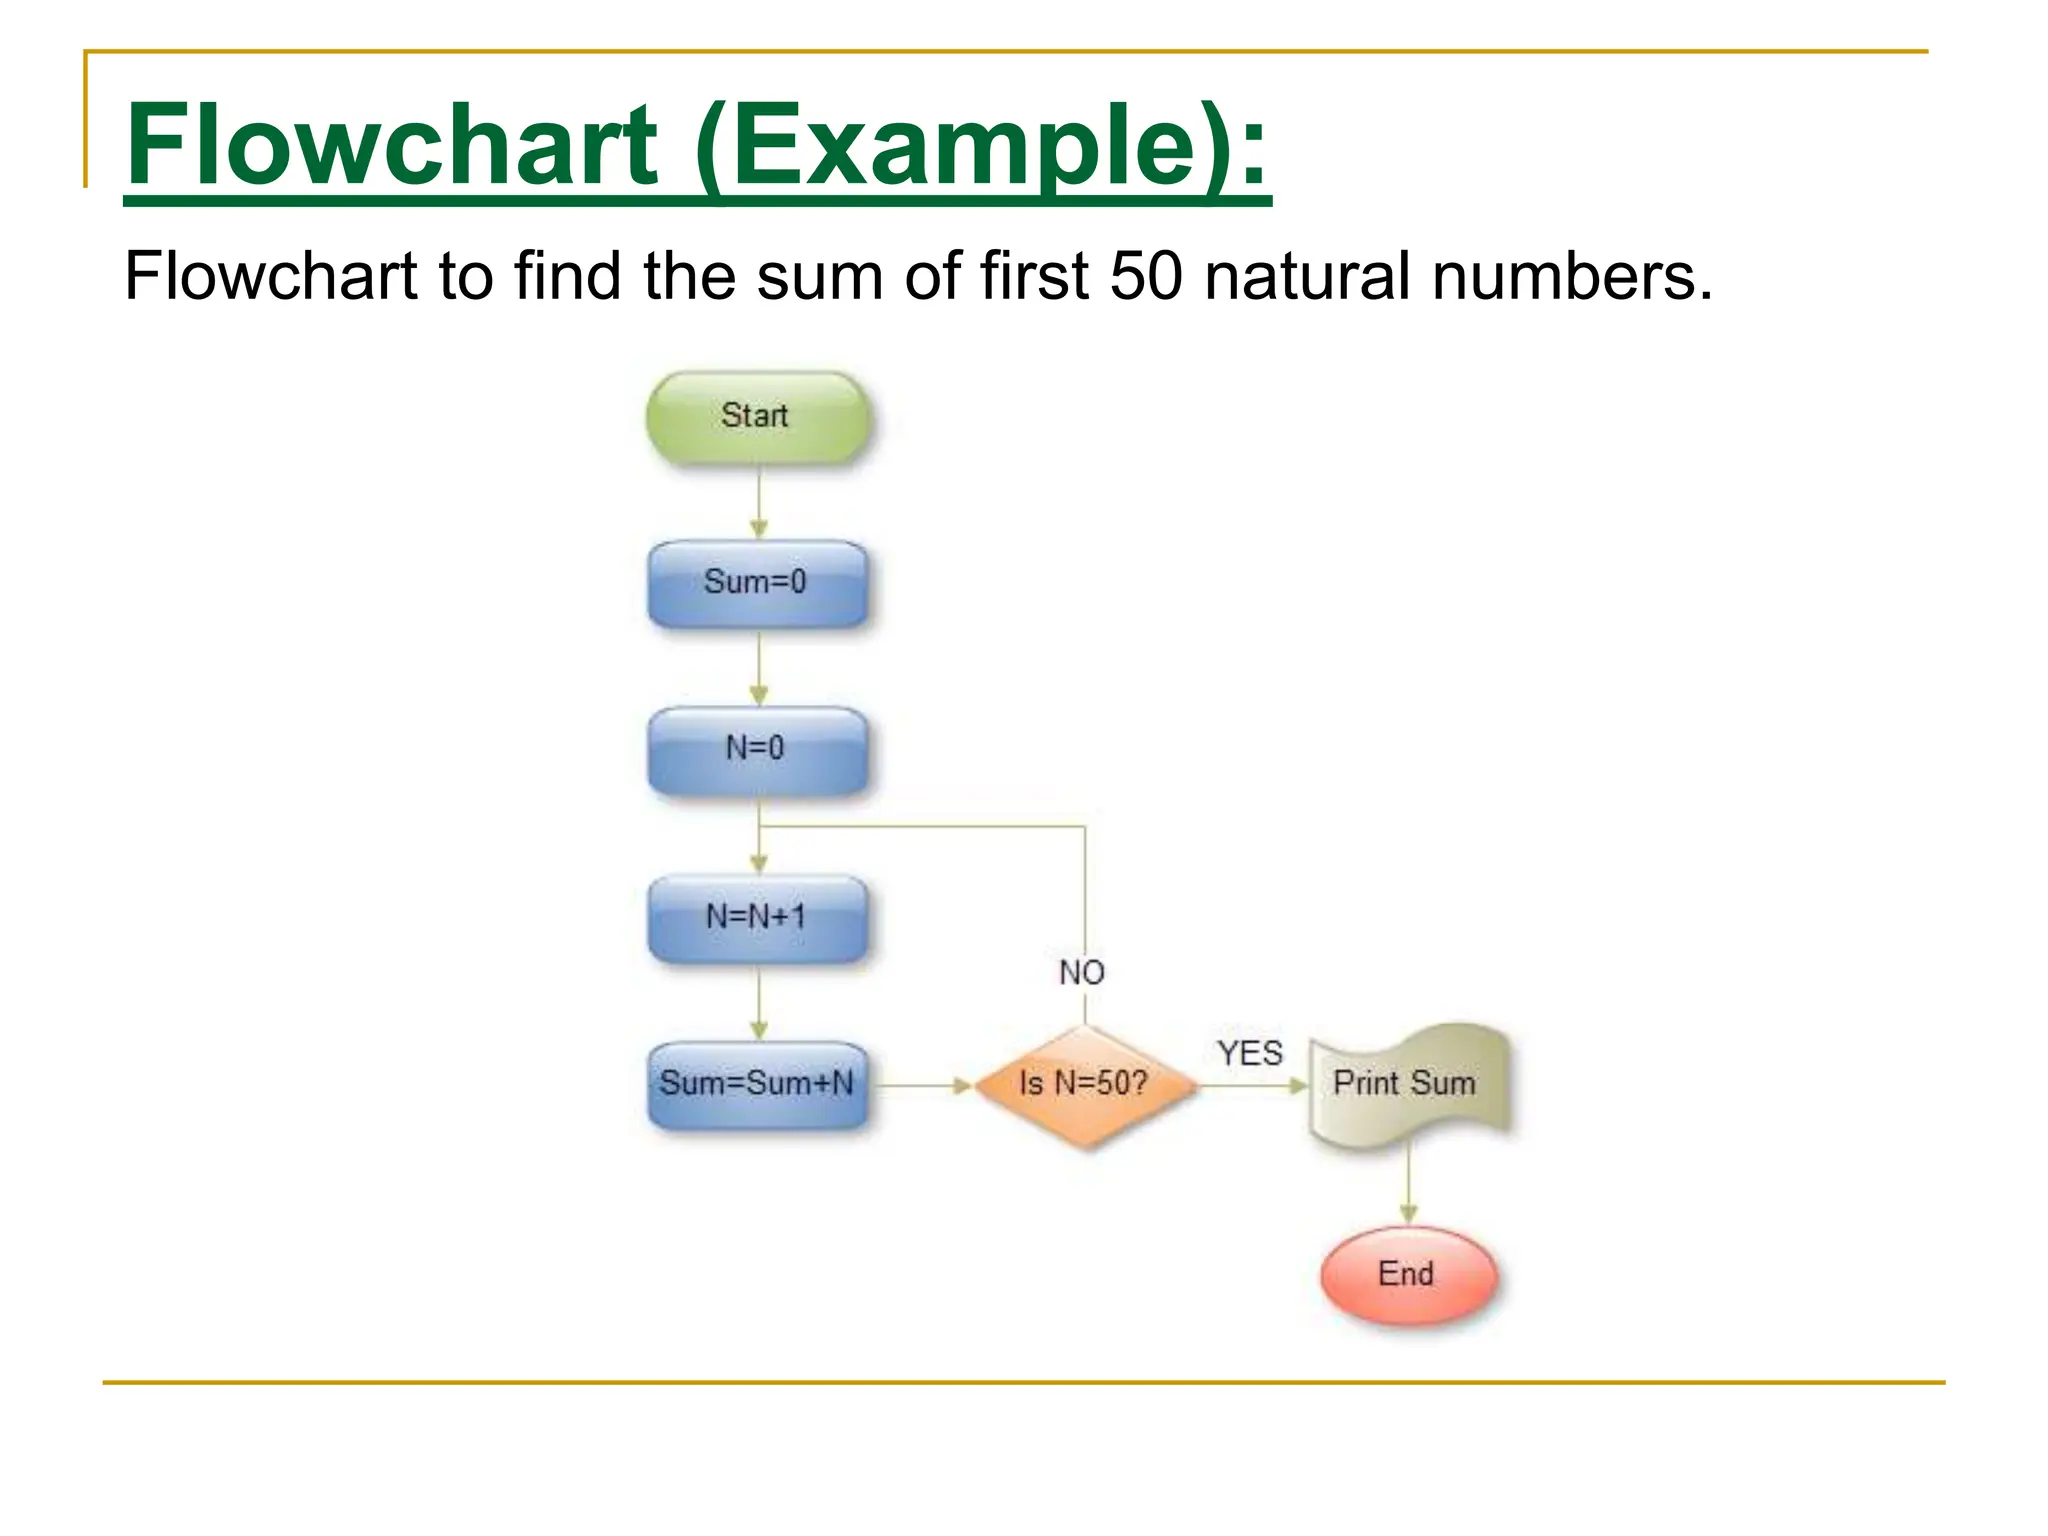
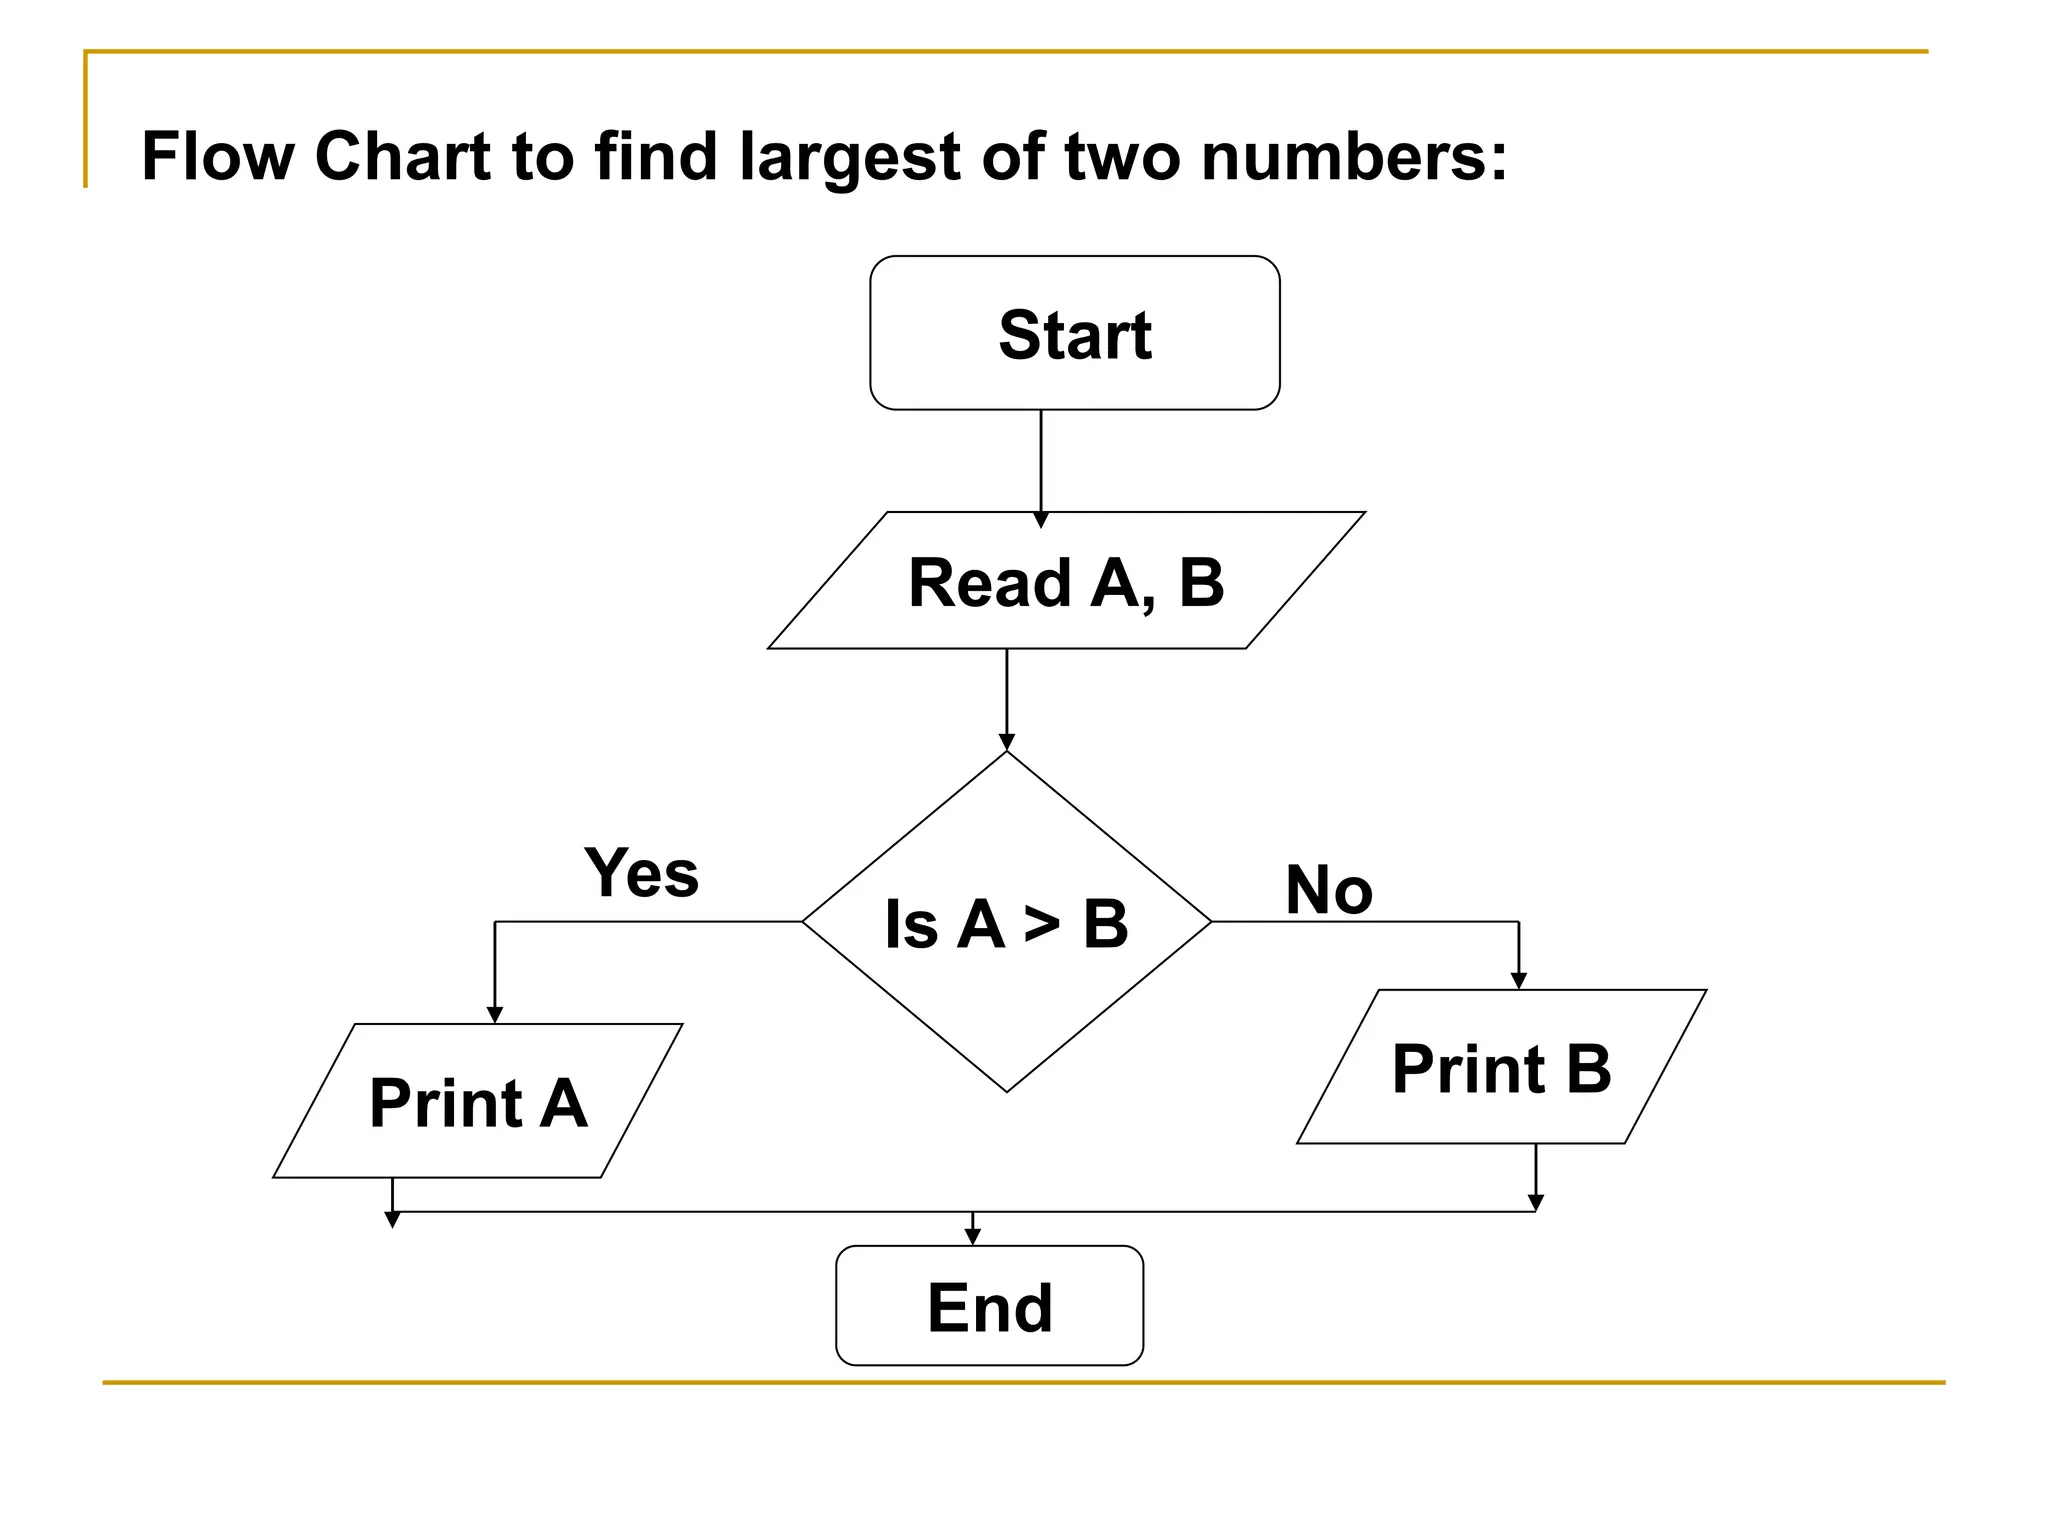
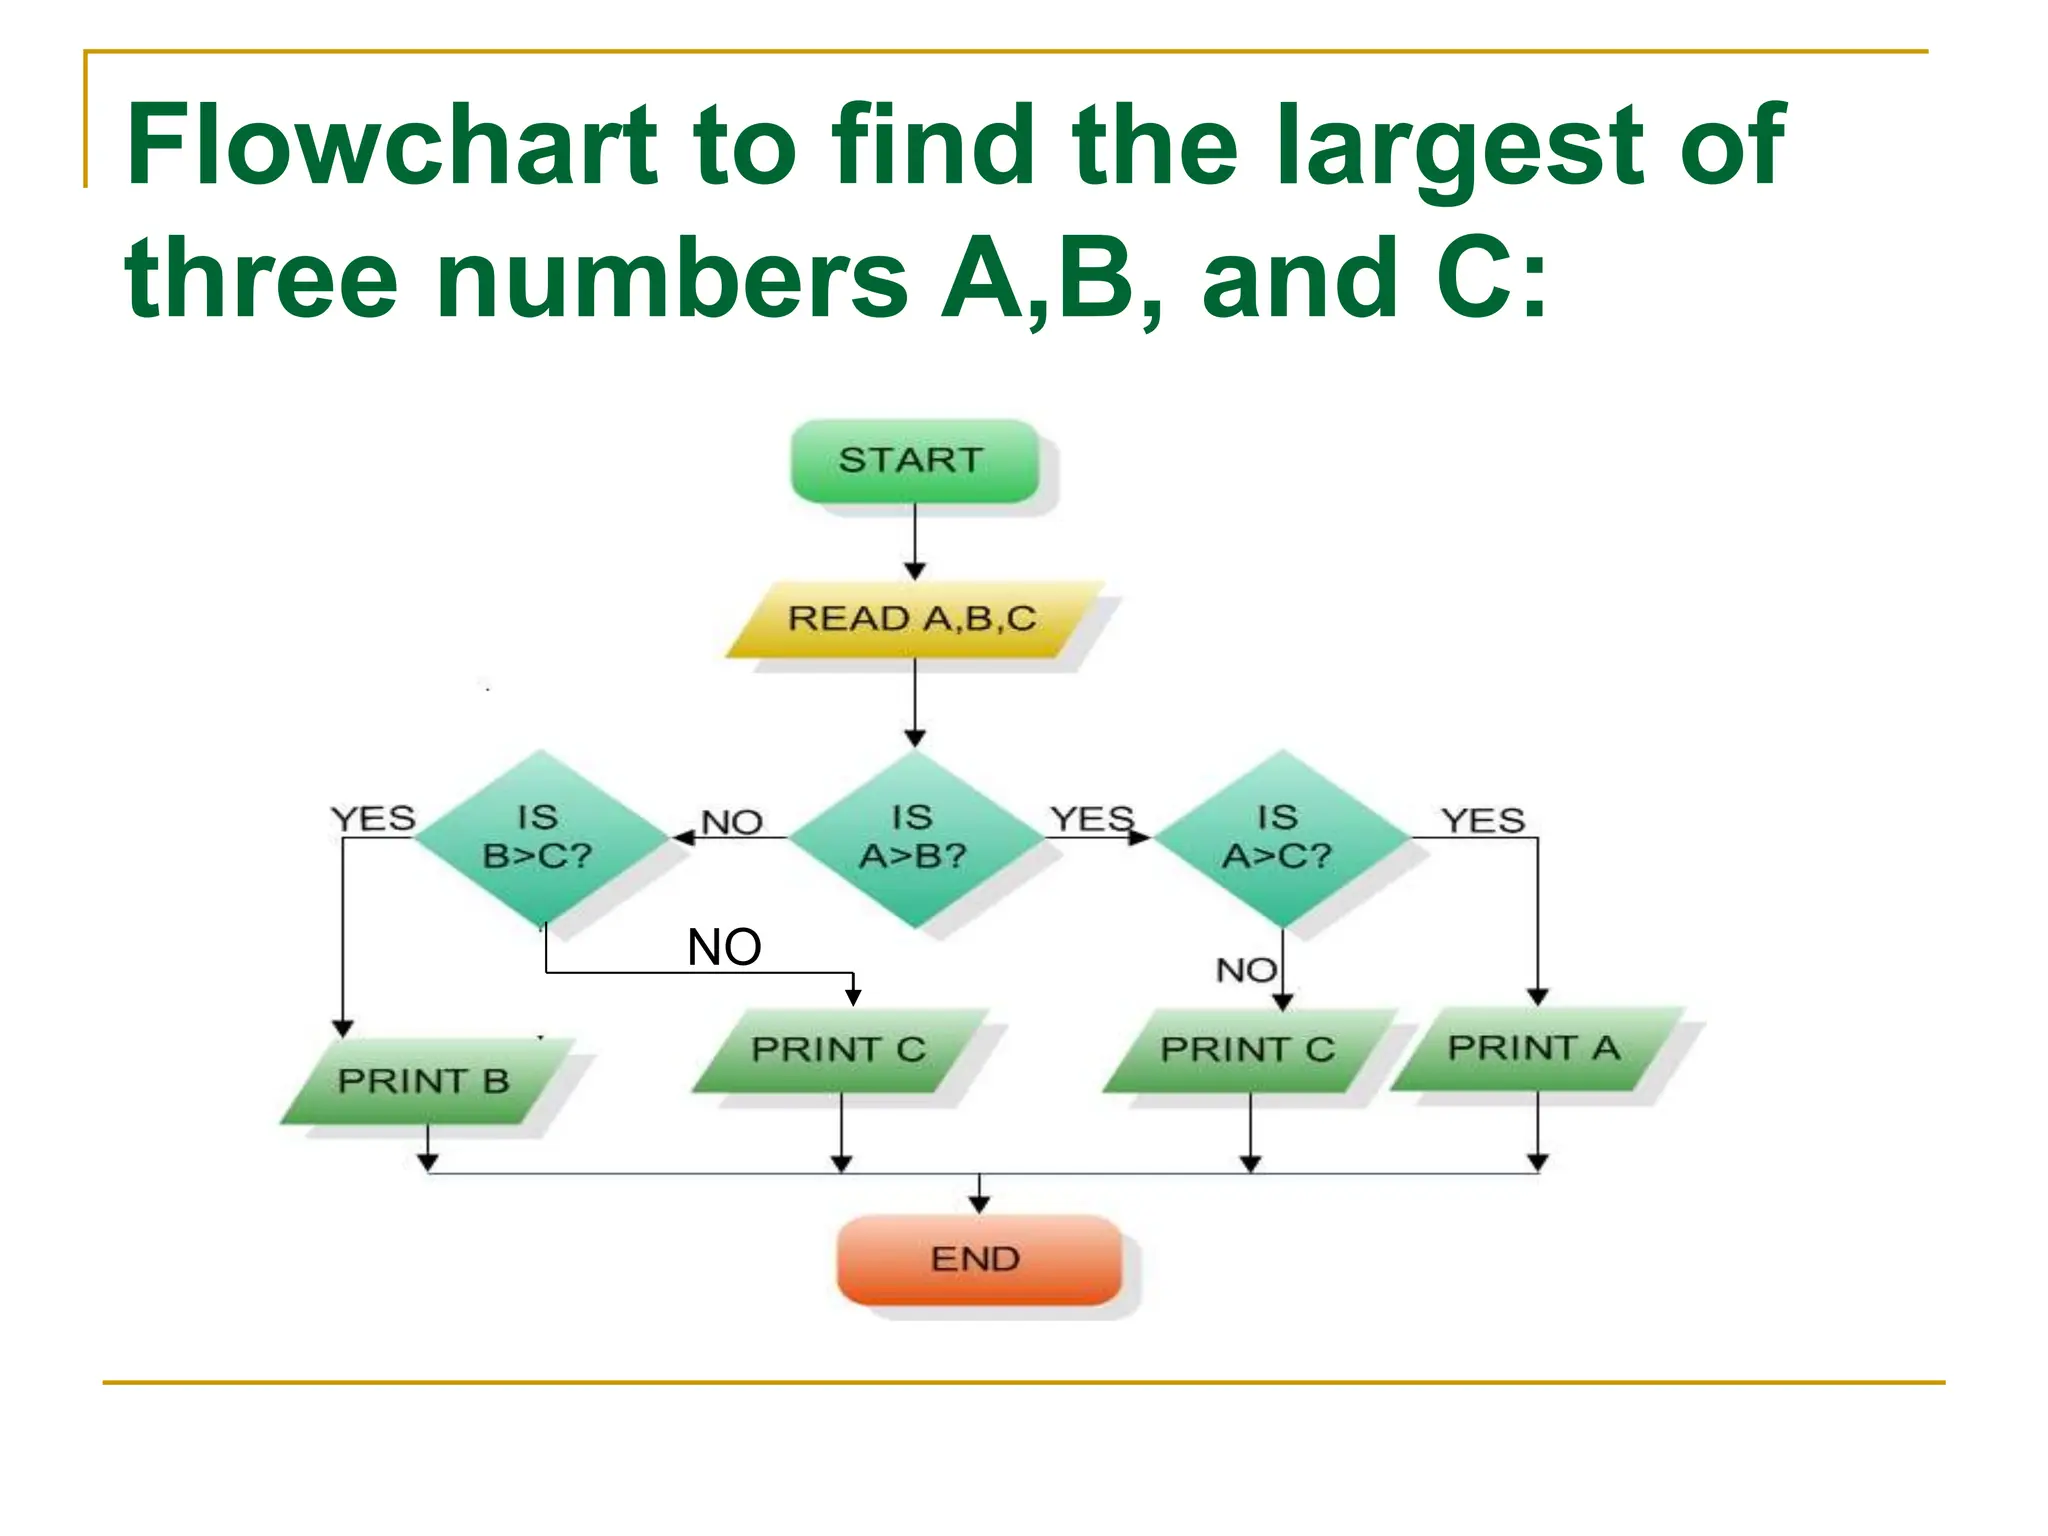
Flowcharts demonstrating algorithms for summing natural numbers and finding the largest number between two inputs.
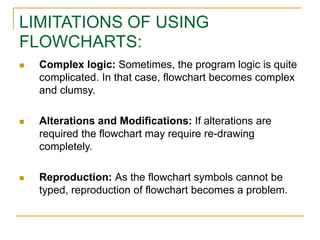
Challenges in using flowcharts including complexity of logic, need for revisions, and difficulty in reproduction.
Instructions for creating flowcharts for daily activities and specific algorithms like linear search.