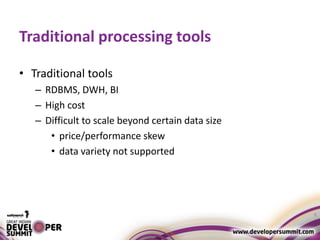
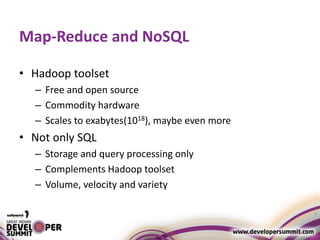
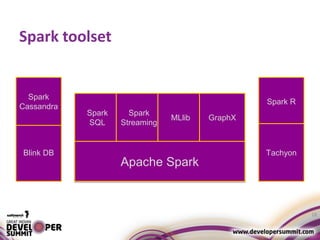
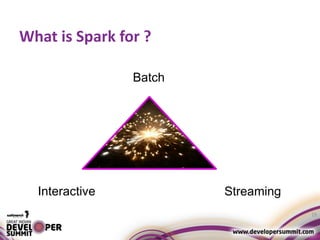
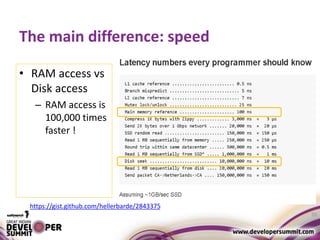
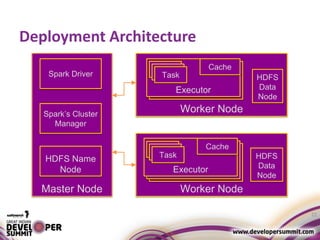
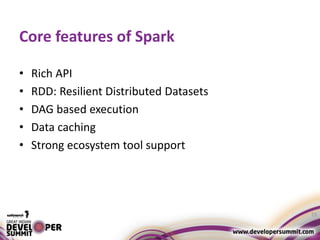
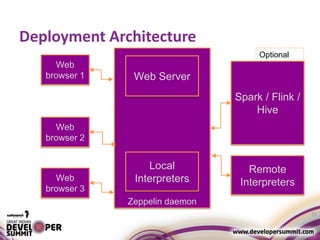
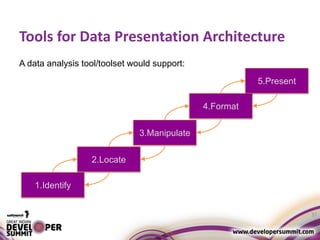
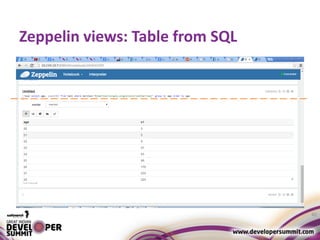
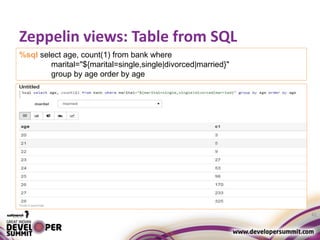
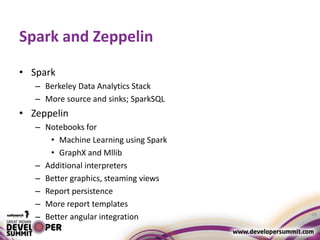
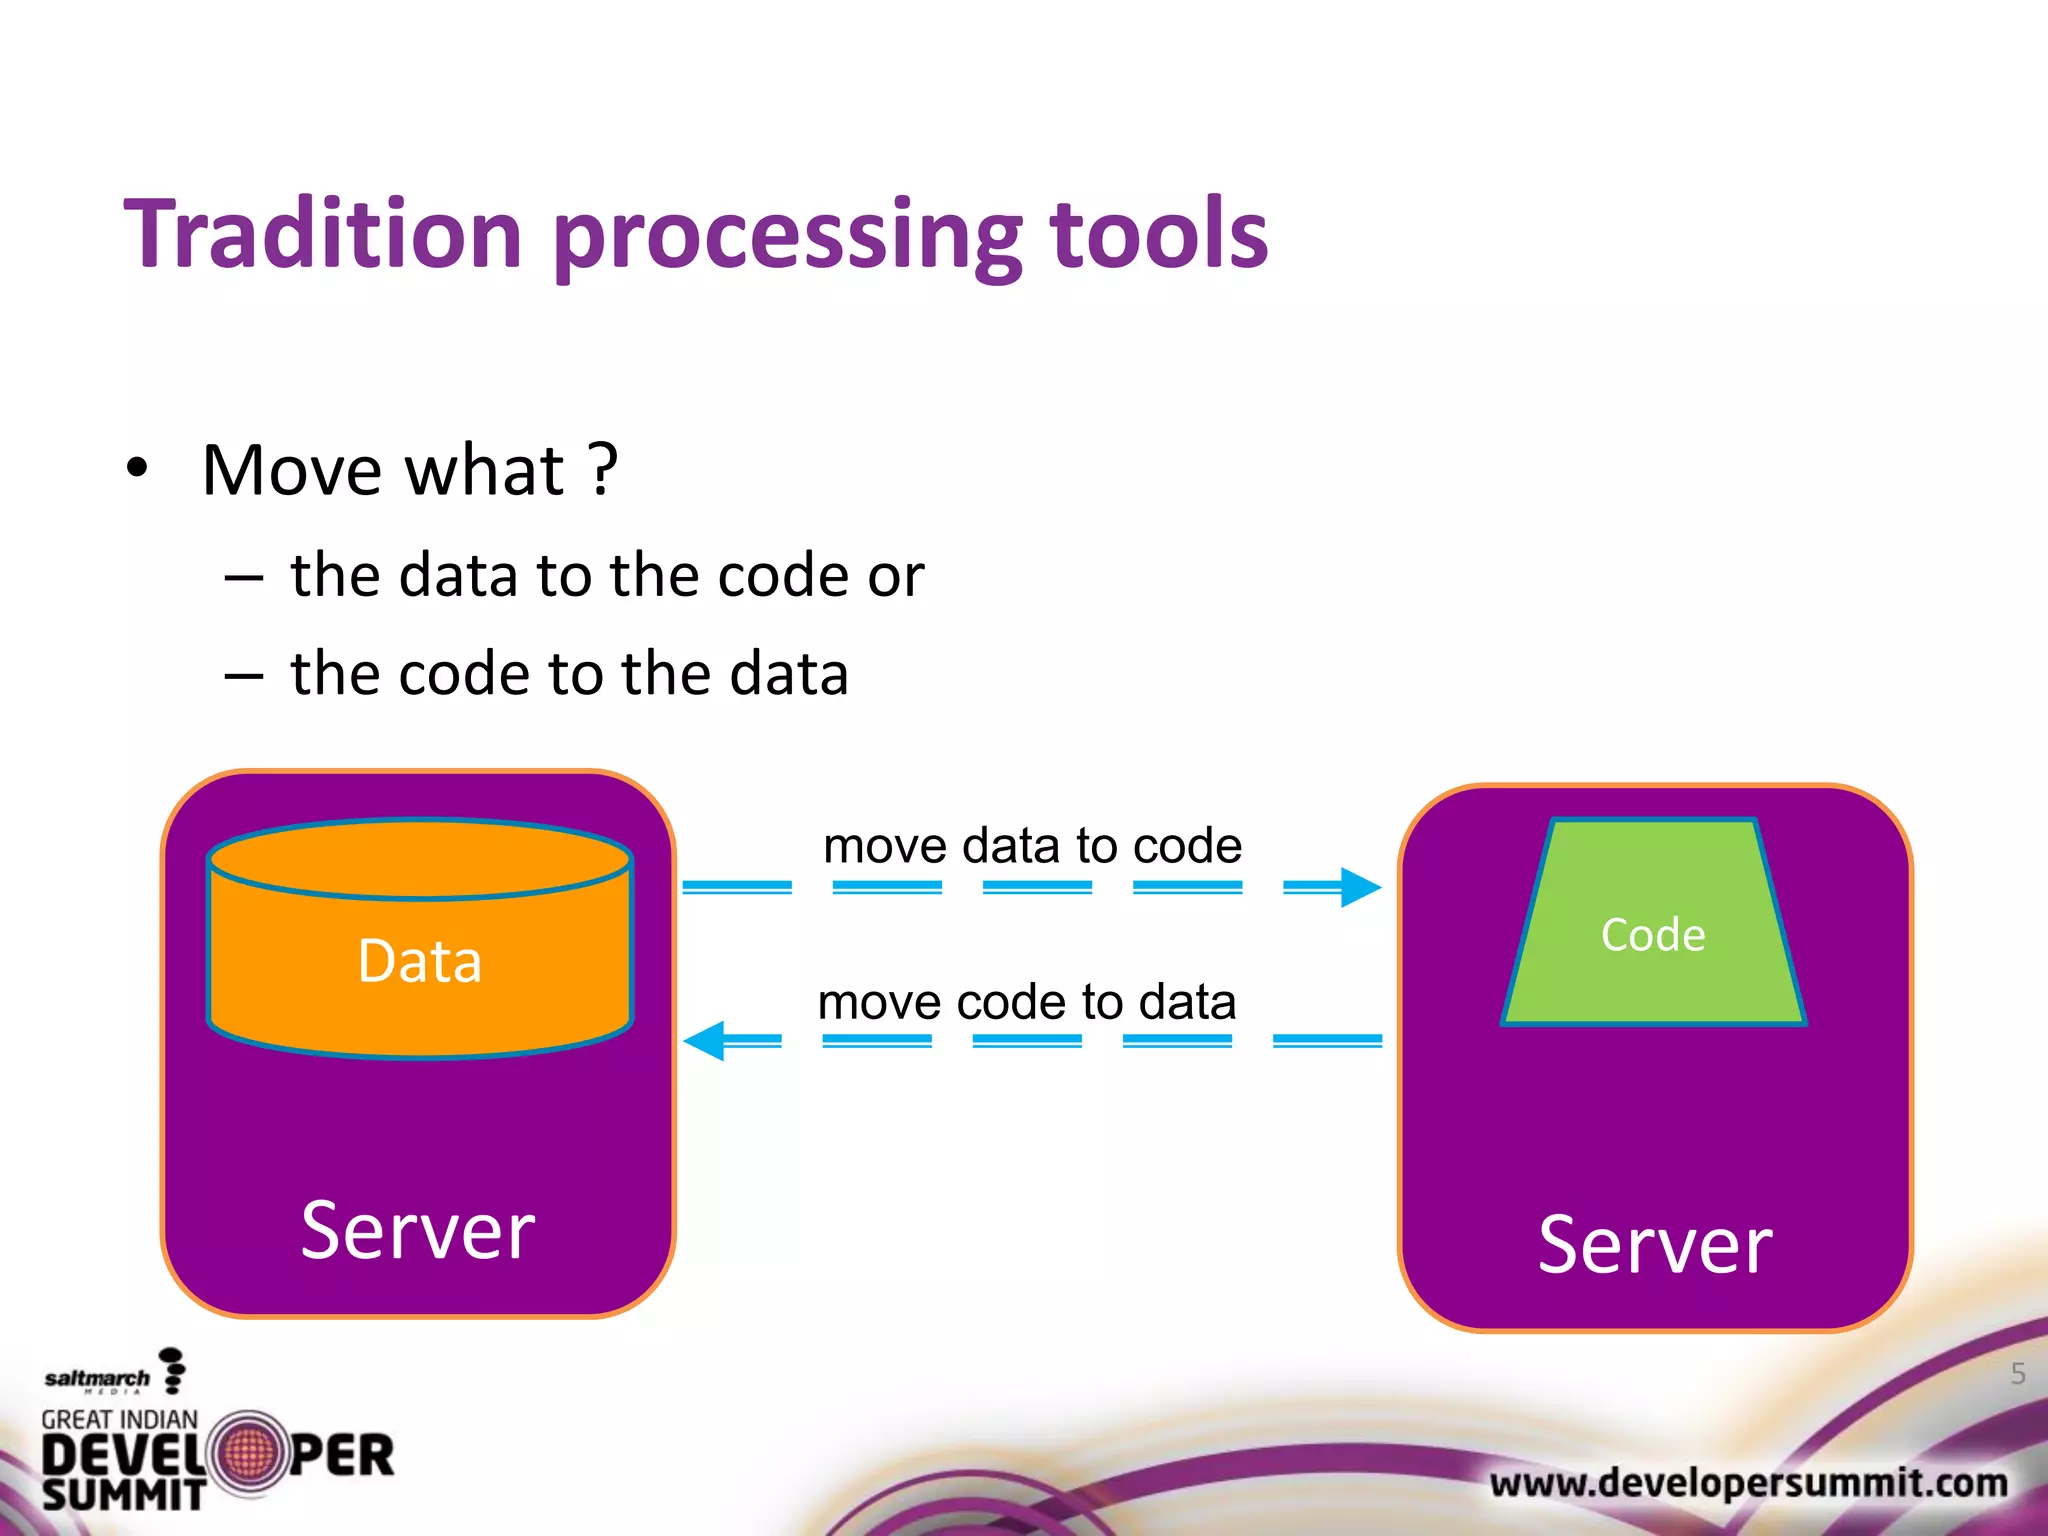
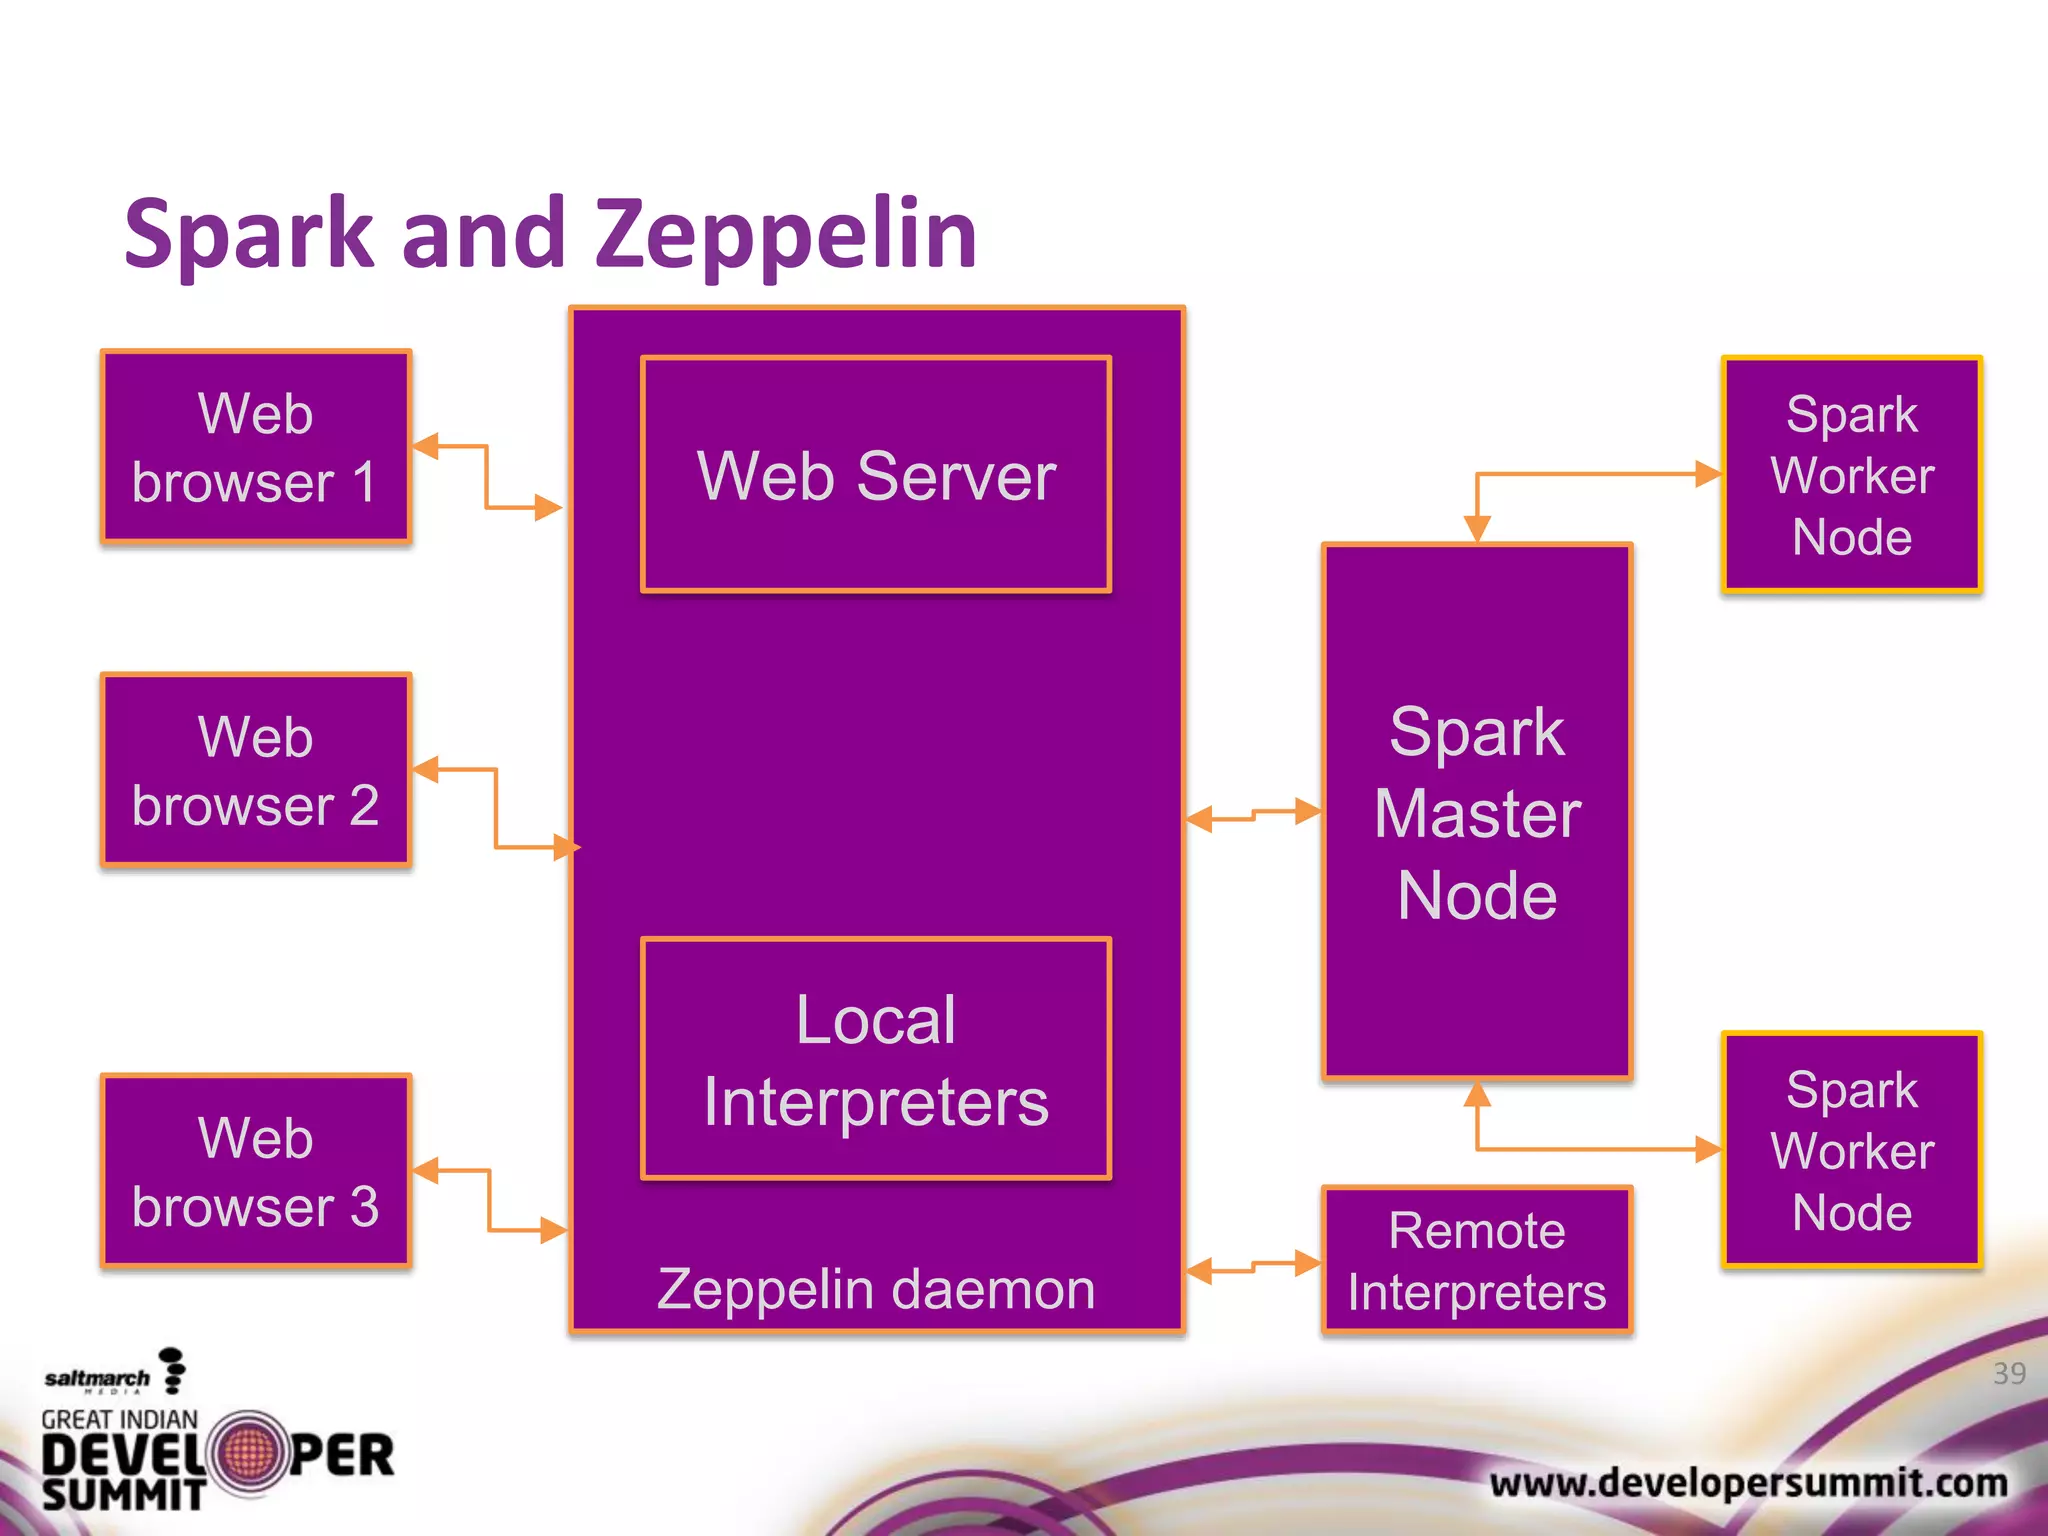
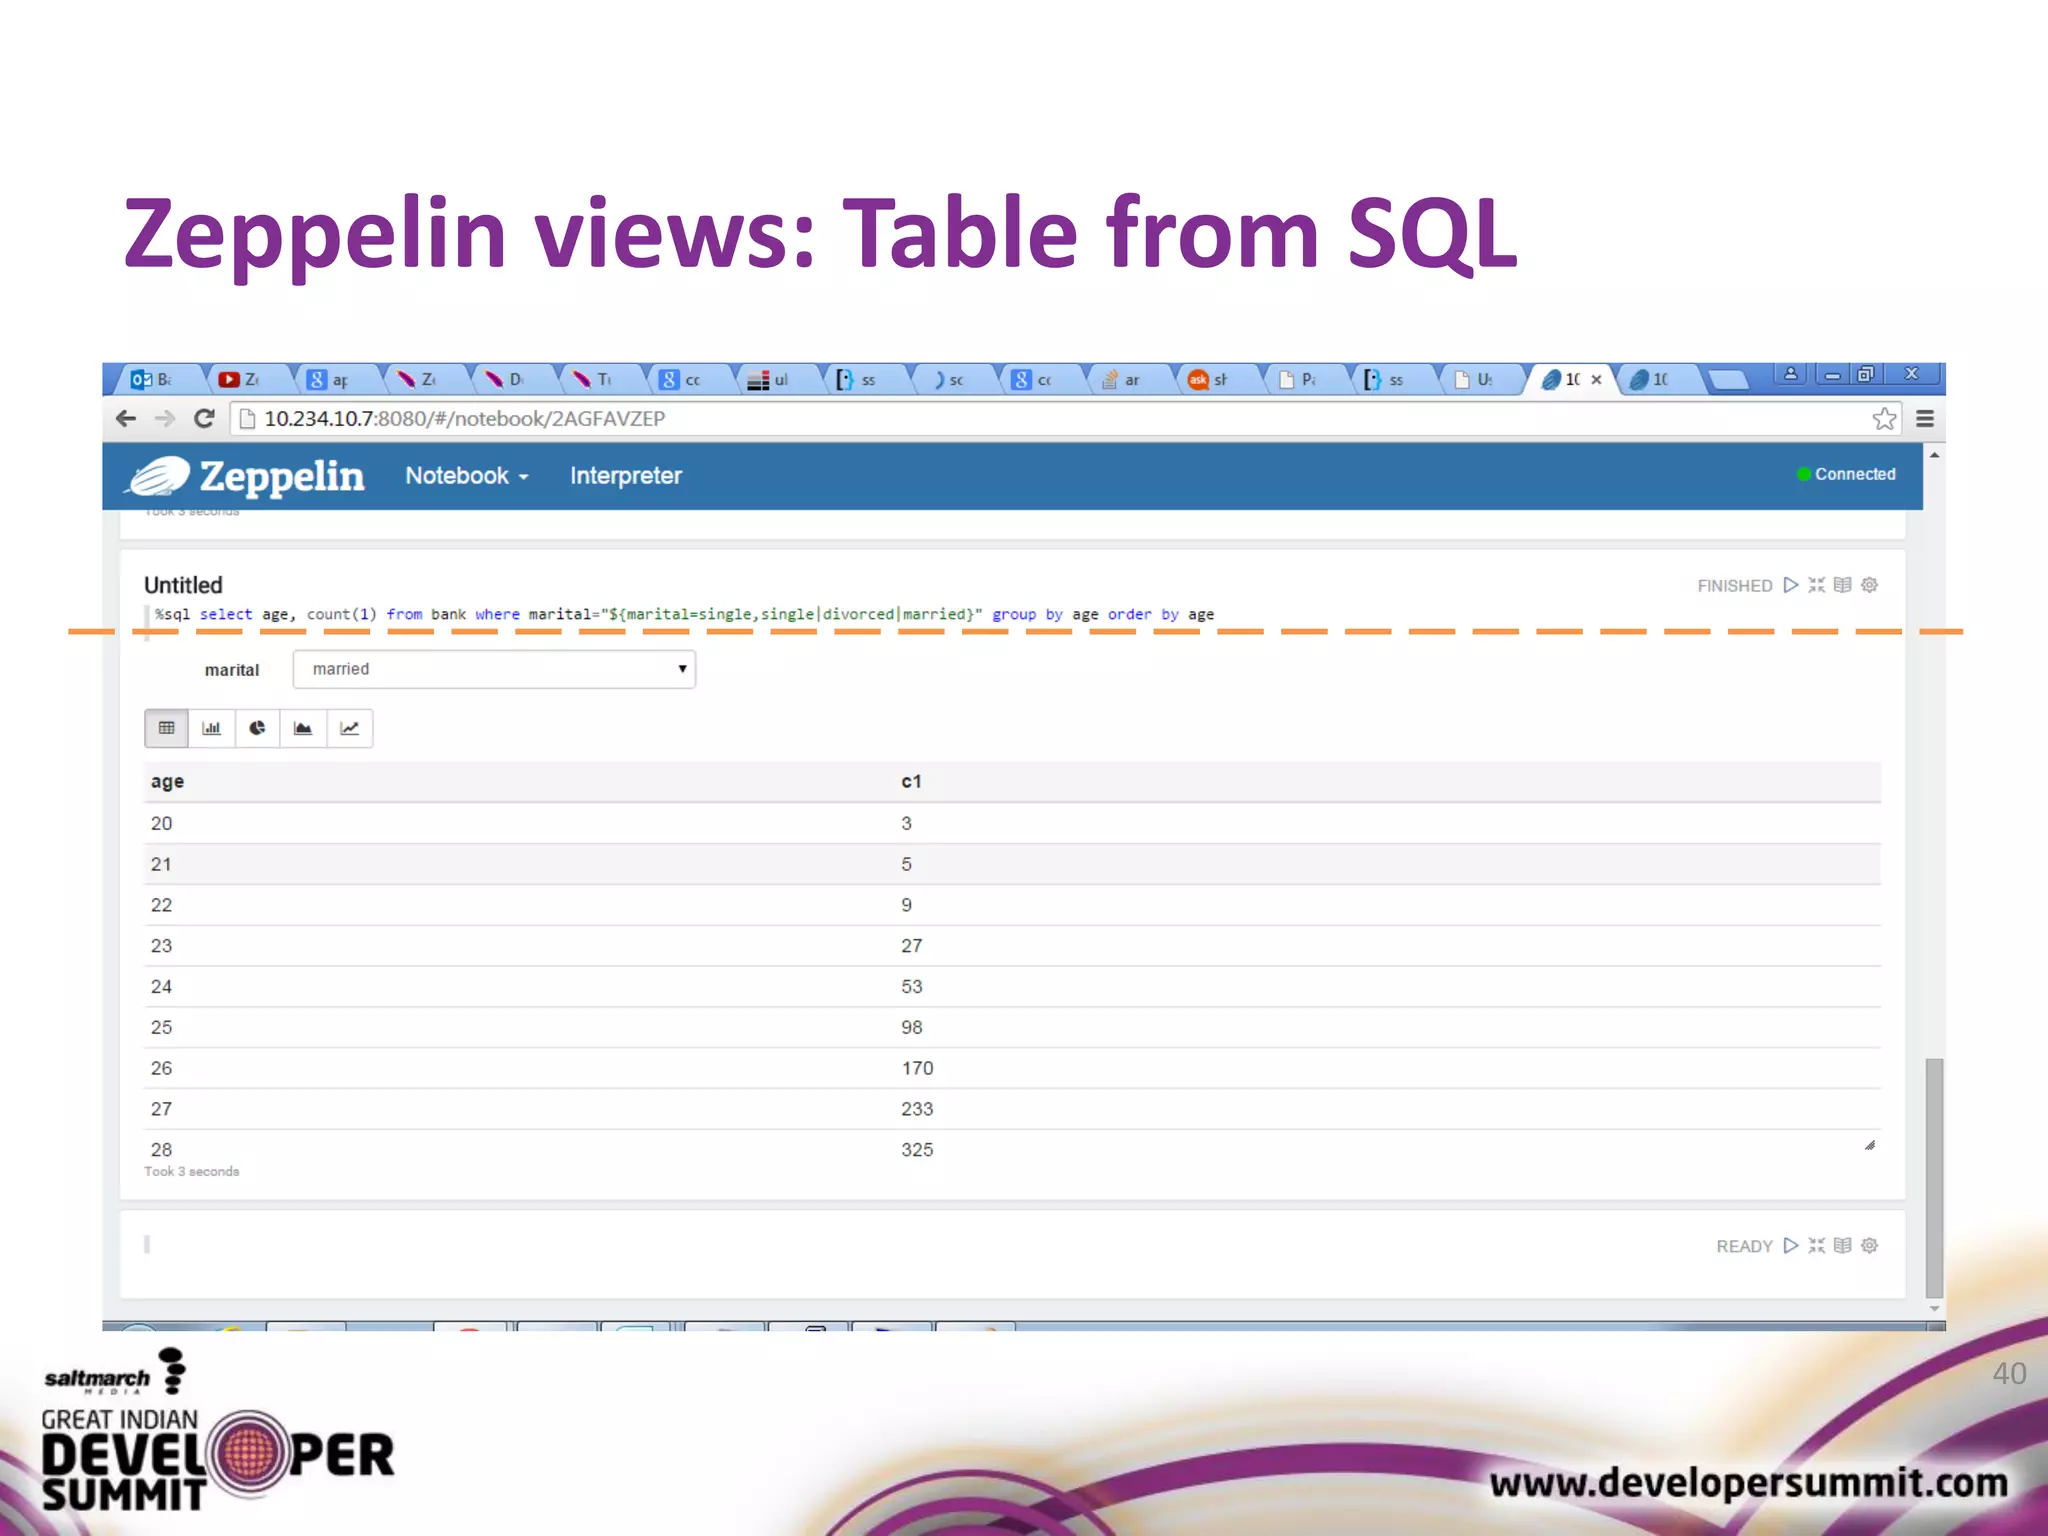
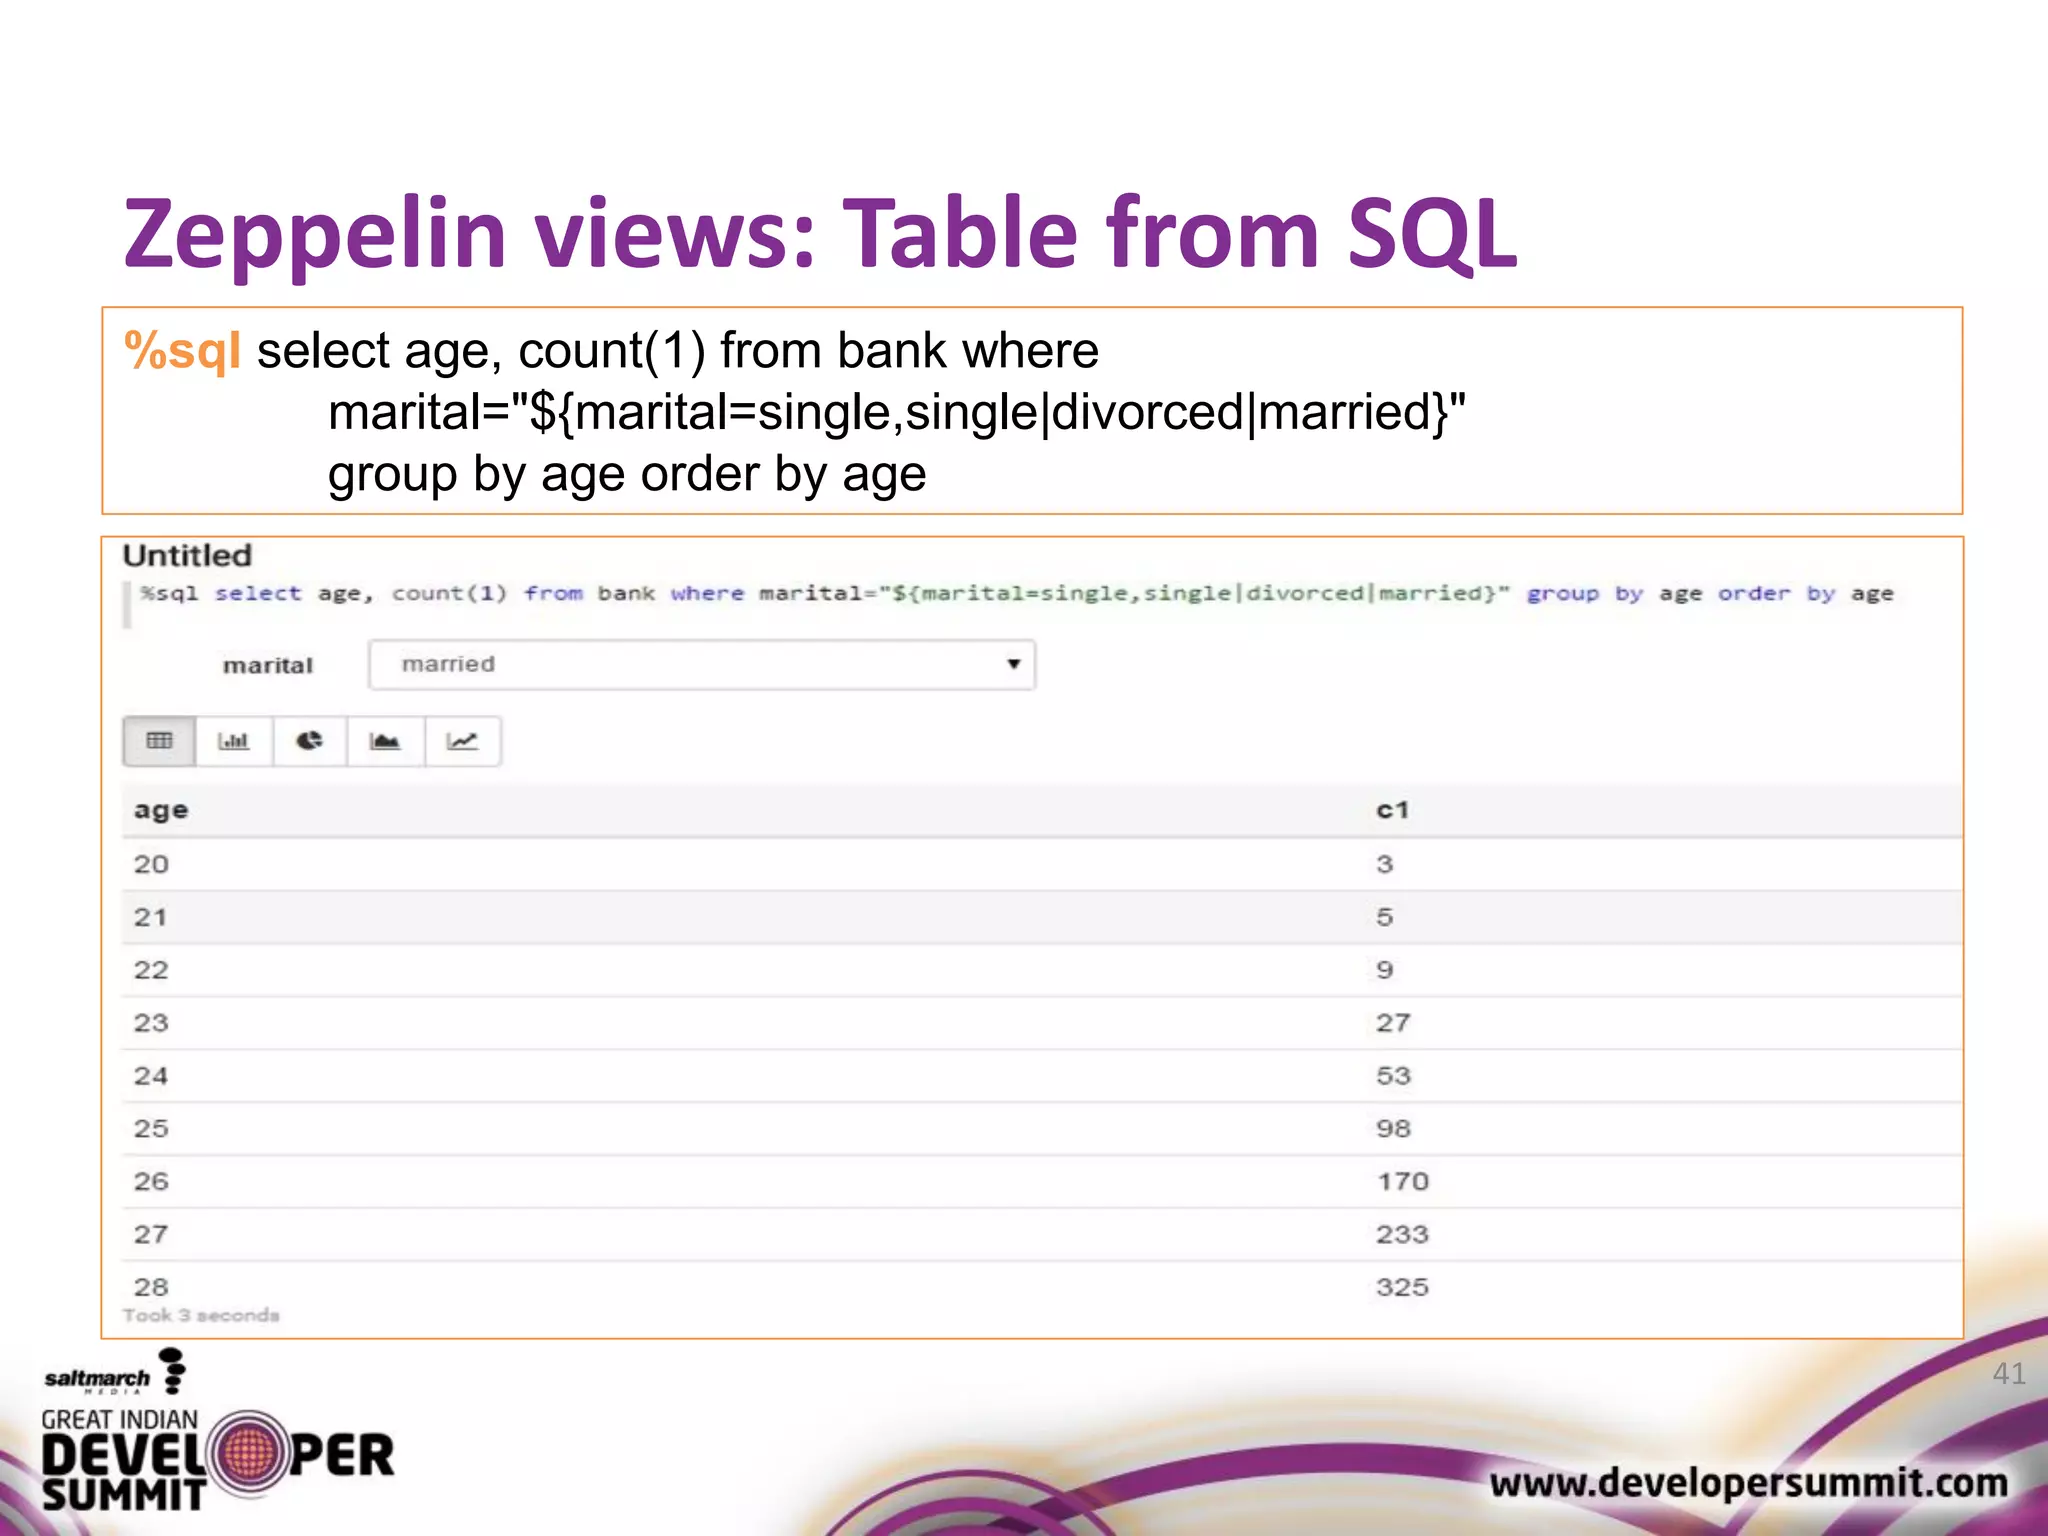
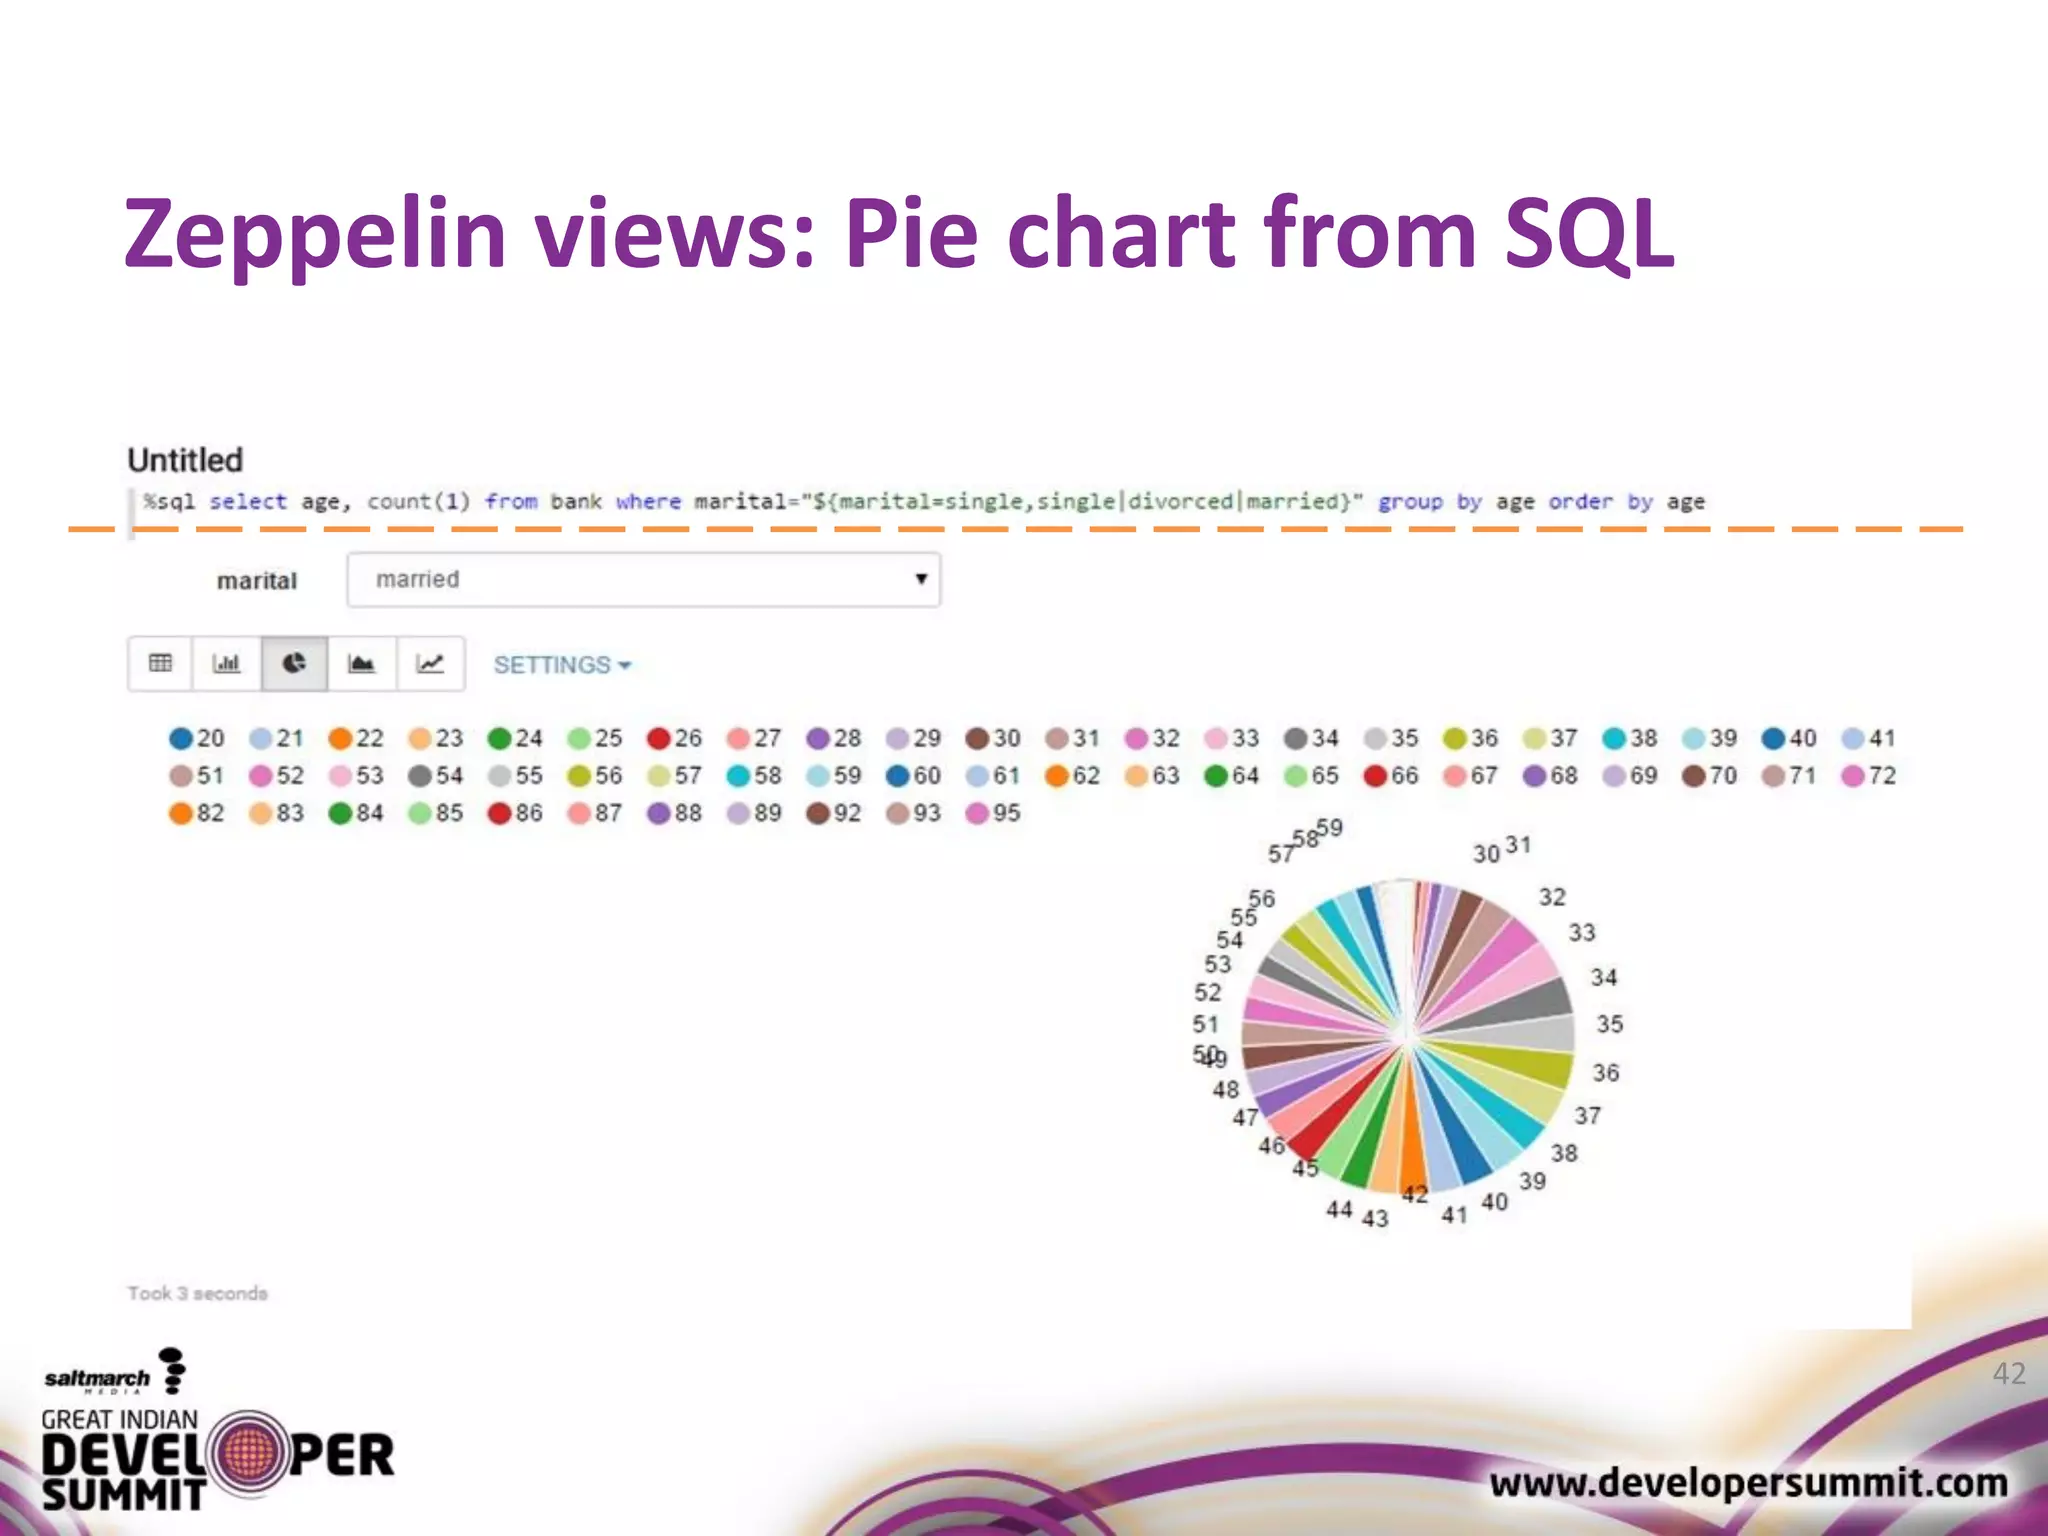
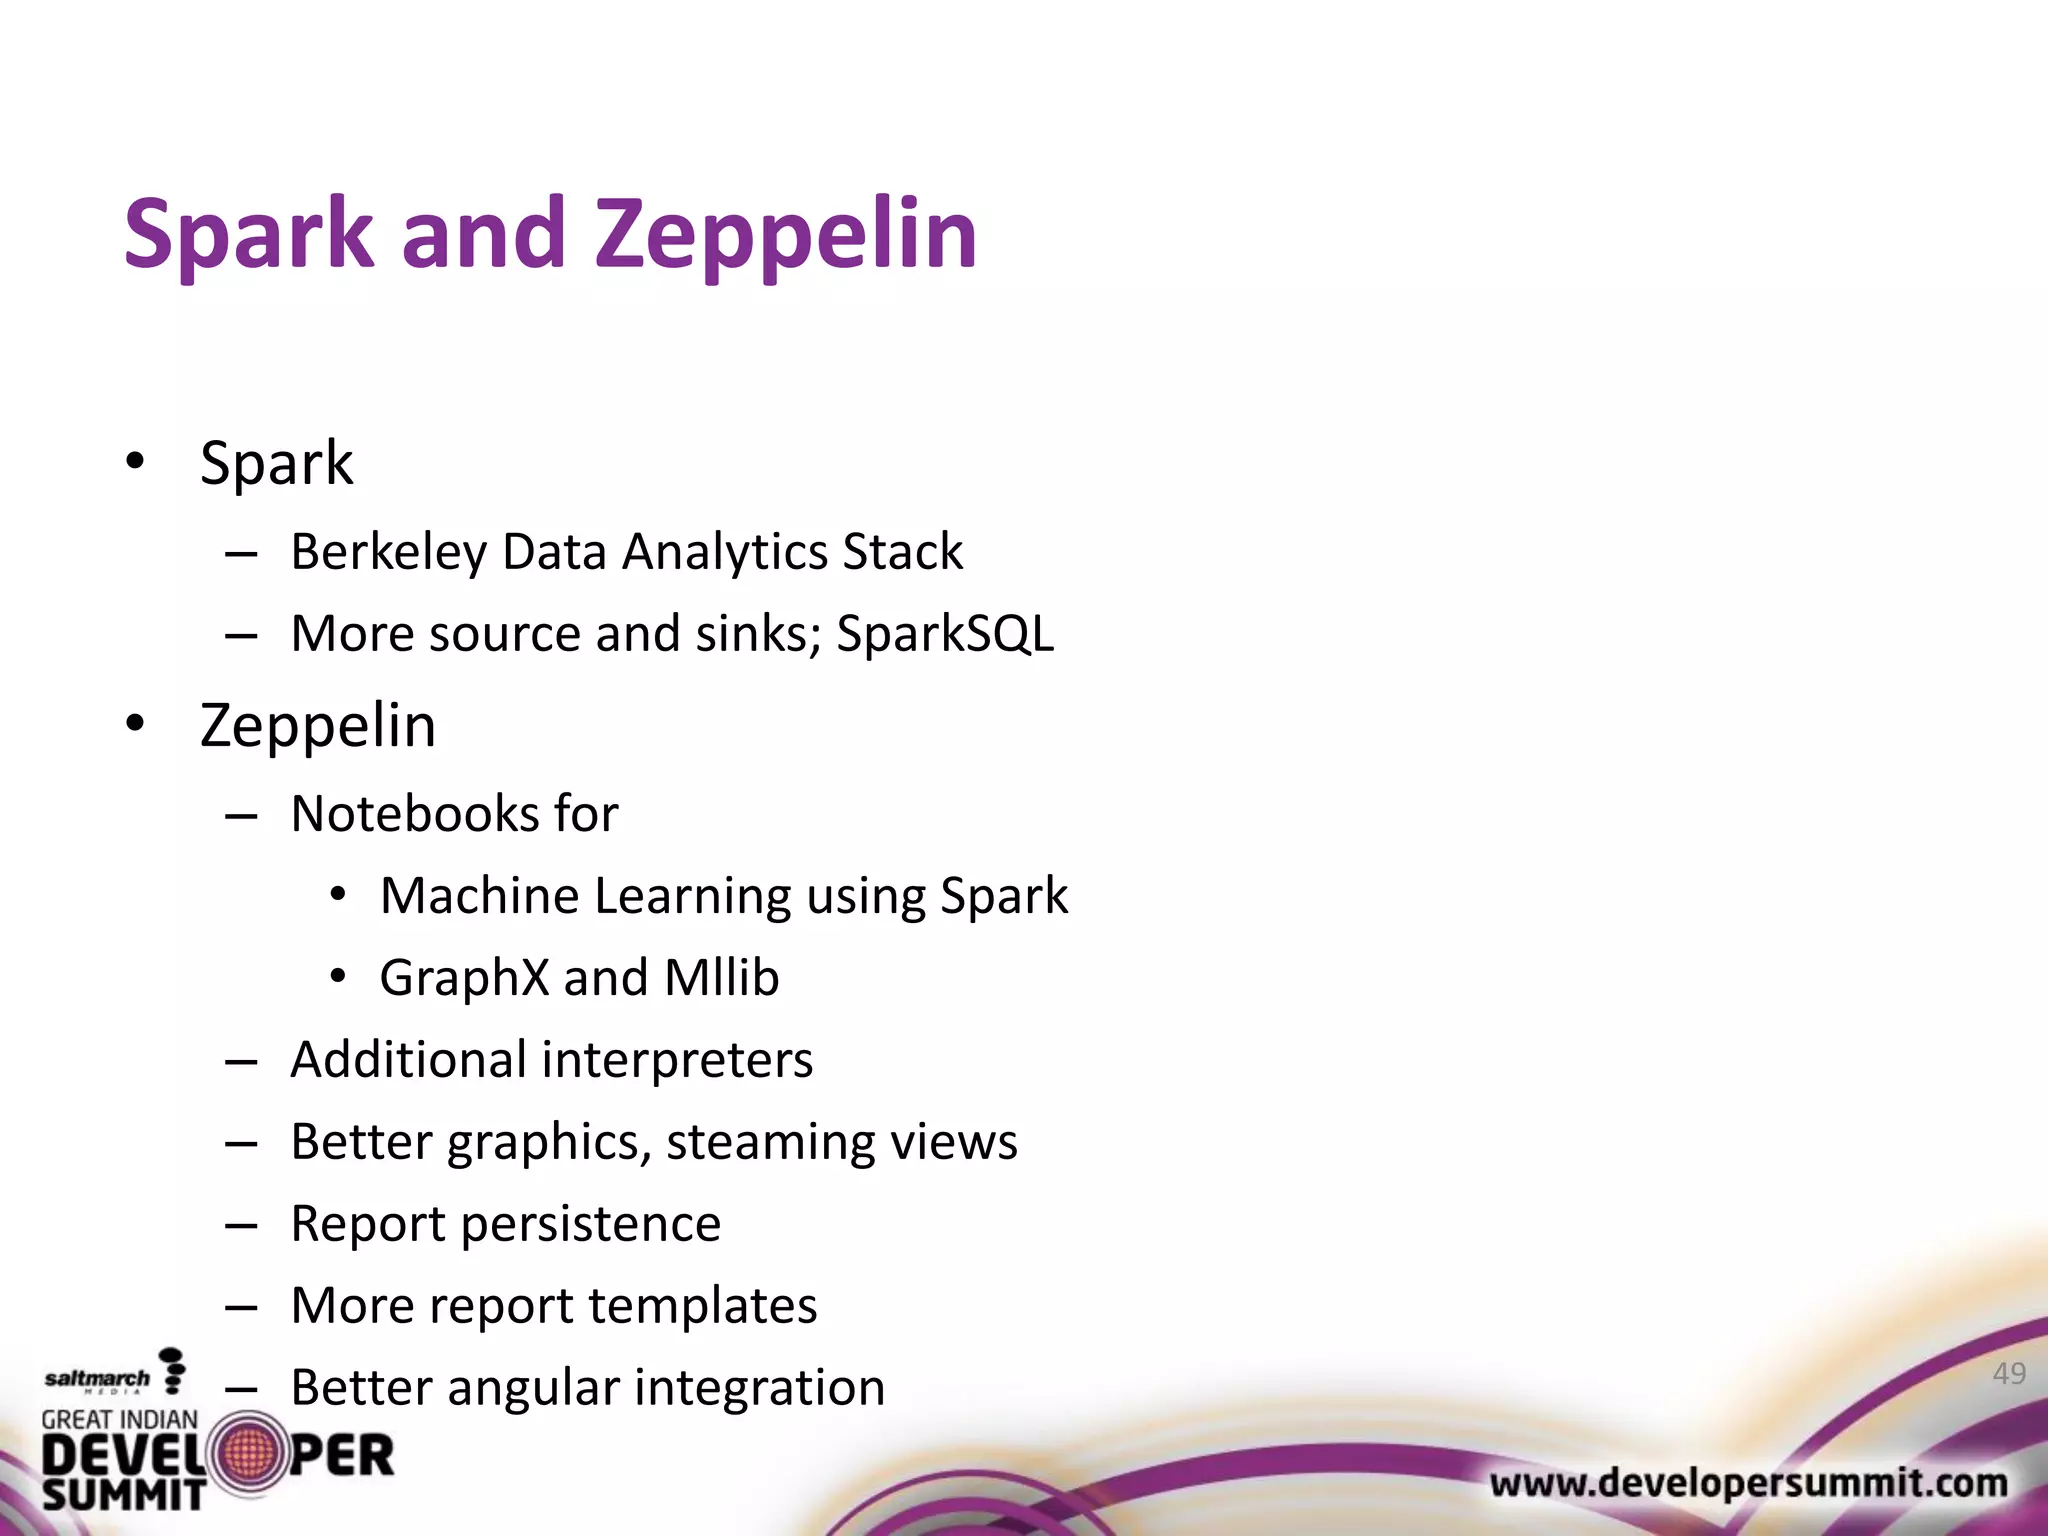
KEMBAR78
Big Data visualization with Apache Spark and Zeppelin | PDF
Big Data Visualization
using
Apache Spark and Zeppelin
Prajod Vettiyattil, Software Architect, Wipro
https://in.linkedin.com/in/prajod @prajods
Agenda
• Big Data and Ecosystem tools
• Apache Spark
• Apache Zeppelin
• Data Visualization
• Combining Spark and Zeppelin
2
BIG DATA AND ECOSYSTEM TOOLS
Big Data
• Data size beyond systems capability
– Terabyte, Petabyte, Exabyte
• Storage
– Commodity servers, RAID, SAN
• Processing
– In reasonable response time
– A challenge here
4
Server
Tradition processing tools
• Move what ?
– the data to the code or
– the code to the data
5
Data
Server
move data to code
move code to data
Code
Traditional processing tools
• Traditional tools
– RDBMS, DWH, BI
– High cost
– Difficult to scale beyond certain data size
• price/performance skew
• data variety not supported
6
Map-Reduce and NoSQL
• Hadoop toolset
– Free and open source
– Commodity hardware
– Scales to exabytes(1018), maybe even more
• Not only SQL
– Storage and query processing only
– Complements Hadoop toolset
– Volume, velocity and variety
7
All is well ?
• Hadoop was designed for batch processing
• Disk based processing: slow
• Many tools to enhance Hadoop’s capabilities
– Distributed cache, Haloop, Hive, HBase
• Not for interactive and iterative
8
TOWARDS SINGULARITY
What is singularity ?
10
0
1000
2000
3000
4000
5000
6000
7000
8000
1 2 3 4 5 6 7
AIcapacity
Decade
Decade vs AI capacity
Point of
singularity
Technological singularity
• When AI capability exceeds Human capacity
• AI or non-AI singularity
• 2045: http://en.wikipedia.org/wiki/Ray_Kurzweil
– The predicted year
11
APACHE SPARK
History of Spark
13
Spark 1.3.1
released
2015
March
Spark 1.0.0
released.
100TB sort
achieved in
23 mins
2014
Spark
donated to
Apache
Software
Foundation
2013
Spark
becomes
open
source.
2010
Spark
created by
Matei
Zaharia at
UC
Berkeley
2009
Contributors in Spark
• Yahoo
• Intel
• UC Berkeley
• …
• 50+ organizations
14
Hadoop and Spark
• Spark complements the Hadoop ecosystem
• Replaces: Hadoop MR
• Spark integrates with
– HDFS
– Hive
– HBase
– YARN
15
Other big data tools
• Spark also integrates with
– Kafka
– ZeroMQ
– Cassandra
– Mesos
16
Programming Spark
• Java
• Scala
• Python
• R
17
Spark toolset
18
Apache Spark
Spark
SQL
Spark
Streaming
MLlib GraphX
Spark R
Blink DB
Spark
Cassandra
Tachyon
What is Spark for ?
19
Batch
Interactive Streaming
The main difference: speed
• RAM access vs
Disk access
– RAM access is
100,000 times
faster !
20
https://gist.github.com/hellerbarde/2843375
Lambda Architecture pattern
• Used for Lambda
architecture
implementation
– Batch layer
– Speed layer
– Serving layer
21
Batch
Layer
Speed
Layer
Serving Layer
Data Input
Data
consumers
Worker Node
Executor
Deployment Architecture
22
Master Node
Executor
Task Cache
TaskTask
Worker Node
ExecutorExecutorExecutor
HDFS
Data
Node
HDFS
Data
Node
TaskTaskTask
Cache
Spark’s Cluster
Manager
Spark Driver
HDFS Name
Node
Core features of Spark
• Rich API
• RDD: Resilient Distributed Datasets
• DAG based execution
• Data caching
• Strong ecosystem tool support
23
Sample code in scala
• Find the top 100,000 Wikipedia pages by page views
• Log file format: code, title, num_hits
• enPages.map(l => l.split(" "))
.map(l => (l(1), l(2).toInt))
.reduceByKey(_+_, 200)
.filter(x => x._2 > 100000)
.map(x => (x._2, x._1))
.collect
.foreach(println)
24
APACHE ZEPPELIN
Interactive data analytics
• For Spark and Flink
• Web front end
• At the back end, it connects to
– SQL systems(Eg: Hive)
– Spark
– Flink
26
Deployment Architecture
27
Spark / Flink /
Hive
Zeppelin daemon
Web
browser 1
Web
browser 2
Web
browser 3
Web Server
Local
Interpreters
Optional
Remote
Interpreters
Notebook
• Is where you do your data analysis
• Web UI REPL with pluggable interpreters
• Interpreters
– Scala, Python, Angular, SparkSQL, Markdown and Shell
28
Notebook:view
29
User Interface features
• Markdown
• Dynamic HTML generation
• Dynamic chart generation
• Screen sharing via websockets
30
SQL Interpreter
• SQL shell
– Query spark data using SQL queries
– Return normal text, HTML or chart type results
31
Scala interpreter for Spark
• Similar to the Spark shell
• Upload your data into Spark
• Query the data sets(RDDs) in your Spark server
• Execute map-reduce tasks
• Actions on RDD
• Transformations on RDD
32
DATA VISUALIZATION
Visualization tools
34
Source: http://selection.datavisualization.ch/
D3 Visualizations
35
Source: https://github.com/mbostock/d3/wiki/Gallery
The need for visualization
36
Big Data
Do
something
to data
User gets
comprehensible
data
Tools for Data Presentation Architecture
37
1.Identify
2.Locate
3.Manipulate
4.Format
5.Present
A data analysis tool/toolset would support:
COMBINING SPARK AND ZEPPELIN
Spark and Zeppelin
39
Spark
Worker
Node
Spark
Master
Node
Spark
Worker
Node
Zeppelin daemon
Web
browser 1
Web
browser 2
Web
browser 3
Web Server
Local
Interpreters
Remote
Interpreters
Zeppelin views: Table from SQL
40
Zeppelin views: Table from SQL
41
%sql select age, count(1) from bank where
marital="${marital=single,single|divorced|married}"
group by age order by age
Zeppelin views: Pie chart from SQL
42
Zeppelin views: Bar chart from SQL
43
Zeppelin views: Angular
44
Share variables: MVVM
• Between Scala/Python/Spark and Angular
• Observe scala variables from angular
45
Scala-Spark Angular
x = “foo” x = “bar”
Zeppelin
Zeppelin views: Angular-scala binding
46
Screen sharing using Zeppelin
• Share your graphical reports
– Live sharing
– Get the share URL from zeppelin and share with others
– Uses websockets
• Embed live reports in web pages
47
FUTURE
Spark and Zeppelin
• Spark
– Berkeley Data Analytics Stack
– More source and sinks; SparkSQL
• Zeppelin
– Notebooks for
• Machine Learning using Spark
• GraphX and Mllib
– Additional interpreters
– Better graphics, steaming views
– Report persistence
– More report templates
– Better angular integration 49
SUMMARY
Summary
• Spark and tools
• The need for visualization
• The role of Zeppelin
• Zeppelin – Spark integration
51
@prajods

Big Data visualization with Apache Spark and Zeppelin