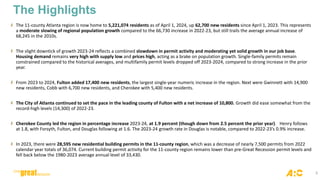
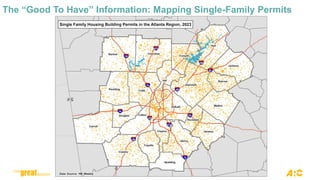
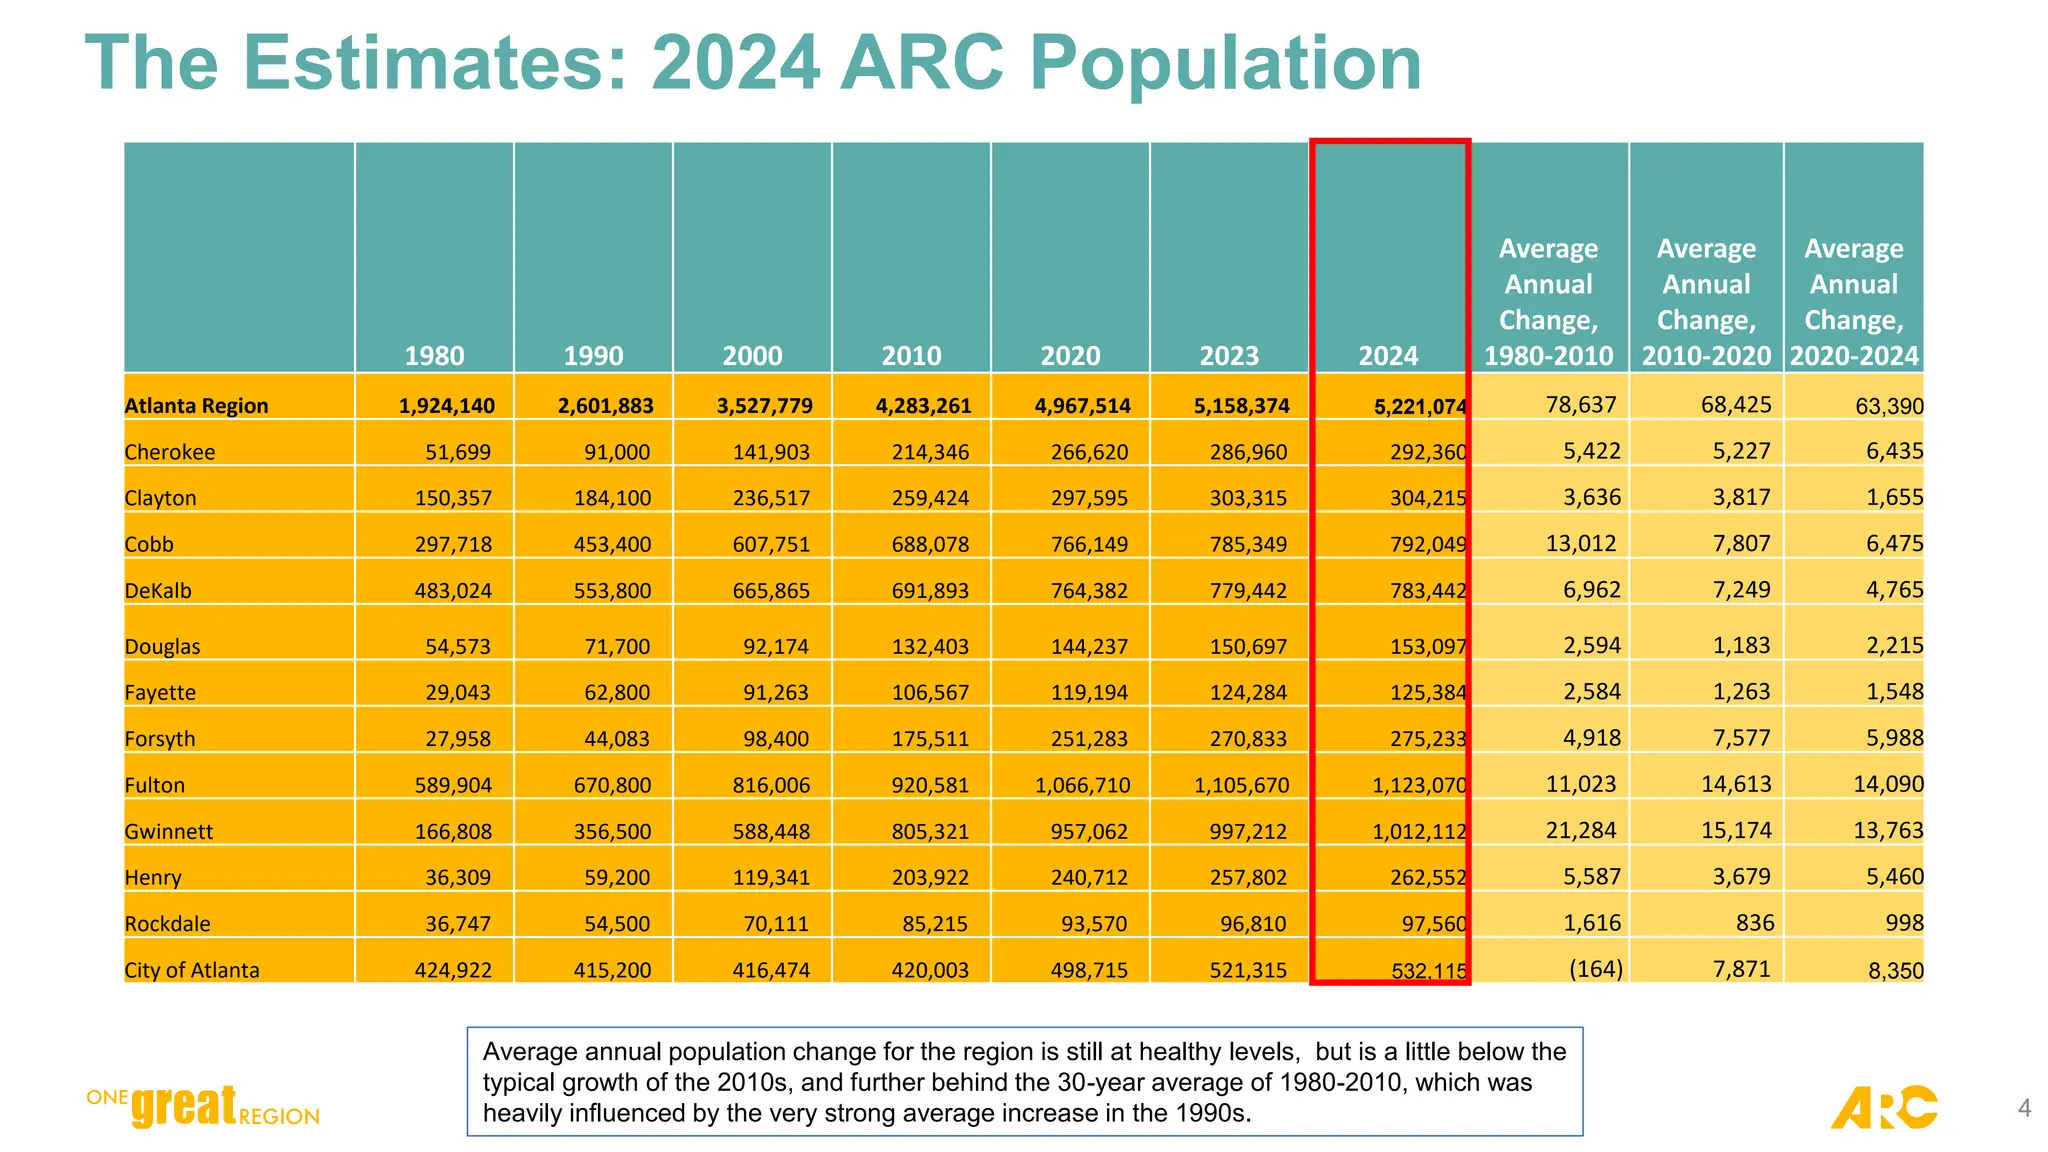
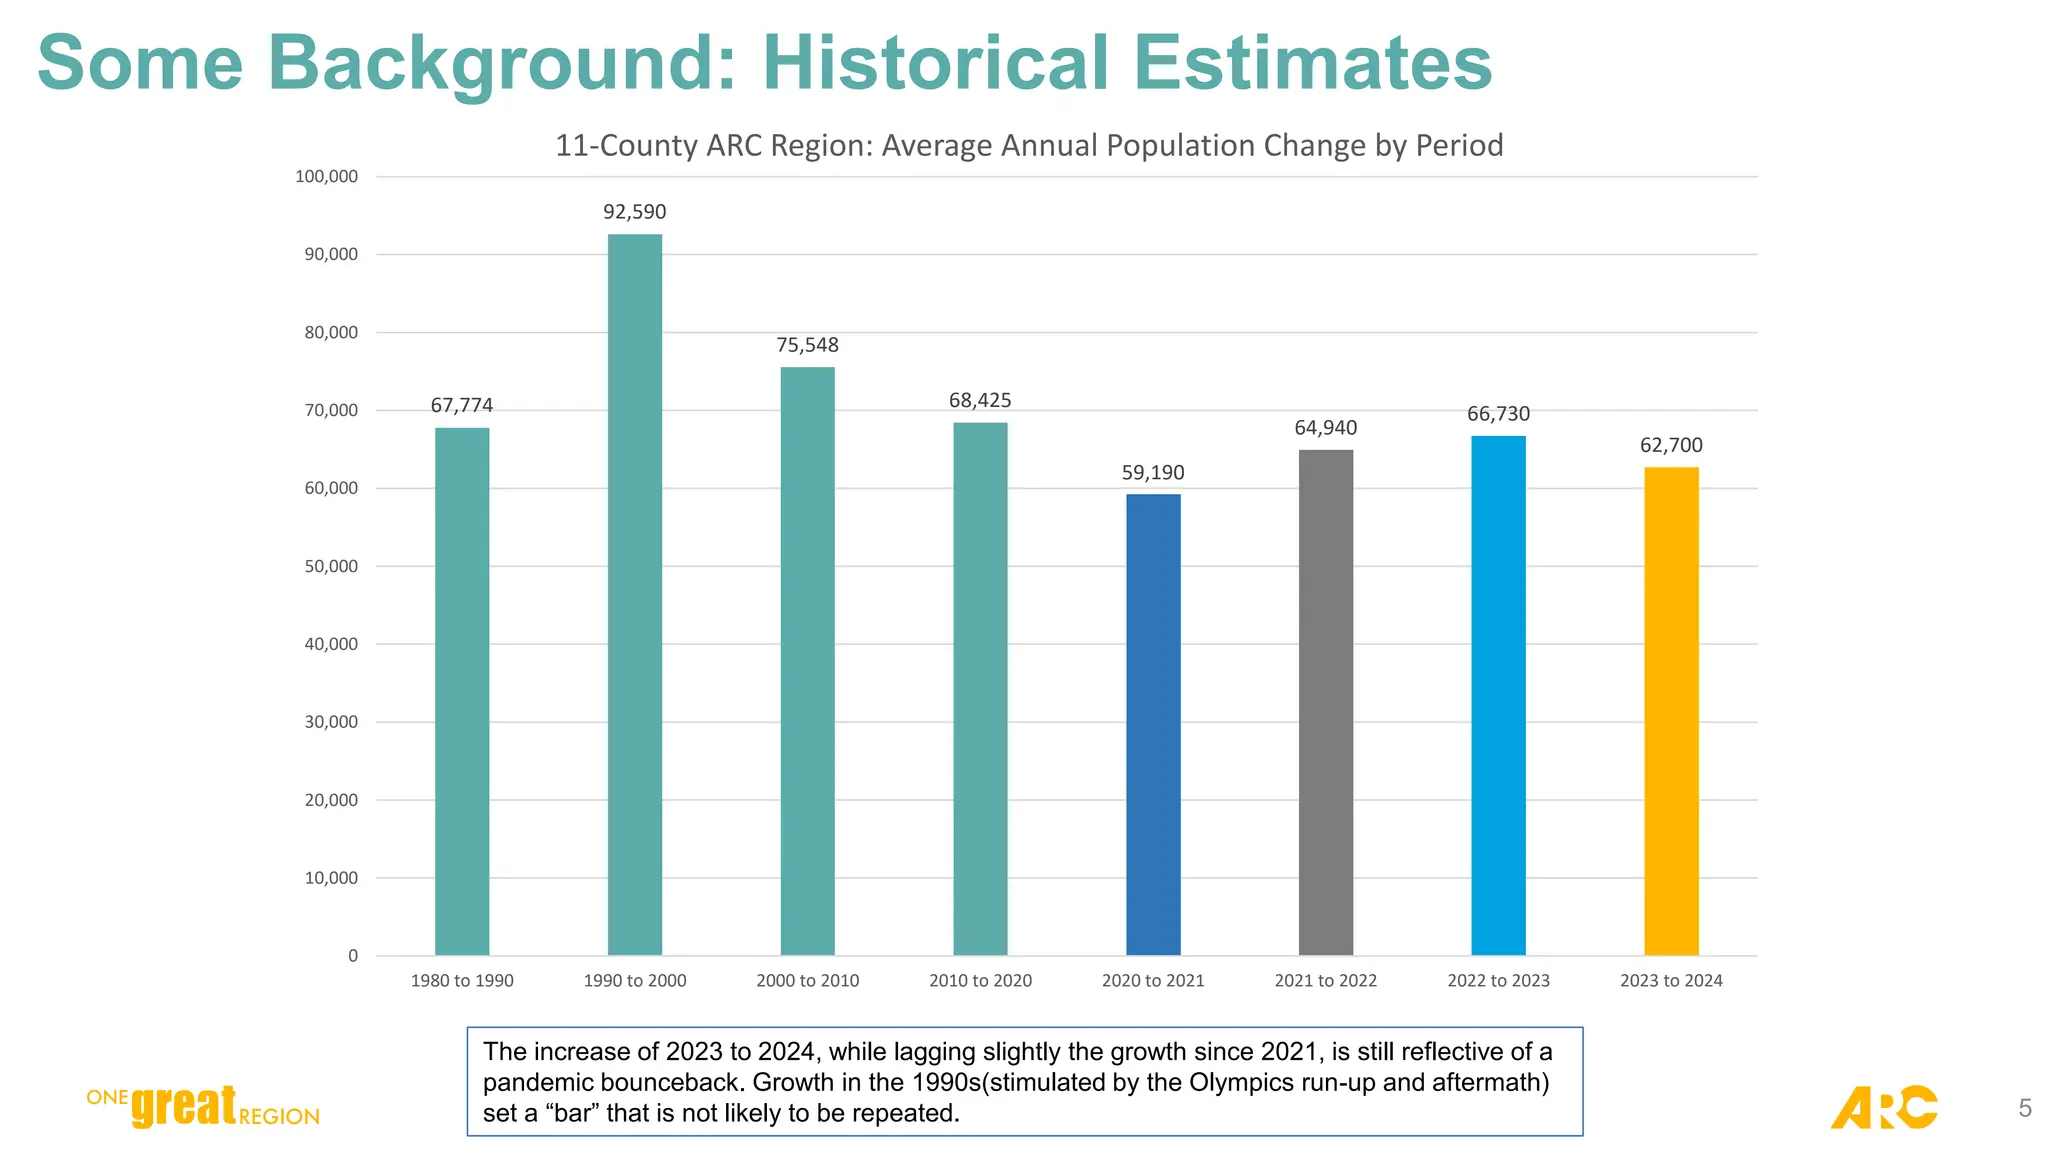
KEMBAR78
Blog Version 2024 Population Estimates Summary | PDF
2024 Population Estimates
1
Mike Carnathan
Managing Director, Research & Analytics Department
mcarnathan@atlantaregional.org
3
The Highlights
The 11-county Atlanta region is now home to 5,221,074 residents as of April 1, 2024, up 62,700 new residents since April 1, 2023. This represents
a moderate slowing of regional population growth compared to the 66,730 increase in 2022-23, but still trails the average annual increase of
68,245 in the 2010s.
The slight downtick of growth 2023-24 reflects a combined slowdown in permit activity and moderating yet solid growth in our job base.
Housing demand remains very high with supply low and prices high, acting as a brake on population growth. Single-family permits remain
constrained compared to the historical averages, and multifamily permit levels dropped off 2023-2024, compared to strong increase in the prior
year.
From 2023 to 2024, Fulton added 17,400 new residents, the largest single-year numeric increase in the region. Next were Gwinnett with 14,900
new residents, Cobb with 6,700 new residents, and Cherokee with 5,400 new residents.
The City of Atlanta continued to set the pace in the leading county of Fulton with a net increase of 10,800. Growth did ease somewhat from the
record-high levels (14,300) of 2022-23.
Cherokee County led the region in percentage increase 2023-24, at 1.9 percent (though down from 2.5 percent the prior year). Henry follows
at 1.8, with Forsyth, Fulton, and Douglas following at 1.6. The 2023-24 growth rate in Douglas is notable, compared to 2022-23’s 0.9% increase.
In 2023, there were 28,595 new residential building permits in the 11-county region, which was a decrease of nearly 7,500 permits from 2022
calendar year totals of 36,074. Current building permit activity for the 11-county region remains lower than pre-Great Recession permit levels and
fell back below the 1980-2023 average annual level of 33,430.
1980 1990 2000 2010 2020 2023 2024
Average
Annual
Change,
1980-2010
Average
Annual
Change,
2010-2020
Average
Annual
Change,
2020-2024
Atlanta Region 1,924,140 2,601,883 3,527,779 4,283,261 4,967,514 5,158,374 5,221,074 78,637 68,425 63,390
Cherokee 51,699 91,000 141,903 214,346 266,620 286,960 292,360 5,422 5,227 6,435
Clayton 150,357 184,100 236,517 259,424 297,595 303,315 304,215 3,636 3,817 1,655
Cobb 297,718 453,400 607,751 688,078 766,149 785,349 792,049 13,012 7,807 6,475
DeKalb 483,024 553,800 665,865 691,893 764,382 779,442 783,442 6,962 7,249 4,765
Douglas 54,573 71,700 92,174 132,403 144,237 150,697 153,097 2,594 1,183 2,215
Fayette 29,043 62,800 91,263 106,567 119,194 124,284 125,384 2,584 1,263 1,548
Forsyth 27,958 44,083 98,400 175,511 251,283 270,833 275,233 4,918 7,577 5,988
Fulton 589,904 670,800 816,006 920,581 1,066,710 1,105,670 1,123,070 11,023 14,613 14,090
Gwinnett 166,808 356,500 588,448 805,321 957,062 997,212 1,012,112 21,284 15,174 13,763
Henry 36,309 59,200 119,341 203,922 240,712 257,802 262,552 5,587 3,679 5,460
Rockdale 36,747 54,500 70,111 85,215 93,570 96,810 97,560 1,616 836 998
City of Atlanta 424,922 415,200 416,474 420,003 498,715 521,315 532,115 (164) 7,871 8,350
4
The Estimates: 2024 ARC Population
Average annual population change for the region is still at healthy levels, but is a little below the
typical growth of the 2010s, and further behind the 30-year average of 1980-2010, which was
heavily influenced by the very strong average increase in the 1990s.
5
Some Background: Historical Estimates
67,774
92,590
75,548
68,425
59,190
64,940
66,730
62,700
0
10,000
20,000
30,000
40,000
50,000
60,000
70,000
80,000
90,000
100,000
1980 to 1990 1990 to 2000 2000 to 2010 2010 to 2020 2020 to 2021 2021 to 2022 2022 to 2023 2023 to 2024
11-County ARC Region: Average Annual Population Change by Period
The increase of 2023 to 2024, while lagging slightly the growth since 2021, is still reflective of a
pandemic bounceback. Growth in the 1990s(stimulated by the Olympics run-up and aftermath)
set a “bar” that is not likely to be repeated.
Source: Bureau of Labor Statistics
The Supporting Facts: Jobs Recovery From Pandemic (Feb 2020 – May 2024)
6.4%
-5.0%
0.0%
5.0%
10.0%
15.0%
20.0%
Austin Dallas Las Vegas Orlando Houston Miami Atlanta Denver Chicago Washington
DC
Minneapolis Boston Los Angeles
% Change since Pre-Pandemic
Job change is a co-indicator of population growth, and it slowed thuis past year. The Atlanta job
base economy had fully recovered from the early pandemic “crash” by late 2021. By 2023, jobs
had increased 5.3% from a February 2020 benchmark. Atlanta then ranked fifth among the
selected peer regions shown above. By 2024, the rate of change had ticked up only to 6.4%
and the relayive rank had fallen to 7th.
The Supporting Facts: Building Permits – Long View
Source: State of the Cities Data System (HUD)
0
10,000
20,000
30,000
40,000
50,000
60,000
43-Year Annual Average: 33,430
Permits fell back to under 29,000 in 2023 for a drop of 7,500 from 2022 levels. 2022 had marked the
first year since 2005 that the annual increase exceeded the long-term average (1980-2023).
The Supporting Facts: Building Permits – Last Year (2023)
Source: State of the Cities Data System (HUD)
1,139
2,196
323
1,152
711
540 354
1,121
1,766
4,142
1,681
385
6,482
30
25
1,804
1,565
484
0
250
714
1,281
450
0
0
500
1,000
1,500
2,000
2,500
3,000
3,500
4,000
4,500
5,000
5,500
6,000
6,500
7,000
7,500
8,000
City of
Atlanta
Cherokee Clayton Cobb DeKalb Douglas Fayette Forsyth Fulton
Non-COA
Gwinnett Henry Rockdale
Single-Family Multifamily
The City of Atlanta continued to lead the region in multifamily permitting for 2023, though much
reduced from 2022. Single-family permits in 2023 (see below) were paced by Gwinnett County,
followed distantly by Cherokee (2,196).
The “Good To Have” Information: Mapping Single-Family Permits
The “Good To Have” Information: Mapping Multi-Family Units
Source: Co-Star

Blog Version 2024 Population Estimates Summary

  • 1.
    2024 Population Estimates 1 MikeCarnathan Managing Director, Research & Analytics Department mcarnathan@atlantaregional.org
  • 3.
    3 The Highlights The 11-countyAtlanta region is now home to 5,221,074 residents as of April 1, 2024, up 62,700 new residents since April 1, 2023. This represents a moderate slowing of regional population growth compared to the 66,730 increase in 2022-23, but still trails the average annual increase of 68,245 in the 2010s. The slight downtick of growth 2023-24 reflects a combined slowdown in permit activity and moderating yet solid growth in our job base. Housing demand remains very high with supply low and prices high, acting as a brake on population growth. Single-family permits remain constrained compared to the historical averages, and multifamily permit levels dropped off 2023-2024, compared to strong increase in the prior year. From 2023 to 2024, Fulton added 17,400 new residents, the largest single-year numeric increase in the region. Next were Gwinnett with 14,900 new residents, Cobb with 6,700 new residents, and Cherokee with 5,400 new residents. The City of Atlanta continued to set the pace in the leading county of Fulton with a net increase of 10,800. Growth did ease somewhat from the record-high levels (14,300) of 2022-23. Cherokee County led the region in percentage increase 2023-24, at 1.9 percent (though down from 2.5 percent the prior year). Henry follows at 1.8, with Forsyth, Fulton, and Douglas following at 1.6. The 2023-24 growth rate in Douglas is notable, compared to 2022-23’s 0.9% increase. In 2023, there were 28,595 new residential building permits in the 11-county region, which was a decrease of nearly 7,500 permits from 2022 calendar year totals of 36,074. Current building permit activity for the 11-county region remains lower than pre-Great Recession permit levels and fell back below the 1980-2023 average annual level of 33,430.
  • 4.
    1980 1990 20002010 2020 2023 2024 Average Annual Change, 1980-2010 Average Annual Change, 2010-2020 Average Annual Change, 2020-2024 Atlanta Region 1,924,140 2,601,883 3,527,779 4,283,261 4,967,514 5,158,374 5,221,074 78,637 68,425 63,390 Cherokee 51,699 91,000 141,903 214,346 266,620 286,960 292,360 5,422 5,227 6,435 Clayton 150,357 184,100 236,517 259,424 297,595 303,315 304,215 3,636 3,817 1,655 Cobb 297,718 453,400 607,751 688,078 766,149 785,349 792,049 13,012 7,807 6,475 DeKalb 483,024 553,800 665,865 691,893 764,382 779,442 783,442 6,962 7,249 4,765 Douglas 54,573 71,700 92,174 132,403 144,237 150,697 153,097 2,594 1,183 2,215 Fayette 29,043 62,800 91,263 106,567 119,194 124,284 125,384 2,584 1,263 1,548 Forsyth 27,958 44,083 98,400 175,511 251,283 270,833 275,233 4,918 7,577 5,988 Fulton 589,904 670,800 816,006 920,581 1,066,710 1,105,670 1,123,070 11,023 14,613 14,090 Gwinnett 166,808 356,500 588,448 805,321 957,062 997,212 1,012,112 21,284 15,174 13,763 Henry 36,309 59,200 119,341 203,922 240,712 257,802 262,552 5,587 3,679 5,460 Rockdale 36,747 54,500 70,111 85,215 93,570 96,810 97,560 1,616 836 998 City of Atlanta 424,922 415,200 416,474 420,003 498,715 521,315 532,115 (164) 7,871 8,350 4 The Estimates: 2024 ARC Population Average annual population change for the region is still at healthy levels, but is a little below the typical growth of the 2010s, and further behind the 30-year average of 1980-2010, which was heavily influenced by the very strong average increase in the 1990s.
  • 5.
    5 Some Background: HistoricalEstimates 67,774 92,590 75,548 68,425 59,190 64,940 66,730 62,700 0 10,000 20,000 30,000 40,000 50,000 60,000 70,000 80,000 90,000 100,000 1980 to 1990 1990 to 2000 2000 to 2010 2010 to 2020 2020 to 2021 2021 to 2022 2022 to 2023 2023 to 2024 11-County ARC Region: Average Annual Population Change by Period The increase of 2023 to 2024, while lagging slightly the growth since 2021, is still reflective of a pandemic bounceback. Growth in the 1990s(stimulated by the Olympics run-up and aftermath) set a “bar” that is not likely to be repeated.
  • 6.
    Source: Bureau ofLabor Statistics The Supporting Facts: Jobs Recovery From Pandemic (Feb 2020 – May 2024) 6.4% -5.0% 0.0% 5.0% 10.0% 15.0% 20.0% Austin Dallas Las Vegas Orlando Houston Miami Atlanta Denver Chicago Washington DC Minneapolis Boston Los Angeles % Change since Pre-Pandemic Job change is a co-indicator of population growth, and it slowed thuis past year. The Atlanta job base economy had fully recovered from the early pandemic “crash” by late 2021. By 2023, jobs had increased 5.3% from a February 2020 benchmark. Atlanta then ranked fifth among the selected peer regions shown above. By 2024, the rate of change had ticked up only to 6.4% and the relayive rank had fallen to 7th.
  • 7.
    The Supporting Facts:Building Permits – Long View Source: State of the Cities Data System (HUD) 0 10,000 20,000 30,000 40,000 50,000 60,000 43-Year Annual Average: 33,430 Permits fell back to under 29,000 in 2023 for a drop of 7,500 from 2022 levels. 2022 had marked the first year since 2005 that the annual increase exceeded the long-term average (1980-2023).
  • 8.
    The Supporting Facts:Building Permits – Last Year (2023) Source: State of the Cities Data System (HUD) 1,139 2,196 323 1,152 711 540 354 1,121 1,766 4,142 1,681 385 6,482 30 25 1,804 1,565 484 0 250 714 1,281 450 0 0 500 1,000 1,500 2,000 2,500 3,000 3,500 4,000 4,500 5,000 5,500 6,000 6,500 7,000 7,500 8,000 City of Atlanta Cherokee Clayton Cobb DeKalb Douglas Fayette Forsyth Fulton Non-COA Gwinnett Henry Rockdale Single-Family Multifamily The City of Atlanta continued to lead the region in multifamily permitting for 2023, though much reduced from 2022. Single-family permits in 2023 (see below) were paced by Gwinnett County, followed distantly by Cherokee (2,196).
  • 9.
    The “Good ToHave” Information: Mapping Single-Family Permits
  • 10.
    The “Good ToHave” Information: Mapping Multi-Family Units Source: Co-Star