Download to read offline


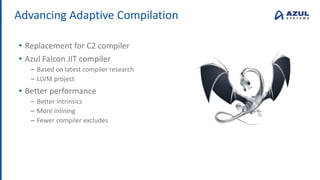


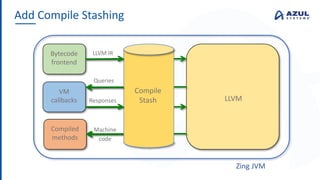


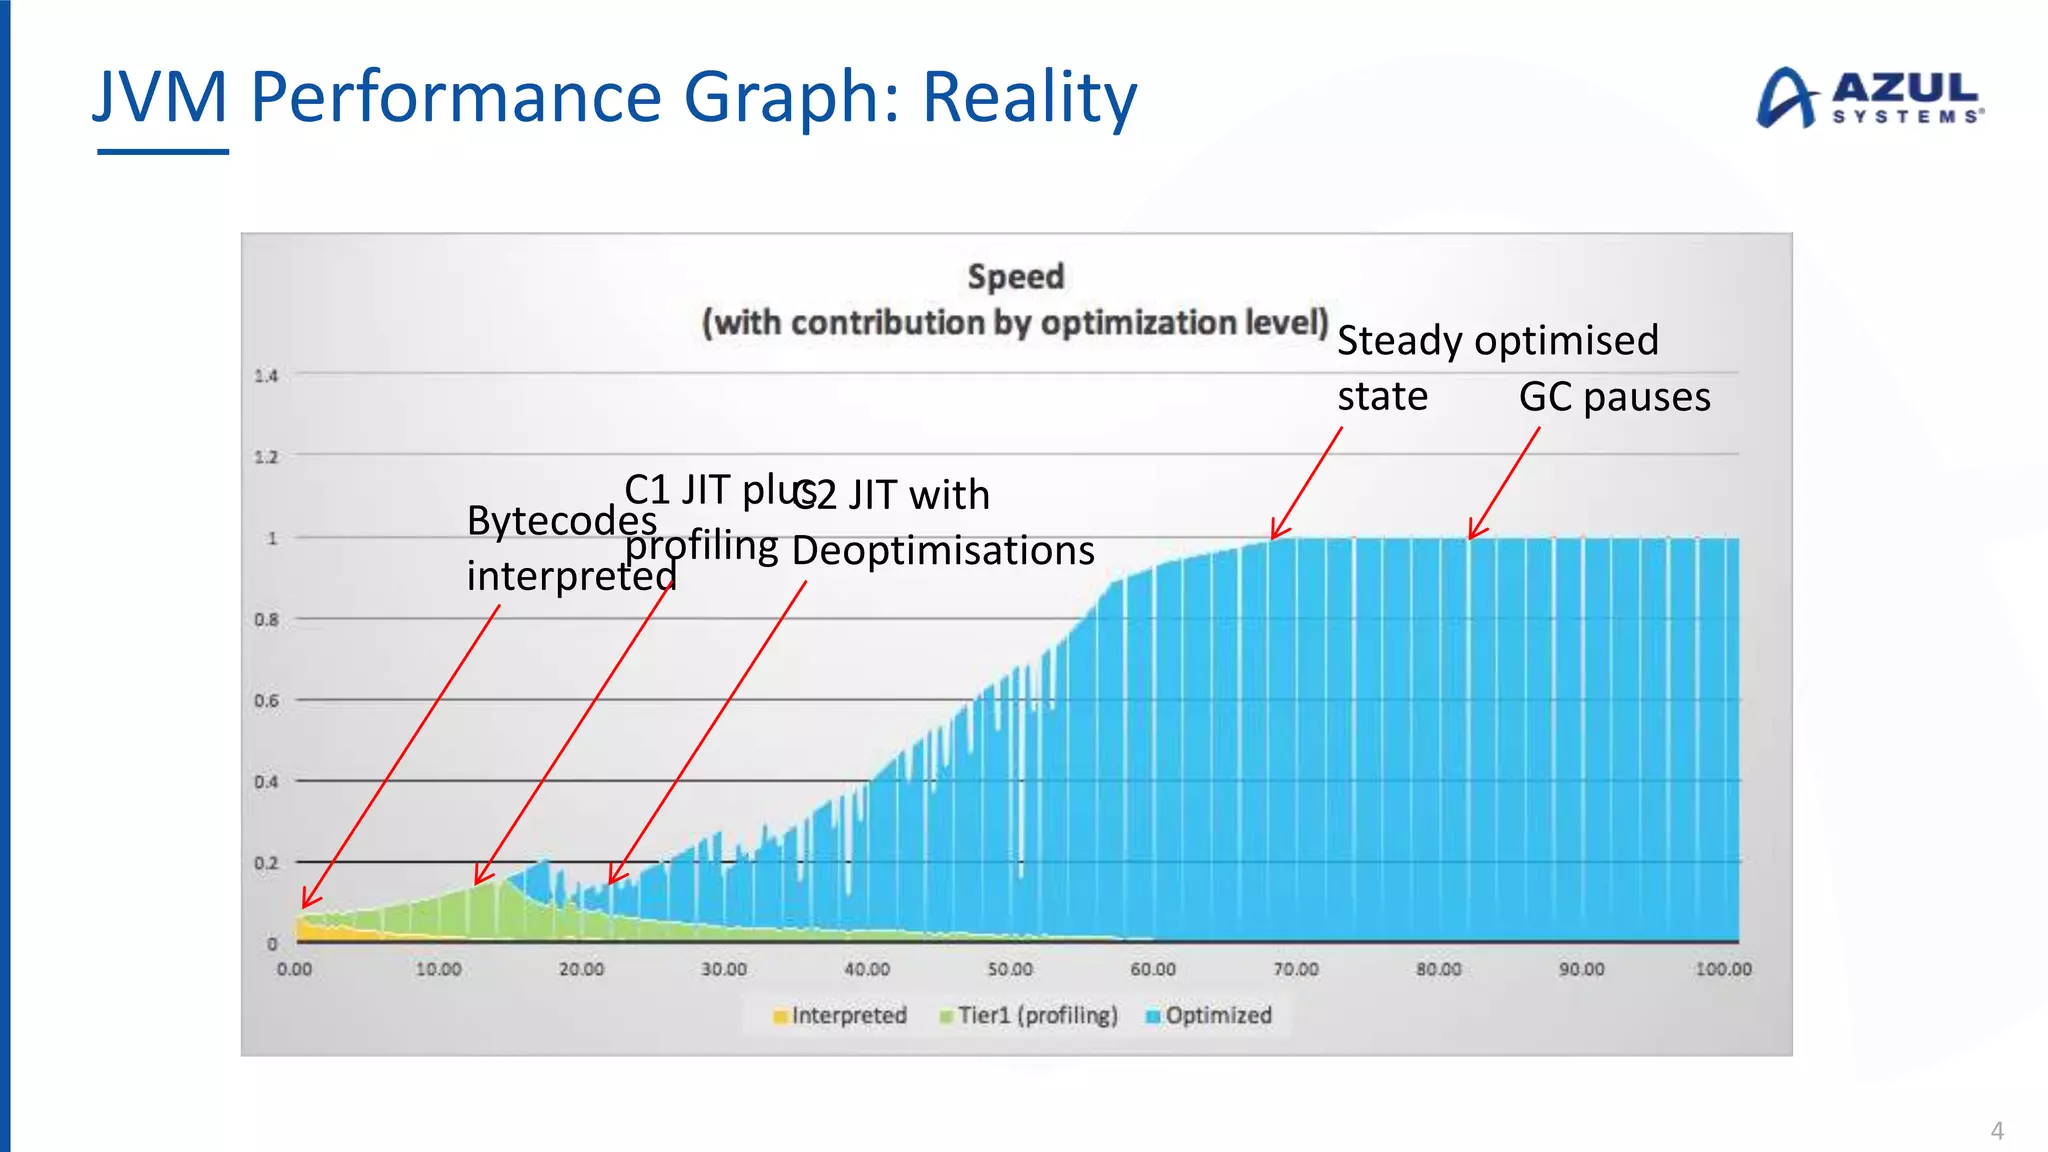
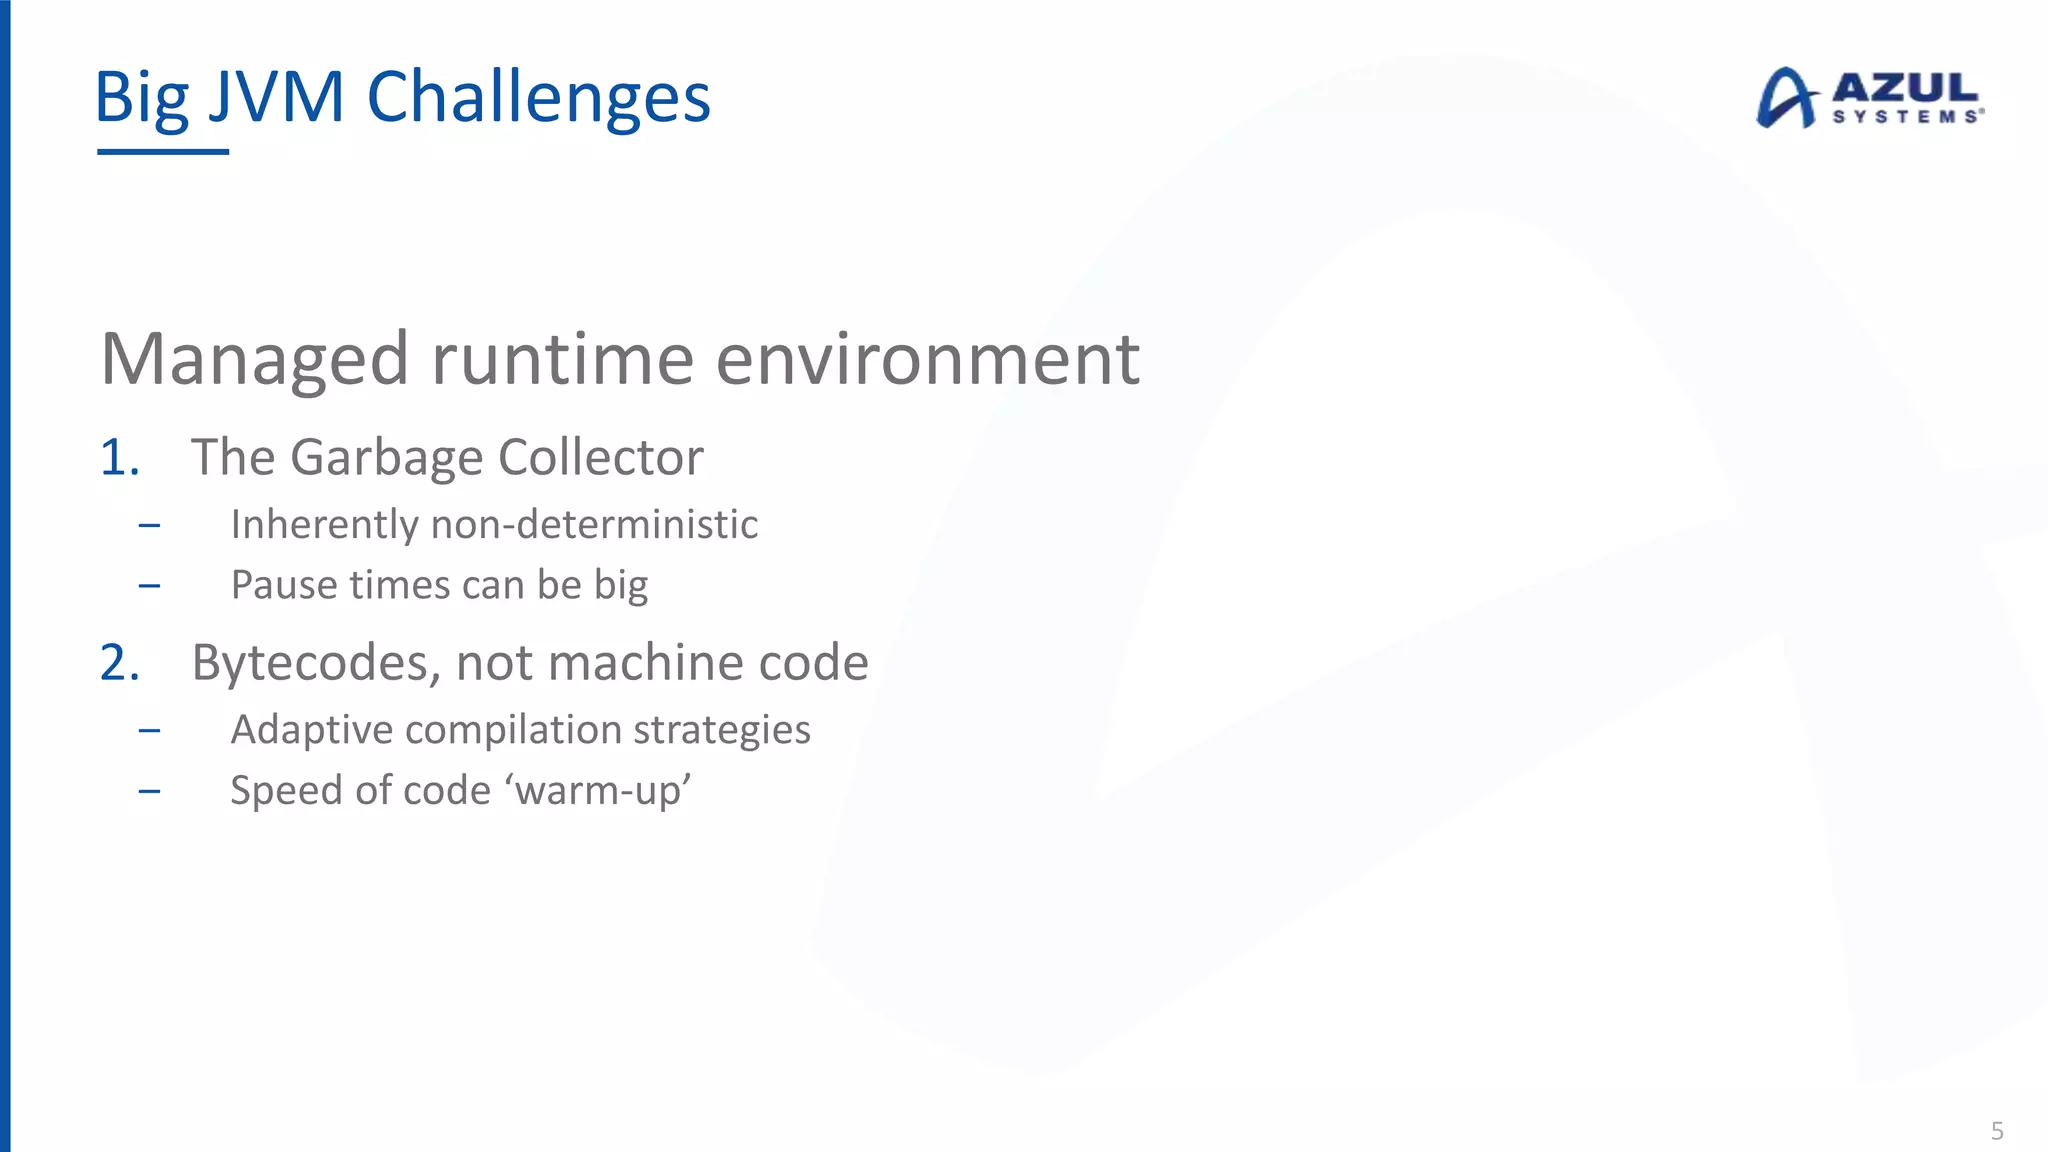

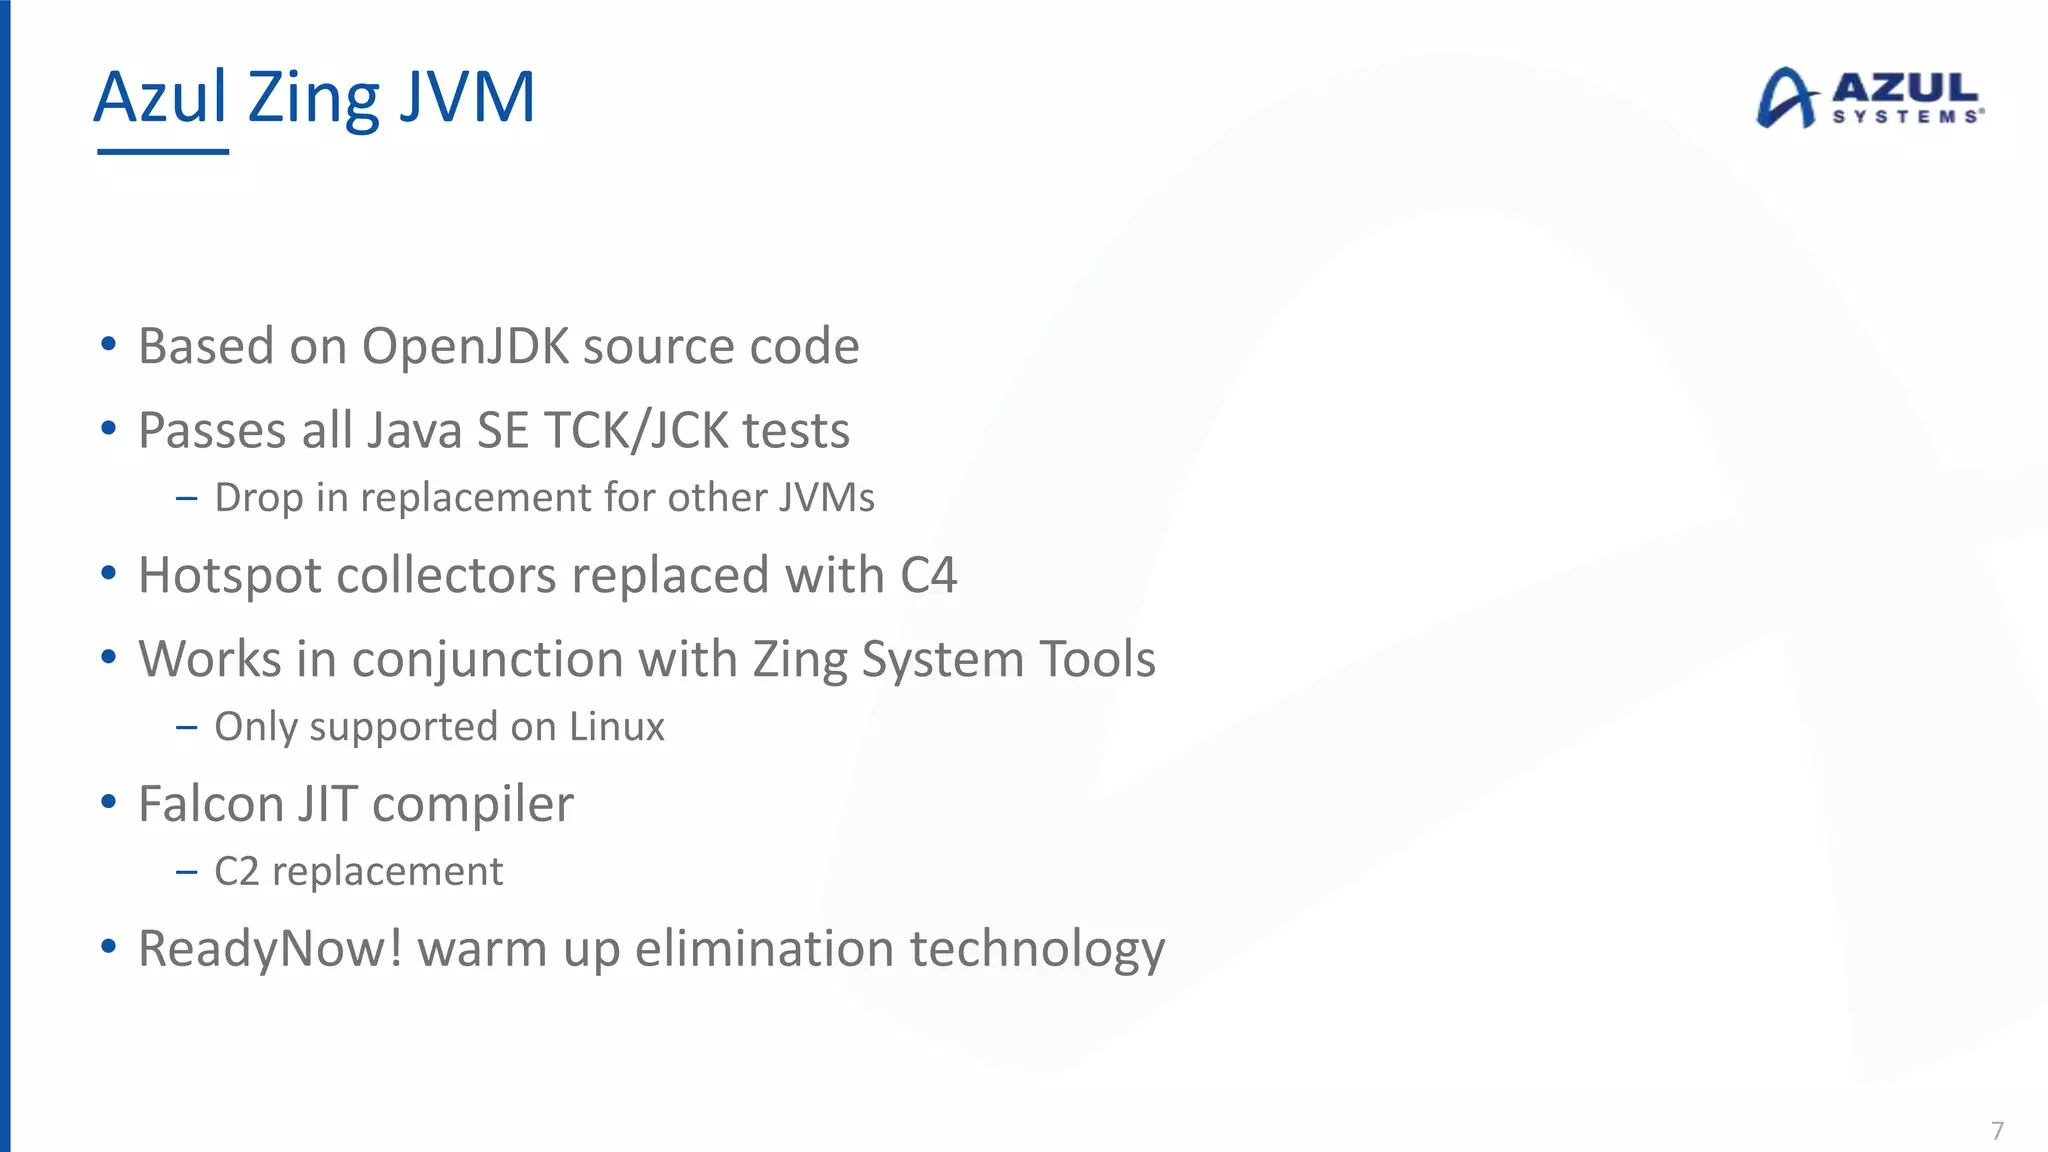
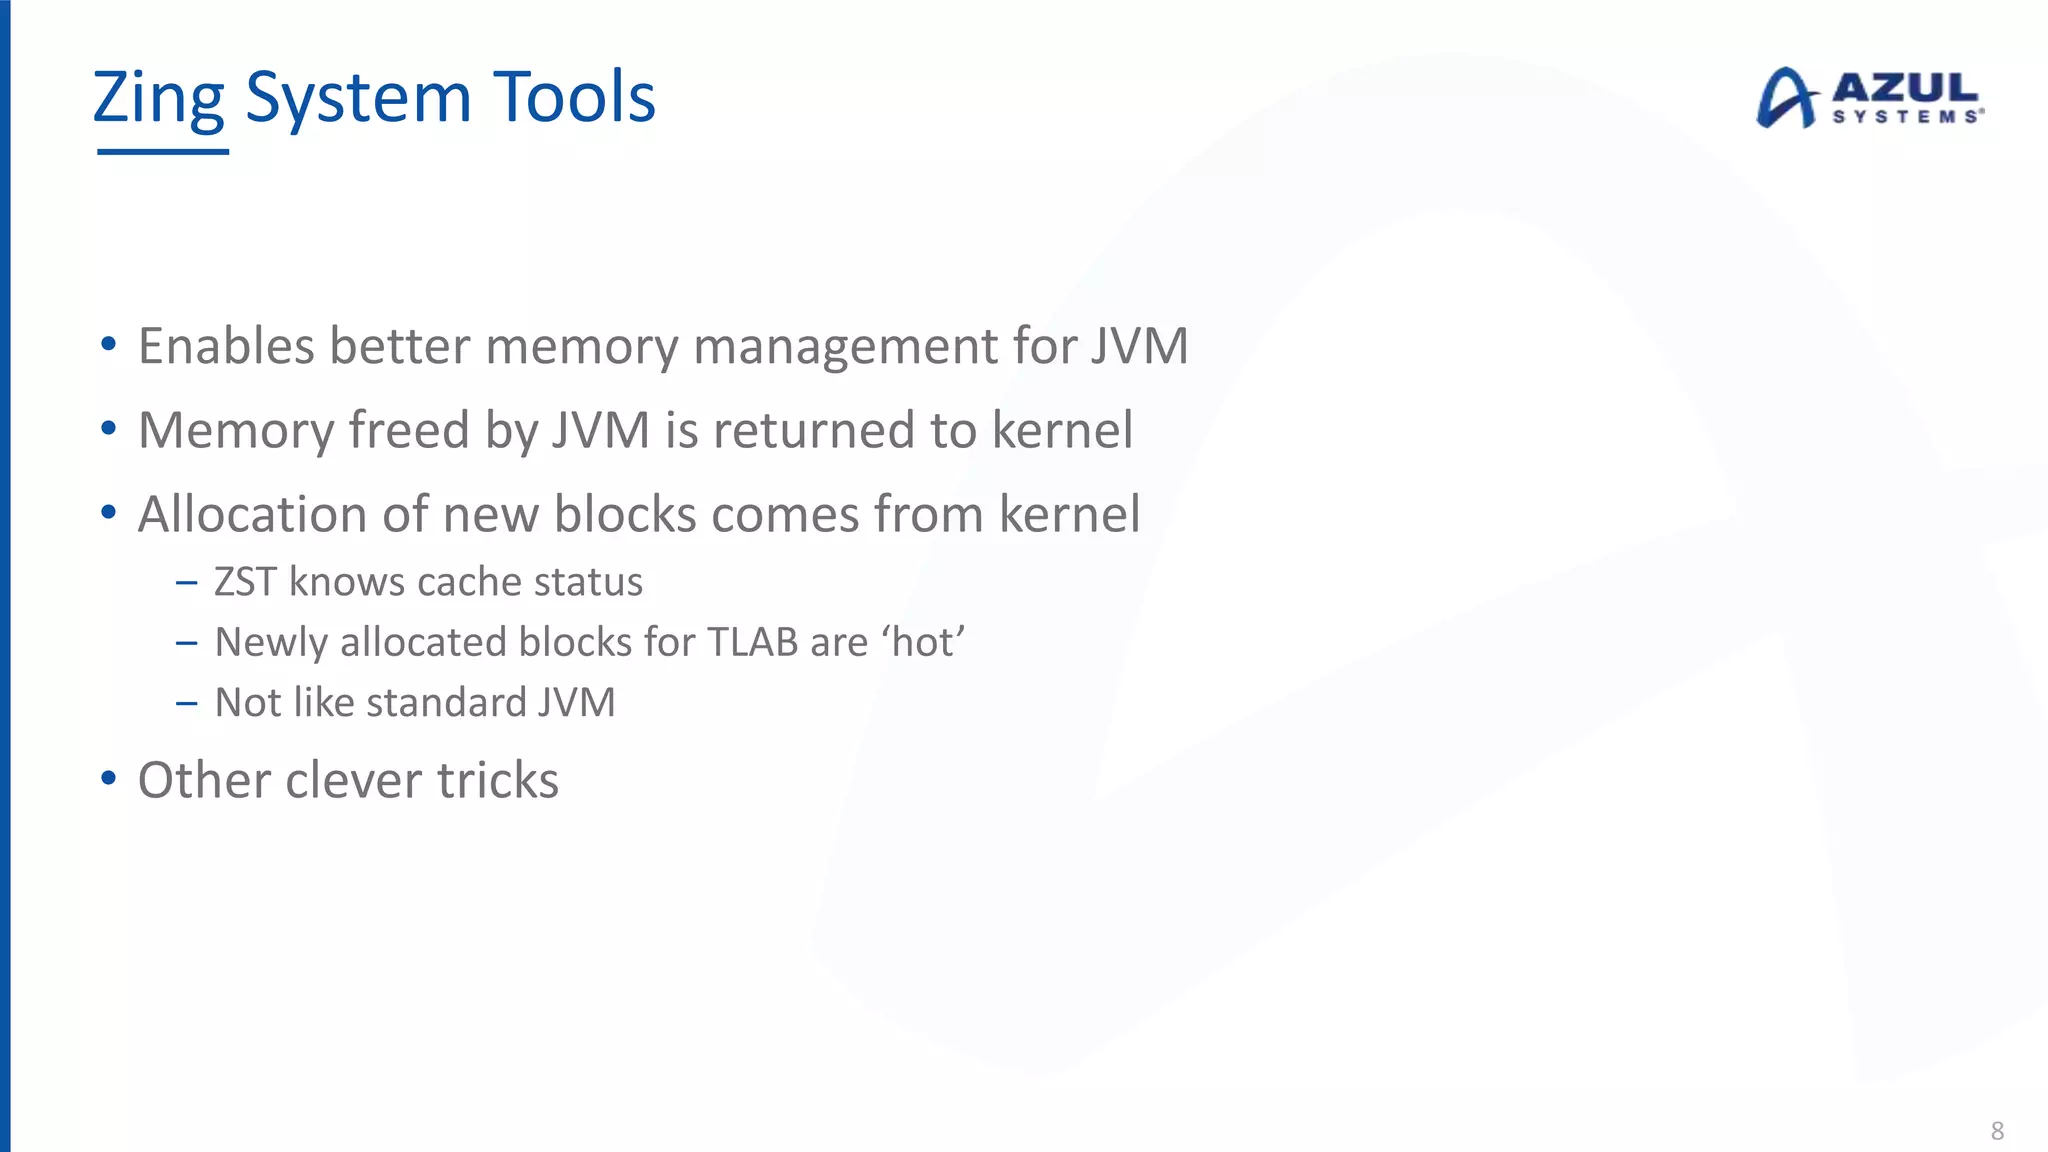


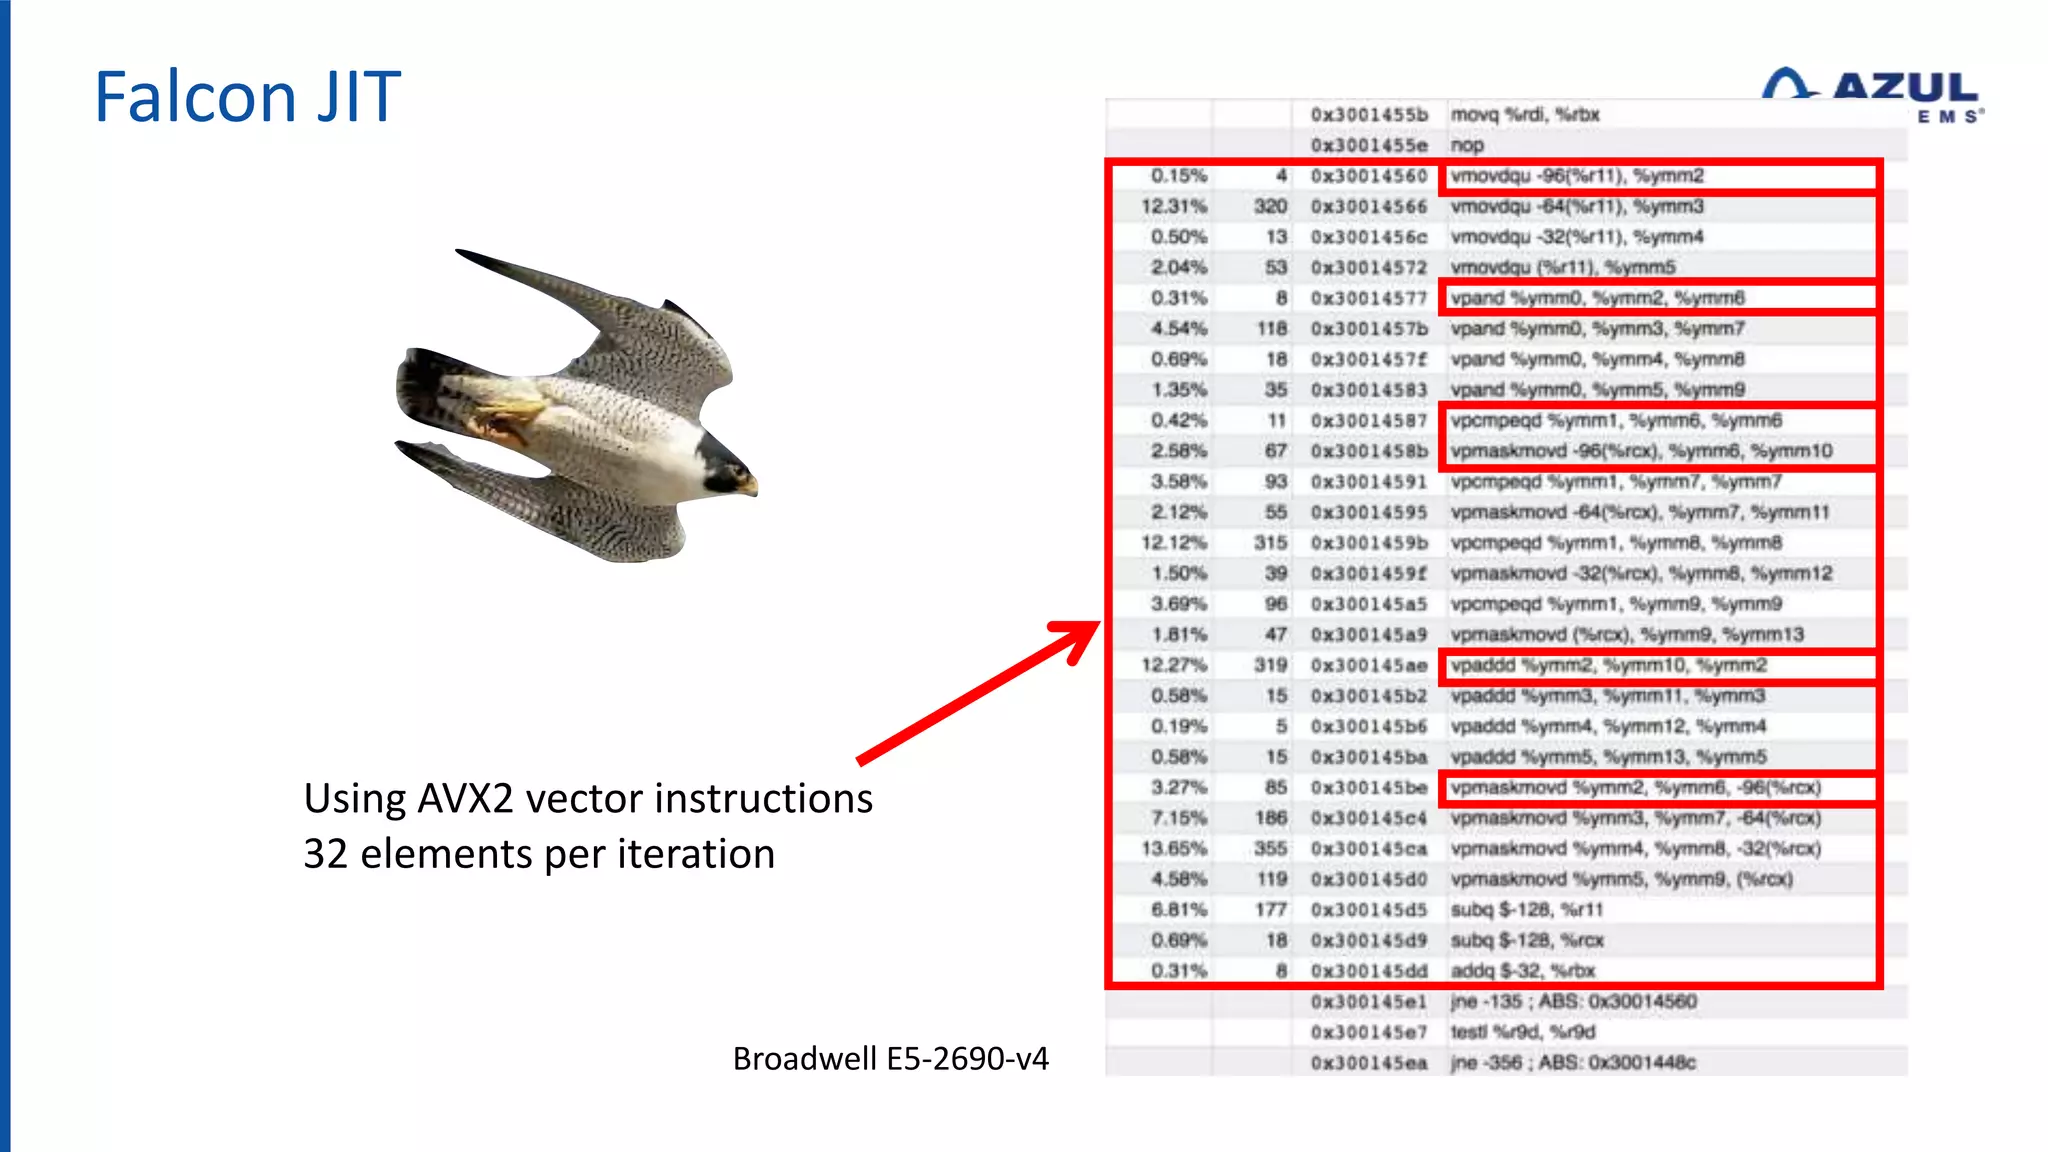
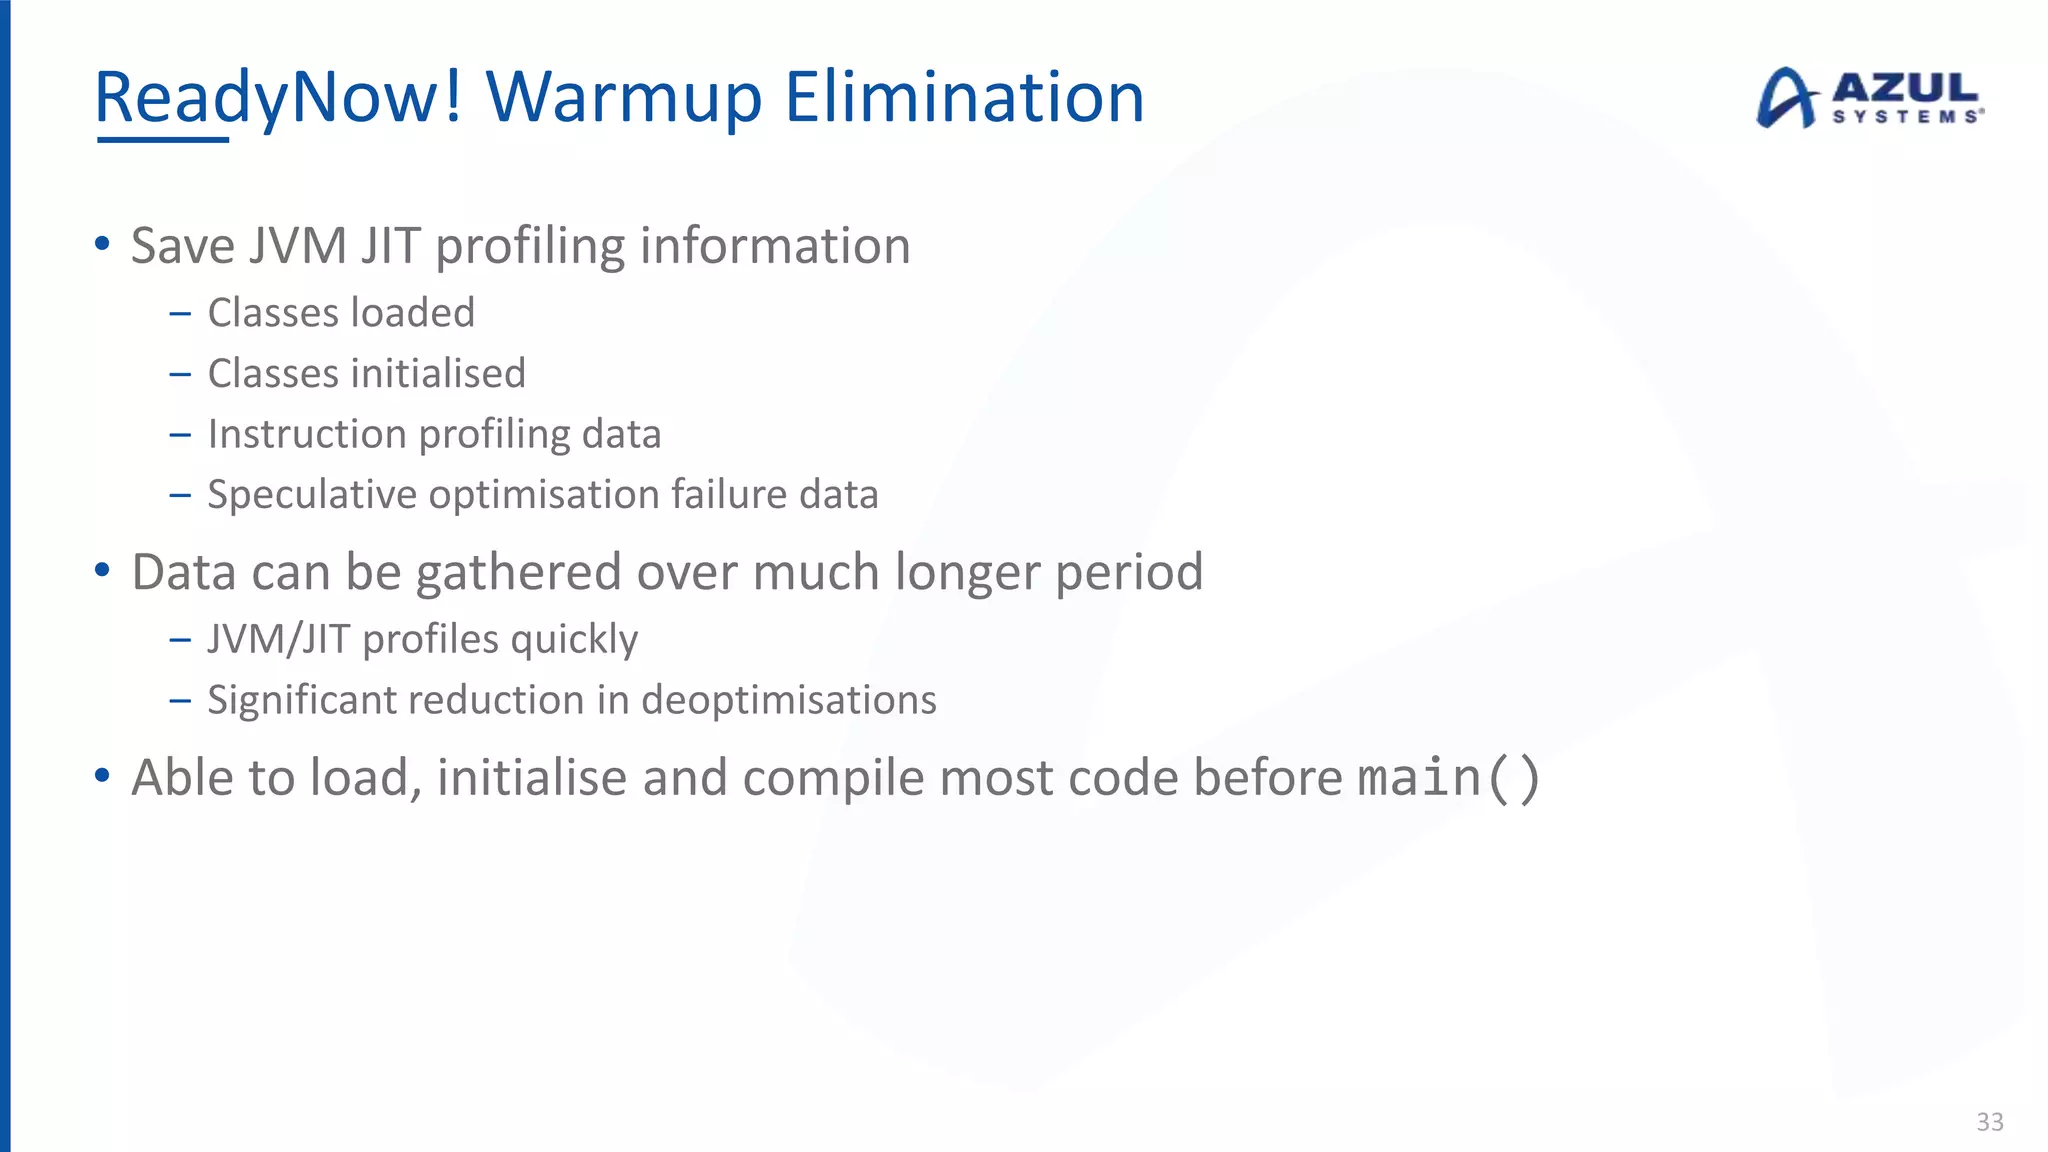
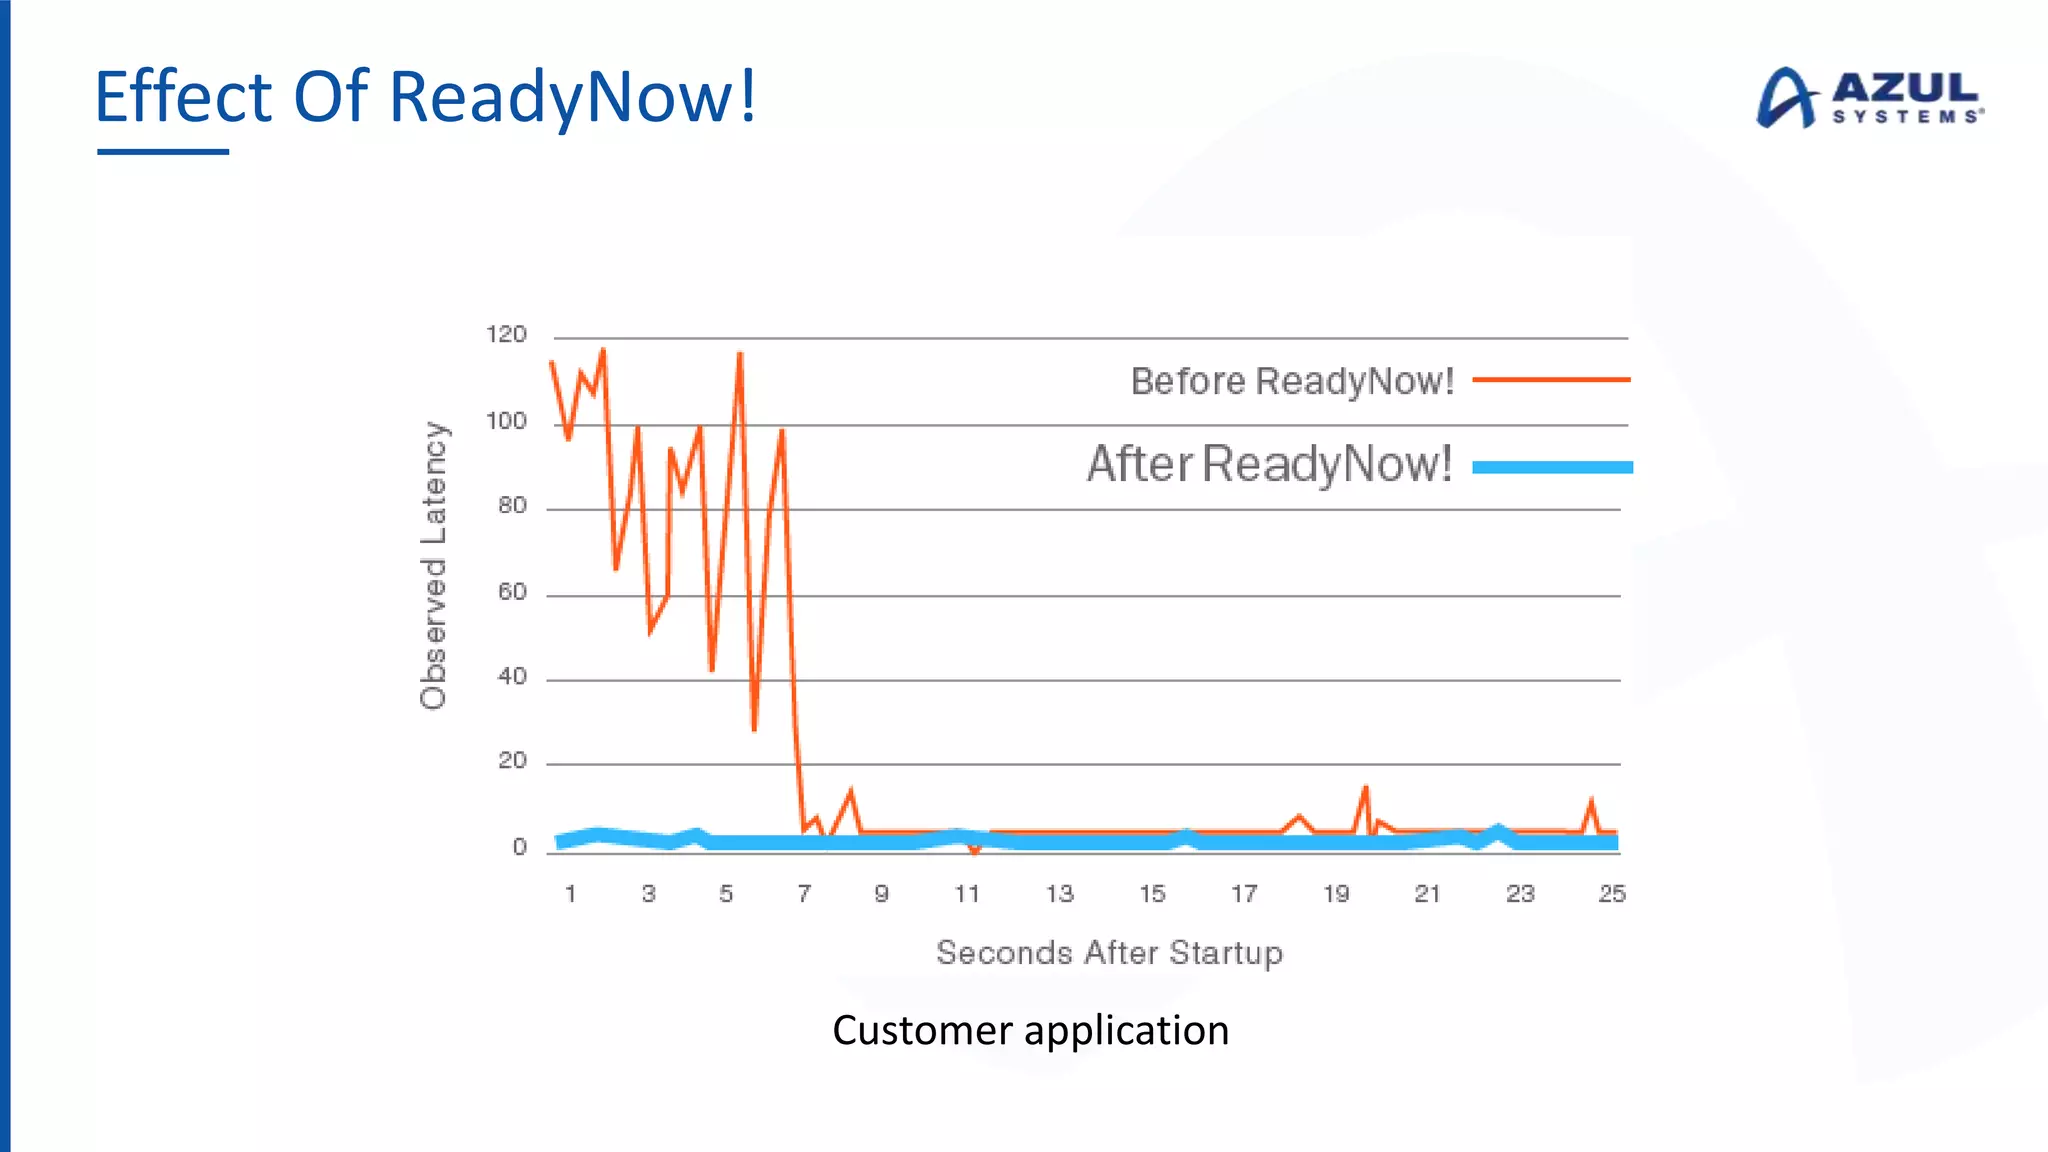


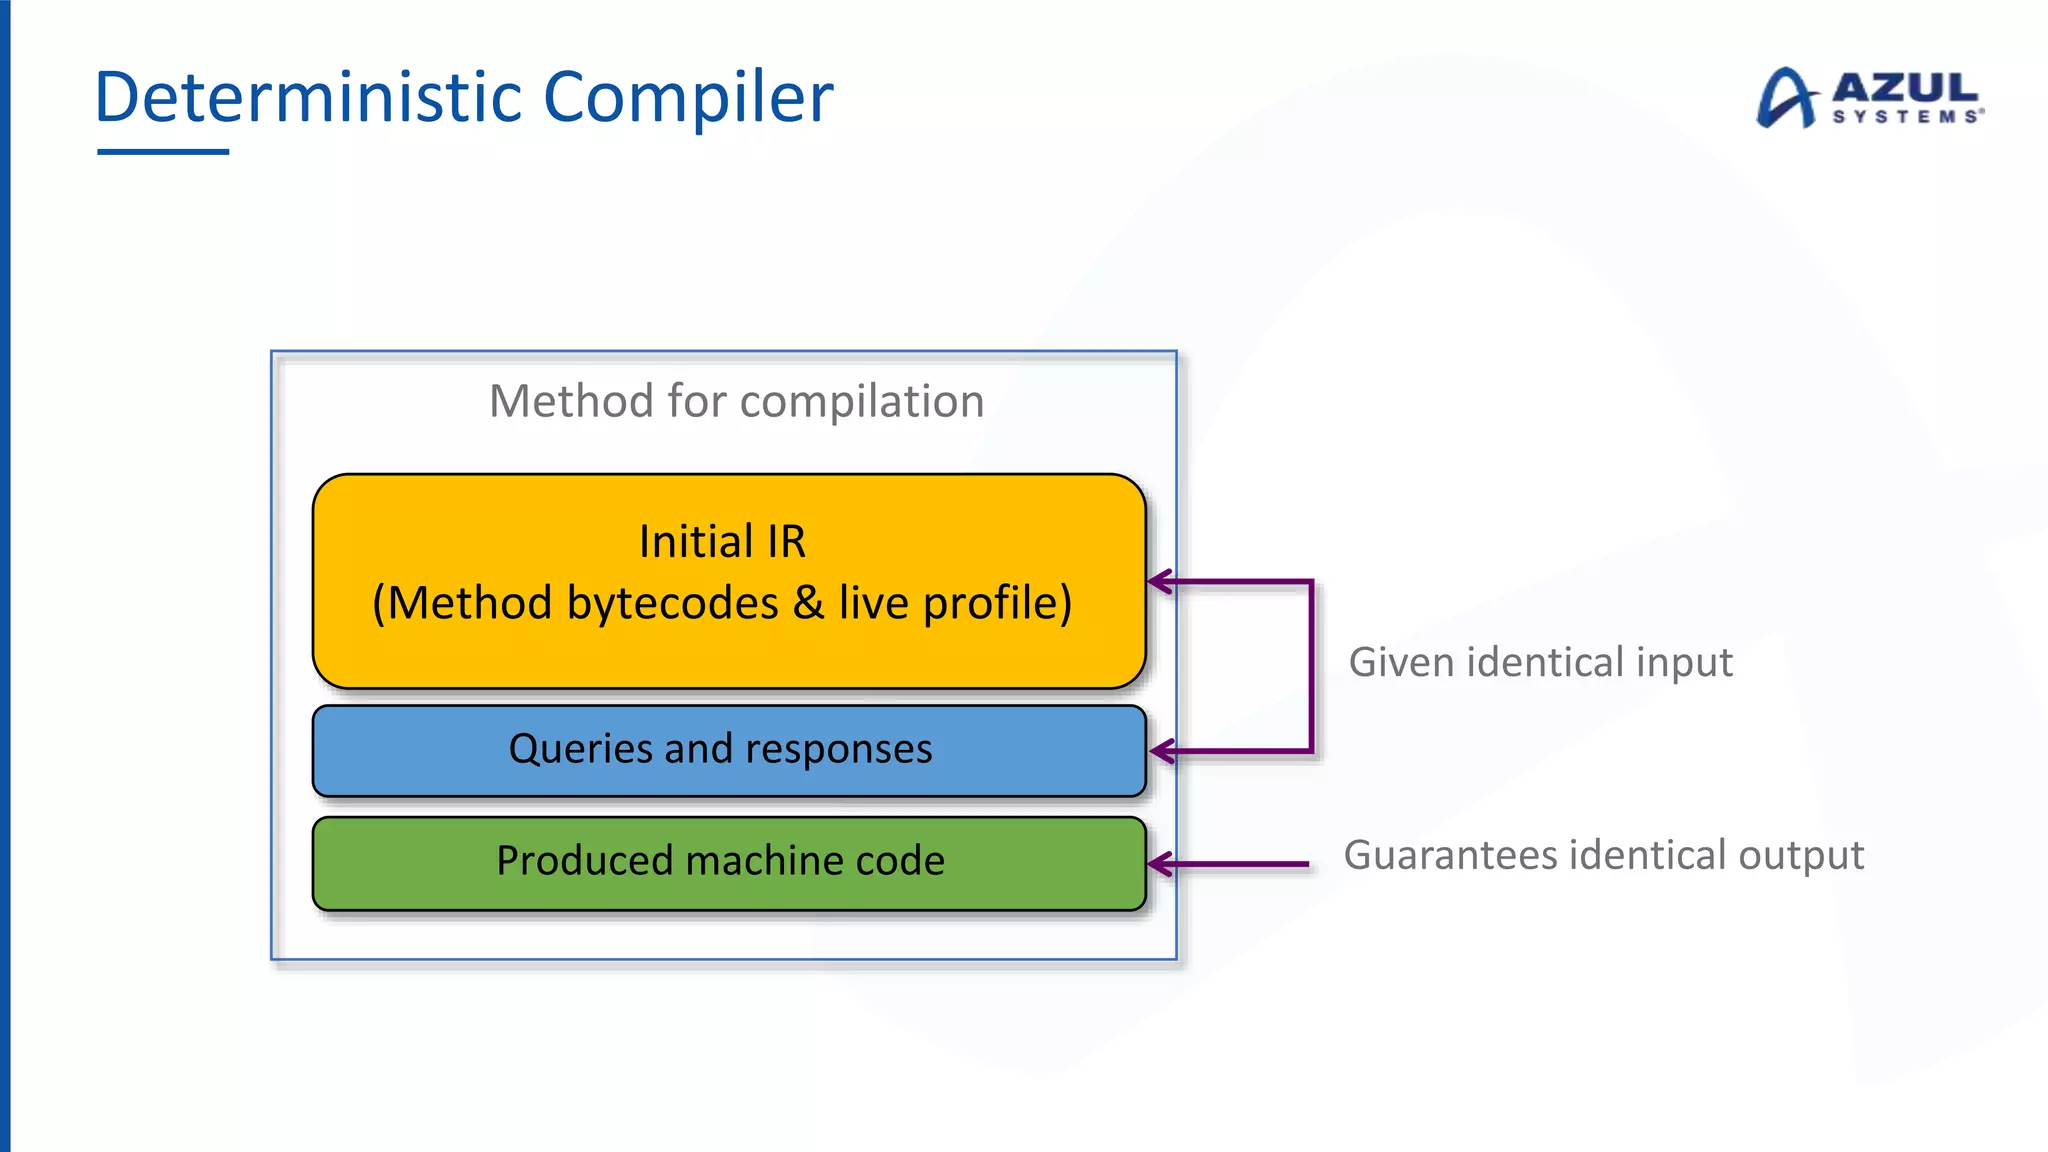


The document discusses the Azul Zing JVM, highlighting its performance advantages over traditional JVMs, such as reduced garbage collection pause times and improved memory management. It introduces the Falcon JIT compiler and 'Readynow!' technology, which enhance application startup speed and runtime performance. The Zing JVM serves as a drop-in replacement for other JVMs, requiring no code changes for users.


