Downloaded 13 times


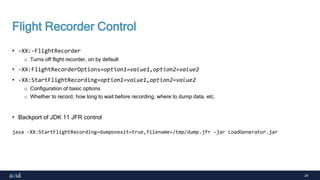


![38
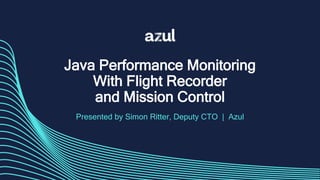
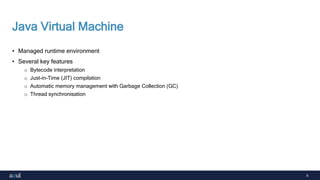
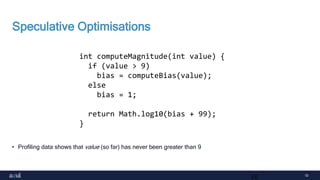
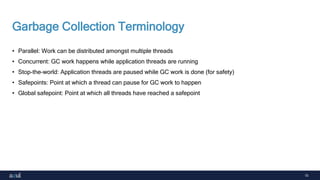
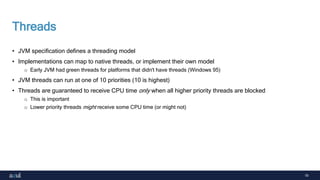
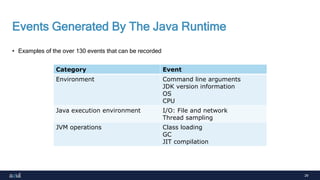
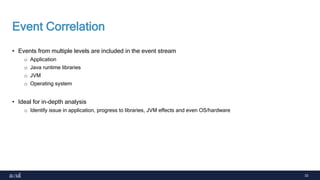
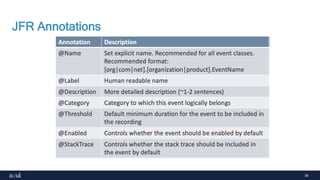
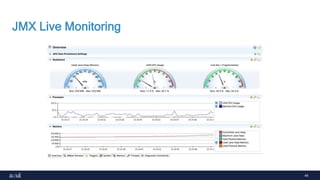
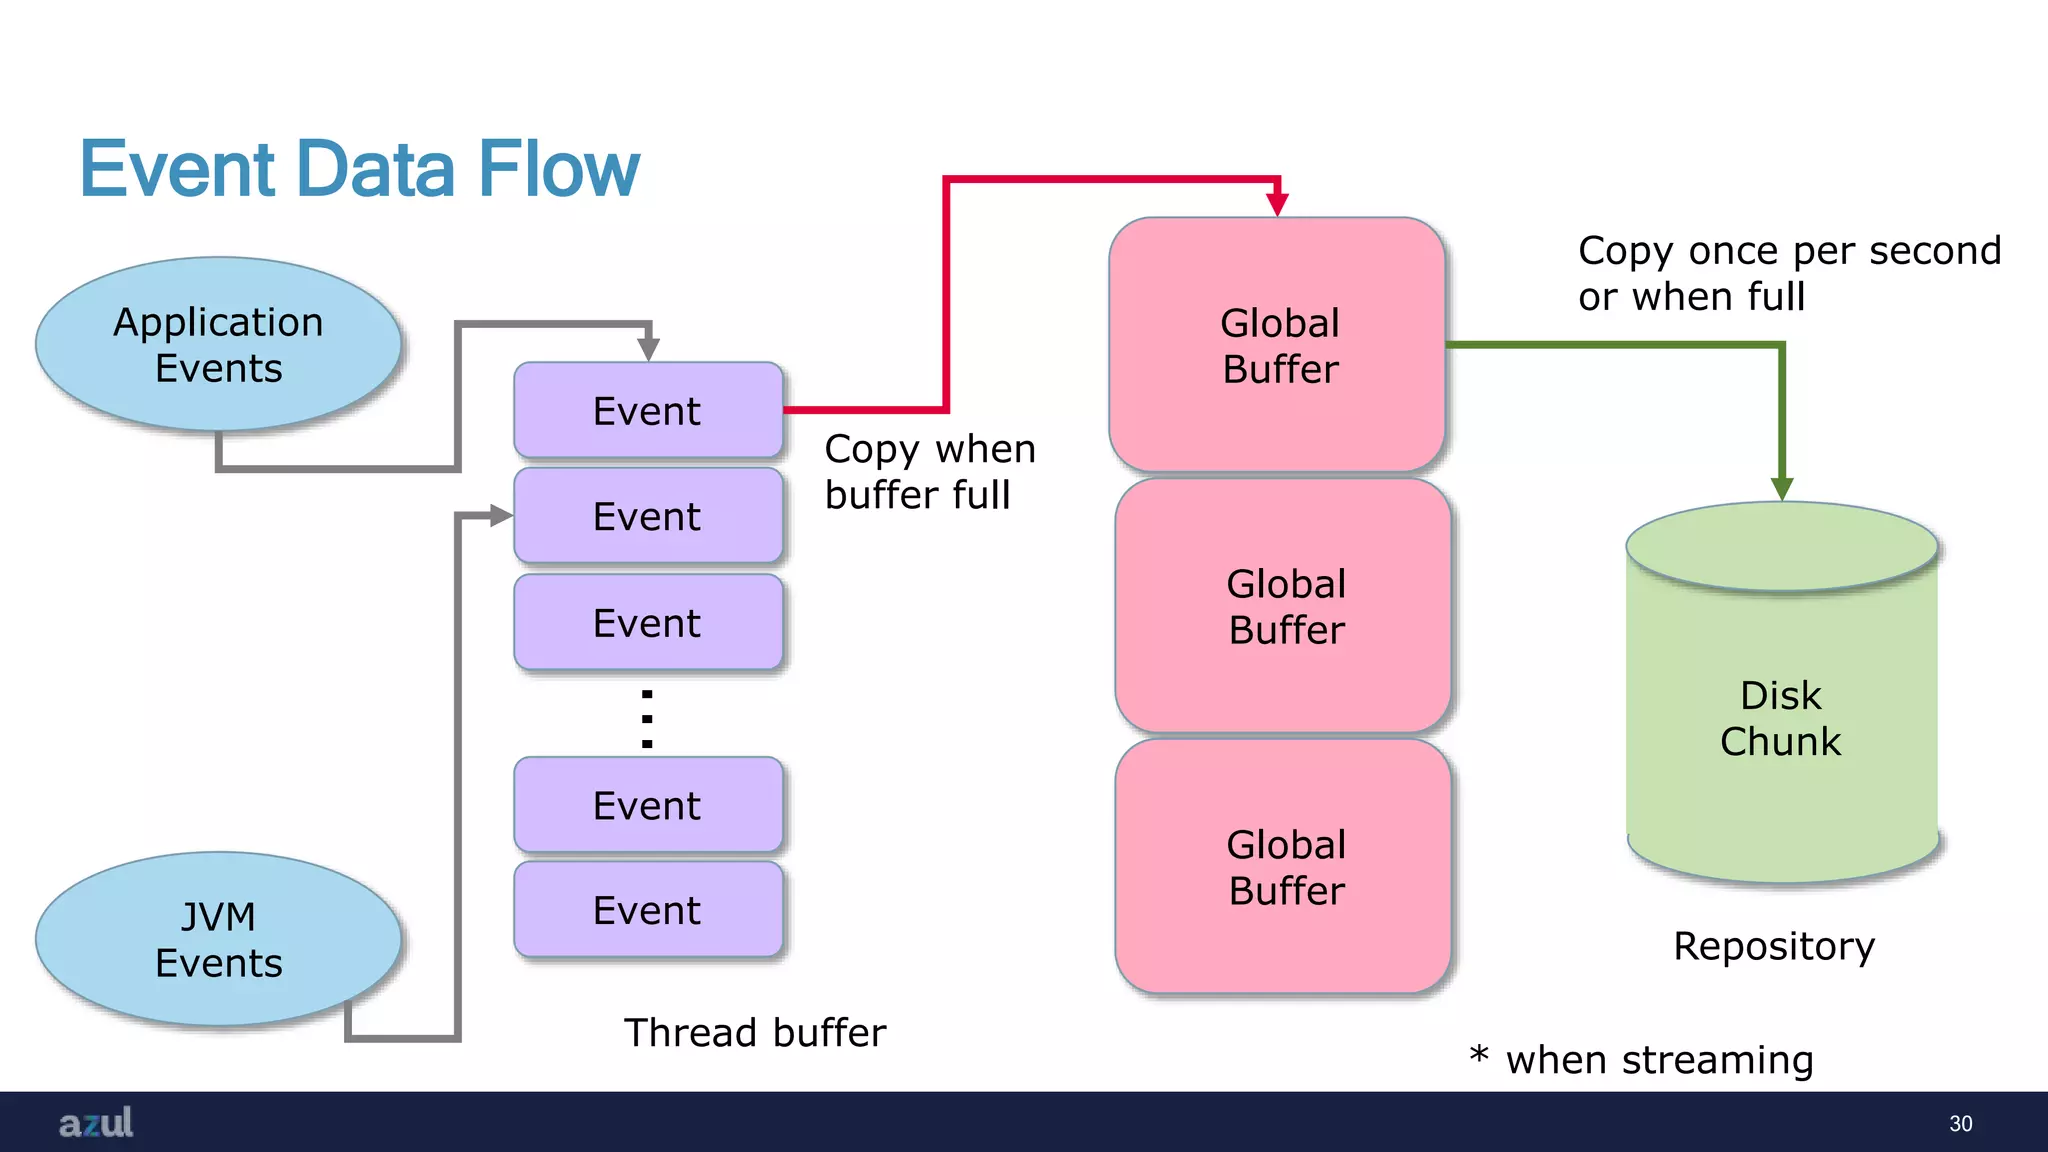
Looking At Events
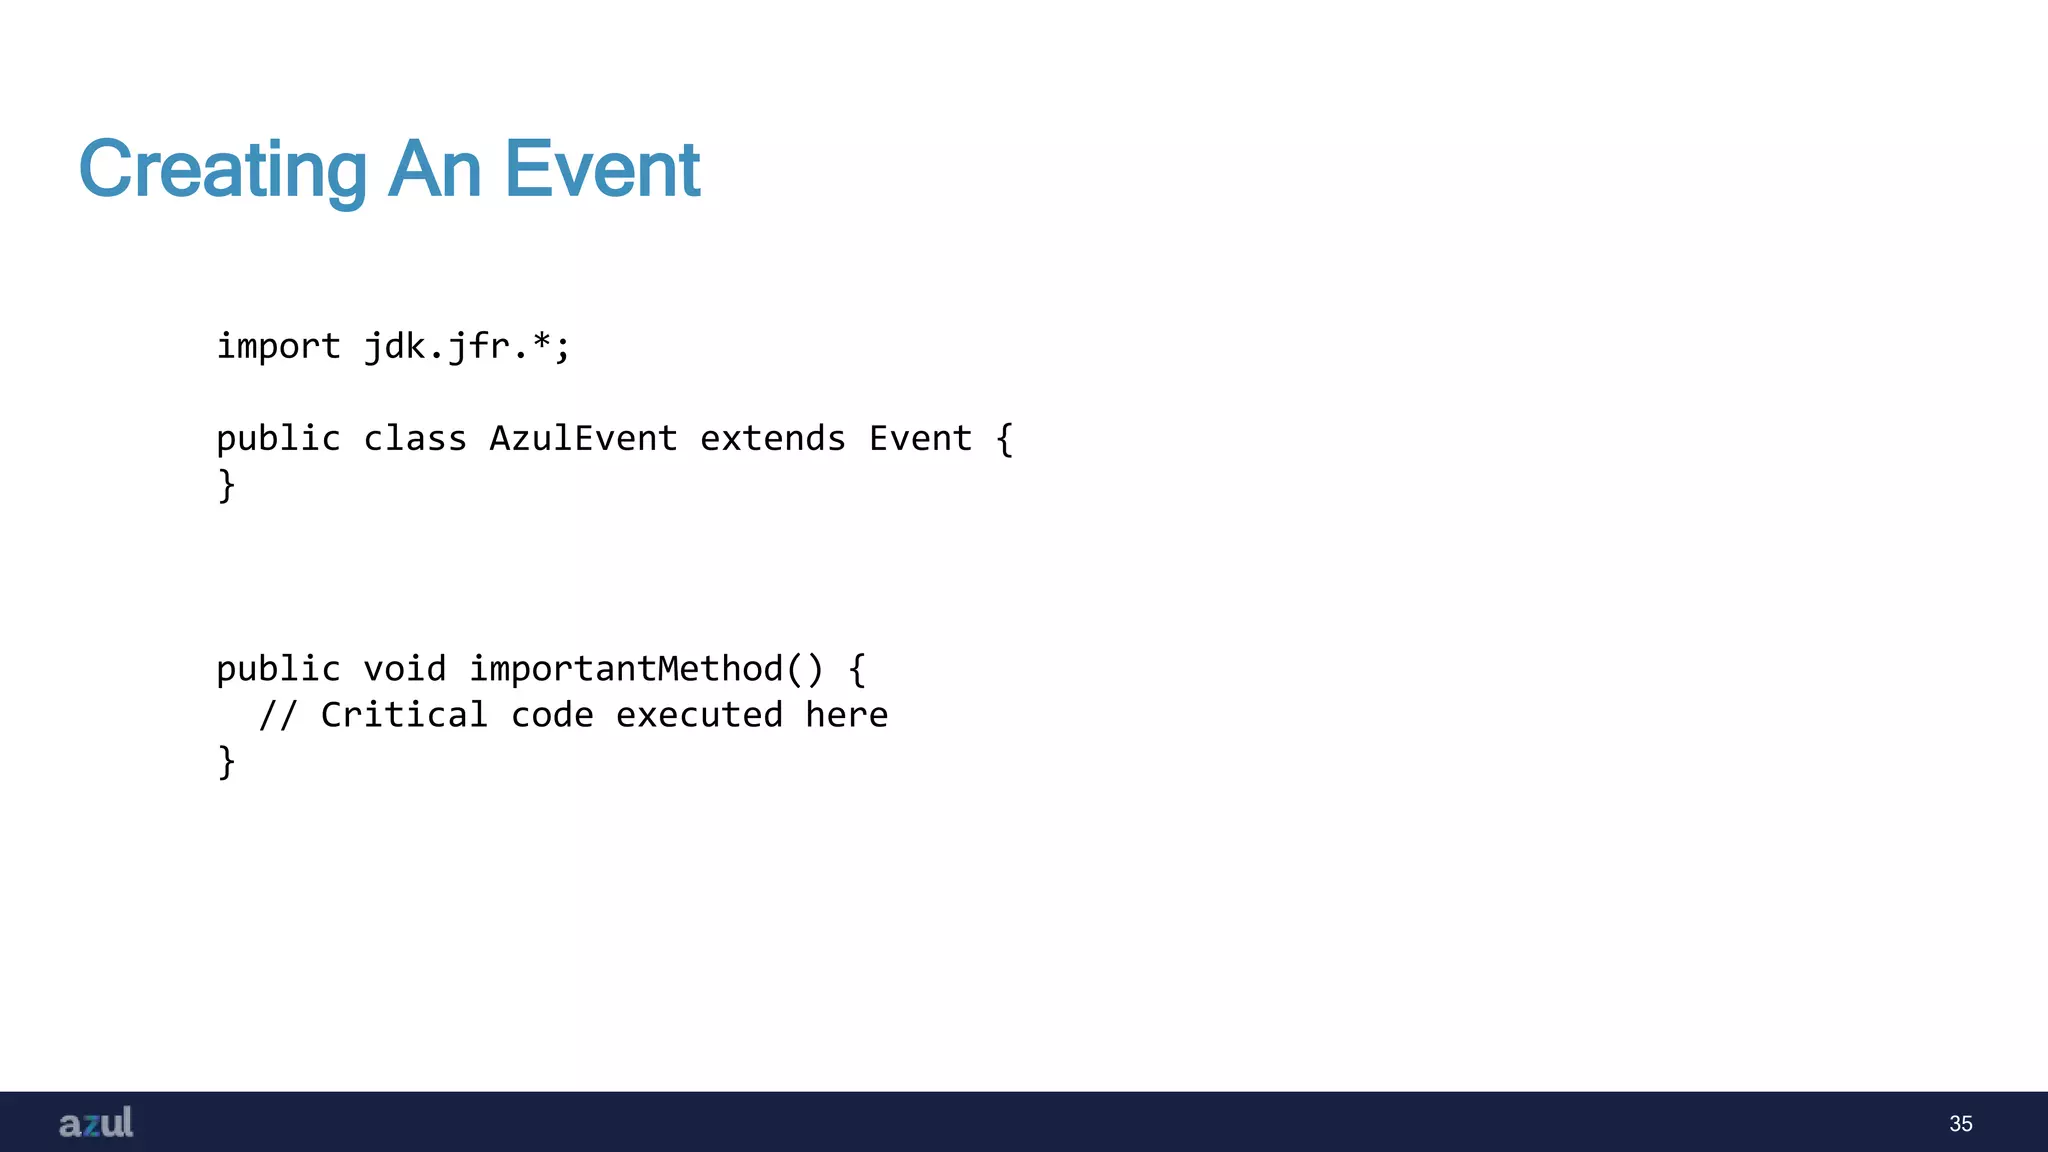
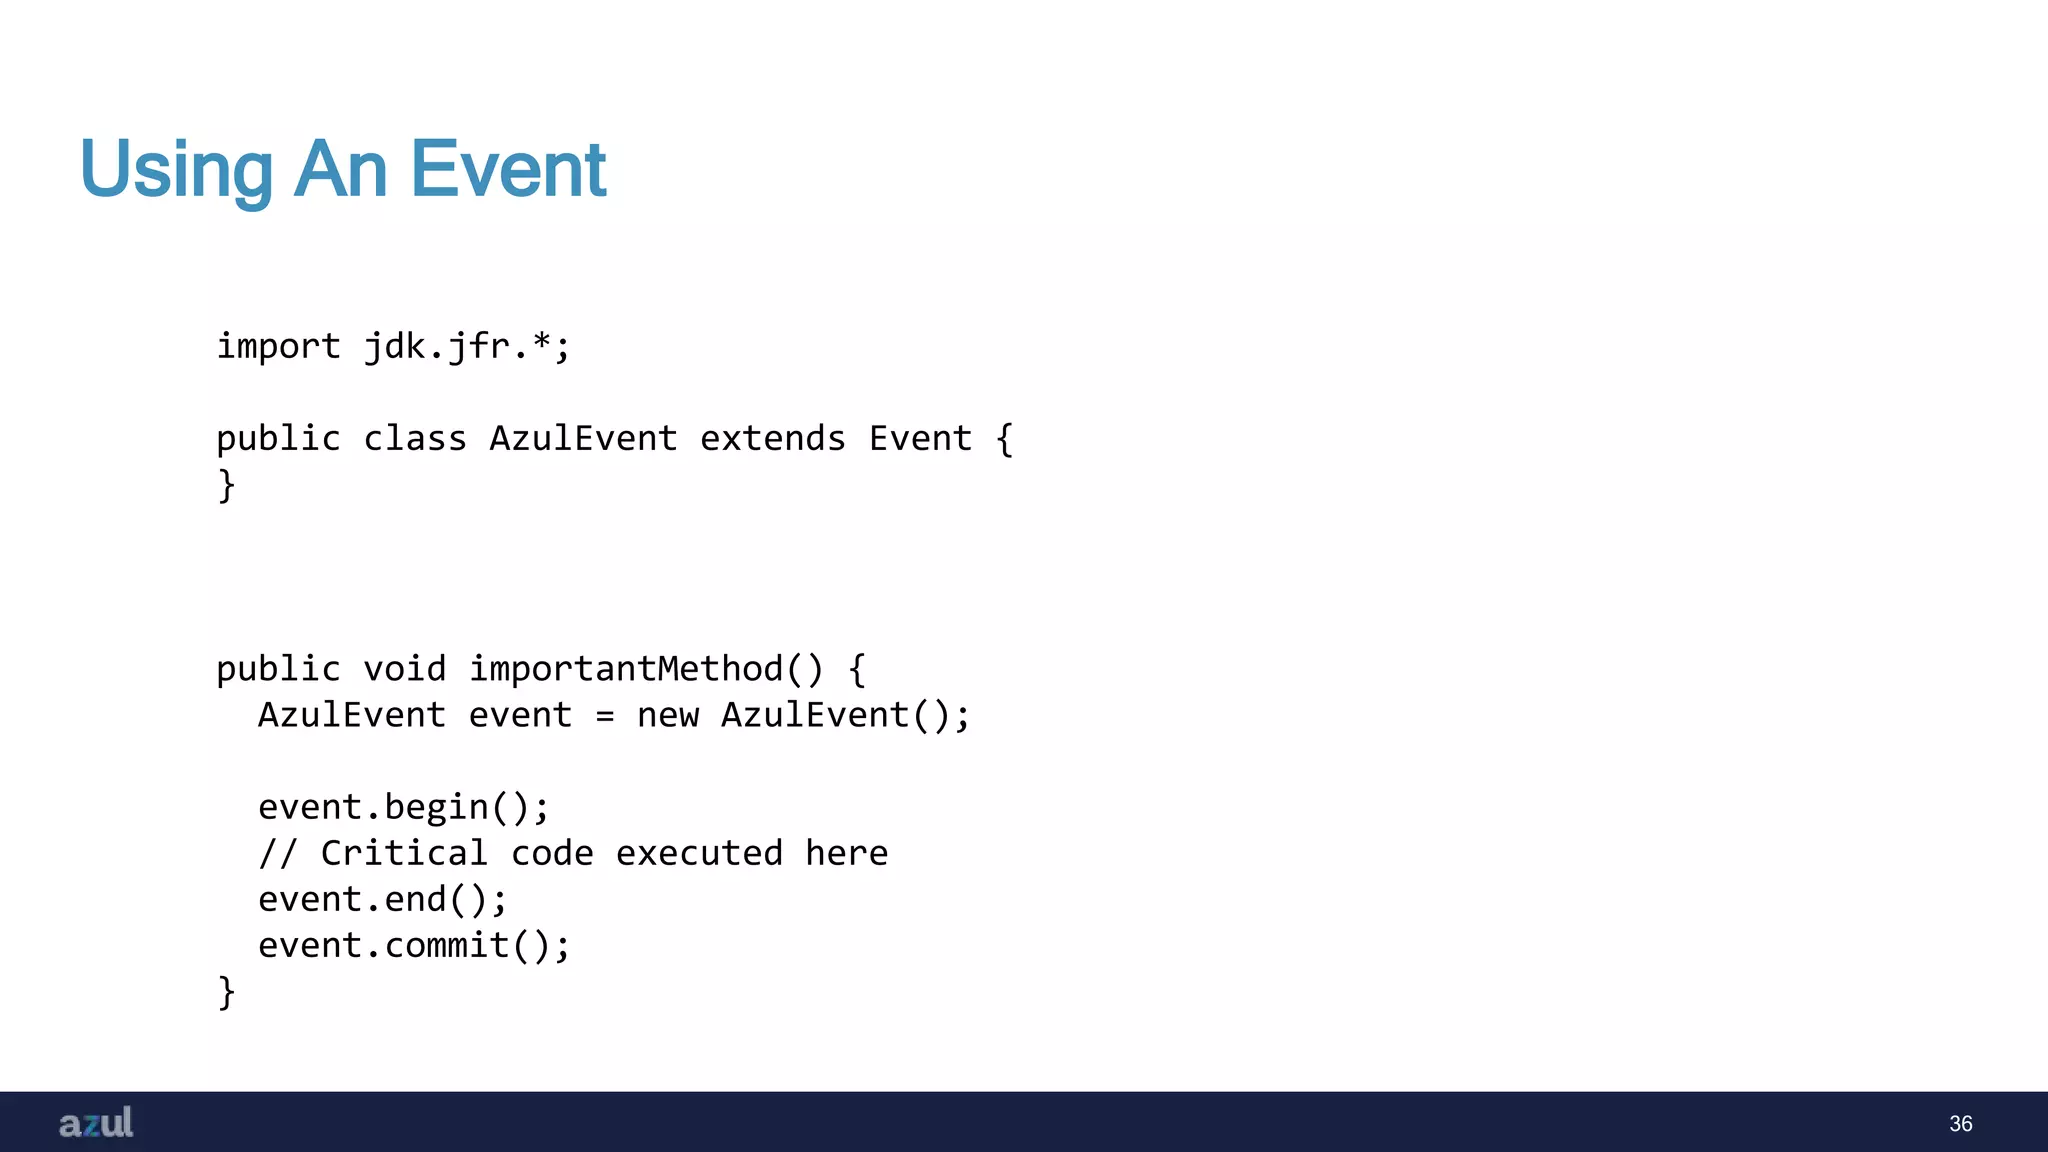
public void importantMethod() {
AzulEvent event = new AzulEvent("Critical code event", 99);
...
}
$ java ... -XX:StartFlightRecording:filename=azul.jfr ...
$ jfr print --events com.azul.azulevent azul.jfr
com.azul.azulevent {
startTime = 14:36:32.103
duration = 169.619 us
message = "Critical code event"
code = 99
eventThread = "main" (javaThreadId = 1)
stackTrace = [
eventtest.EventTest.main(String[]) line: 21
]
}](https://image.slidesharecdn.com/javaperformancemonitoring-210524160153/85/Java-performance-monitoring-38-320.jpg)


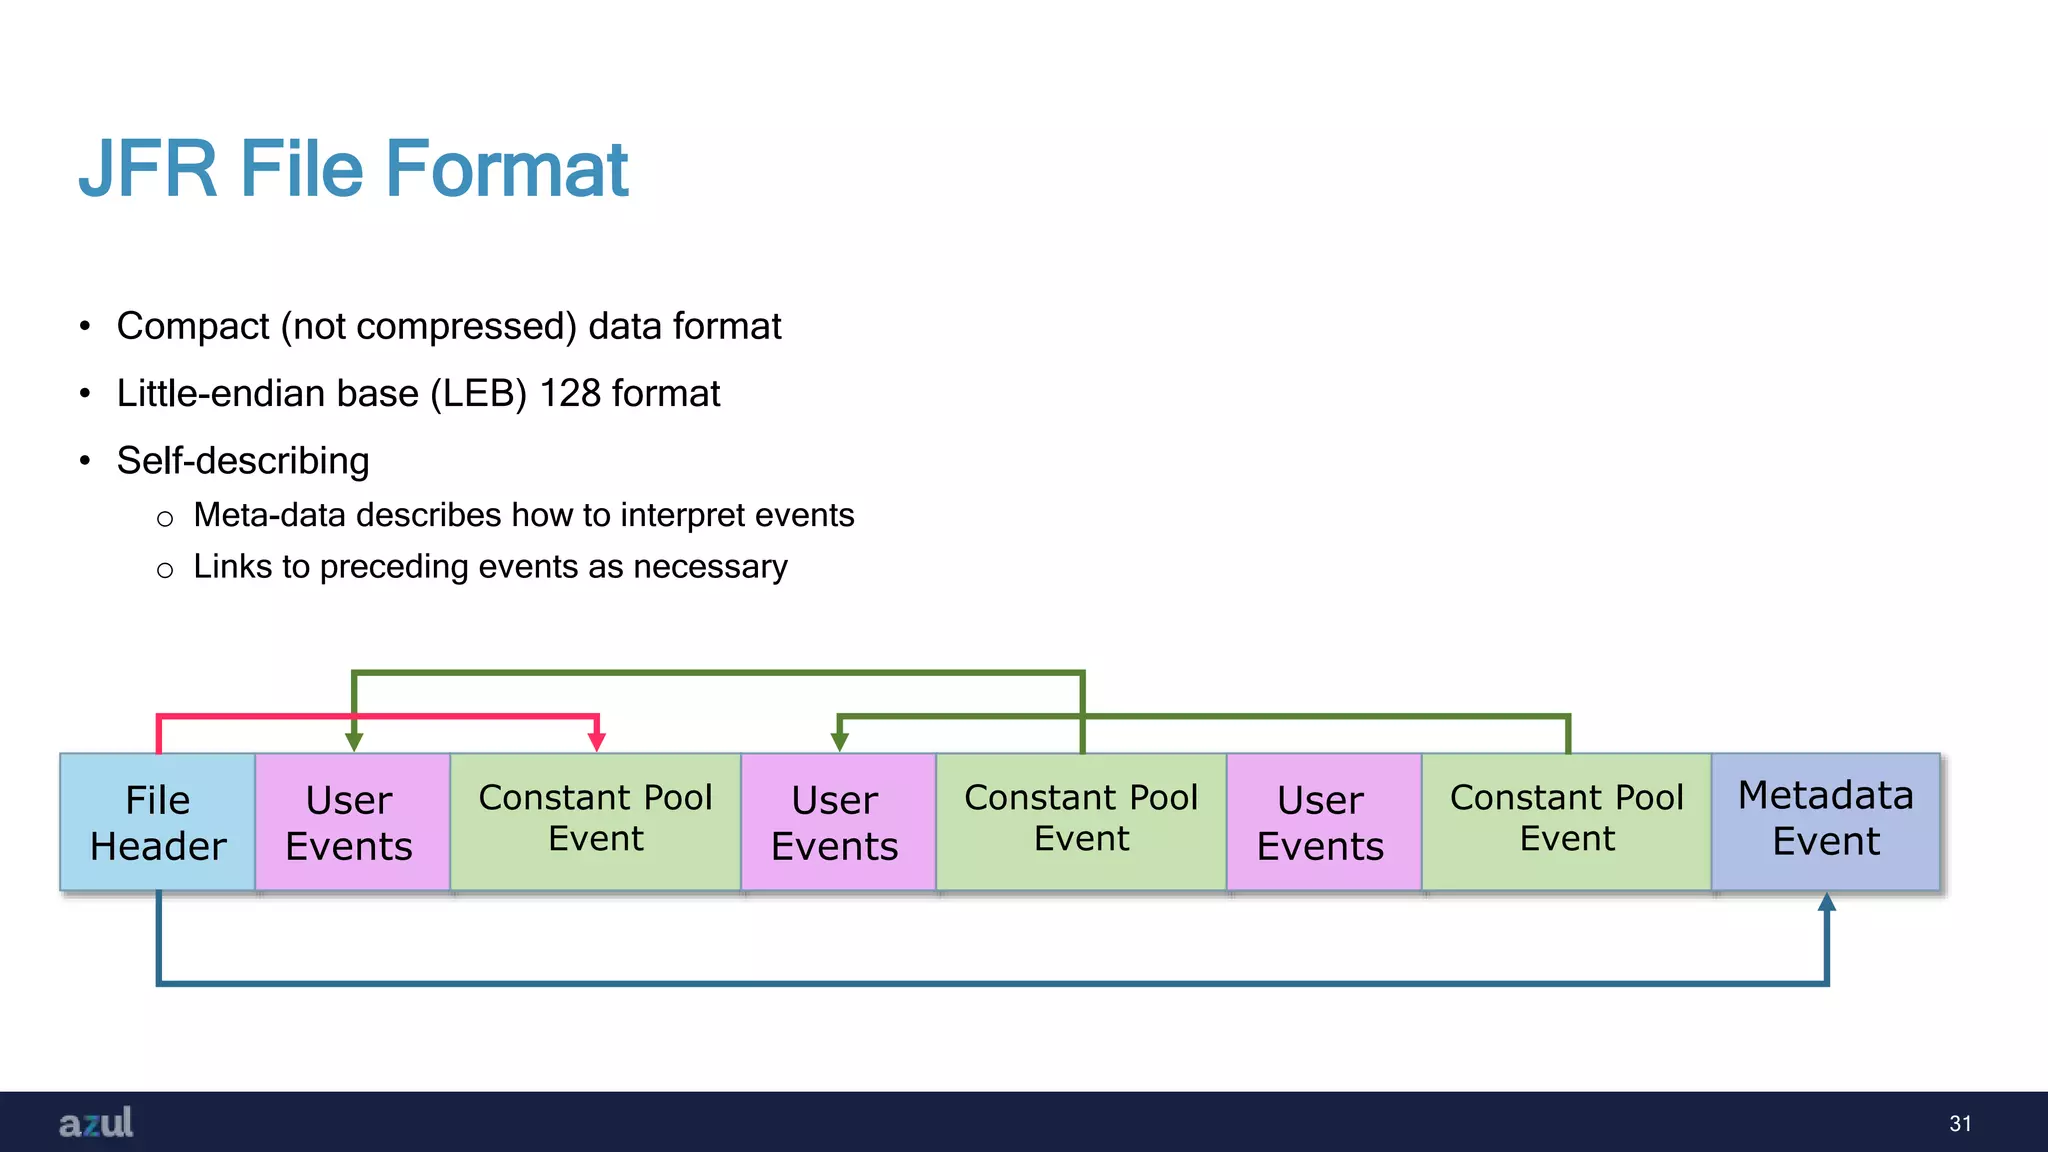


![38
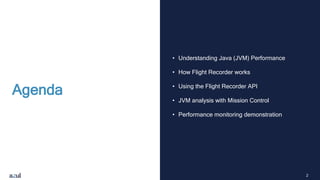
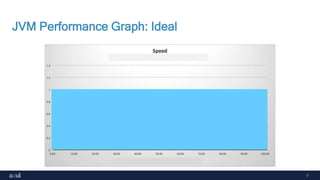
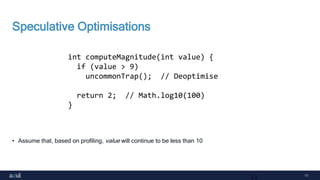
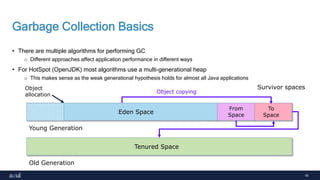
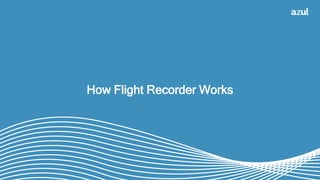
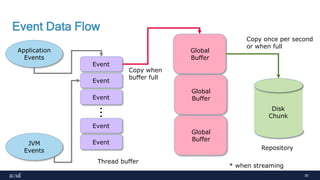
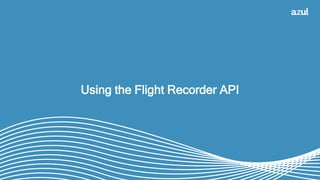
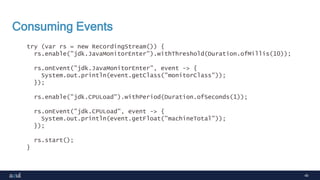
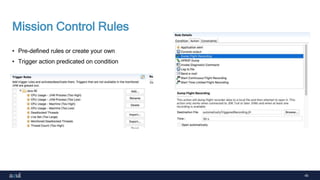
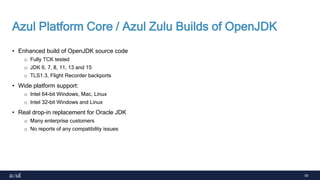
Looking At Events
public void importantMethod() {
AzulEvent event = new AzulEvent("Critical code event", 99);
...
}
$ java ... -XX:StartFlightRecording:filename=azul.jfr ...
$ jfr print --events com.azul.azulevent azul.jfr
com.azul.azulevent {
startTime = 14:36:32.103
duration = 169.619 us
message = "Critical code event"
code = 99
eventThread = "main" (javaThreadId = 1)
stackTrace = [
eventtest.EventTest.main(String[]) line: 21
]
}](https://image.slidesharecdn.com/javaperformancemonitoring-210524160153/75/Java-performance-monitoring-38-2048.jpg)
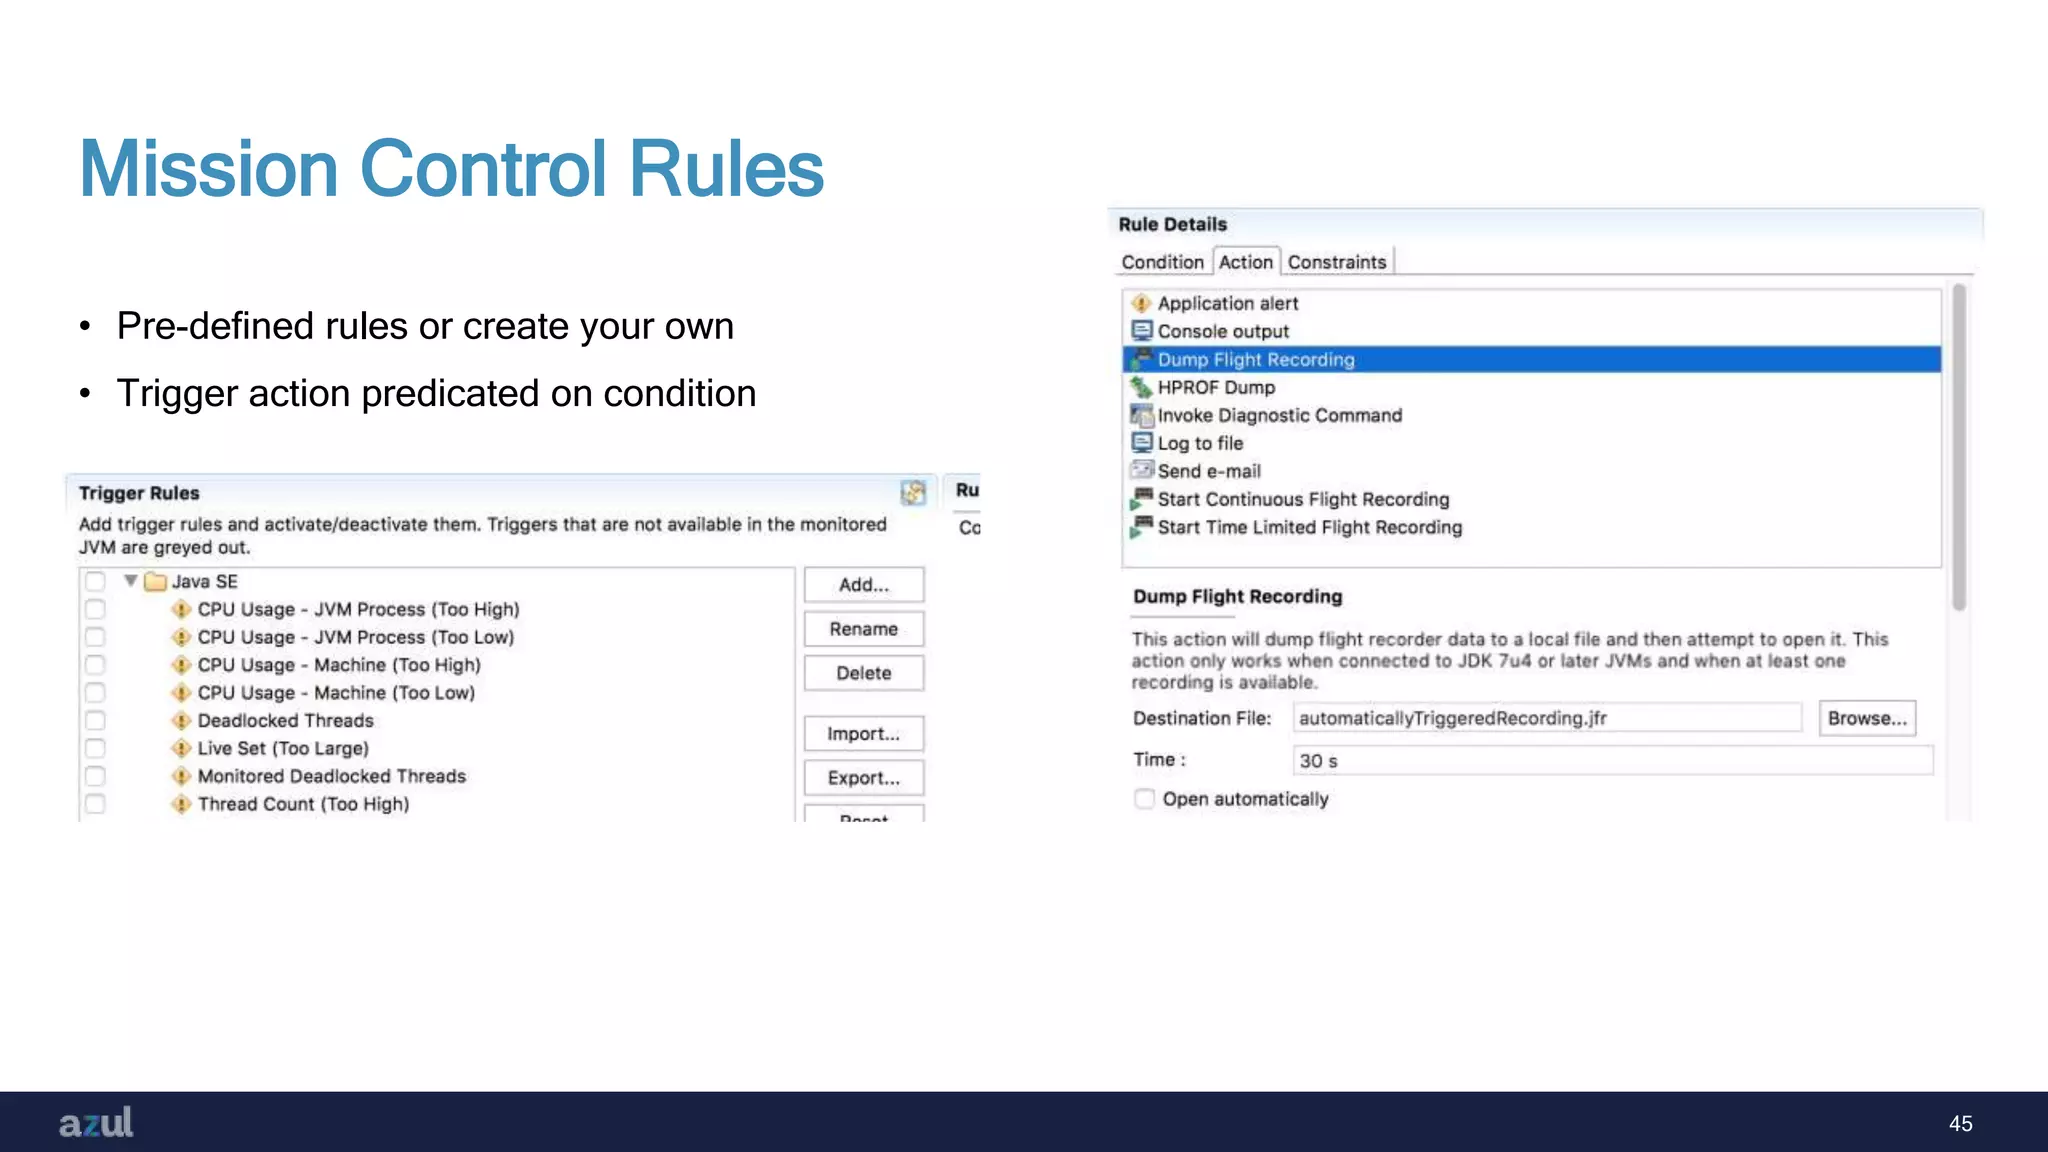
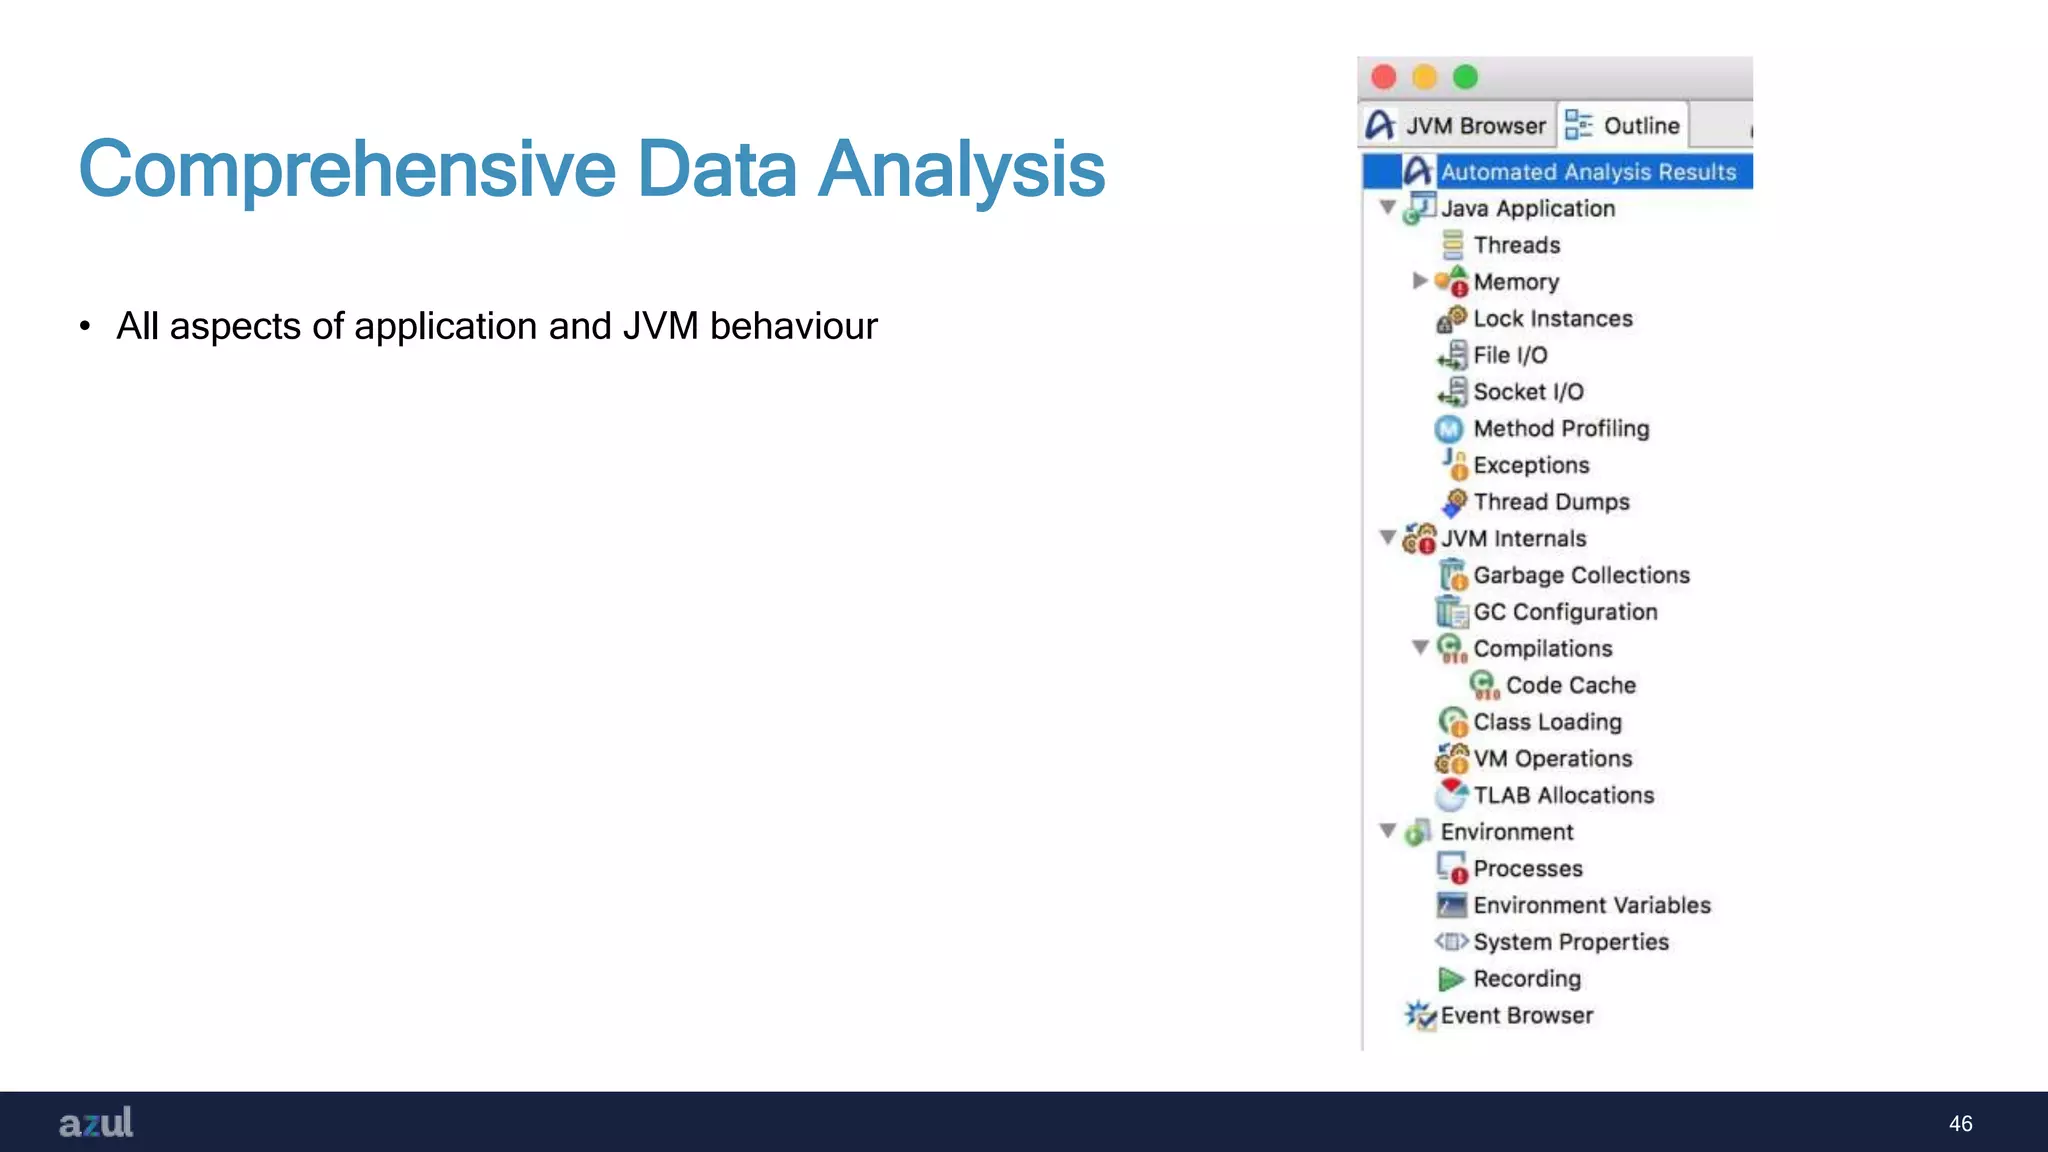

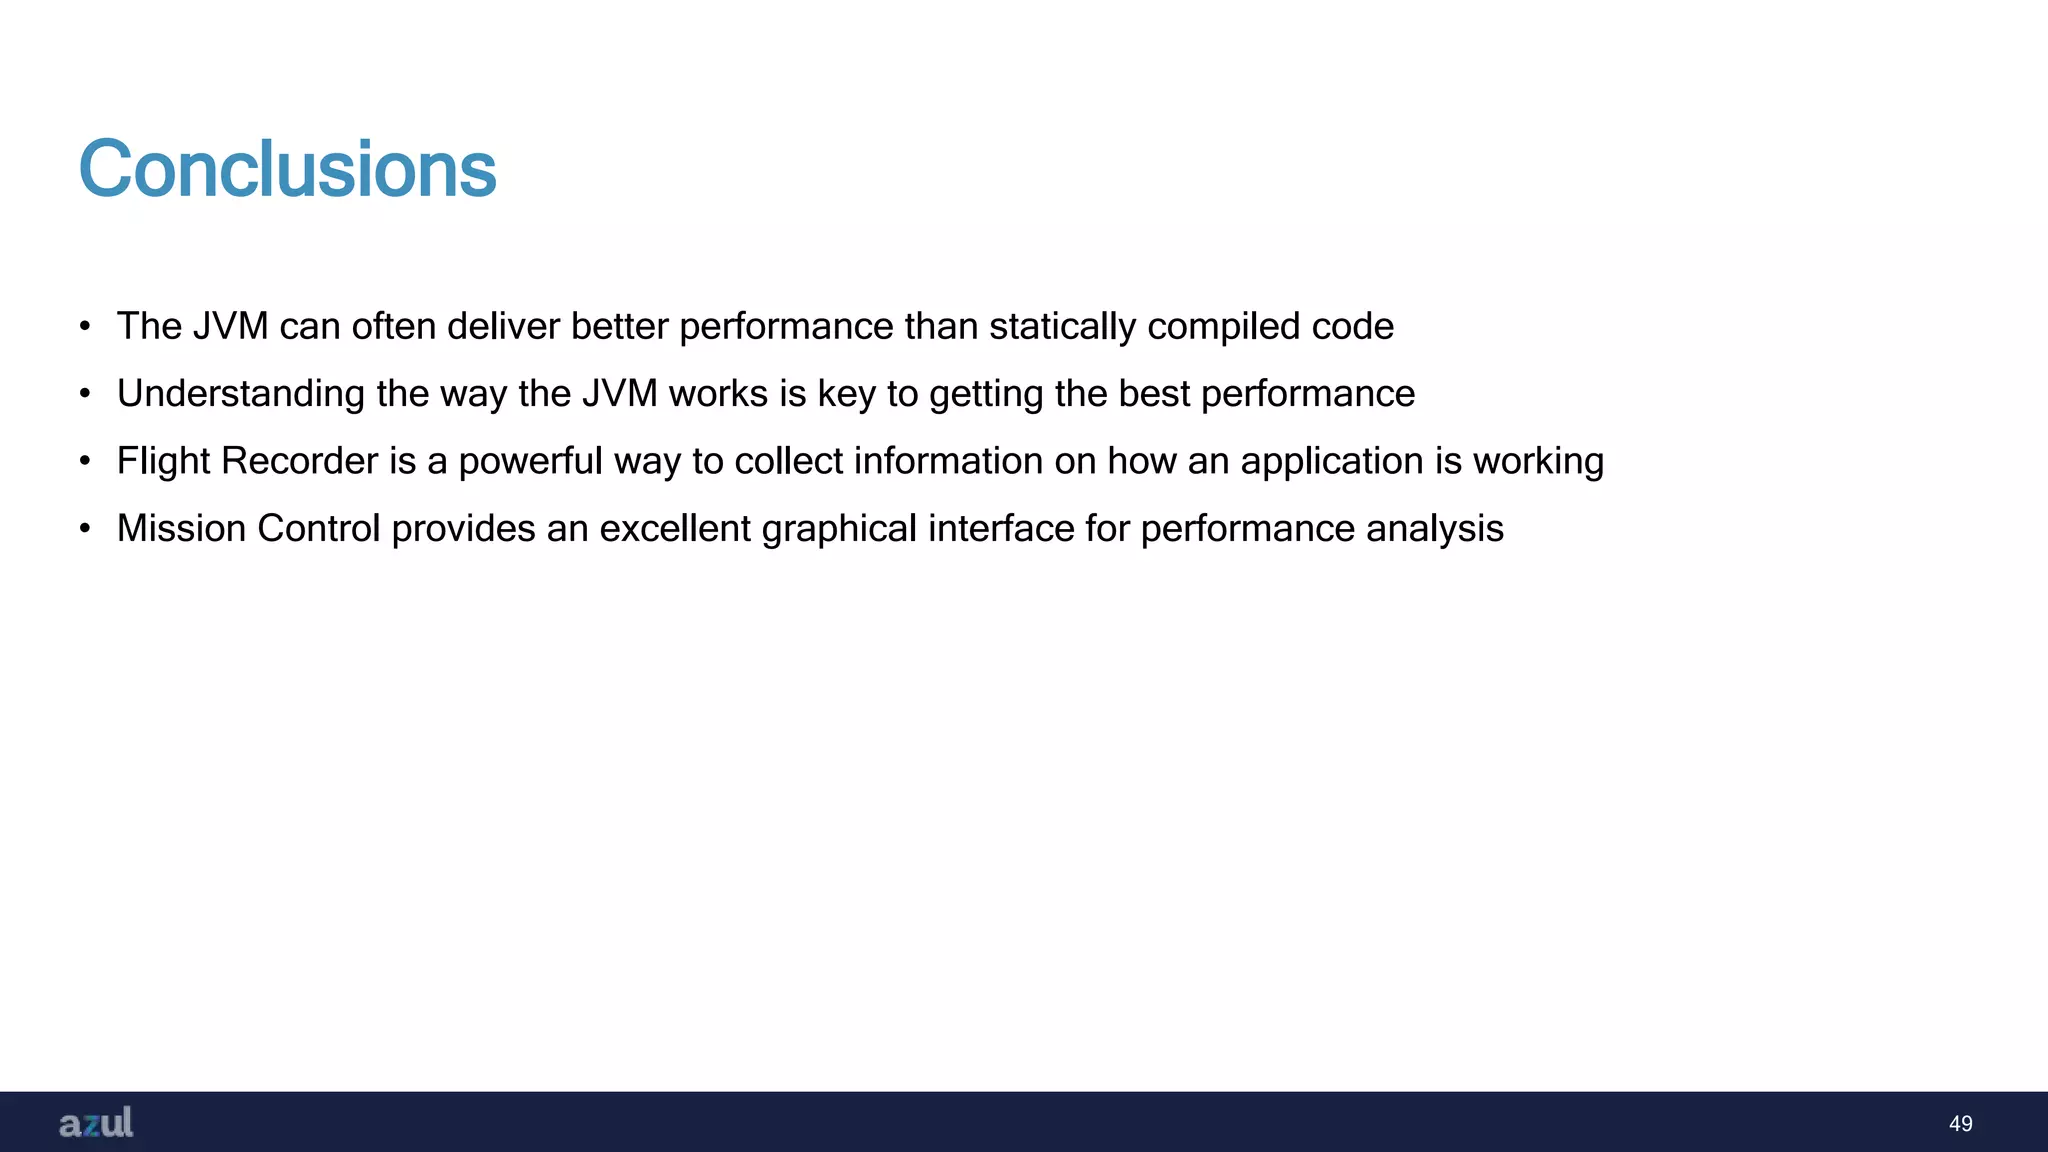


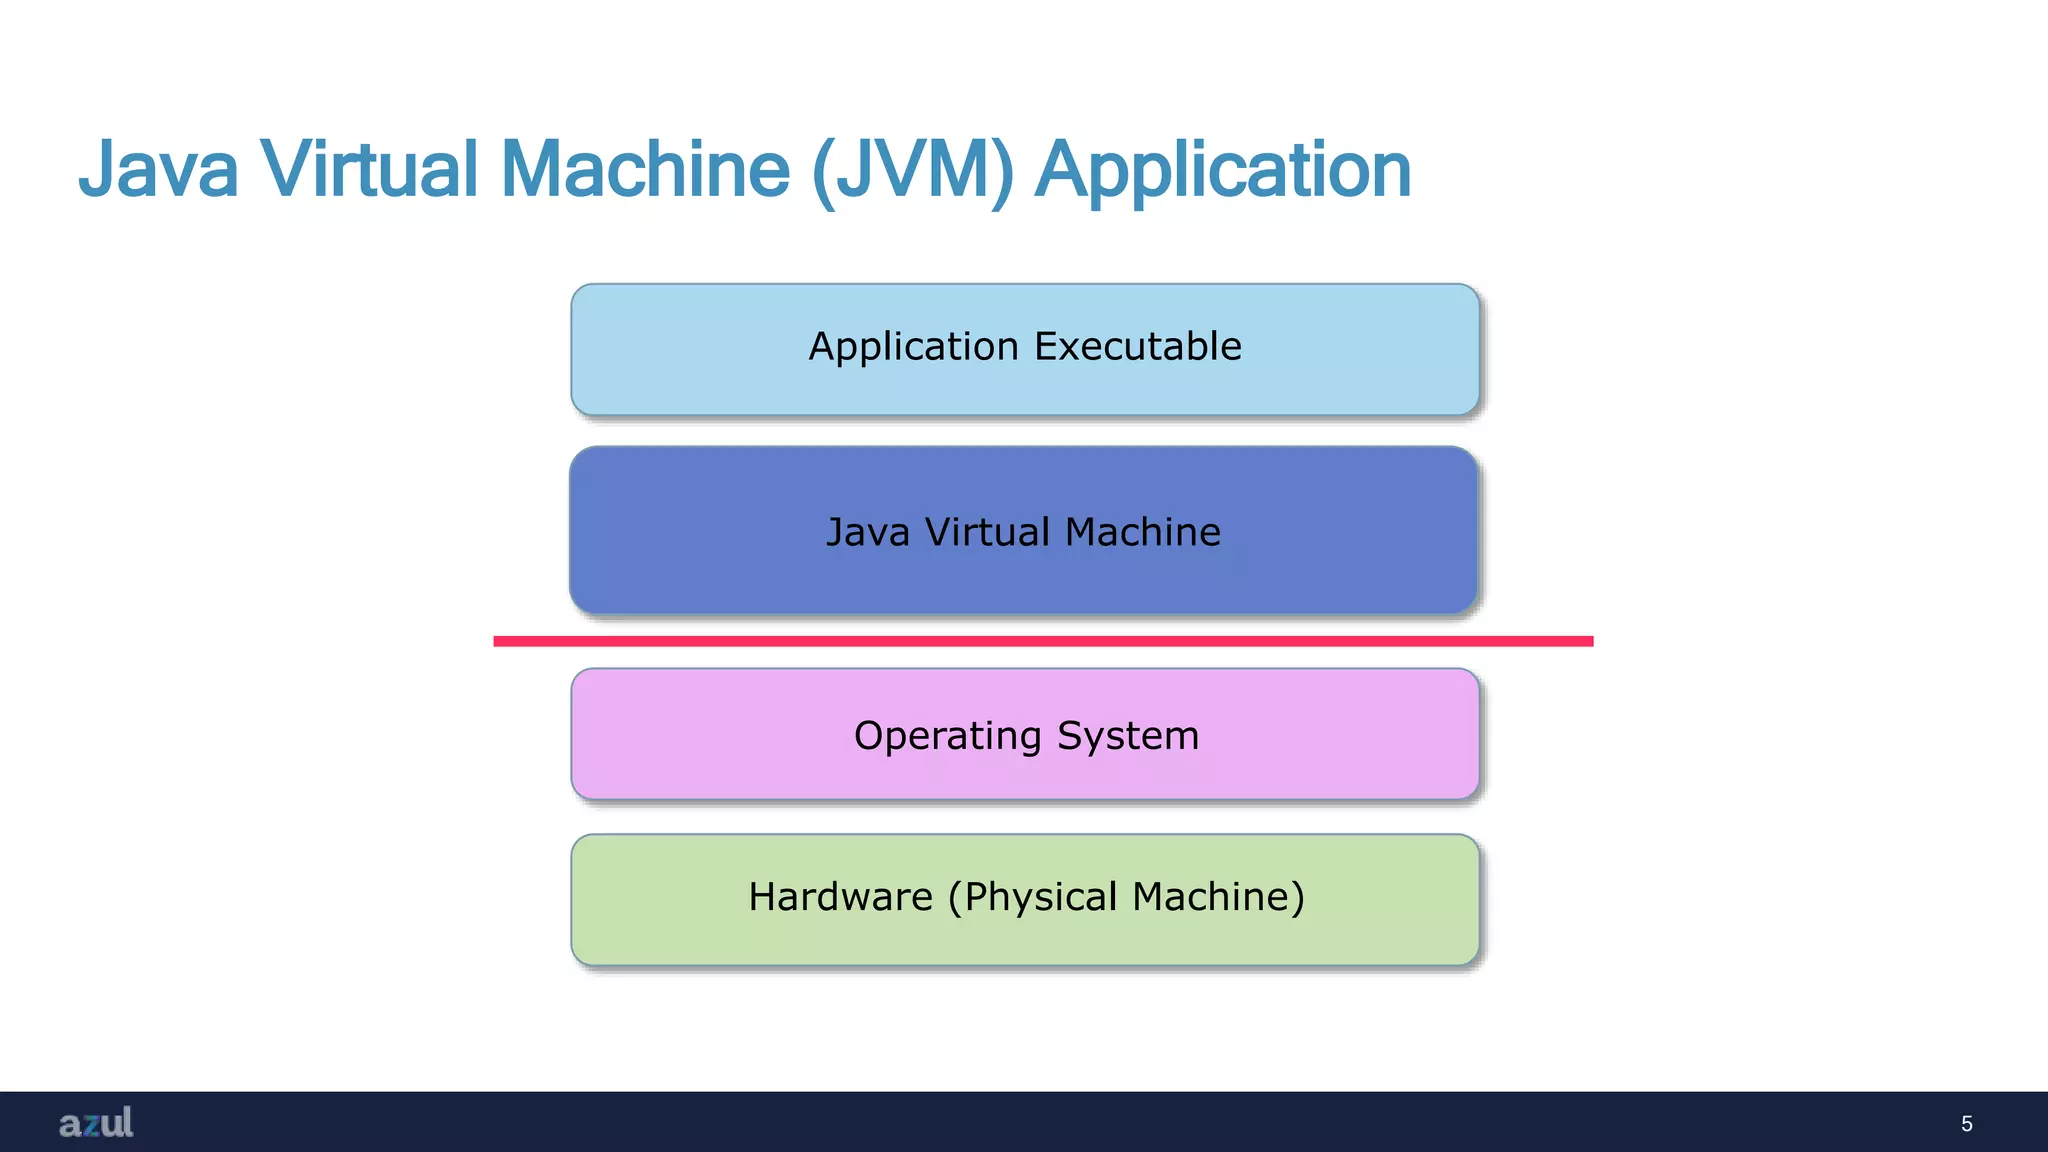
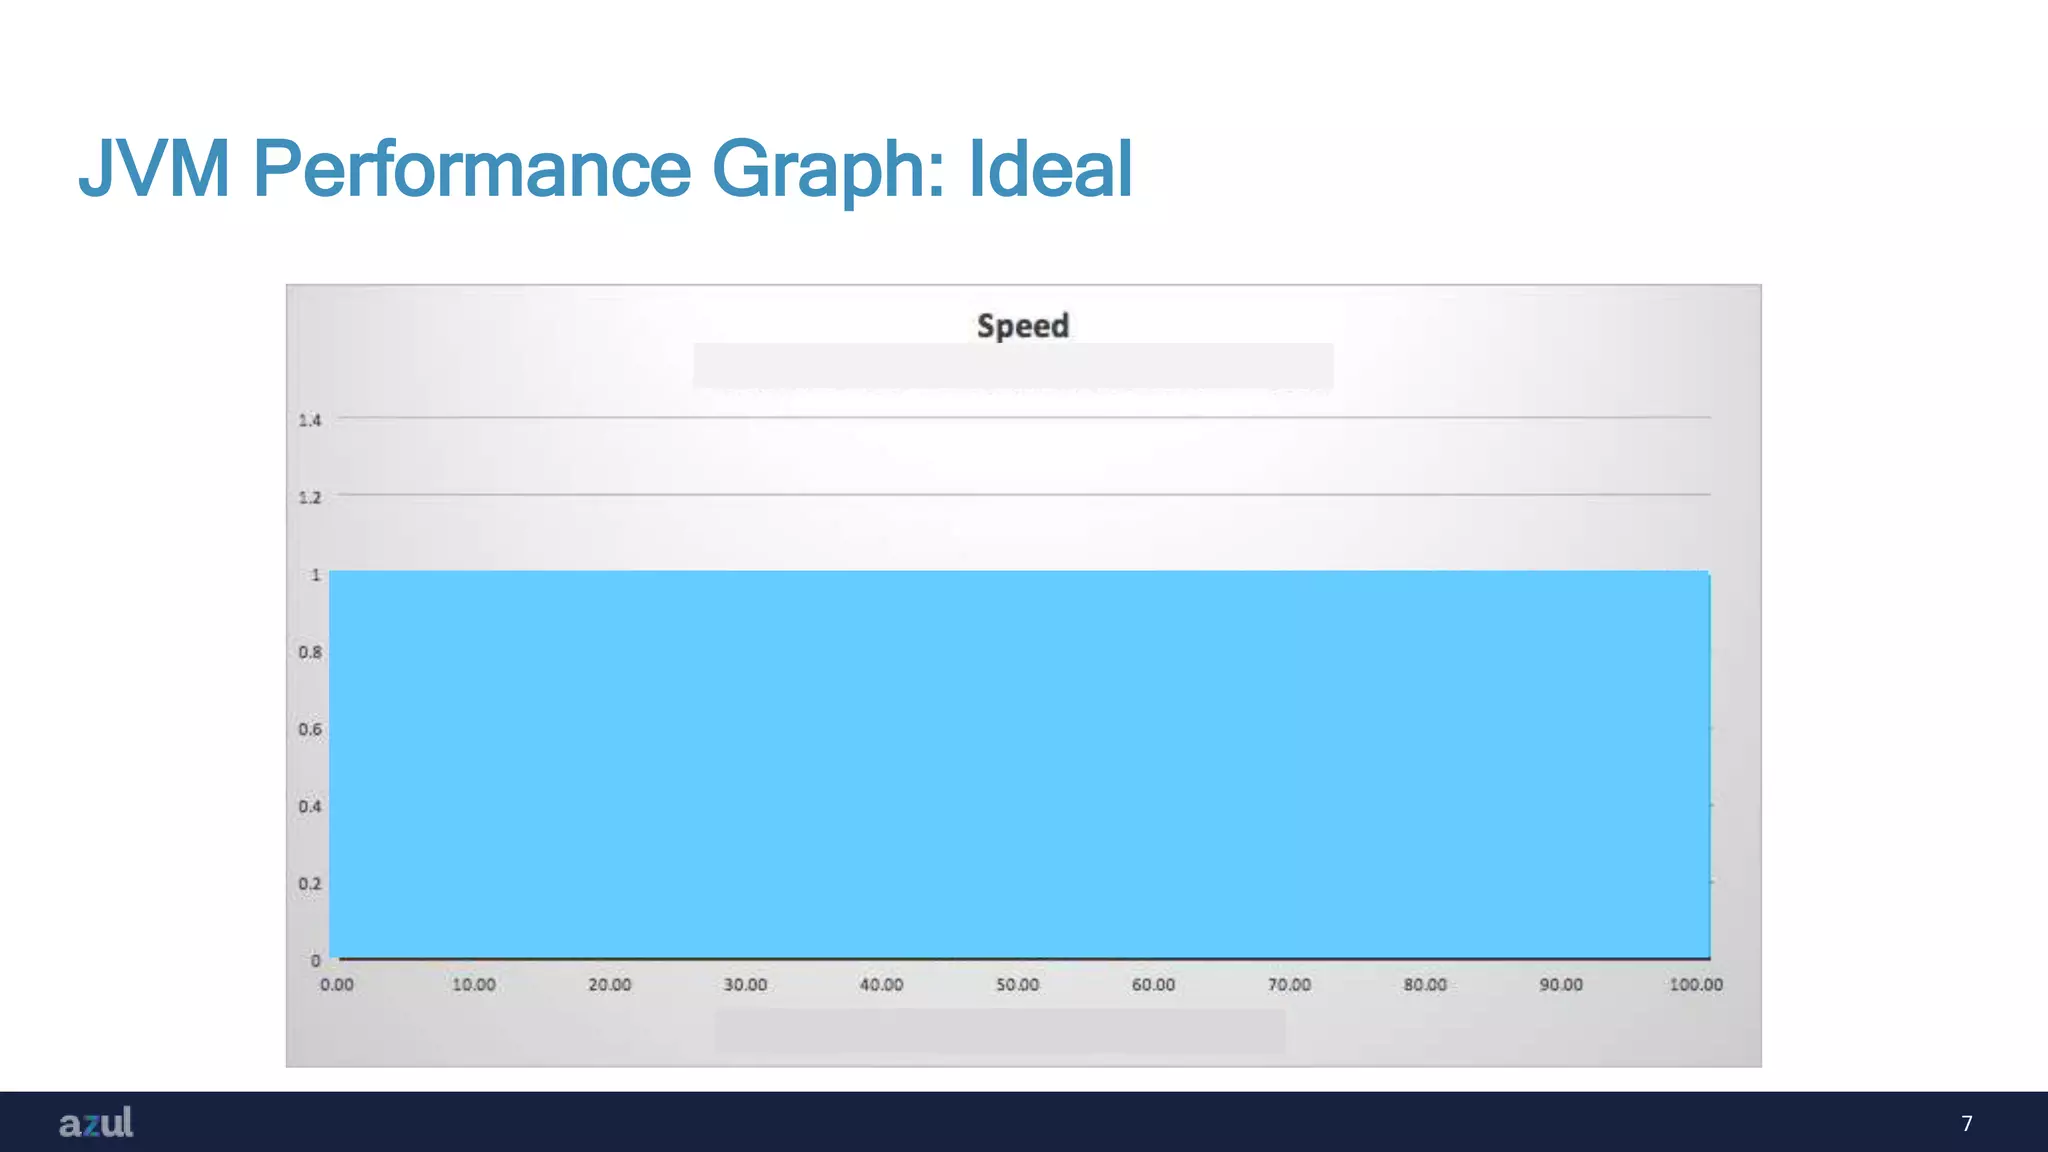
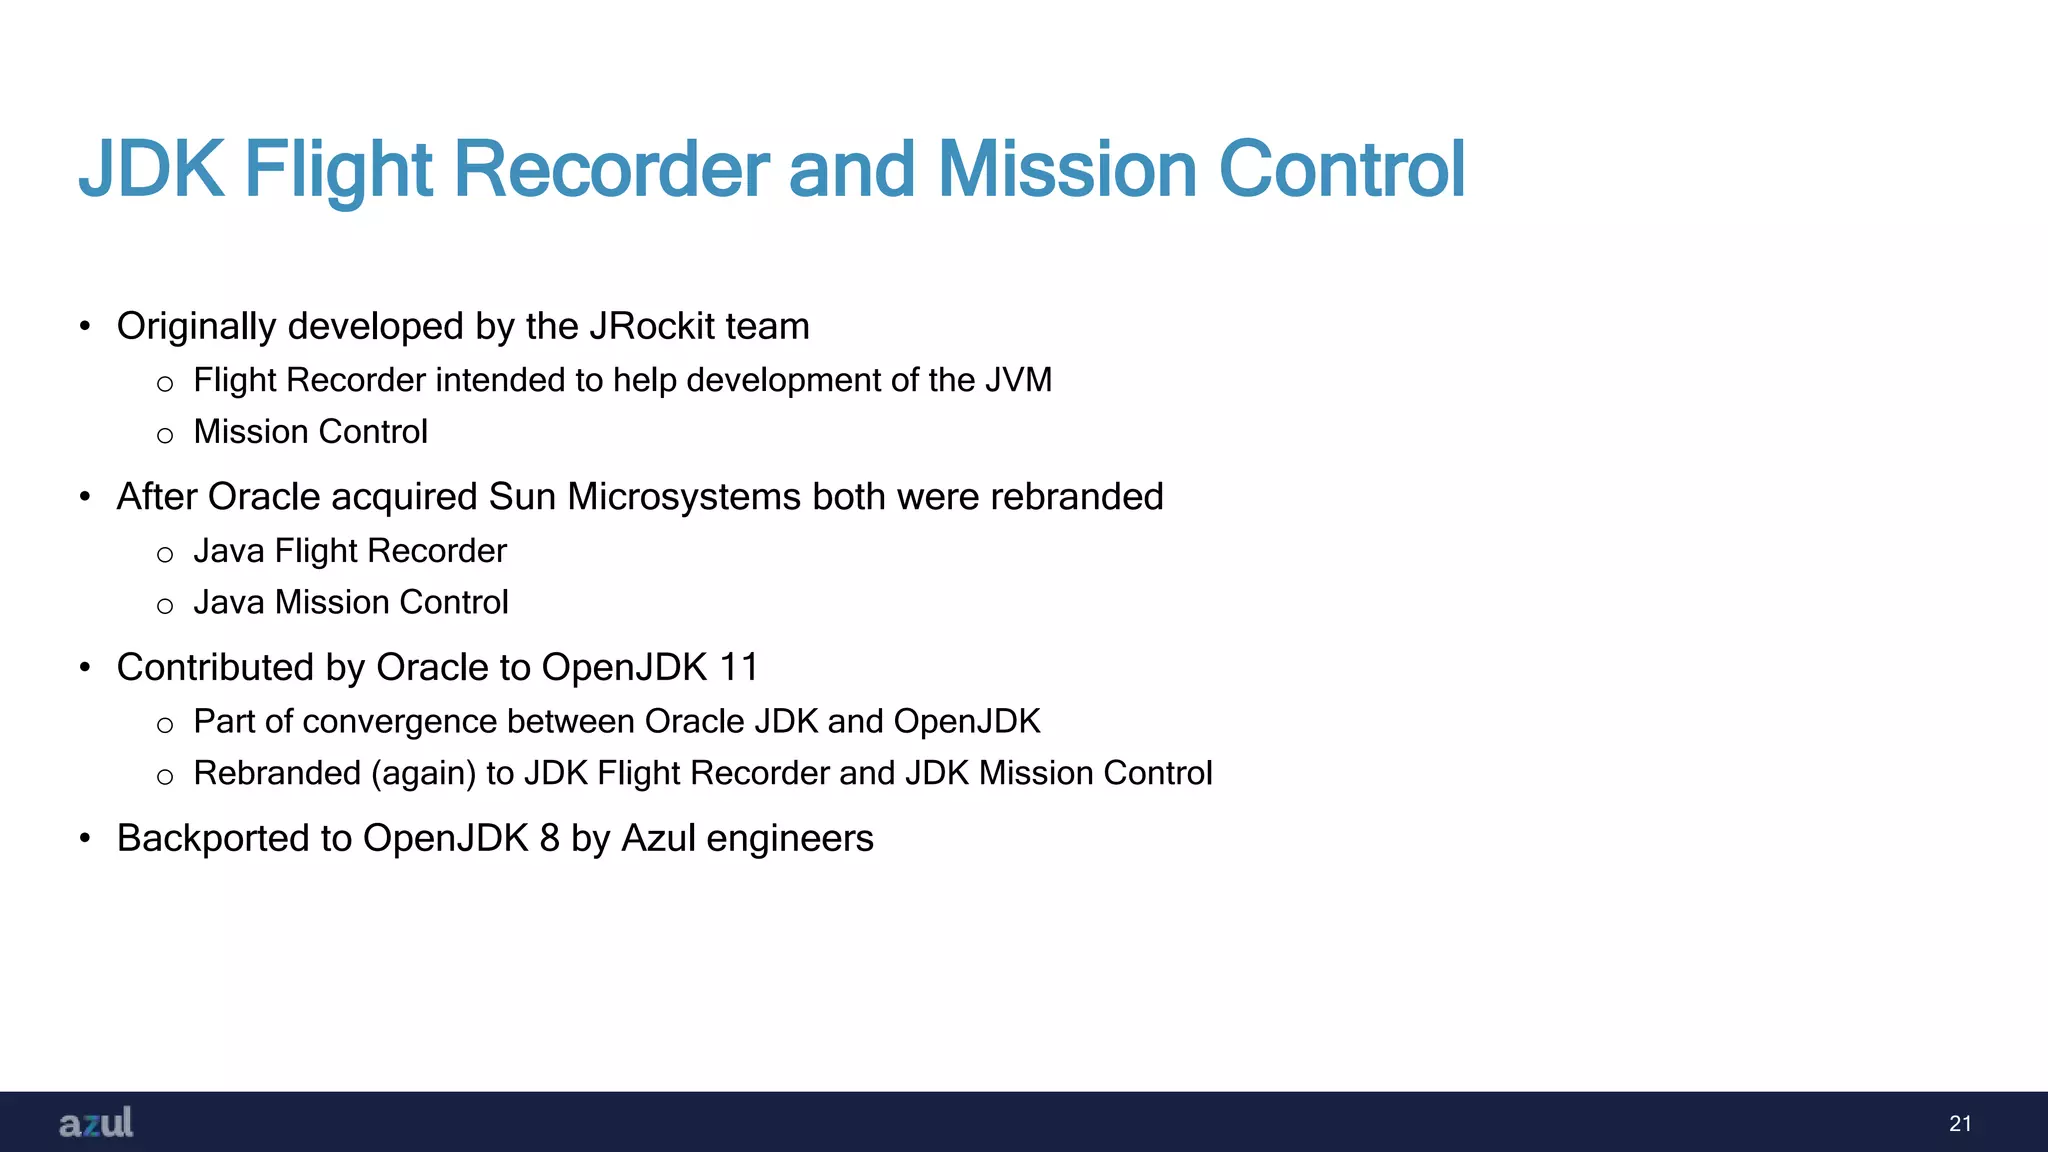
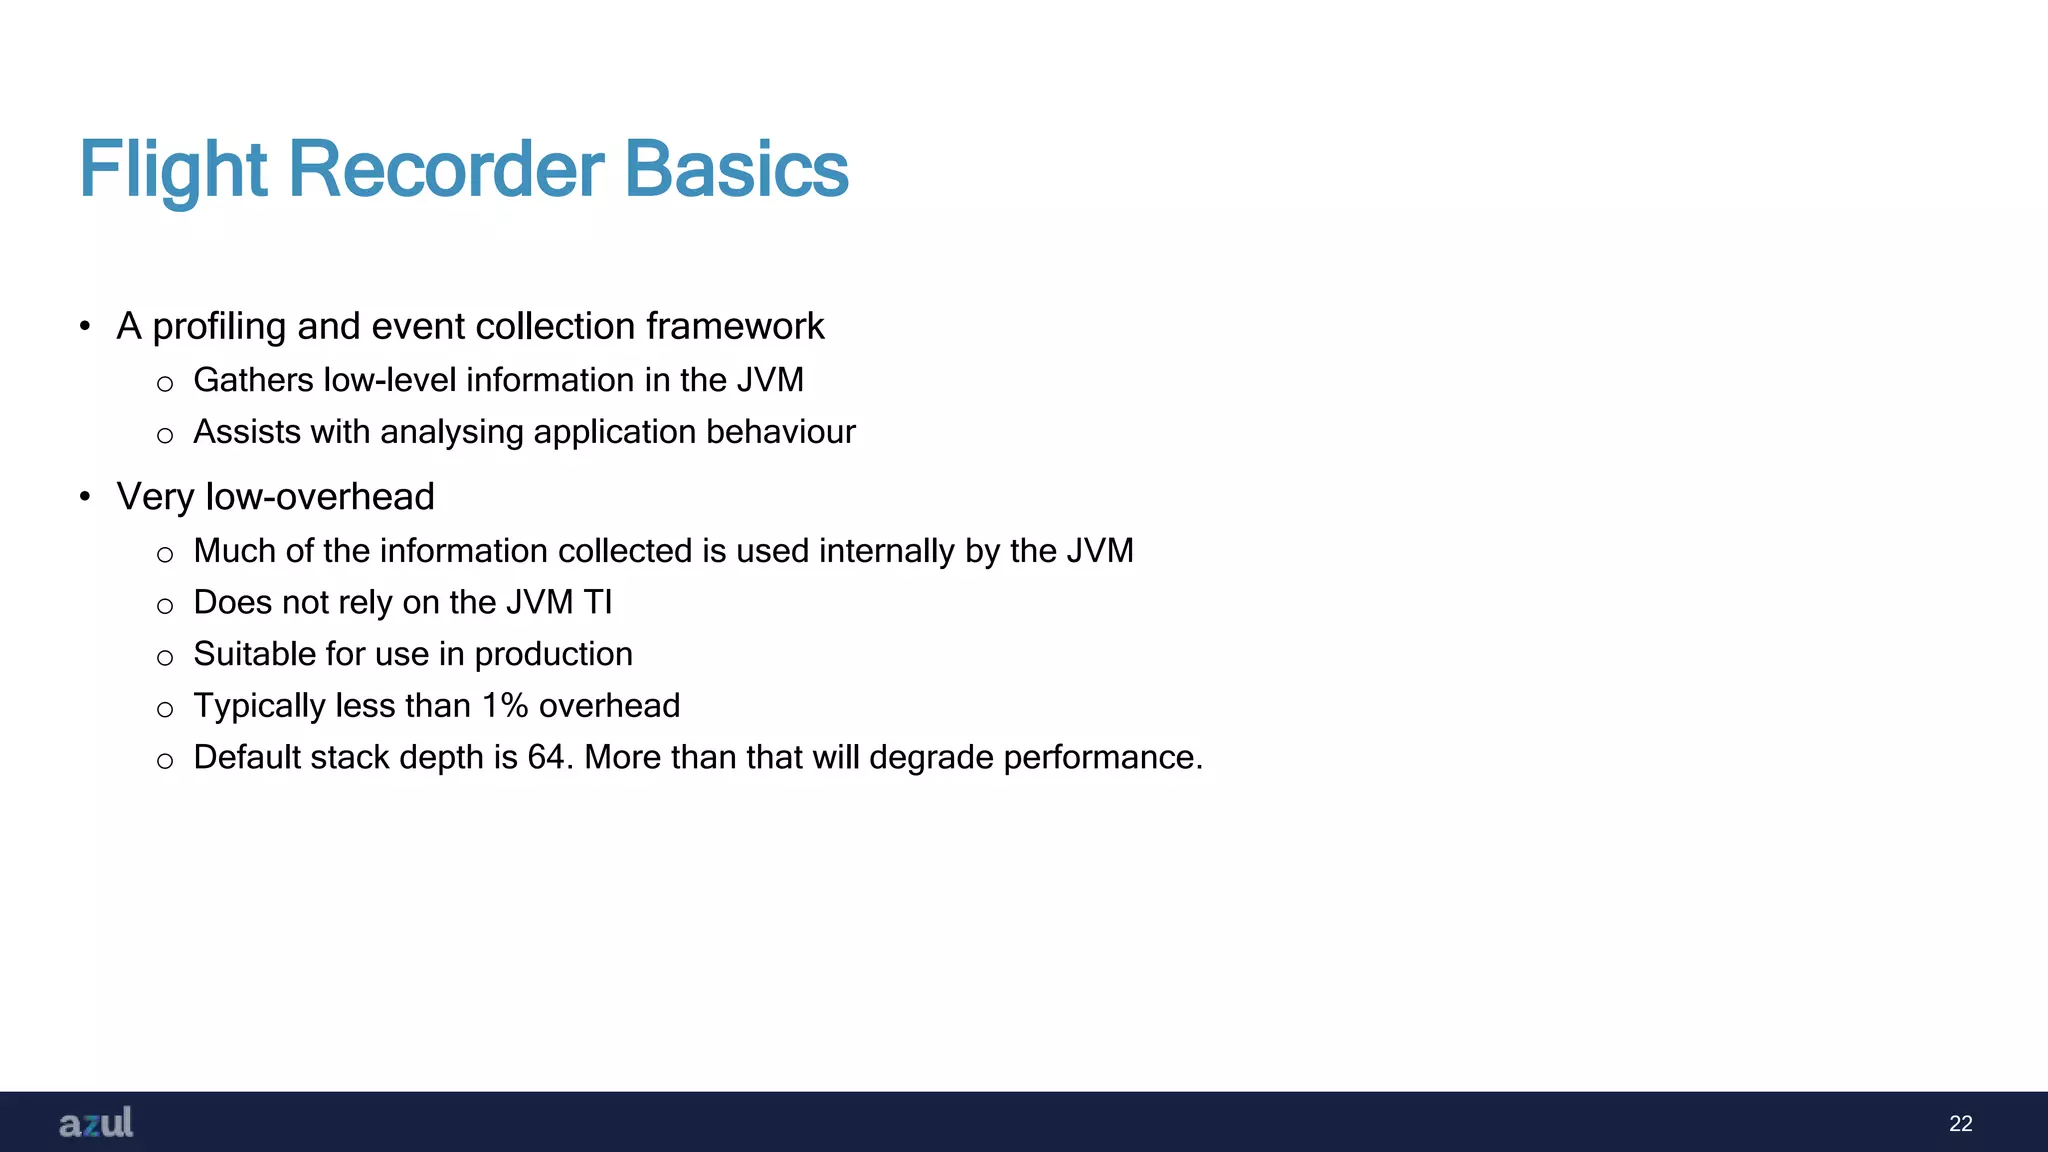
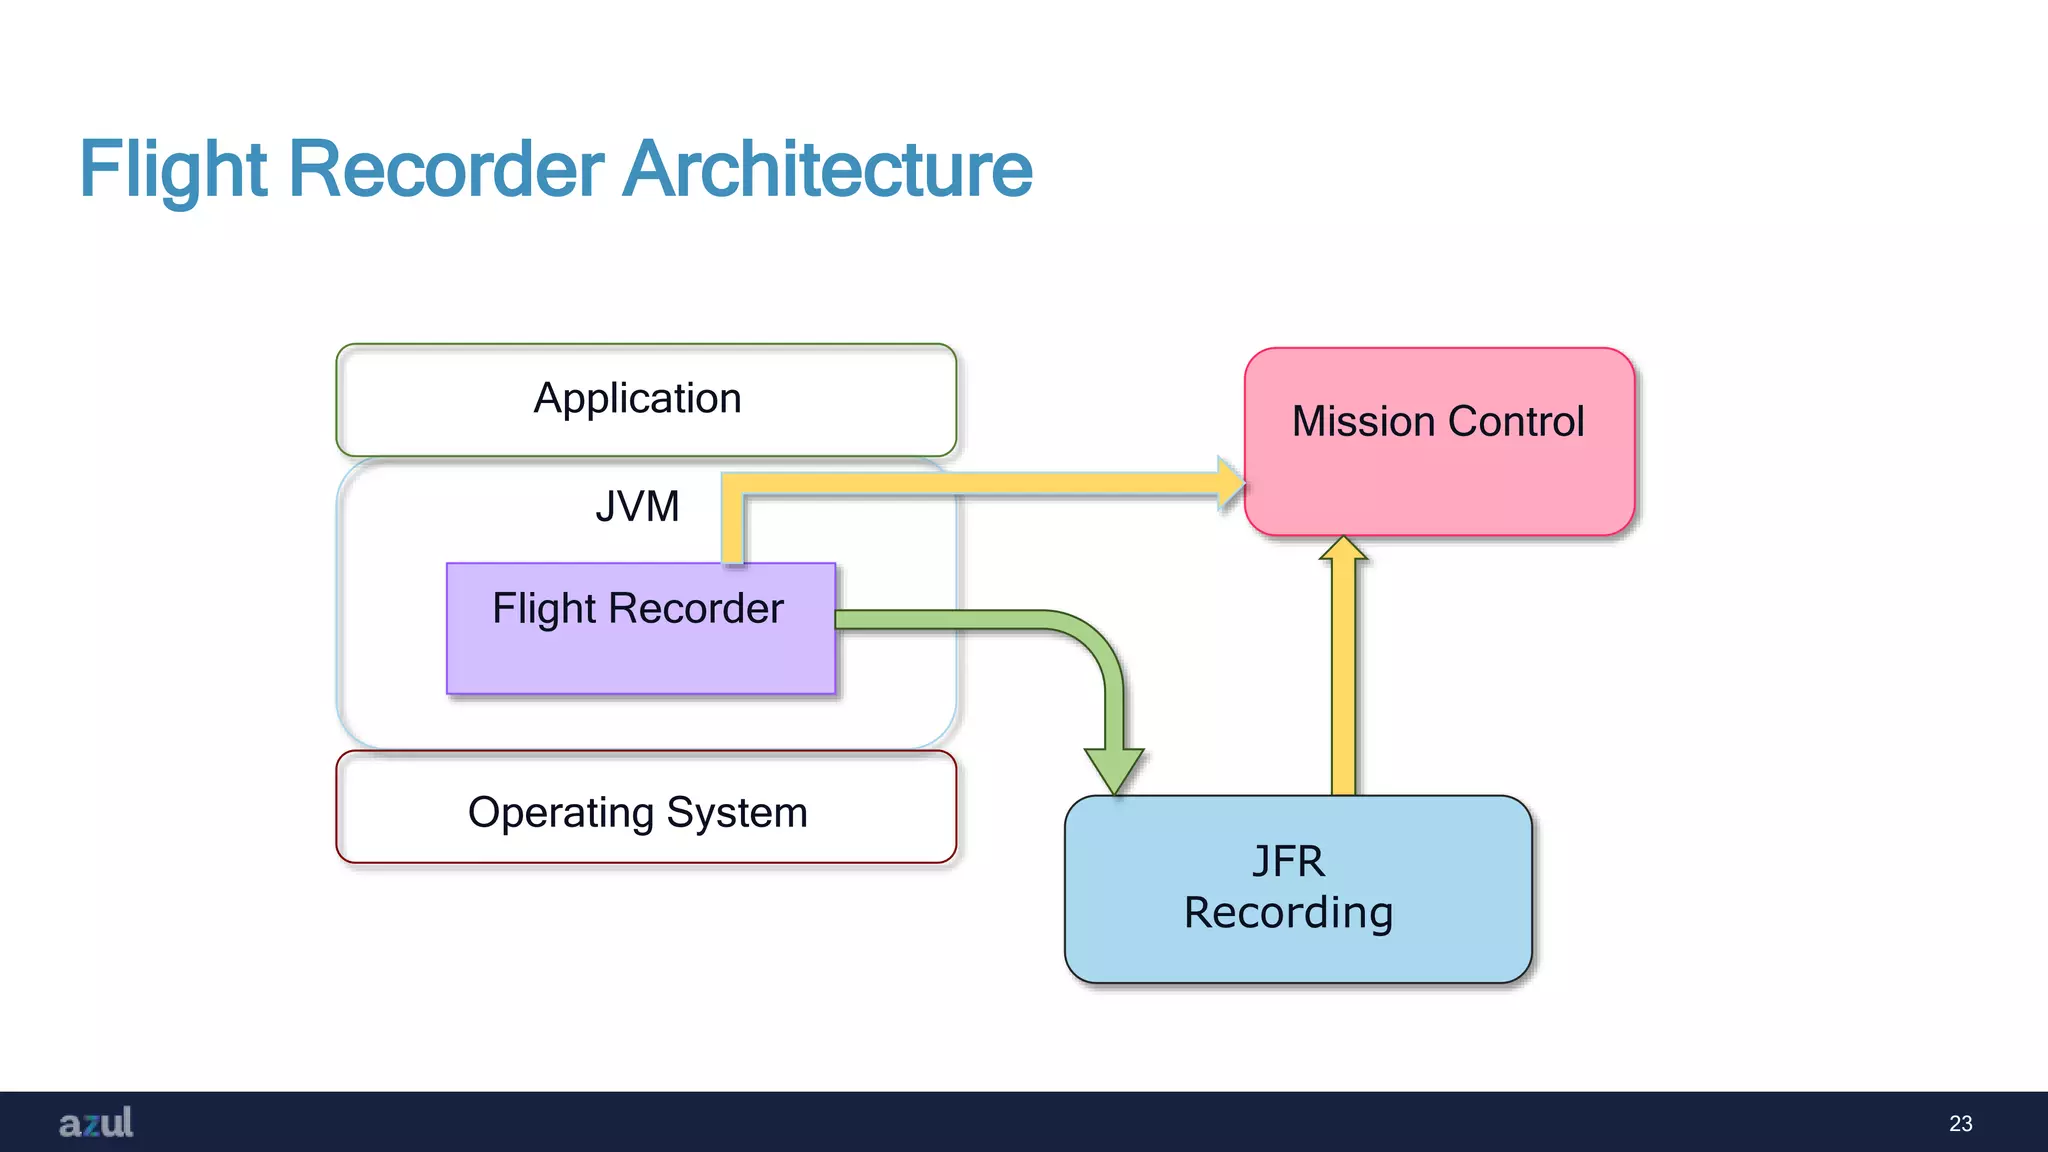
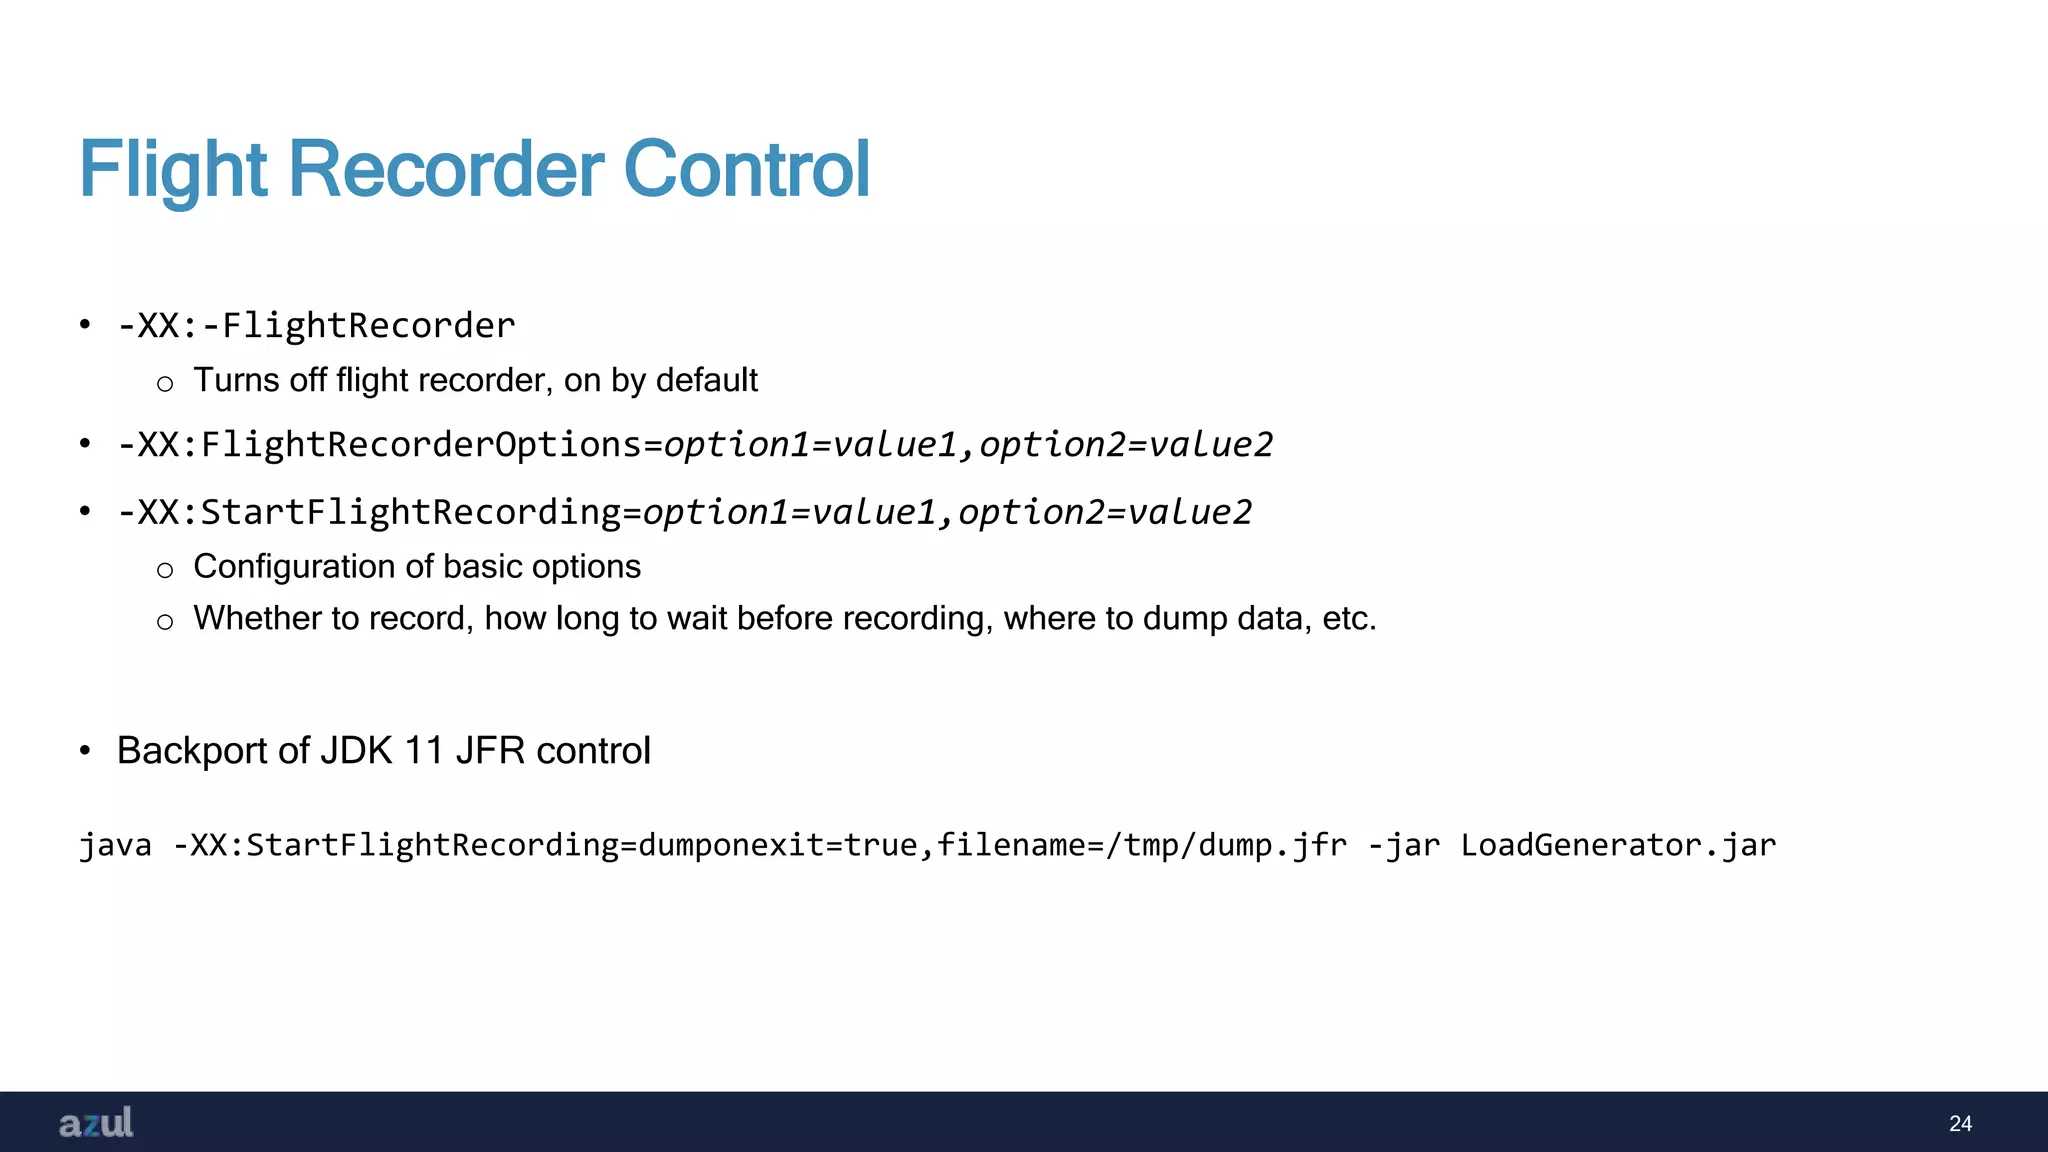
The document presents an overview of Java performance monitoring using Flight Recorder and Mission Control, emphasizing the importance of understanding JVM performance and operational features like JIT compilation and garbage collection. It details how Flight Recorder functions as a low-overhead profiling tool for JVM, gathering critical data on application behavior, while Mission Control provides a graphical interface for analysis. The conclusion highlights the JVM's potential for better performance than statically compiled code and the significance of both tools in optimizing Java applications.


![[2019] 바르게, 빠르게! Reactive를 품은 Spring Kafka](https://cdn.slidesharecdn.com/ss_thumbnails/nhnforward20198-200121085520-thumbnail.jpg?width=600ounds&width=560&fit=bounds)


![JDK Mission Control: Where We Are, Where We Are Going [Code One 2019]](https://cdn.slidesharecdn.com/ss_thumbnails/oco19jmc-191015115052-thumbnail.jpg?width=600ounds&width=560&fit=bounds)


