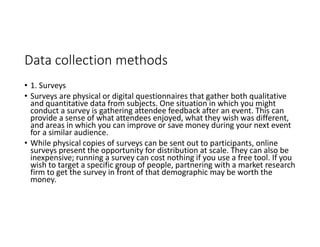
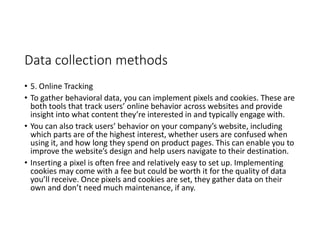
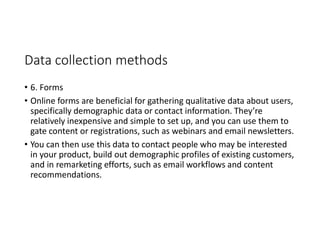
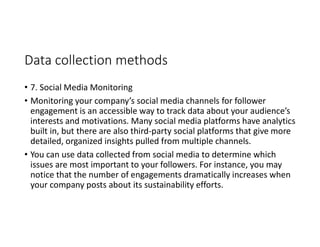
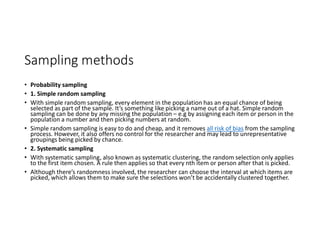
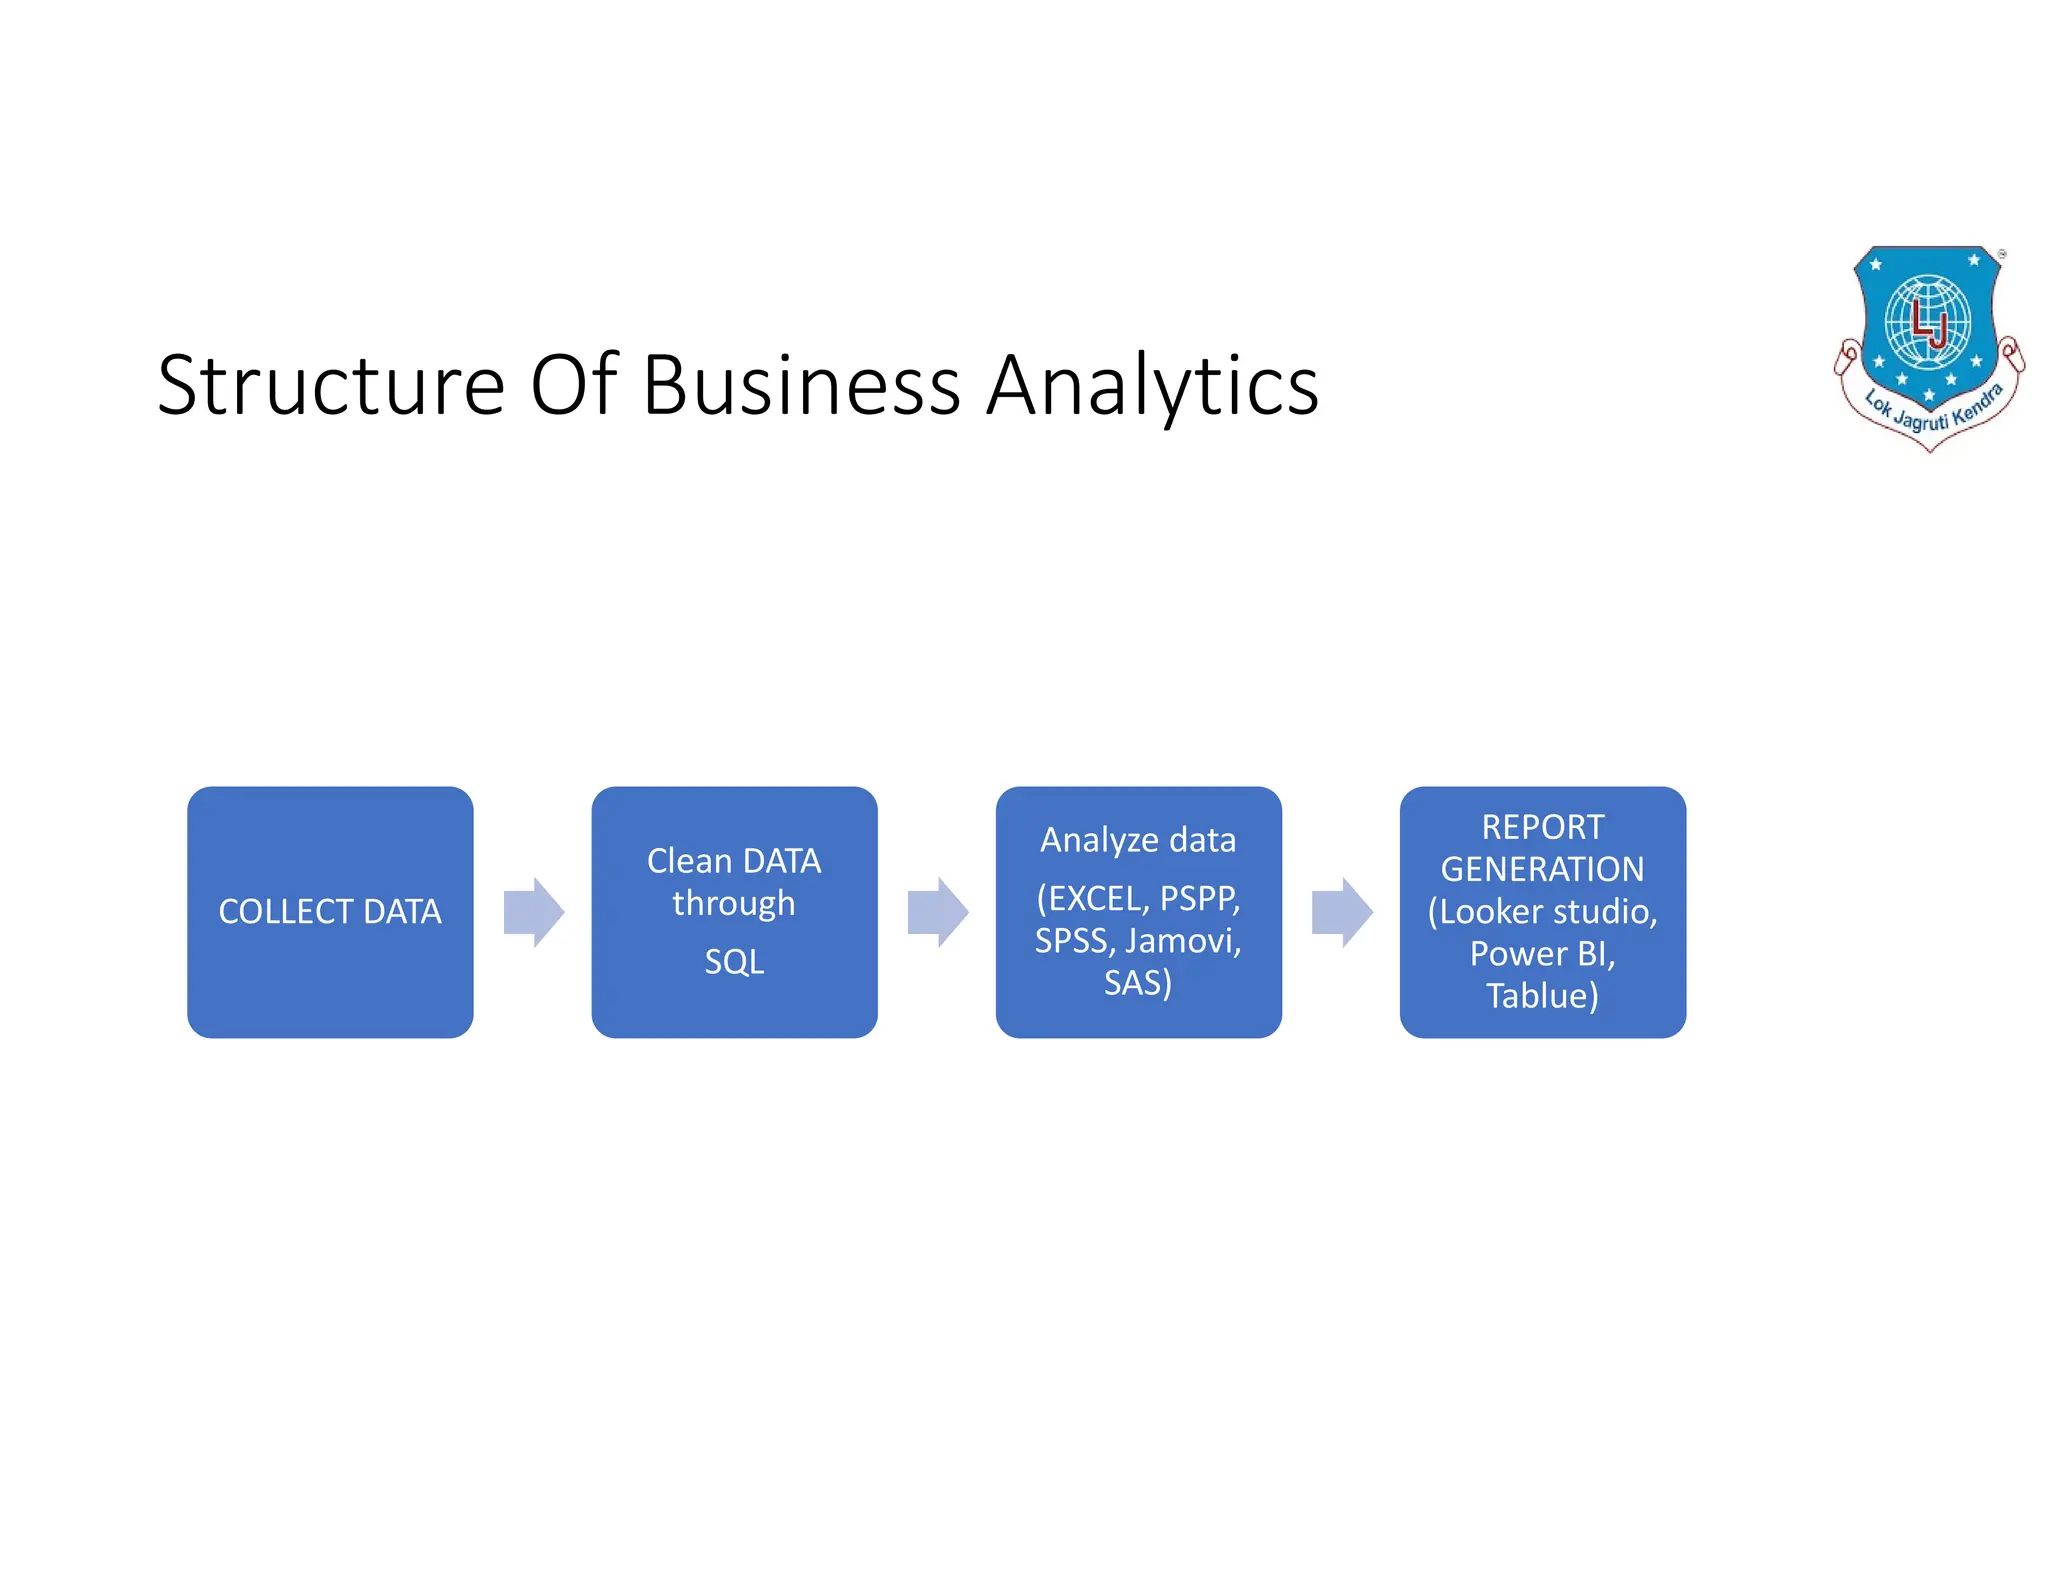
KEMBAR78
business analytics unit 1 and 3 notes.pdf
Structure of
Business Analytics
Structure Of Business Analytics
COLLECT DATA
Clean DATA
through
SQL
Analyze data
(EXCEL, PSPP,
SPSS, Jamovi,
SAS)
REPORT
GENERATION
(Looker studio,
Power BI,
Tablue)
Data collection methods
• 1. Surveys
• Surveys are physical or digital questionnaires that gather both qualitative
and quantitative data from subjects. One situation in which you might
conduct a survey is gathering attendee feedback after an event. This can
provide a sense of what attendees enjoyed, what they wish was different,
and areas in which you can improve or save money during your next event
for a similar audience.
• While physical copies of surveys can be sent out to participants, online
surveys present the opportunity for distribution at scale. They can also be
inexpensive; running a survey can cost nothing if you use a free tool. If you
wish to target a specific group of people, partnering with a market research
firm to get the survey in front of that demographic may be worth the
money.
Data collection methods
• 2. Transactional Tracking
• Each time your customers make a purchase, tracking that data can allow you to make decisions about targeted marketing efforts
and understand your customer base better.
• Often, e-commerce and point-of-sale platforms allow you to store data as soon as it’s generated, making this a seamless data
collection method that can pay off in the form of customer insights.
• 3. Interviews and Focus Groups
• Interviews and focus groups consist of talking to subjects face-to-face about a specific topic or issue. Interviews tend to be one-on-
one, and focus groups are typically made up of several people. You can use both to gather qualitative and quantitative data.
• Through interviews and focus groups, you can gather feedback from people in your target audience about new product features.
Seeing them interact with your product in real-time and recording their reactions and responses to questions can provide valuable
data about which product features to pursue.
• As is the case with surveys, these collection methods allow you to ask subjects anything you want about their opinions,
motivations, and feelings regarding your product or brand. It also introduces the potential for bias. Aim to craft questions that
don’t lead them in one particular direction.
• One downside of interviewing and conducting focus groups is they can be time-consuming and expensive. If you plan to conduct
them yourself, it can be a lengthy process. To avoid this, you can hire a market research facilitator to organize and conduct
interviews on your behalf.
Data collection methods
• 4. Observation
• Observing people interacting with your website or product can be useful
for data collection because of the candor it offers. If your user experience is
confusing or difficult, you can witness it in real-time.
• Yet, setting up observation sessions can be difficult. You can use a third-
party tool to record users’ journeys through your site or observe a user’s
interaction with a beta version of your site or product.
• While less accessible than other data collection methods, observations
enable you to see firsthand how users interact with your product or site.
You can leverage the qualitative and quantitative data gleaned from this to
make improvements and double down on points of success.
•
Data collection methods
• 5. Online Tracking
• To gather behavioral data, you can implement pixels and cookies. These are
both tools that track users’ online behavior across websites and provide
insight into what content they’re interested in and typically engage with.
• You can also track users’ behavior on your company’s website, including
which parts are of the highest interest, whether users are confused when
using it, and how long they spend on product pages. This can enable you to
improve the website’s design and help users navigate to their destination.
• Inserting a pixel is often free and relatively easy to set up. Implementing
cookies may come with a fee but could be worth it for the quality of data
you’ll receive. Once pixels and cookies are set, they gather data on their
own and don’t need much maintenance, if any.
Data collection methods
• 6. Forms
• Online forms are beneficial for gathering qualitative data about users,
specifically demographic data or contact information. They’re
relatively inexpensive and simple to set up, and you can use them to
gate content or registrations, such as webinars and email newsletters.
• You can then use this data to contact people who may be interested
in your product, build out demographic profiles of existing customers,
and in remarketing efforts, such as email workflows and content
recommendations.
Data collection methods
• 7. Social Media Monitoring
• Monitoring your company’s social media channels for follower
engagement is an accessible way to track data about your audience’s
interests and motivations. Many social media platforms have analytics
built in, but there are also third-party social platforms that give more
detailed, organized insights pulled from multiple channels.
• You can use data collected from social media to determine which
issues are most important to your followers. For instance, you may
notice that the number of engagements dramatically increases when
your company posts about its sustainability efforts.
Sampling methods
• Probability sampling
• 1. Simple random sampling
• With simple random sampling, every element in the population has an equal chance of being
selected as part of the sample. It’s something like picking a name out of a hat. Simple random
sampling can be done by any missing the population – e.g by assigning each item or person in the
population a number and then picking numbers at random.
• Simple random sampling is easy to do and cheap, and it removes all risk of bias from the sampling
process. However, it also offers no control for the researcher and may lead to unrepresentative
groupings being picked by chance.
• 2. Systematic sampling
• With systematic sampling, also known as systematic clustering, the random selection only applies
to the first item chosen. A rule then applies so that every nth item or person after that is picked.
• Although there’s randomness involved, the researcher can choose the interval at which items are
picked, which allows them to make sure the selections won’t be accidentally clustered together.
Sampling methods
• 3. Stratified sampling
• Stratified sampling involves random selection within predefined groups. It’s useful when
researchers know something about the target population and can decide how to subdivide it
(stratify it) in a way that makes sense for the research.
• For example, if you were researching travel behaviours in a group of people, it might be helpful to
separate those who own or have use of a car from those who are dependent on public transport.
• Stratified sampling has benefits but it also introduces the question of how to stratify a population,
which adds in more risk of bias
• 4. Cluster sampling
• With cluster sampling, groups rather than individual units of the target population are selected at
random. These might be pre-existing groups, such as people in certain zip codes or students
belonging to an academic year.
• Cluster sampling can be done by selecting the entire cluster, or in the case of two-stage cluster
sampling, by randomly selecting the cluster itself, then selecting at random again within the
cluster.
Non-probability sampling methods
3. Purposive sampling
• Participants for the sample are chosen consciously by researchers based on their
knowledge and understanding of the research question at hand or their goals. Also
known as judgment sampling, this technique is unlikely to result in a representative
sample, but it is a quick and fairly easy way to get a range of results or responses.
4. Snowball or referral sampling
• With this approach, people recruited to be part of a sample are asked to invite those
they know to take part, who are then asked to invite their friends and family and so on.
The participation radiates through a community of connected individuals like a snowball
rolling downhill.
• This method can be helpful when the researcher doesn’t know very much about the
target population and has no easy way to contact or access them. However it will
introduce bias, for example by missing out isolated members of a community or skewing
towards certain age or interest groups who recruit amongst themselves.
STEP OF ANALYSIS
STATISTICS
Descriptive
Mean, median,
mode, frequency,
quartiles, skewness,
Kurtosis, Outliers
Diagnostics
Hypothesis
testing
Predictive
Regression
models
Perspective
Optimization
techniques,
Machine learning
Inferential statistics
• Tool for drawing conclusions about a population by examining random samples
• A sample is a smaller data set drawn from a larger data set called the population.
• If the sample does not represent the population, one cannot make reliable
decisions
• The purpose of studying inferential statistics is to identify the behavior of a
population.
STATISTICS
Descriptive Statistics Inferential Statistics
Meaning
Quantify the characteristics of the
data.
Draw conclusions about the population
by inspecting sample data.
Methods
Measures of central tendency,
dispersion
Hypothesis testing, Regression analysis
and Multivariate analysis
Use
Describe the characteristics of a
known sample or population
Make inferences about an unknown
population
Tests / tools
Mean, median, mode, skewness,
dispersion, range, variance, standard
deviation etc.
t-test, F test, z- test, ANOVA, linear ,
non- linear and logistic regression, etc.
Descriptive & Inferential Statistics
Descriptive Statistics
• Organize
• Summarize
• Simplify
• Presentation of
data
Inferential Statistics
• Generalize from
samples to pops
• Hypothesis testing
• Relationships
among variables
Describing data
Make predictions
Descriptive Statistics
3 Types
1. Frequency Distributions 3. Summary Stats
2. Graphical Representations
# of observations that fall
in a particular category
Describe data in
numbers
Graphs & Tables
What is a Statistic????
Population
Sample
Sample
Sample
Sample
Parameter: value that describes a population
Statistic: a value that describes a sample
Chain of Reasoning for
Inferential Statistics
Population
Sample
Inference
Selection
Measure
Probability
data
Are our inferences valid?…Best we can do is to calculate probability
about inferences
Hypothesis
• An assumption or a statement that may or may not be true.
• It is tested on the basis of information obtained from a sample.
• Hypothesis tests are widely used in business and industry for making decisions.
• Instead of asking, for example, what the mean assessed value of an apartment in a
multistoried building is, one may be interested in knowing whether or not the apartment
value equals some particular value, say Rs 50 lakh.
• Some other examples could be whether a new drug is more effective than the existing
drug
Types of hypothesis
• Null hypothesis (H0): No difference hypothesis
• Alternative hypothesis (H1): Rejection of null hypotheses
Types of Hypothesis
Null Hypothesis
(H0)
Average marks of class A=
Average marks of class C
Alternative
Hypothesis (H1)
Average marks of class A≠
Average marks of class D
Null Hypothesis
(H0)
Average marks of
class C= Average
marks of class D
No difference
between
population and
sample
Sample follows
Normal distribution
Alternative
Hypothesis (H1)
Average marks of
class C≠ Average
marks of class D
Significant
difference between
population and
sample
Sample does not
follow Normal
distribution
Null Hypothesis
(H0)
Drug has no
effect on disease
Minimum
average life is
more than 1200
hours (x≥1200)
Maximum speed
is 180 km/hour
(x<180)
Alternative
Hypothesis (H1)
Drug has effect
on disease
Minimum
average life is less
than1200 hours
(x<1200)
Minimum speed
is 180 km/hour
(x>180)
Null and alternative Hypothesis
Hypothesis
Null Hypothesis H0
A tentative assumption
is made about
the parameter or
distribution
No difference
Alternative hypothesis
H1 or Ha
the opposite of what is
stated in the null
hypothesis
Null hypothesis checks
for the variability in the
data is due to chance
causes only
The two hypothesis
must be exclusive and
exhaustive
ERRORS IN HYPOTHESIS
Hypothesis Decision regarding the hypothesis
Accept H0 Reject H0
True Correct decision Error
Type 1 error
False Error
Type 2 error
Correct decision
Type 1 error = α = Prob( Reject H0, when H0 is true)
Type 2 error = β= Prob( AcceptH0, when H0 is False)
The fixed value of α is known as
level of significance.
The value of 1-β is known as
power of the test
α
β
If sample size increases, power of the test also increases.
Level of significance
• 5 % level of significance means 95 % confidence interval (so
that in only 5 cases out of 100 cases we can make such error …
95 cases we will have no errors) (α = 0.05)
• 1 % level of significance means 99 % confidence interval (so
that in only 1 cases out of 100 cases we can make such error …
99 cases we will have no errors) (α = 0.01)
• What do you mean by 10% level of significance?
• Ans: Confidence interval (CI) 90% (α = 0.1)
Steps of hypothesis testing
• Setting up of a hypothesis
• Setting up of a suitable significance level
• Determination of a test statistic
• Computing the value of test-statistic using any software
• Making decision based on p value approach
• Compute effect size if required
Effect size
• Effect size is a quantitative measure of the magnitude of the
experimental effect. The larger the effect size the stronger the
relationship between two variables.
Test Measure Very small Small Medium Large
Between means-
parametric
Cohen’s d <0.2 0.2 0.5 0.8
Hedge’s g <0.2 0.2 0.5 0.8
Between means-
Nonparametric
Rank biserial <0.1 0.1 0.3 0.5
ANOVA Eta square <0.1 0.1 0.25 0.37
Partial eta square <0.01 0.01 0.06 0.14
Omega square <0.01 0.01 0.06 0.14
Parametric tests
• Variable follows Normal distriution
• Shapiro- Wilk’s test/ Q-Q plot
• P value >alpha level--- Fail to reject Ho (variable follows Normal
distribution)
Non parametric tests
• Variable does not follows Normal distribution
One sample T test
Ho: Sample average=
population average
Normality satisfied
(p> 0.05)
Parametric one sample t-
test
Normality does not
satisfied (p <0.05)
Non parametric :
Wilcoxon rank test
T TEST
1 sample
Check normality
Satisfied
Parametric
One sample t
Not satisfied
Non parametric
: Wilcoxon
rank
2 independent
samples
Check
normality
Not
satisfied
Non Parametric
Mann-Whitney
U
If normality is satisfied then Check for
Homogeneity
Not
satisfied
Non
Parametric
Welch
If both normality and
homogeneity satisfied
Parametric student’s t
test
References
• Research methodology, concepts and cases: Deepak Chawla, Neena
Sodhi,First edition,VIKAS PUBLISHING HOUSE PVT. LTD
• Statistics for management and economics: Gerald Keller, Gunjan
Malhotra, Cengage publishing
• https://online.hbs.edu/blog/post/data-collection-methods
• https://www.questionpro.com/blog/data-collection-methods/
• https://www.simplilearn.com/types-of-sampling-techniques-
article
• https://www.mygreatlearning.com/blog/introduction-to-
sampling-techniques/
• https://www.analyticsvidhya.com/blog/2019/09/data-
scientists-guide-8-types-of-sampling-techniques/
SEMESTER 5
STRUCTURE OF BUSINESS ANALYTICS
Multiple choice questions
1. The method of selecting a small number of items or people to test an assumption or hypotheses is
called:
a. Statistics
b. Sampling
c. dipstick survey
d. Probability theory
e. a & b
f. All of the above
2. A survey question about marital status , to be answered as married or unmarried is an example of a(n):
a. Dichotomous variable
b. Unknown variable
c. Dependent variable
d. Continuous variable
3. A survey question about liking the new pizza at Pizza Hut on a five-point scale ranging from ‘like
a lot’ to ‘dislike a lot’ is an example of a(n):
a. Dichotomous variable
b. Unknown variable
c. Dependent variable
d. Continuous variable
4. In a typical research problem the is expected to influence the .
a. Predictor variable; primary variable
b. Independent variable; dependent variable
c. Dependent variable; independent variable
d. Criterion; hypothesis
5. If one is studying the impact of variable pay component on job satisfaction, then job satisfaction
is
a. Independent variable
b. Intervening variable
c. Dependent variable
d. Unknown variable
6. _____ are statements/assumptions made -about the likely outcomes of the problem-which may or
may not be true.
a. Hypotheses
b. Research questions
c. Marketing research problems
d. Analytical models
e. None of the above
7. A researcher wants to study whether a two-wheeler buyer would buy an electric car. The unit of
analysis in this case would be the
a. Electric car dealer
b. Two-wheeler dealer
c. Two-wheeler owner
d. current electric car owners
8. In comparison to primary data, secondary data can be collected
a. Rapidly and easily
b. At a relatively low cost
c. In a short time
d. With less effort
e. All of the above
9. Census of India is a
a. Syndicate data source
b. Internal data source
c. Government data source
d. Non-government data source
e. None of the above
10. In which of the following scales can all possible statistical techniques be applied?
a. Nominal
b. Ordinal
c. Ratio
d. Interval
11. In which of the following scales the objects are arranged according to their magnitude in an ordered
relationship?
a. Nominal scale
b. Ordinal scale
c. Interval scale
d. Ratio scale
12. Which of the following scales possess an absolute zero?
a. Nominal scale
b. Ordinal scale
c. Interval scale
d. Ratio scale
e. None of the above
13. In which of the following interviewer bias is very high and thus a problem?
a. E-mail questionnaire
b. Telephone interview
c. Mail questionnaire
d. Web-based questionnaire
e. None of the above
14. Which of the following is not a probability sampling plan?
a. Systematic sampling
b. Cluster sampling
c. Convenience sampling
d. Stratified sampling
15. Selecting every fifth male entering the mall is an example of
a. Quota sampling
b. Cluster sampling
c. Systematic sampling
d. Simple random sampling
16. In simple random sampling design each element of the population has the following chance of
being selected in the sample.
a. Equal
b. Unequal
c. Known
d. Equal and known
e. Unequal and known
17. Which of the following sampling methods could be used to make an estimate of the sampling error?
a. Convenience sampling
b. Probability sampling
c. Quota sampling
d. Snow-ball sampling
e. Judgment sampling
18. Which of the following statements is true?
a. Samples are less expensive.
b. Non-sampling error reduces with increase in sample size.
c. Simple random sampling is more efficient than stratified sampling.
d. All of the above are true.
19. In which of the probability sampling design, the first element is chosen at random and the remaining
elements are picked up by adding the sampling interval to it successively?
a. Cluster sampling
b. Stratified sampling
c. Systematic sampling
d. Simple random sampling
20. Requesting people to volunteer to test products is an example of
a. Quota sampling
b. Judgmental sampling
c. Random sampling
d. Convenience sampling
21. A rectangular arrangement of data into rows and columns is called-
a. A file
b. A record
c. A data matrix
d. A test tabulation
22. The usual ways to code a dichotomous question is
a. 0 and 1
b. 1 to 5
c. 0, 1 and 2
d. None of the above
23. In case the researcher has asked the respondent to rank 10 brands then the number of columns
needed would be
a. 1
b. As many as the respondent has ranked
c. 10
d. Is the researcher’s discretion
24. In case of a rating question like – how satisfied are you with your mobile service provider? Use a
10 point scale –with 1=very satisfied and 10=very dissatisfied. The researcher would need---------
---columns.
a. 1
b. As many as the respondent has rated
c. 10
d. Is the researcher’s discretion
25. For which type of measurement, median cannot be computed.
a. Nominal
b. Ordinal
c. Interval
d. Ratio
26. For which type of measurement, mode can be computed.
a. Nominal
b. Ordinal
c. Interval
d. Ratio
27. When a respondent assigns an order of preference using values as 1, 2, 3 and so on, he is using
a. Nominal values
b. Ordinal values
c. Interval values
d. Ratio values
28. The median can be computed from
a. Ordinal, interval and nominal data
b. Ratio, ordinal and nominal data
c. Ratio, interval and ordinal data
d. Ratio, interval and nominal data
29. The probability of rejecting a null hypothesis when it is true is called
a Level of significance
b Type II error
c Type I error
d Beta
30. Testing hypotheses concerning population parameters using sample data is called
a Exploratory research
b Descriptive research
c Descriptive analysis
d Inferential analysis
31. When we accept the null hypothesis when it is false we, are committing
a type 1 error
b type 2 error
c neither type 1 nor type 2 error
d none of the above is true
32. The alternative hypothesis is “that more than 80% of the students know driving” is an example of
a One-tailed test
b Two-tailed test
c Type 1 error
d Type 2 error
33. What is a type 1 error?
a Reject 𝑯𝟎 when it is true.
b Accept 𝐻 when it is false.
c Reject 𝐻 when it is false.
d All of the above are true.
34. Which of the following statistical procedure is most appropriate when comparing the
difference in means of more than three groups?
a. t test
b. z test
c ANOVA
d None of the above
35. Parametric tests are applied when_______________
a. variable does not follow Normal distribution
b. it is uncertain
c variable follows Normal distribution
d None of the above
36. Some of the Parametric tests are _______________
a. Mann- Whitney U test
b. Weltch test
c Wilcoxon Rank test
d All the above
37. If in single sample testing process, the variable does not follow Normal distribution then
_______________ test should be applied.
a. Mann- Whitney U test
b. Weltch test
c Wilcoxon Rank test
d student’s t test
38. If in single sample testing process, the variable follows Normal distribution then
_______________ test should be applied.
a. Mann- Whitney U test
b. Weltch test
c Wilcoxon Rank test
d student’s t test
39. If in two independent sample testing process, the variable does not follow Normal
distribution then _______________ test should be applied.
a. Mann- Whitney U test
b. Weltch test
c Wilcoxon Rank test
d All the above
40. If in two independent sample testing process, the variable follows Normal distribution but
homogeneity criterion is not satisfied then _______________ test should be applied.
a. Mann- Whitney U test
b. Weltch test
c Wilcoxon Rank test
d All the above
41. If in two independent sample testing process, the variable follows Normal distribution and
homogeneity criterion is also satisfied then _______________ test should be applied.
a. Mann- Whitney U test
b. Weltch test
c Wilcoxon Rank test
d Student’s t test
42. For the next 4 questions, read the following table:
TABLE
Consumption of ice cream and household income
Low Consumption of Ice cream High Consumption of Ice cream Total
Low Income 30 10 40
Middle Income 20 20 40
High Income 12 28 40
Total 62 58 120
1. The above table is an example of
a. Cross-tabulation
b. One way tabulation
c. Four way classification
d. None of the above
2. What percentage of household have less consumption of Ice cream?
a. 50
b 51.67
c 54
d 49.38
3. How many households are there with middle income?
a 30
b 28
c 40
d None of the above
4. How many household with middle income have high consumption of Ice cream?
a 20
b 30
c 28
d 12

business analytics unit 1 and 3 notes.pdf

  • 1.
  • 2.
    Structure Of BusinessAnalytics COLLECT DATA Clean DATA through SQL Analyze data (EXCEL, PSPP, SPSS, Jamovi, SAS) REPORT GENERATION (Looker studio, Power BI, Tablue)
  • 3.
    Data collection methods •1. Surveys • Surveys are physical or digital questionnaires that gather both qualitative and quantitative data from subjects. One situation in which you might conduct a survey is gathering attendee feedback after an event. This can provide a sense of what attendees enjoyed, what they wish was different, and areas in which you can improve or save money during your next event for a similar audience. • While physical copies of surveys can be sent out to participants, online surveys present the opportunity for distribution at scale. They can also be inexpensive; running a survey can cost nothing if you use a free tool. If you wish to target a specific group of people, partnering with a market research firm to get the survey in front of that demographic may be worth the money.
  • 4.
    Data collection methods •2. Transactional Tracking • Each time your customers make a purchase, tracking that data can allow you to make decisions about targeted marketing efforts and understand your customer base better. • Often, e-commerce and point-of-sale platforms allow you to store data as soon as it’s generated, making this a seamless data collection method that can pay off in the form of customer insights. • 3. Interviews and Focus Groups • Interviews and focus groups consist of talking to subjects face-to-face about a specific topic or issue. Interviews tend to be one-on- one, and focus groups are typically made up of several people. You can use both to gather qualitative and quantitative data. • Through interviews and focus groups, you can gather feedback from people in your target audience about new product features. Seeing them interact with your product in real-time and recording their reactions and responses to questions can provide valuable data about which product features to pursue. • As is the case with surveys, these collection methods allow you to ask subjects anything you want about their opinions, motivations, and feelings regarding your product or brand. It also introduces the potential for bias. Aim to craft questions that don’t lead them in one particular direction. • One downside of interviewing and conducting focus groups is they can be time-consuming and expensive. If you plan to conduct them yourself, it can be a lengthy process. To avoid this, you can hire a market research facilitator to organize and conduct interviews on your behalf.
  • 5.
    Data collection methods •4. Observation • Observing people interacting with your website or product can be useful for data collection because of the candor it offers. If your user experience is confusing or difficult, you can witness it in real-time. • Yet, setting up observation sessions can be difficult. You can use a third- party tool to record users’ journeys through your site or observe a user’s interaction with a beta version of your site or product. • While less accessible than other data collection methods, observations enable you to see firsthand how users interact with your product or site. You can leverage the qualitative and quantitative data gleaned from this to make improvements and double down on points of success. •
  • 6.
    Data collection methods •5. Online Tracking • To gather behavioral data, you can implement pixels and cookies. These are both tools that track users’ online behavior across websites and provide insight into what content they’re interested in and typically engage with. • You can also track users’ behavior on your company’s website, including which parts are of the highest interest, whether users are confused when using it, and how long they spend on product pages. This can enable you to improve the website’s design and help users navigate to their destination. • Inserting a pixel is often free and relatively easy to set up. Implementing cookies may come with a fee but could be worth it for the quality of data you’ll receive. Once pixels and cookies are set, they gather data on their own and don’t need much maintenance, if any.
  • 7.
    Data collection methods •6. Forms • Online forms are beneficial for gathering qualitative data about users, specifically demographic data or contact information. They’re relatively inexpensive and simple to set up, and you can use them to gate content or registrations, such as webinars and email newsletters. • You can then use this data to contact people who may be interested in your product, build out demographic profiles of existing customers, and in remarketing efforts, such as email workflows and content recommendations.
  • 8.
    Data collection methods •7. Social Media Monitoring • Monitoring your company’s social media channels for follower engagement is an accessible way to track data about your audience’s interests and motivations. Many social media platforms have analytics built in, but there are also third-party social platforms that give more detailed, organized insights pulled from multiple channels. • You can use data collected from social media to determine which issues are most important to your followers. For instance, you may notice that the number of engagements dramatically increases when your company posts about its sustainability efforts.
  • 9.
    Sampling methods • Probabilitysampling • 1. Simple random sampling • With simple random sampling, every element in the population has an equal chance of being selected as part of the sample. It’s something like picking a name out of a hat. Simple random sampling can be done by any missing the population – e.g by assigning each item or person in the population a number and then picking numbers at random. • Simple random sampling is easy to do and cheap, and it removes all risk of bias from the sampling process. However, it also offers no control for the researcher and may lead to unrepresentative groupings being picked by chance. • 2. Systematic sampling • With systematic sampling, also known as systematic clustering, the random selection only applies to the first item chosen. A rule then applies so that every nth item or person after that is picked. • Although there’s randomness involved, the researcher can choose the interval at which items are picked, which allows them to make sure the selections won’t be accidentally clustered together.
  • 10.
    Sampling methods • 3.Stratified sampling • Stratified sampling involves random selection within predefined groups. It’s useful when researchers know something about the target population and can decide how to subdivide it (stratify it) in a way that makes sense for the research. • For example, if you were researching travel behaviours in a group of people, it might be helpful to separate those who own or have use of a car from those who are dependent on public transport. • Stratified sampling has benefits but it also introduces the question of how to stratify a population, which adds in more risk of bias • 4. Cluster sampling • With cluster sampling, groups rather than individual units of the target population are selected at random. These might be pre-existing groups, such as people in certain zip codes or students belonging to an academic year. • Cluster sampling can be done by selecting the entire cluster, or in the case of two-stage cluster sampling, by randomly selecting the cluster itself, then selecting at random again within the cluster.
  • 11.
    Non-probability sampling methods 3.Purposive sampling • Participants for the sample are chosen consciously by researchers based on their knowledge and understanding of the research question at hand or their goals. Also known as judgment sampling, this technique is unlikely to result in a representative sample, but it is a quick and fairly easy way to get a range of results or responses. 4. Snowball or referral sampling • With this approach, people recruited to be part of a sample are asked to invite those they know to take part, who are then asked to invite their friends and family and so on. The participation radiates through a community of connected individuals like a snowball rolling downhill. • This method can be helpful when the researcher doesn’t know very much about the target population and has no easy way to contact or access them. However it will introduce bias, for example by missing out isolated members of a community or skewing towards certain age or interest groups who recruit amongst themselves.
  • 12.
    STEP OF ANALYSIS STATISTICS Descriptive Mean,median, mode, frequency, quartiles, skewness, Kurtosis, Outliers Diagnostics Hypothesis testing Predictive Regression models Perspective Optimization techniques, Machine learning
  • 13.
    Inferential statistics • Toolfor drawing conclusions about a population by examining random samples • A sample is a smaller data set drawn from a larger data set called the population. • If the sample does not represent the population, one cannot make reliable decisions • The purpose of studying inferential statistics is to identify the behavior of a population.
  • 14.
    STATISTICS Descriptive Statistics InferentialStatistics Meaning Quantify the characteristics of the data. Draw conclusions about the population by inspecting sample data. Methods Measures of central tendency, dispersion Hypothesis testing, Regression analysis and Multivariate analysis Use Describe the characteristics of a known sample or population Make inferences about an unknown population Tests / tools Mean, median, mode, skewness, dispersion, range, variance, standard deviation etc. t-test, F test, z- test, ANOVA, linear , non- linear and logistic regression, etc.
  • 15.
    Descriptive & InferentialStatistics Descriptive Statistics • Organize • Summarize • Simplify • Presentation of data Inferential Statistics • Generalize from samples to pops • Hypothesis testing • Relationships among variables Describing data Make predictions
  • 16.
    Descriptive Statistics 3 Types 1.Frequency Distributions 3. Summary Stats 2. Graphical Representations # of observations that fall in a particular category Describe data in numbers Graphs & Tables
  • 17.
    What is aStatistic???? Population Sample Sample Sample Sample Parameter: value that describes a population Statistic: a value that describes a sample
  • 18.
    Chain of Reasoningfor Inferential Statistics Population Sample Inference Selection Measure Probability data Are our inferences valid?…Best we can do is to calculate probability about inferences
  • 19.
    Hypothesis • An assumptionor a statement that may or may not be true. • It is tested on the basis of information obtained from a sample. • Hypothesis tests are widely used in business and industry for making decisions. • Instead of asking, for example, what the mean assessed value of an apartment in a multistoried building is, one may be interested in knowing whether or not the apartment value equals some particular value, say Rs 50 lakh. • Some other examples could be whether a new drug is more effective than the existing drug
  • 20.
    Types of hypothesis •Null hypothesis (H0): No difference hypothesis • Alternative hypothesis (H1): Rejection of null hypotheses
  • 21.
    Types of Hypothesis NullHypothesis (H0) Average marks of class A= Average marks of class C Alternative Hypothesis (H1) Average marks of class A≠ Average marks of class D
  • 22.
    Null Hypothesis (H0) Average marksof class C= Average marks of class D No difference between population and sample Sample follows Normal distribution Alternative Hypothesis (H1) Average marks of class C≠ Average marks of class D Significant difference between population and sample Sample does not follow Normal distribution
  • 23.
    Null Hypothesis (H0) Drug hasno effect on disease Minimum average life is more than 1200 hours (x≥1200) Maximum speed is 180 km/hour (x<180) Alternative Hypothesis (H1) Drug has effect on disease Minimum average life is less than1200 hours (x<1200) Minimum speed is 180 km/hour (x>180)
  • 24.
    Null and alternativeHypothesis Hypothesis Null Hypothesis H0 A tentative assumption is made about the parameter or distribution No difference Alternative hypothesis H1 or Ha the opposite of what is stated in the null hypothesis Null hypothesis checks for the variability in the data is due to chance causes only The two hypothesis must be exclusive and exhaustive
  • 25.
    ERRORS IN HYPOTHESIS HypothesisDecision regarding the hypothesis Accept H0 Reject H0 True Correct decision Error Type 1 error False Error Type 2 error Correct decision Type 1 error = α = Prob( Reject H0, when H0 is true) Type 2 error = β= Prob( AcceptH0, when H0 is False) The fixed value of α is known as level of significance. The value of 1-β is known as power of the test α β If sample size increases, power of the test also increases.
  • 26.
    Level of significance •5 % level of significance means 95 % confidence interval (so that in only 5 cases out of 100 cases we can make such error … 95 cases we will have no errors) (α = 0.05) • 1 % level of significance means 99 % confidence interval (so that in only 1 cases out of 100 cases we can make such error … 99 cases we will have no errors) (α = 0.01) • What do you mean by 10% level of significance? • Ans: Confidence interval (CI) 90% (α = 0.1)
  • 27.
    Steps of hypothesistesting • Setting up of a hypothesis • Setting up of a suitable significance level • Determination of a test statistic • Computing the value of test-statistic using any software • Making decision based on p value approach • Compute effect size if required
  • 28.
    Effect size • Effectsize is a quantitative measure of the magnitude of the experimental effect. The larger the effect size the stronger the relationship between two variables. Test Measure Very small Small Medium Large Between means- parametric Cohen’s d <0.2 0.2 0.5 0.8 Hedge’s g <0.2 0.2 0.5 0.8 Between means- Nonparametric Rank biserial <0.1 0.1 0.3 0.5 ANOVA Eta square <0.1 0.1 0.25 0.37 Partial eta square <0.01 0.01 0.06 0.14 Omega square <0.01 0.01 0.06 0.14
  • 29.
    Parametric tests • Variablefollows Normal distriution • Shapiro- Wilk’s test/ Q-Q plot • P value >alpha level--- Fail to reject Ho (variable follows Normal distribution)
  • 30.
    Non parametric tests •Variable does not follows Normal distribution
  • 31.
    One sample Ttest Ho: Sample average= population average Normality satisfied (p> 0.05) Parametric one sample t- test Normality does not satisfied (p <0.05) Non parametric : Wilcoxon rank test
  • 32.
    T TEST 1 sample Checknormality Satisfied Parametric One sample t Not satisfied Non parametric : Wilcoxon rank 2 independent samples Check normality Not satisfied Non Parametric Mann-Whitney U If normality is satisfied then Check for Homogeneity Not satisfied Non Parametric Welch If both normality and homogeneity satisfied Parametric student’s t test
  • 33.
    References • Research methodology,concepts and cases: Deepak Chawla, Neena Sodhi,First edition,VIKAS PUBLISHING HOUSE PVT. LTD • Statistics for management and economics: Gerald Keller, Gunjan Malhotra, Cengage publishing • https://online.hbs.edu/blog/post/data-collection-methods • https://www.questionpro.com/blog/data-collection-methods/ • https://www.simplilearn.com/types-of-sampling-techniques- article • https://www.mygreatlearning.com/blog/introduction-to- sampling-techniques/ • https://www.analyticsvidhya.com/blog/2019/09/data- scientists-guide-8-types-of-sampling-techniques/
  • 34.
    SEMESTER 5 STRUCTURE OFBUSINESS ANALYTICS Multiple choice questions 1. The method of selecting a small number of items or people to test an assumption or hypotheses is called: a. Statistics b. Sampling c. dipstick survey d. Probability theory e. a & b f. All of the above 2. A survey question about marital status , to be answered as married or unmarried is an example of a(n): a. Dichotomous variable b. Unknown variable c. Dependent variable d. Continuous variable 3. A survey question about liking the new pizza at Pizza Hut on a five-point scale ranging from ‘like a lot’ to ‘dislike a lot’ is an example of a(n): a. Dichotomous variable b. Unknown variable c. Dependent variable d. Continuous variable 4. In a typical research problem the is expected to influence the . a. Predictor variable; primary variable b. Independent variable; dependent variable c. Dependent variable; independent variable d. Criterion; hypothesis 5. If one is studying the impact of variable pay component on job satisfaction, then job satisfaction is a. Independent variable b. Intervening variable c. Dependent variable d. Unknown variable 6. _____ are statements/assumptions made -about the likely outcomes of the problem-which may or may not be true.
  • 35.
    a. Hypotheses b. Researchquestions c. Marketing research problems d. Analytical models e. None of the above 7. A researcher wants to study whether a two-wheeler buyer would buy an electric car. The unit of analysis in this case would be the a. Electric car dealer b. Two-wheeler dealer c. Two-wheeler owner d. current electric car owners 8. In comparison to primary data, secondary data can be collected a. Rapidly and easily b. At a relatively low cost c. In a short time d. With less effort e. All of the above 9. Census of India is a a. Syndicate data source b. Internal data source c. Government data source d. Non-government data source e. None of the above 10. In which of the following scales can all possible statistical techniques be applied? a. Nominal b. Ordinal c. Ratio d. Interval 11. In which of the following scales the objects are arranged according to their magnitude in an ordered relationship? a. Nominal scale b. Ordinal scale c. Interval scale
  • 36.
    d. Ratio scale 12.Which of the following scales possess an absolute zero? a. Nominal scale b. Ordinal scale c. Interval scale d. Ratio scale e. None of the above 13. In which of the following interviewer bias is very high and thus a problem? a. E-mail questionnaire b. Telephone interview c. Mail questionnaire d. Web-based questionnaire e. None of the above 14. Which of the following is not a probability sampling plan? a. Systematic sampling b. Cluster sampling c. Convenience sampling d. Stratified sampling 15. Selecting every fifth male entering the mall is an example of a. Quota sampling b. Cluster sampling c. Systematic sampling d. Simple random sampling 16. In simple random sampling design each element of the population has the following chance of being selected in the sample. a. Equal b. Unequal c. Known d. Equal and known e. Unequal and known 17. Which of the following sampling methods could be used to make an estimate of the sampling error? a. Convenience sampling b. Probability sampling c. Quota sampling
  • 37.
    d. Snow-ball sampling e.Judgment sampling 18. Which of the following statements is true? a. Samples are less expensive. b. Non-sampling error reduces with increase in sample size. c. Simple random sampling is more efficient than stratified sampling. d. All of the above are true. 19. In which of the probability sampling design, the first element is chosen at random and the remaining elements are picked up by adding the sampling interval to it successively? a. Cluster sampling b. Stratified sampling c. Systematic sampling d. Simple random sampling 20. Requesting people to volunteer to test products is an example of a. Quota sampling b. Judgmental sampling c. Random sampling d. Convenience sampling 21. A rectangular arrangement of data into rows and columns is called- a. A file b. A record c. A data matrix d. A test tabulation 22. The usual ways to code a dichotomous question is a. 0 and 1 b. 1 to 5 c. 0, 1 and 2 d. None of the above 23. In case the researcher has asked the respondent to rank 10 brands then the number of columns needed would be a. 1 b. As many as the respondent has ranked c. 10 d. Is the researcher’s discretion
  • 38.
    24. In caseof a rating question like – how satisfied are you with your mobile service provider? Use a 10 point scale –with 1=very satisfied and 10=very dissatisfied. The researcher would need--------- ---columns. a. 1 b. As many as the respondent has rated c. 10 d. Is the researcher’s discretion 25. For which type of measurement, median cannot be computed. a. Nominal b. Ordinal c. Interval d. Ratio 26. For which type of measurement, mode can be computed. a. Nominal b. Ordinal c. Interval d. Ratio 27. When a respondent assigns an order of preference using values as 1, 2, 3 and so on, he is using a. Nominal values b. Ordinal values c. Interval values d. Ratio values 28. The median can be computed from a. Ordinal, interval and nominal data b. Ratio, ordinal and nominal data c. Ratio, interval and ordinal data d. Ratio, interval and nominal data 29. The probability of rejecting a null hypothesis when it is true is called a Level of significance b Type II error c Type I error d Beta 30. Testing hypotheses concerning population parameters using sample data is called
  • 39.
    a Exploratory research bDescriptive research c Descriptive analysis d Inferential analysis 31. When we accept the null hypothesis when it is false we, are committing a type 1 error b type 2 error c neither type 1 nor type 2 error d none of the above is true 32. The alternative hypothesis is “that more than 80% of the students know driving” is an example of a One-tailed test b Two-tailed test c Type 1 error d Type 2 error 33. What is a type 1 error? a Reject 𝑯𝟎 when it is true. b Accept 𝐻 when it is false. c Reject 𝐻 when it is false. d All of the above are true. 34. Which of the following statistical procedure is most appropriate when comparing the difference in means of more than three groups? a. t test b. z test c ANOVA d None of the above 35. Parametric tests are applied when_______________ a. variable does not follow Normal distribution b. it is uncertain c variable follows Normal distribution d None of the above 36. Some of the Parametric tests are _______________ a. Mann- Whitney U test
  • 40.
    b. Weltch test cWilcoxon Rank test d All the above 37. If in single sample testing process, the variable does not follow Normal distribution then _______________ test should be applied. a. Mann- Whitney U test b. Weltch test c Wilcoxon Rank test d student’s t test 38. If in single sample testing process, the variable follows Normal distribution then _______________ test should be applied. a. Mann- Whitney U test b. Weltch test c Wilcoxon Rank test d student’s t test 39. If in two independent sample testing process, the variable does not follow Normal distribution then _______________ test should be applied. a. Mann- Whitney U test b. Weltch test c Wilcoxon Rank test d All the above 40. If in two independent sample testing process, the variable follows Normal distribution but homogeneity criterion is not satisfied then _______________ test should be applied. a. Mann- Whitney U test b. Weltch test c Wilcoxon Rank test d All the above 41. If in two independent sample testing process, the variable follows Normal distribution and homogeneity criterion is also satisfied then _______________ test should be applied.
  • 41.
    a. Mann- WhitneyU test b. Weltch test c Wilcoxon Rank test d Student’s t test 42. For the next 4 questions, read the following table: TABLE Consumption of ice cream and household income Low Consumption of Ice cream High Consumption of Ice cream Total Low Income 30 10 40 Middle Income 20 20 40 High Income 12 28 40 Total 62 58 120 1. The above table is an example of a. Cross-tabulation b. One way tabulation c. Four way classification d. None of the above 2. What percentage of household have less consumption of Ice cream? a. 50 b 51.67 c 54 d 49.38 3. How many households are there with middle income? a 30 b 28 c 40 d None of the above 4. How many household with middle income have high consumption of Ice cream? a 20 b 30 c 28 d 12