Download to read offline


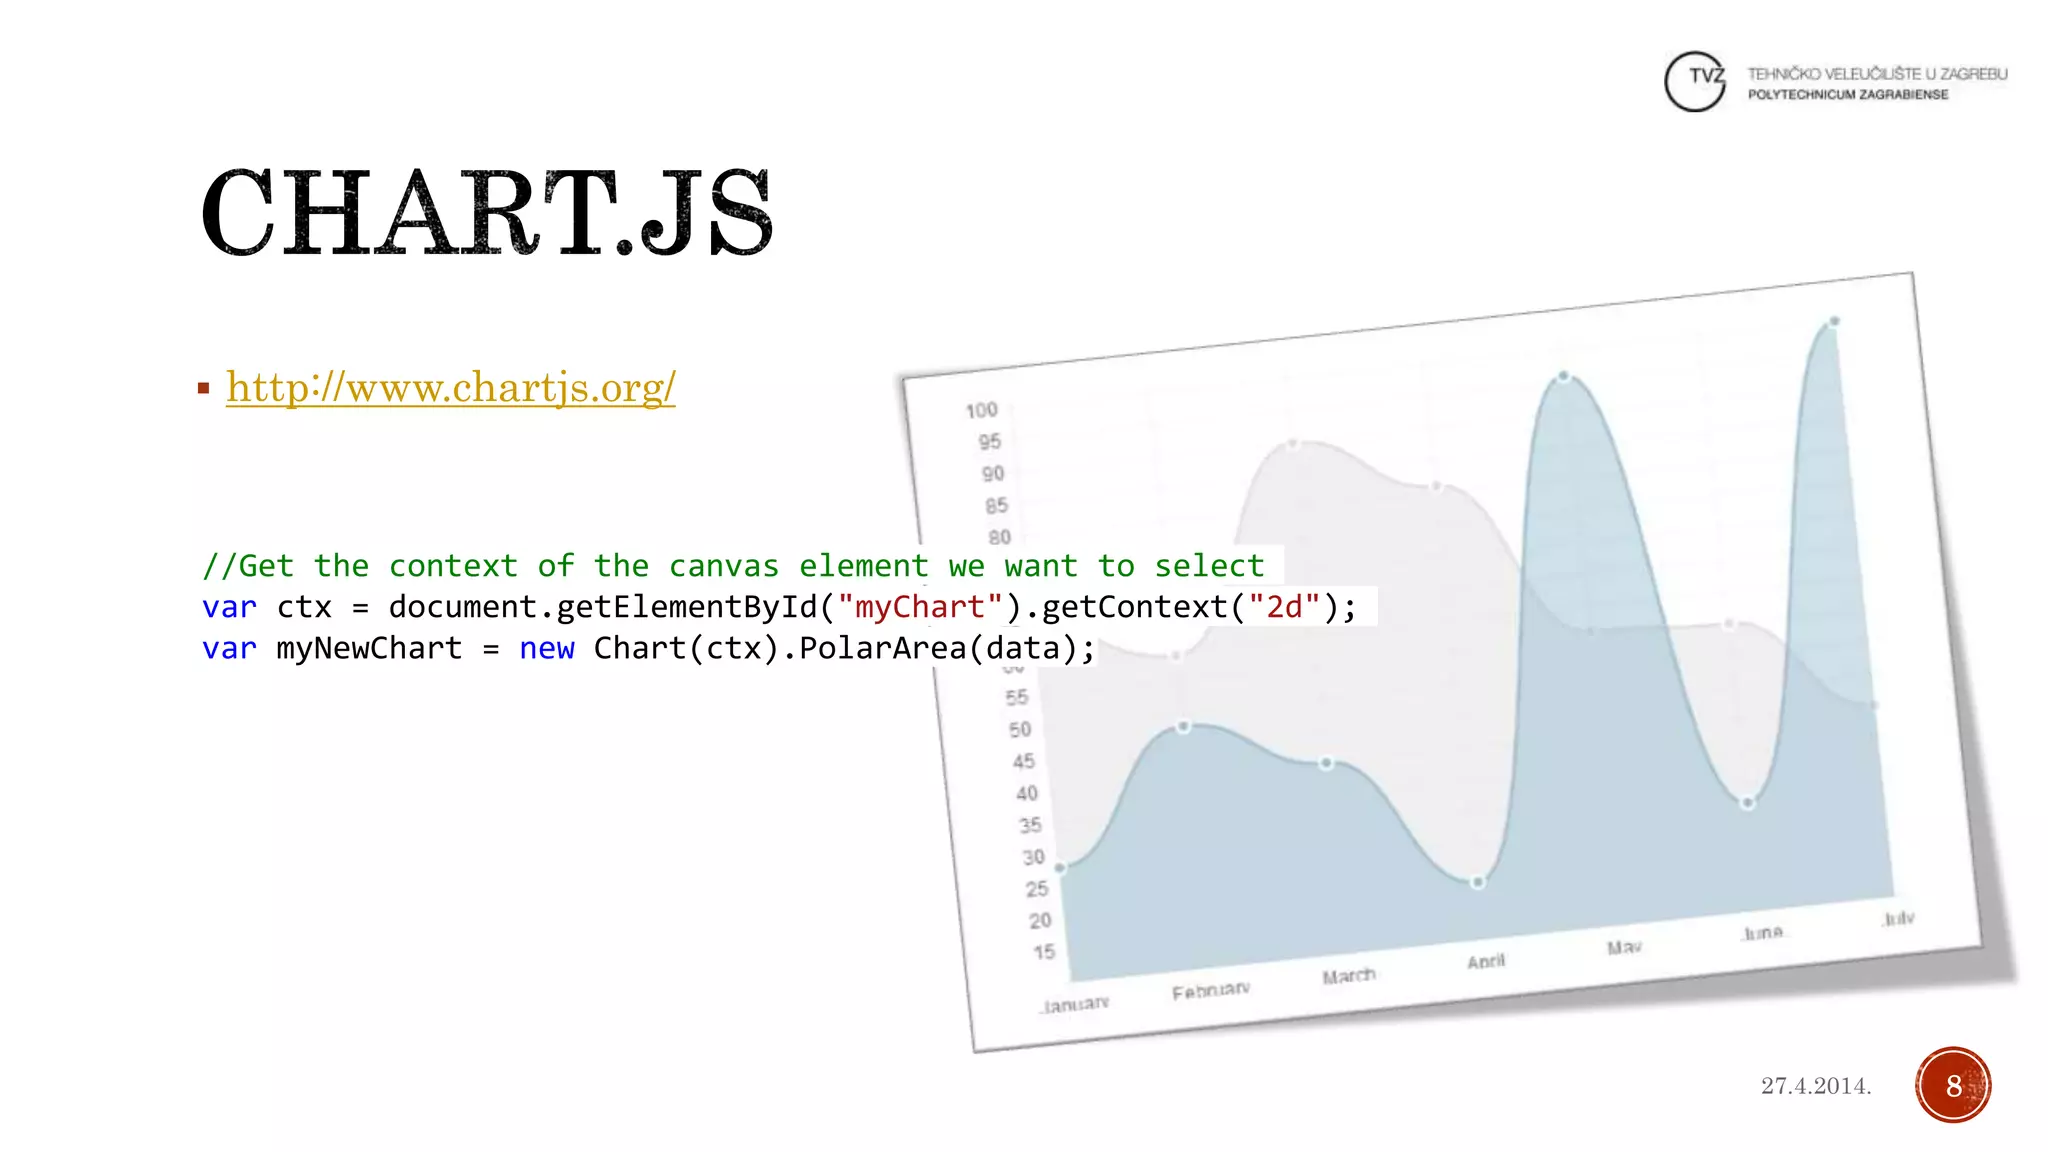
![var data = {
labels: ["January", "February", "March", "April", "May", "June", "July"],
datasets: [
{
fillColor: "rgba(220,220,220,0.5)",
strokeColor: "rgba(220,220,220,1)", pointColor: "rgba(220,220,220,1)",
pointStrokeColor: "#fff",
data: [65, 59, 90, 81, 56, 55, 40]
},
{
fillColor: "rgba(151,187,205,0.5)",
strokeColor: "rgba(151,187,205,1)", pointColor: "rgba(151,187,205,1)",
pointStrokeColor: "#fff",
data: [28, 48, 40, 19, 96, 27, 100]
}
]
}
927.4.2014.](https://image.slidesharecdn.com/canvascharts-140604024449-phpapp01/85/Canvas-Charts-9-320.jpg)
![function CreatePieChart(c, data) {
//dohvat objekata
var ctx = c.getContext("2d");
var lastend = 0; //zadnja vrijednost
var myTotal = 0; //ukupna vrijednost podataka
var data = [200, 60, 15, 90]; //dodavanje vrijdnosti
var myColor = ['red', 'green', 'blue', 'gray']; //uz vrijednosti, ide i boja
//čistimo radnu površinu
ctx.clearRect(0, 0, c.width, c.height);
for (var e = 0; e < data.length; e++) {
myTotal += data[e]; //zbrajamo ukupnu vrijednost
}
for (var i = 0; i < data.length; i++) {
ctx.fillStyle = myColor[i]; //uzimamo boju
ctx.beginPath(); //početak crtanja
ctx.moveTo(c.width / 2, c.height / 2); //pozicioniramo se na početak
ctx.arc(c.width / 2, c.height / 2, c.height / 2, lastend, lastend + (2 * Math.PI * (data[i] / myTotal)), false);
ctx.lineTo(c.width / 2, c.height / 2); //crtamo liniju prema centru
ctx.fill(); //punimo se bojom
lastend += Math.PI * 2 * (data[i] / myTotal); //pamtimo zadnju poziciju
}
}
1127.4.2014.](https://image.slidesharecdn.com/canvascharts-140604024449-phpapp01/85/Canvas-Charts-11-320.jpg)


![var data = {
labels: ["January", "February", "March", "April", "May", "June", "July"],
datasets: [
{
fillColor: "rgba(220,220,220,0.5)",
strokeColor: "rgba(220,220,220,1)", pointColor: "rgba(220,220,220,1)",
pointStrokeColor: "#fff",
data: [65, 59, 90, 81, 56, 55, 40]
},
{
fillColor: "rgba(151,187,205,0.5)",
strokeColor: "rgba(151,187,205,1)", pointColor: "rgba(151,187,205,1)",
pointStrokeColor: "#fff",
data: [28, 48, 40, 19, 96, 27, 100]
}
]
}
927.4.2014.](https://image.slidesharecdn.com/canvascharts-140604024449-phpapp01/75/Canvas-Charts-9-2048.jpg)

![function CreatePieChart(c, data) {
//dohvat objekata
var ctx = c.getContext("2d");
var lastend = 0; //zadnja vrijednost
var myTotal = 0; //ukupna vrijednost podataka
var data = [200, 60, 15, 90]; //dodavanje vrijdnosti
var myColor = ['red', 'green', 'blue', 'gray']; //uz vrijednosti, ide i boja
//čistimo radnu površinu
ctx.clearRect(0, 0, c.width, c.height);
for (var e = 0; e < data.length; e++) {
myTotal += data[e]; //zbrajamo ukupnu vrijednost
}
for (var i = 0; i < data.length; i++) {
ctx.fillStyle = myColor[i]; //uzimamo boju
ctx.beginPath(); //početak crtanja
ctx.moveTo(c.width / 2, c.height / 2); //pozicioniramo se na početak
ctx.arc(c.width / 2, c.height / 2, c.height / 2, lastend, lastend + (2 * Math.PI * (data[i] / myTotal)), false);
ctx.lineTo(c.width / 2, c.height / 2); //crtamo liniju prema centru
ctx.fill(); //punimo se bojom
lastend += Math.PI * 2 * (data[i] / myTotal); //pamtimo zadnju poziciju
}
}
1127.4.2014.](https://image.slidesharecdn.com/canvascharts-140604024449-phpapp01/75/Canvas-Charts-11-2048.jpg)

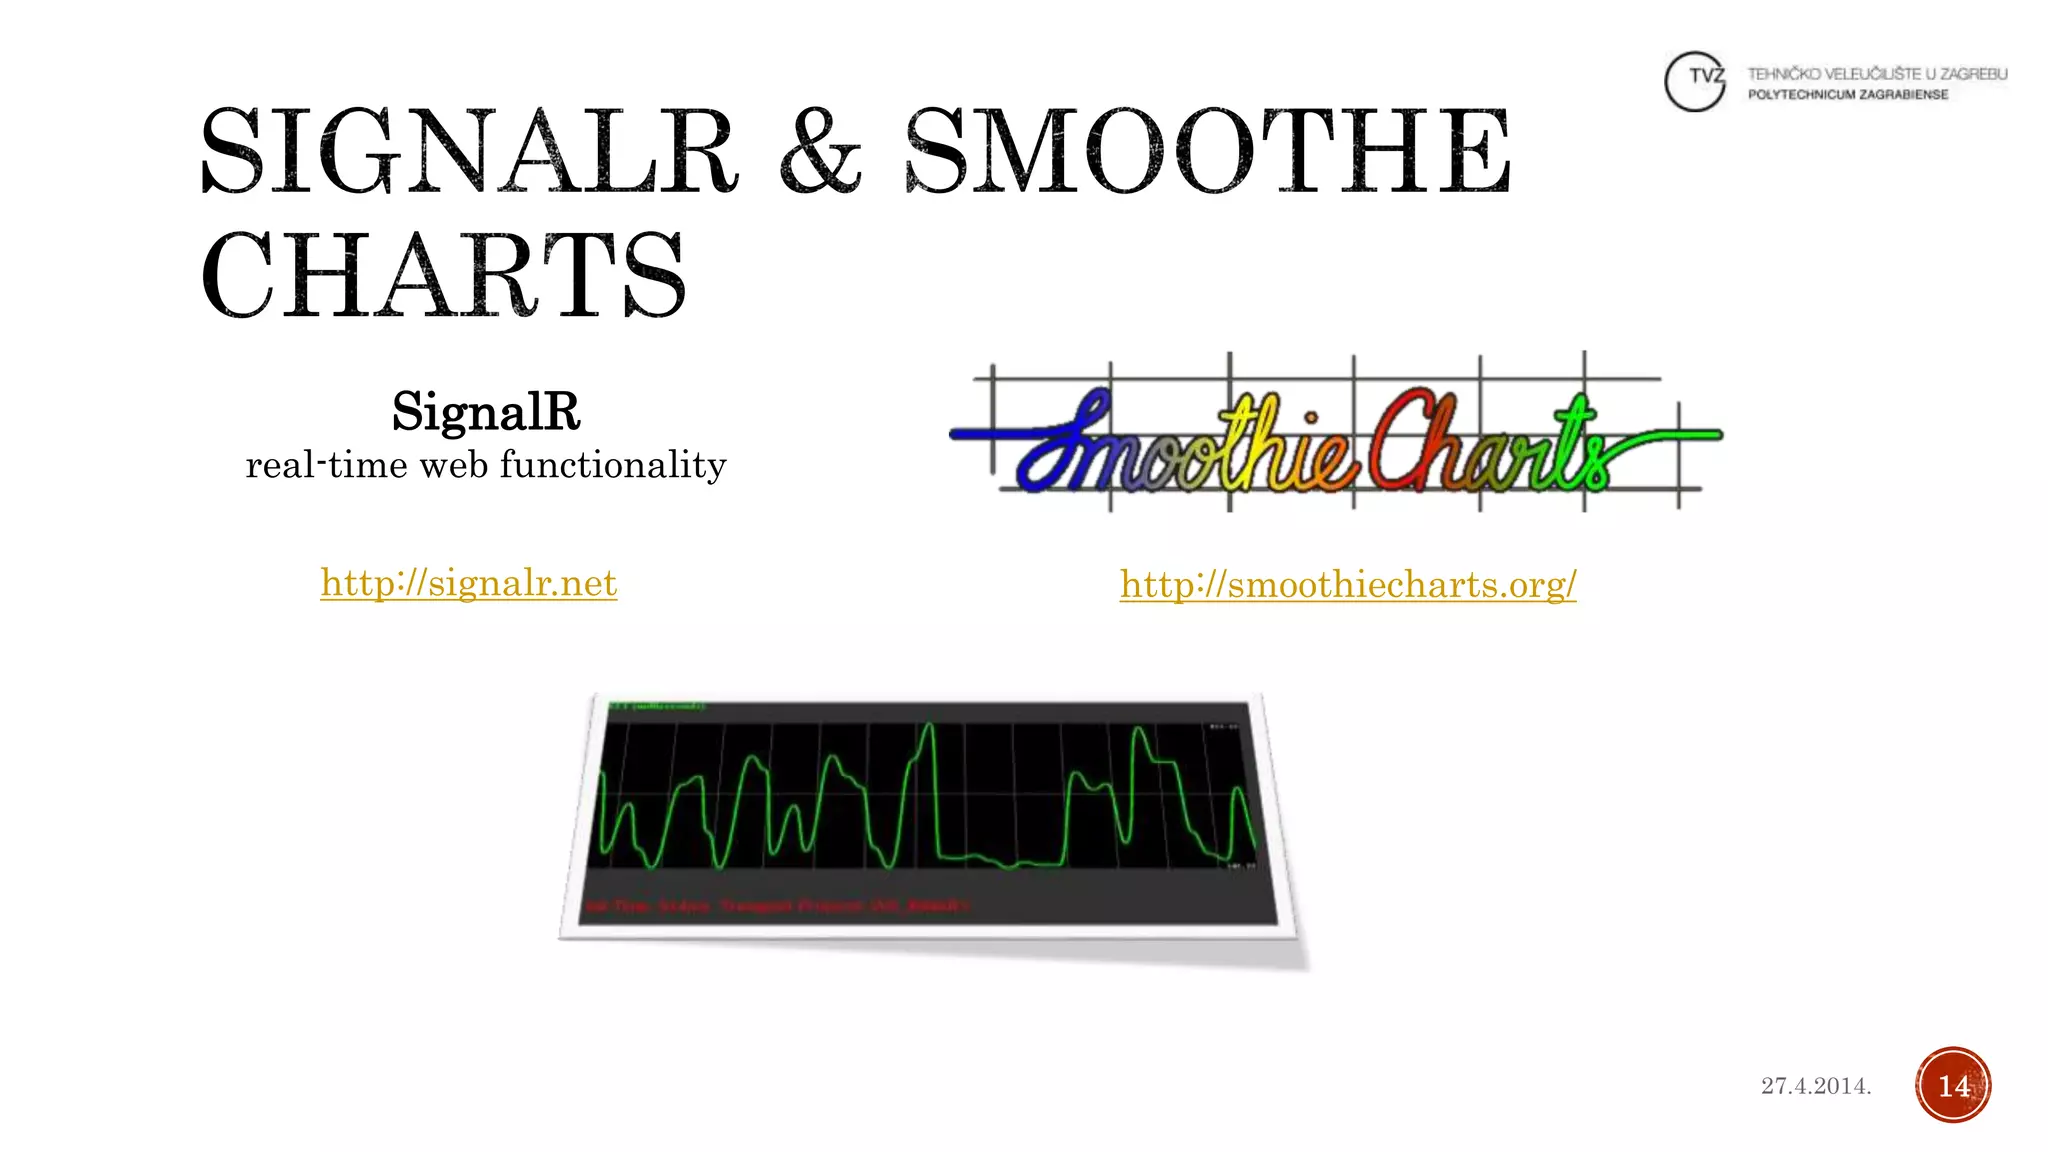


The document discusses HTML5's canvas element, illustrating its capabilities for dynamic rendering of 2D shapes, animations, and interactivity in web applications. It includes code examples for drawing and creating charts, emphasizing canvas's usability in various applications and the potential of real-time web functionality. The text also highlights external resources and tools for further exploration of HTML5 canvas features.


