Download to read offline


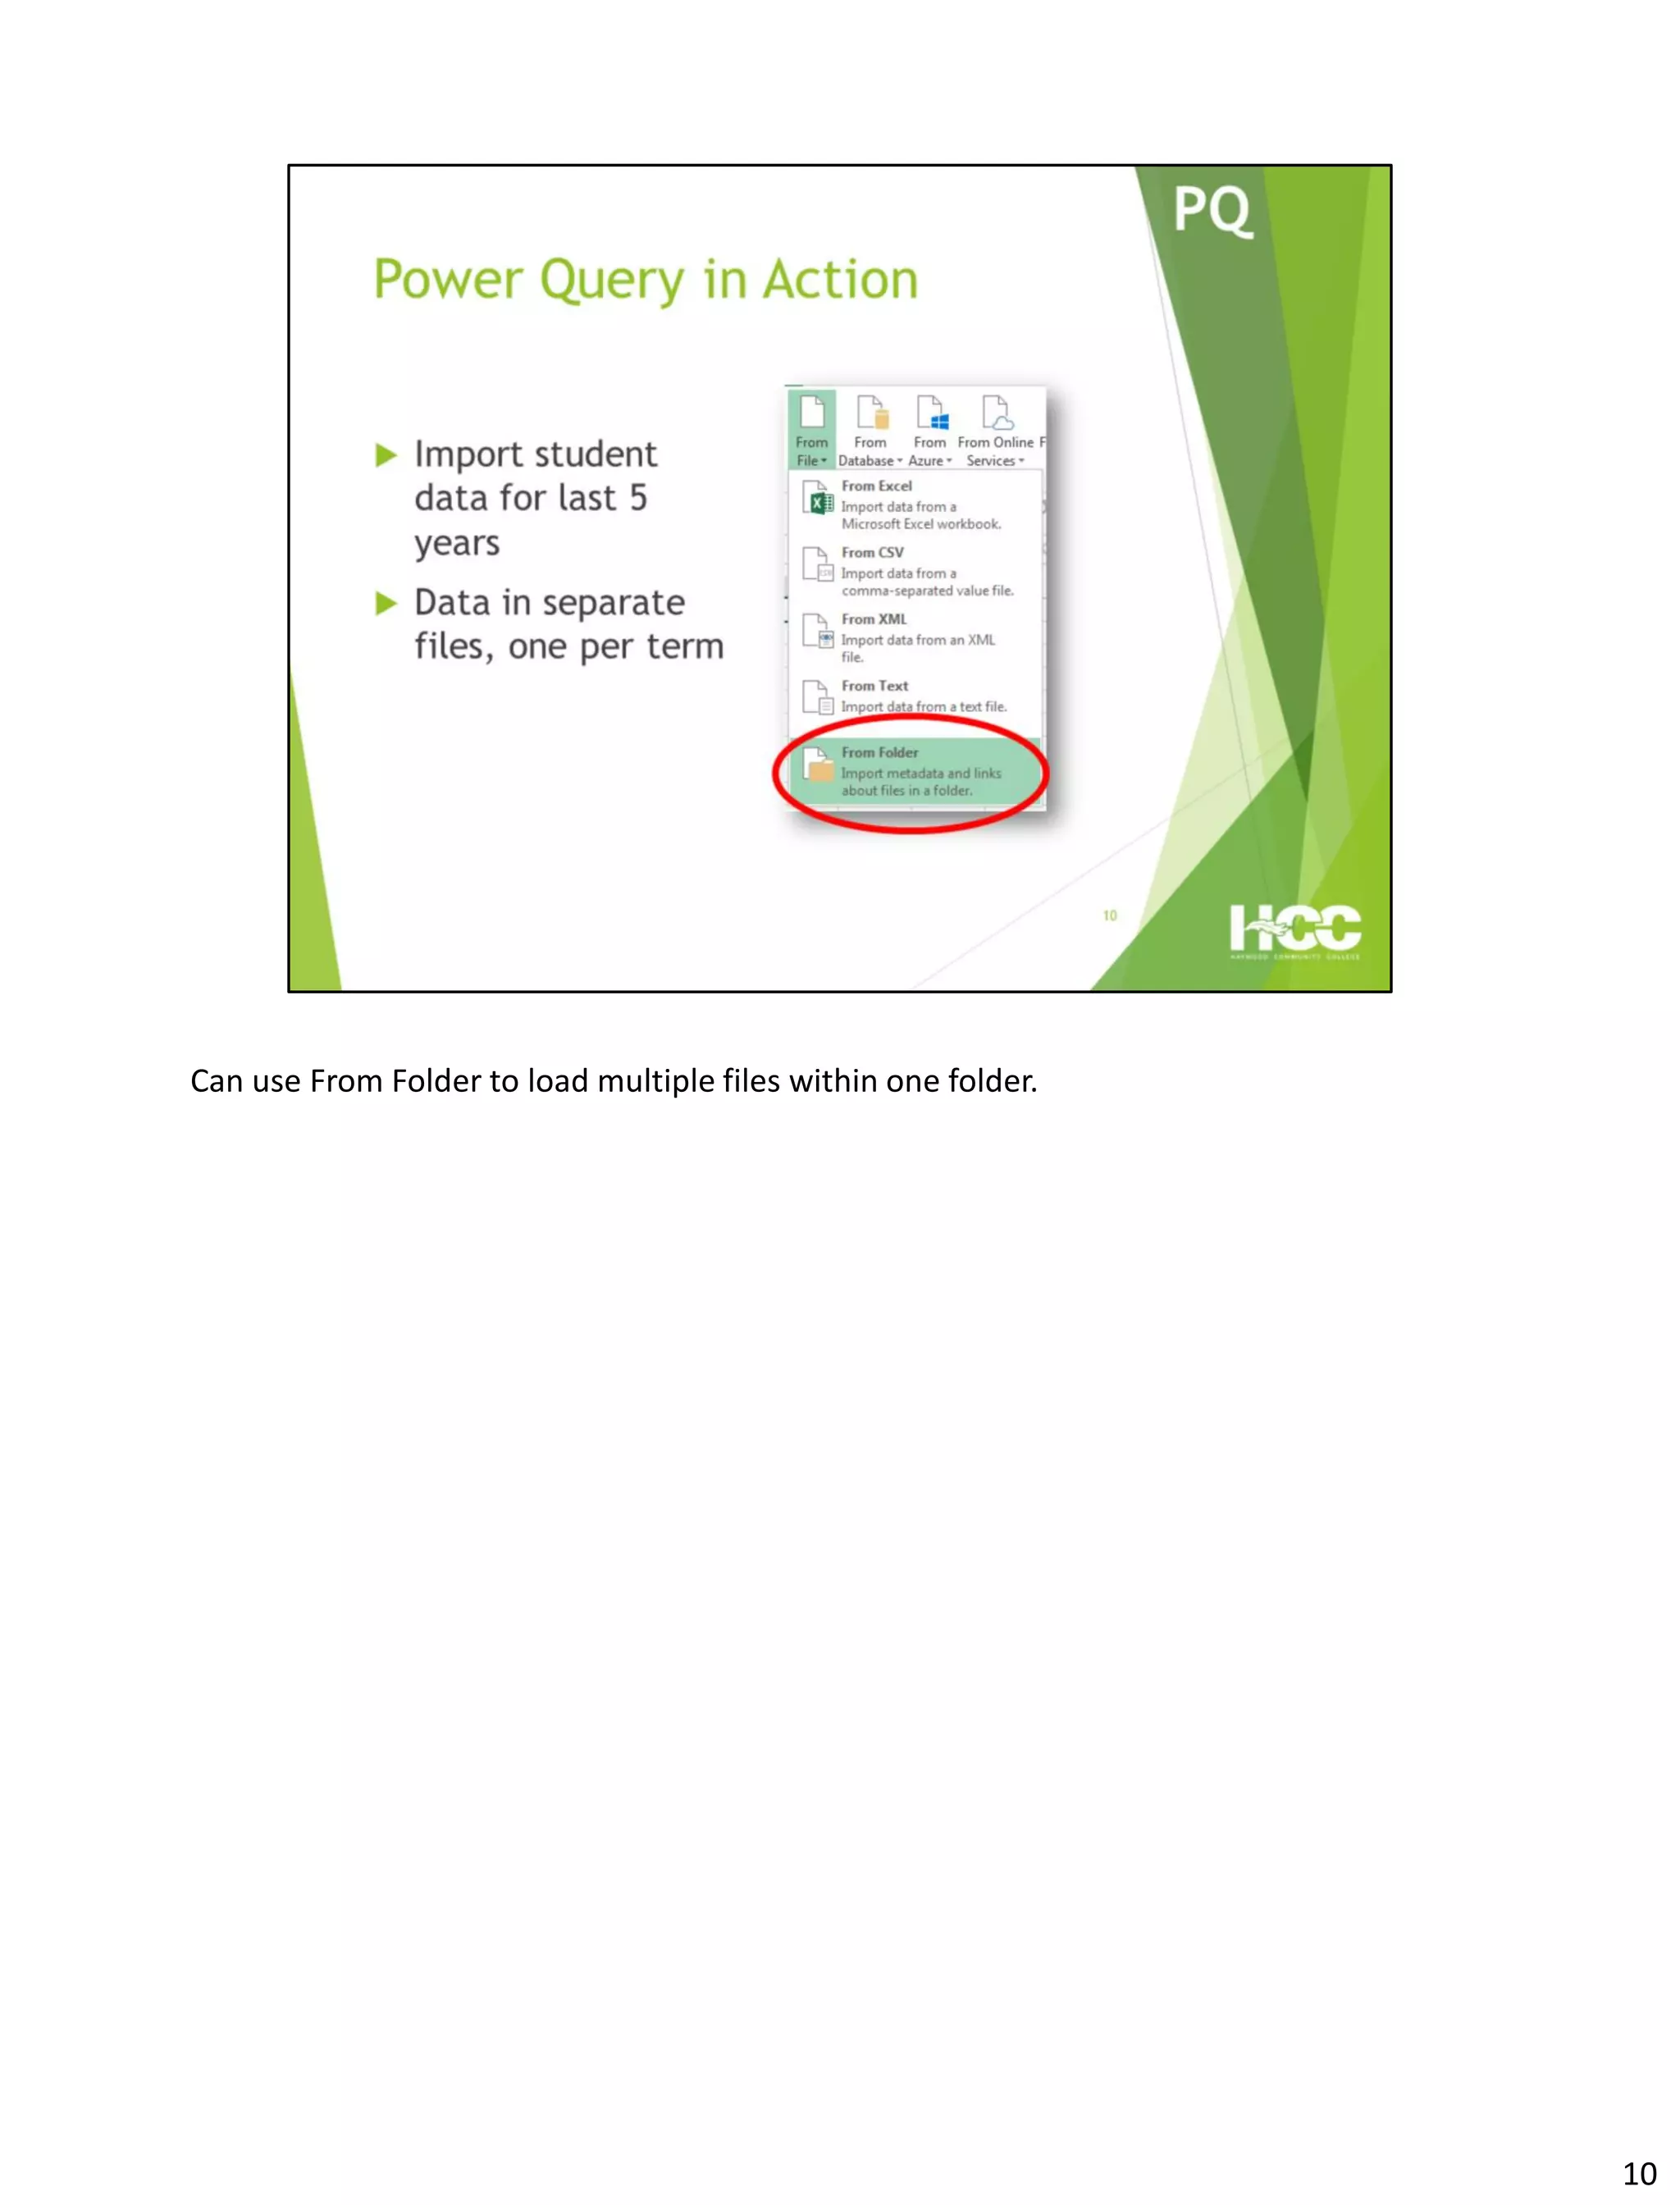
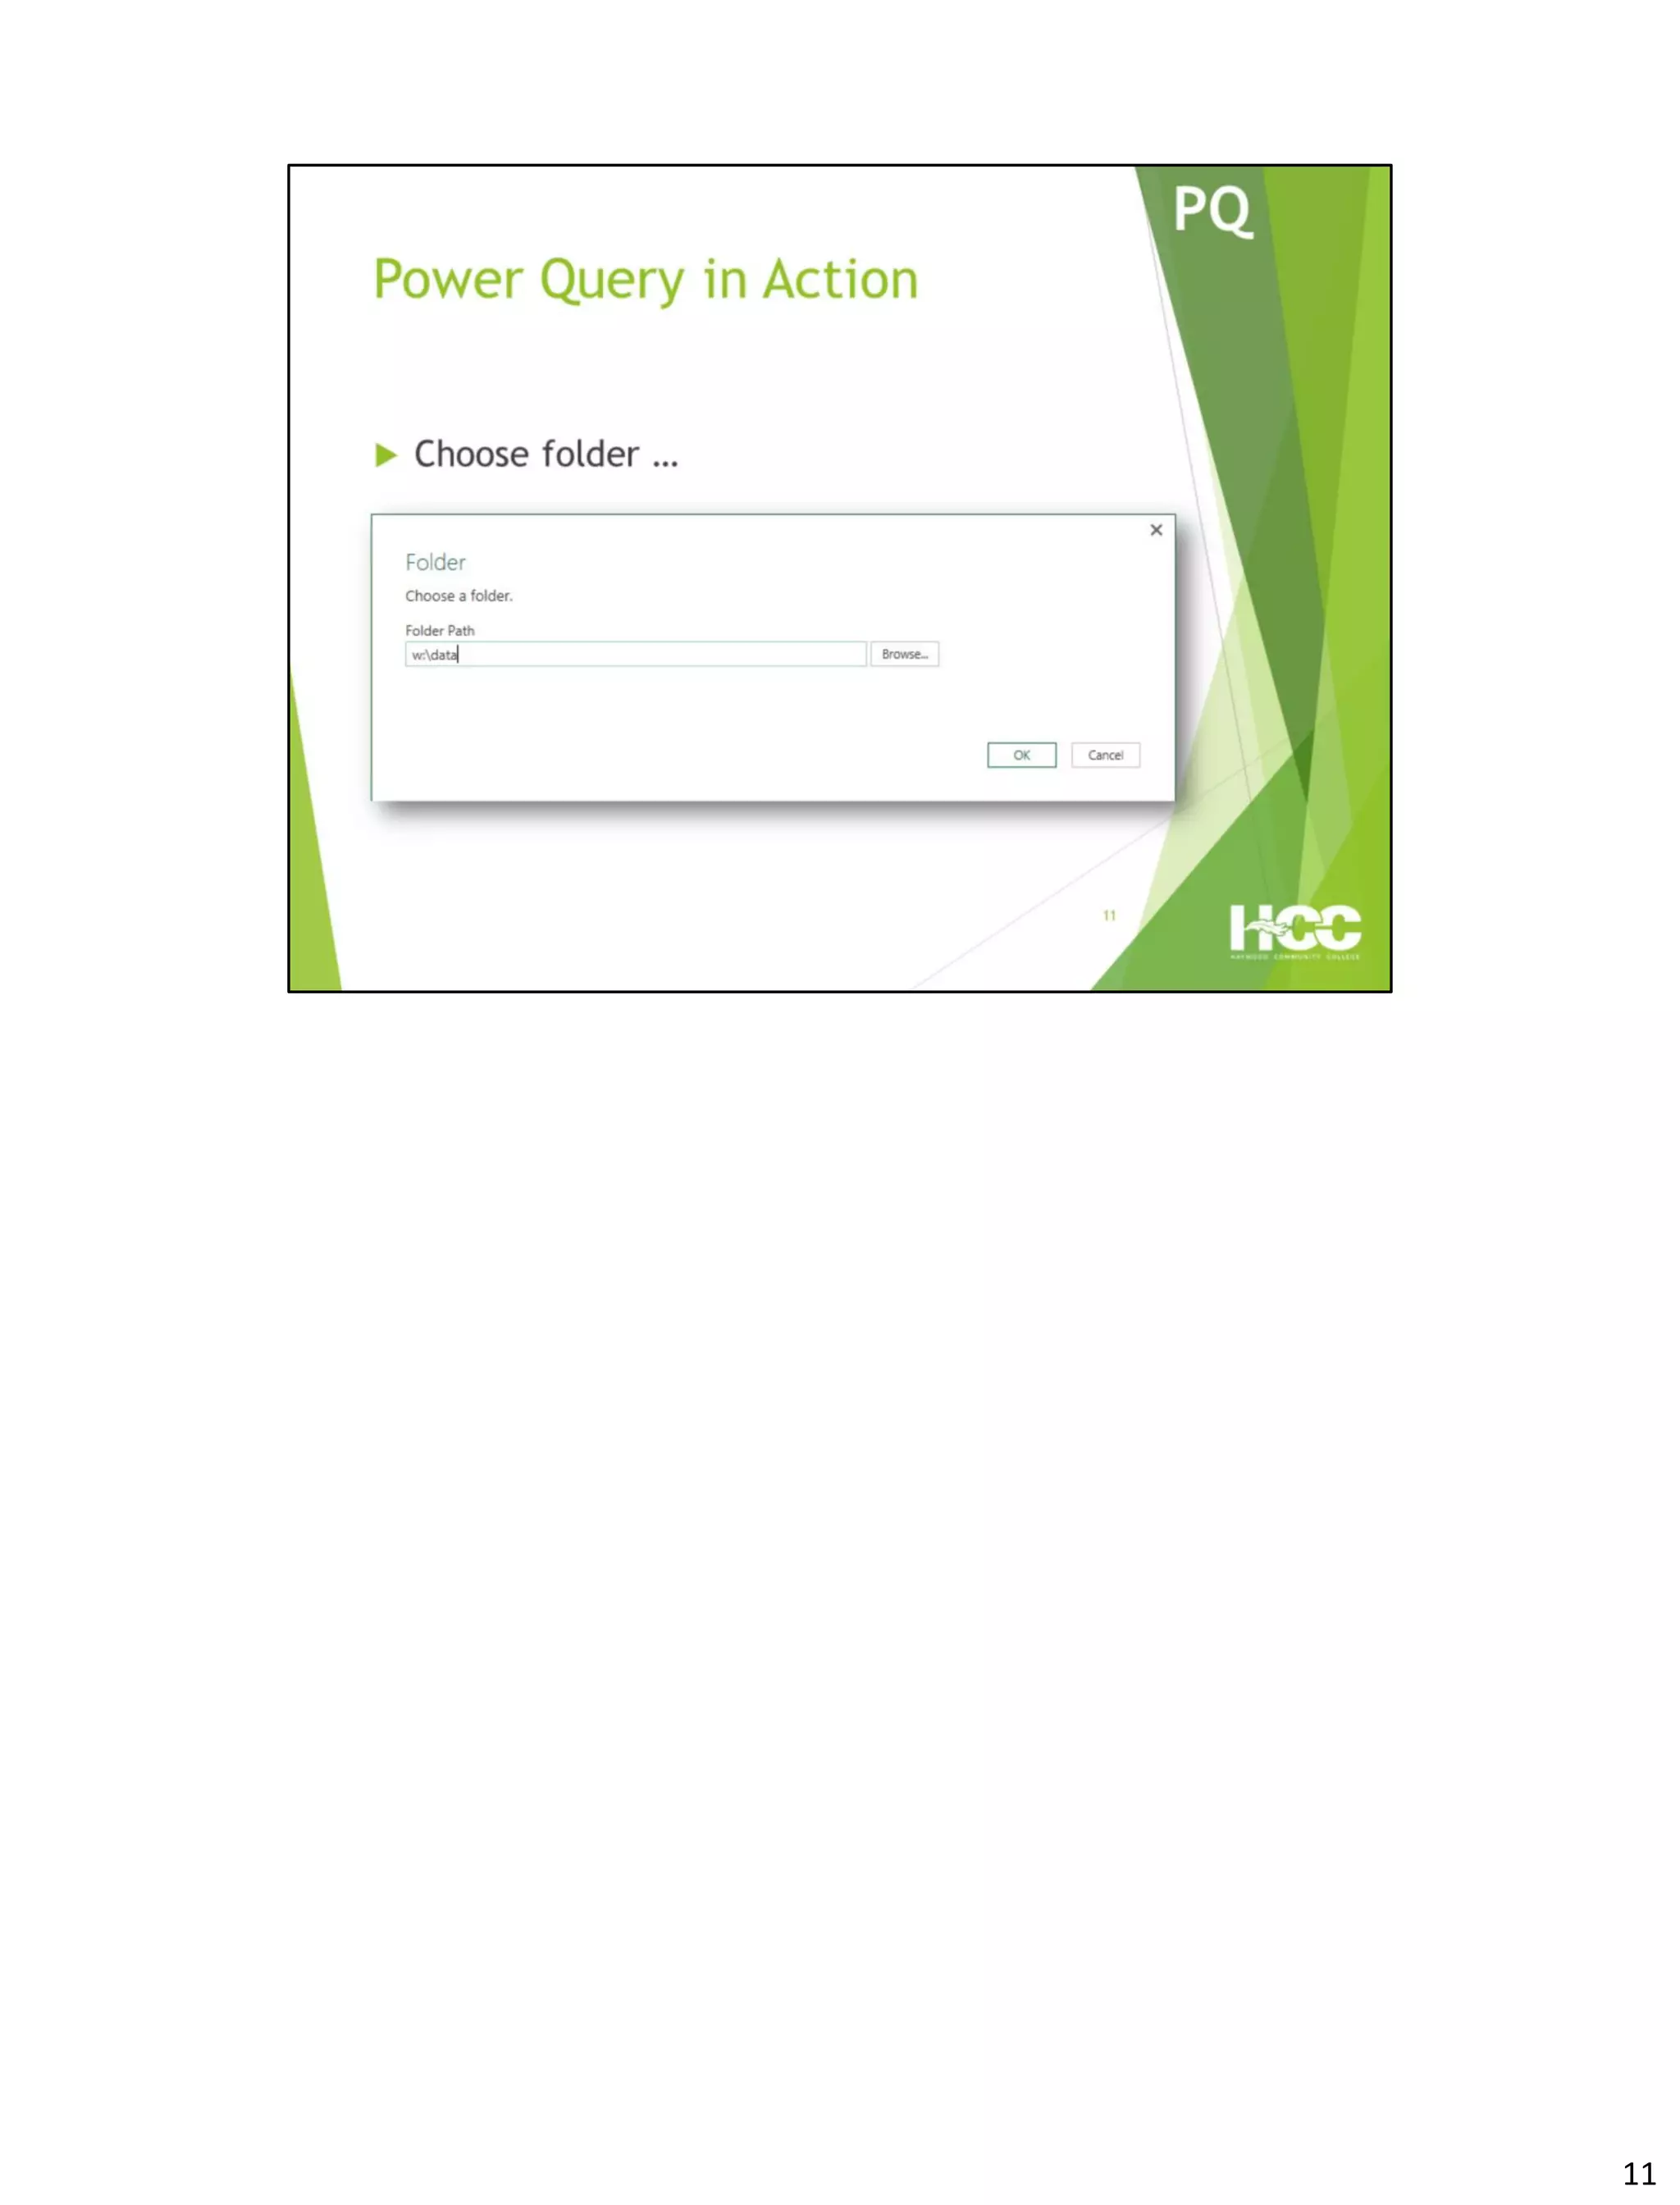
![Can import standard files as well as unformatted text files and folders (See Excelerator BI
blog post “Find Duplicate Files on Your PC with Power BI”
[http://exceleratorbi.com.au/find-duplicate-files-pc-power-bi/]) .
7](https://image.slidesharecdn.com/09cc02ac-247e-44b7-a0d1-d97796966b40-161102124738/85/CCPRO-2016-Power-Presentation-7-320.jpg)


![Can import standard files as well as unformatted text files and folders (See Excelerator BI
blog post “Find Duplicate Files on Your PC with Power BI”
[http://exceleratorbi.com.au/find-duplicate-files-pc-power-bi/]) .
7](https://image.slidesharecdn.com/09cc02ac-247e-44b7-a0d1-d97796966b40-161102124738/75/CCPRO-2016-Power-Presentation-7-2048.jpg)


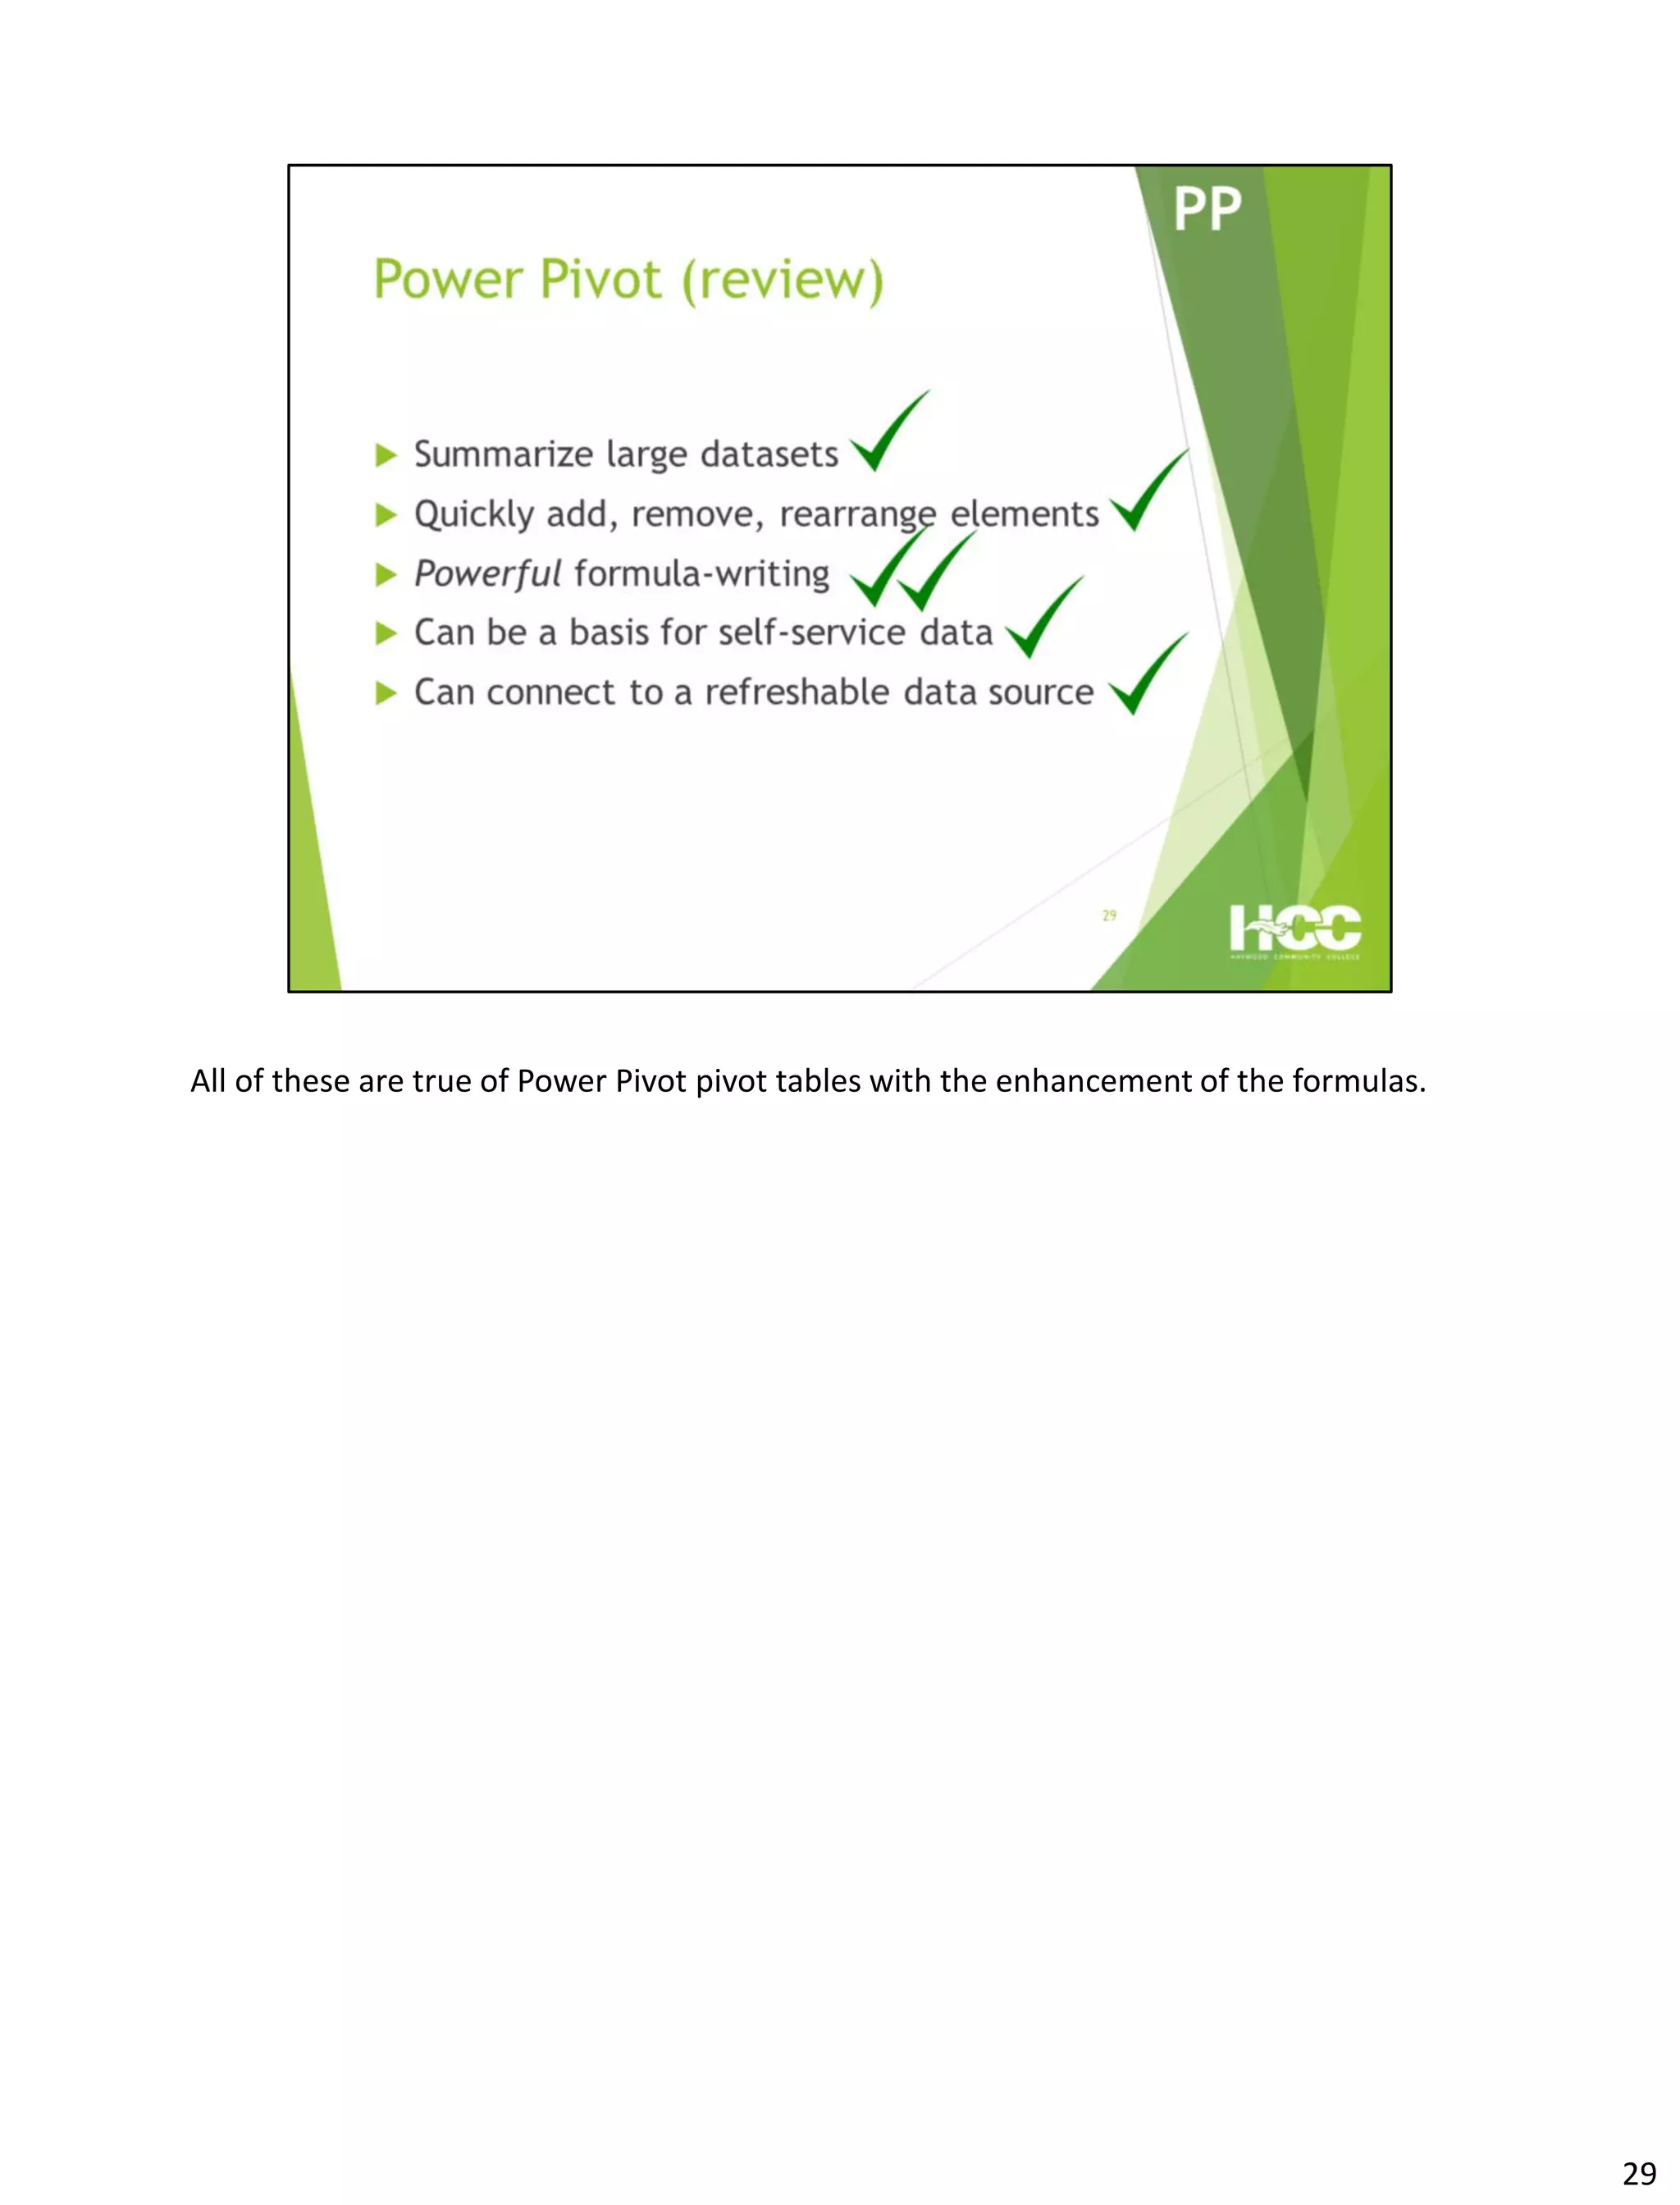


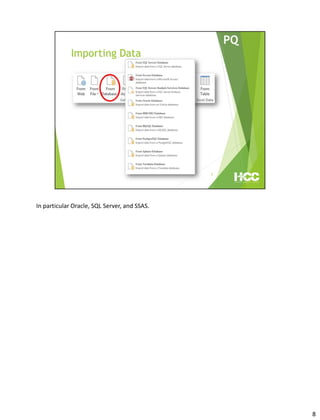
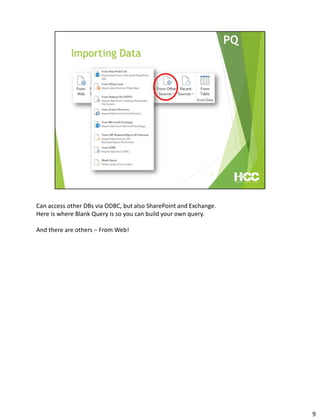
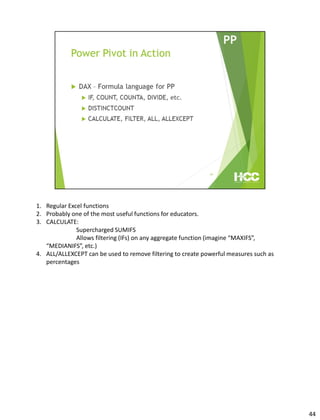
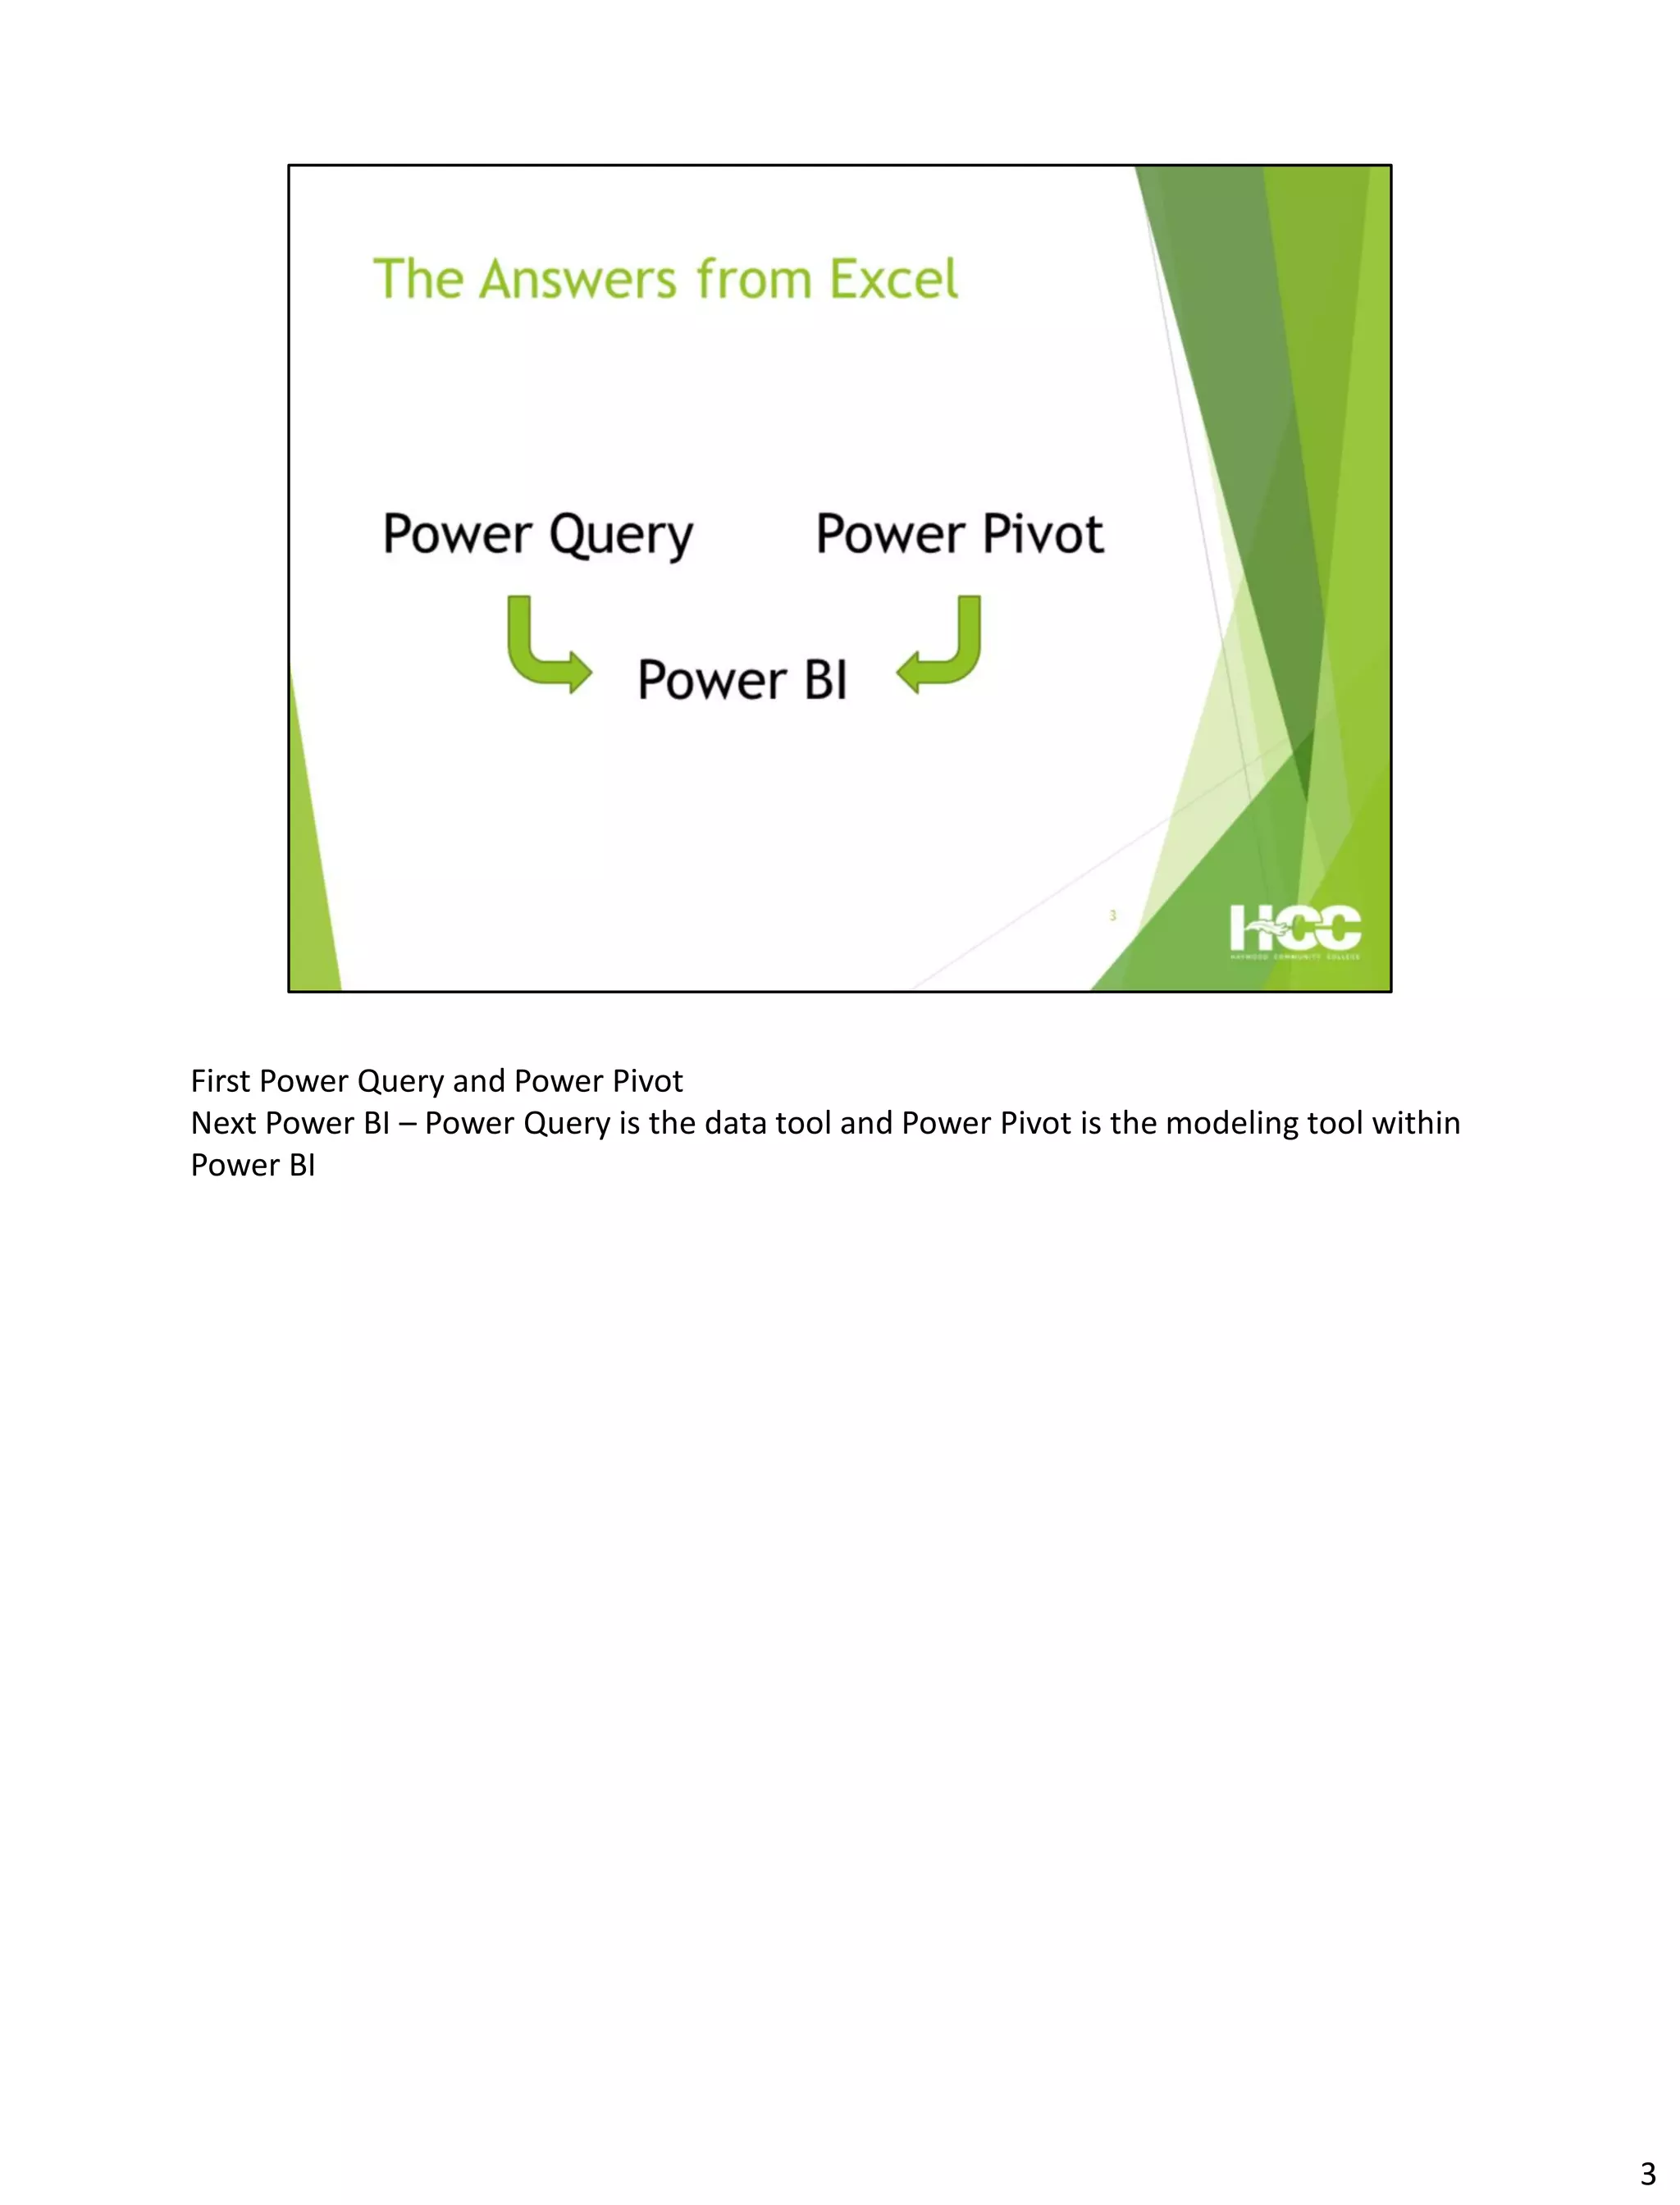
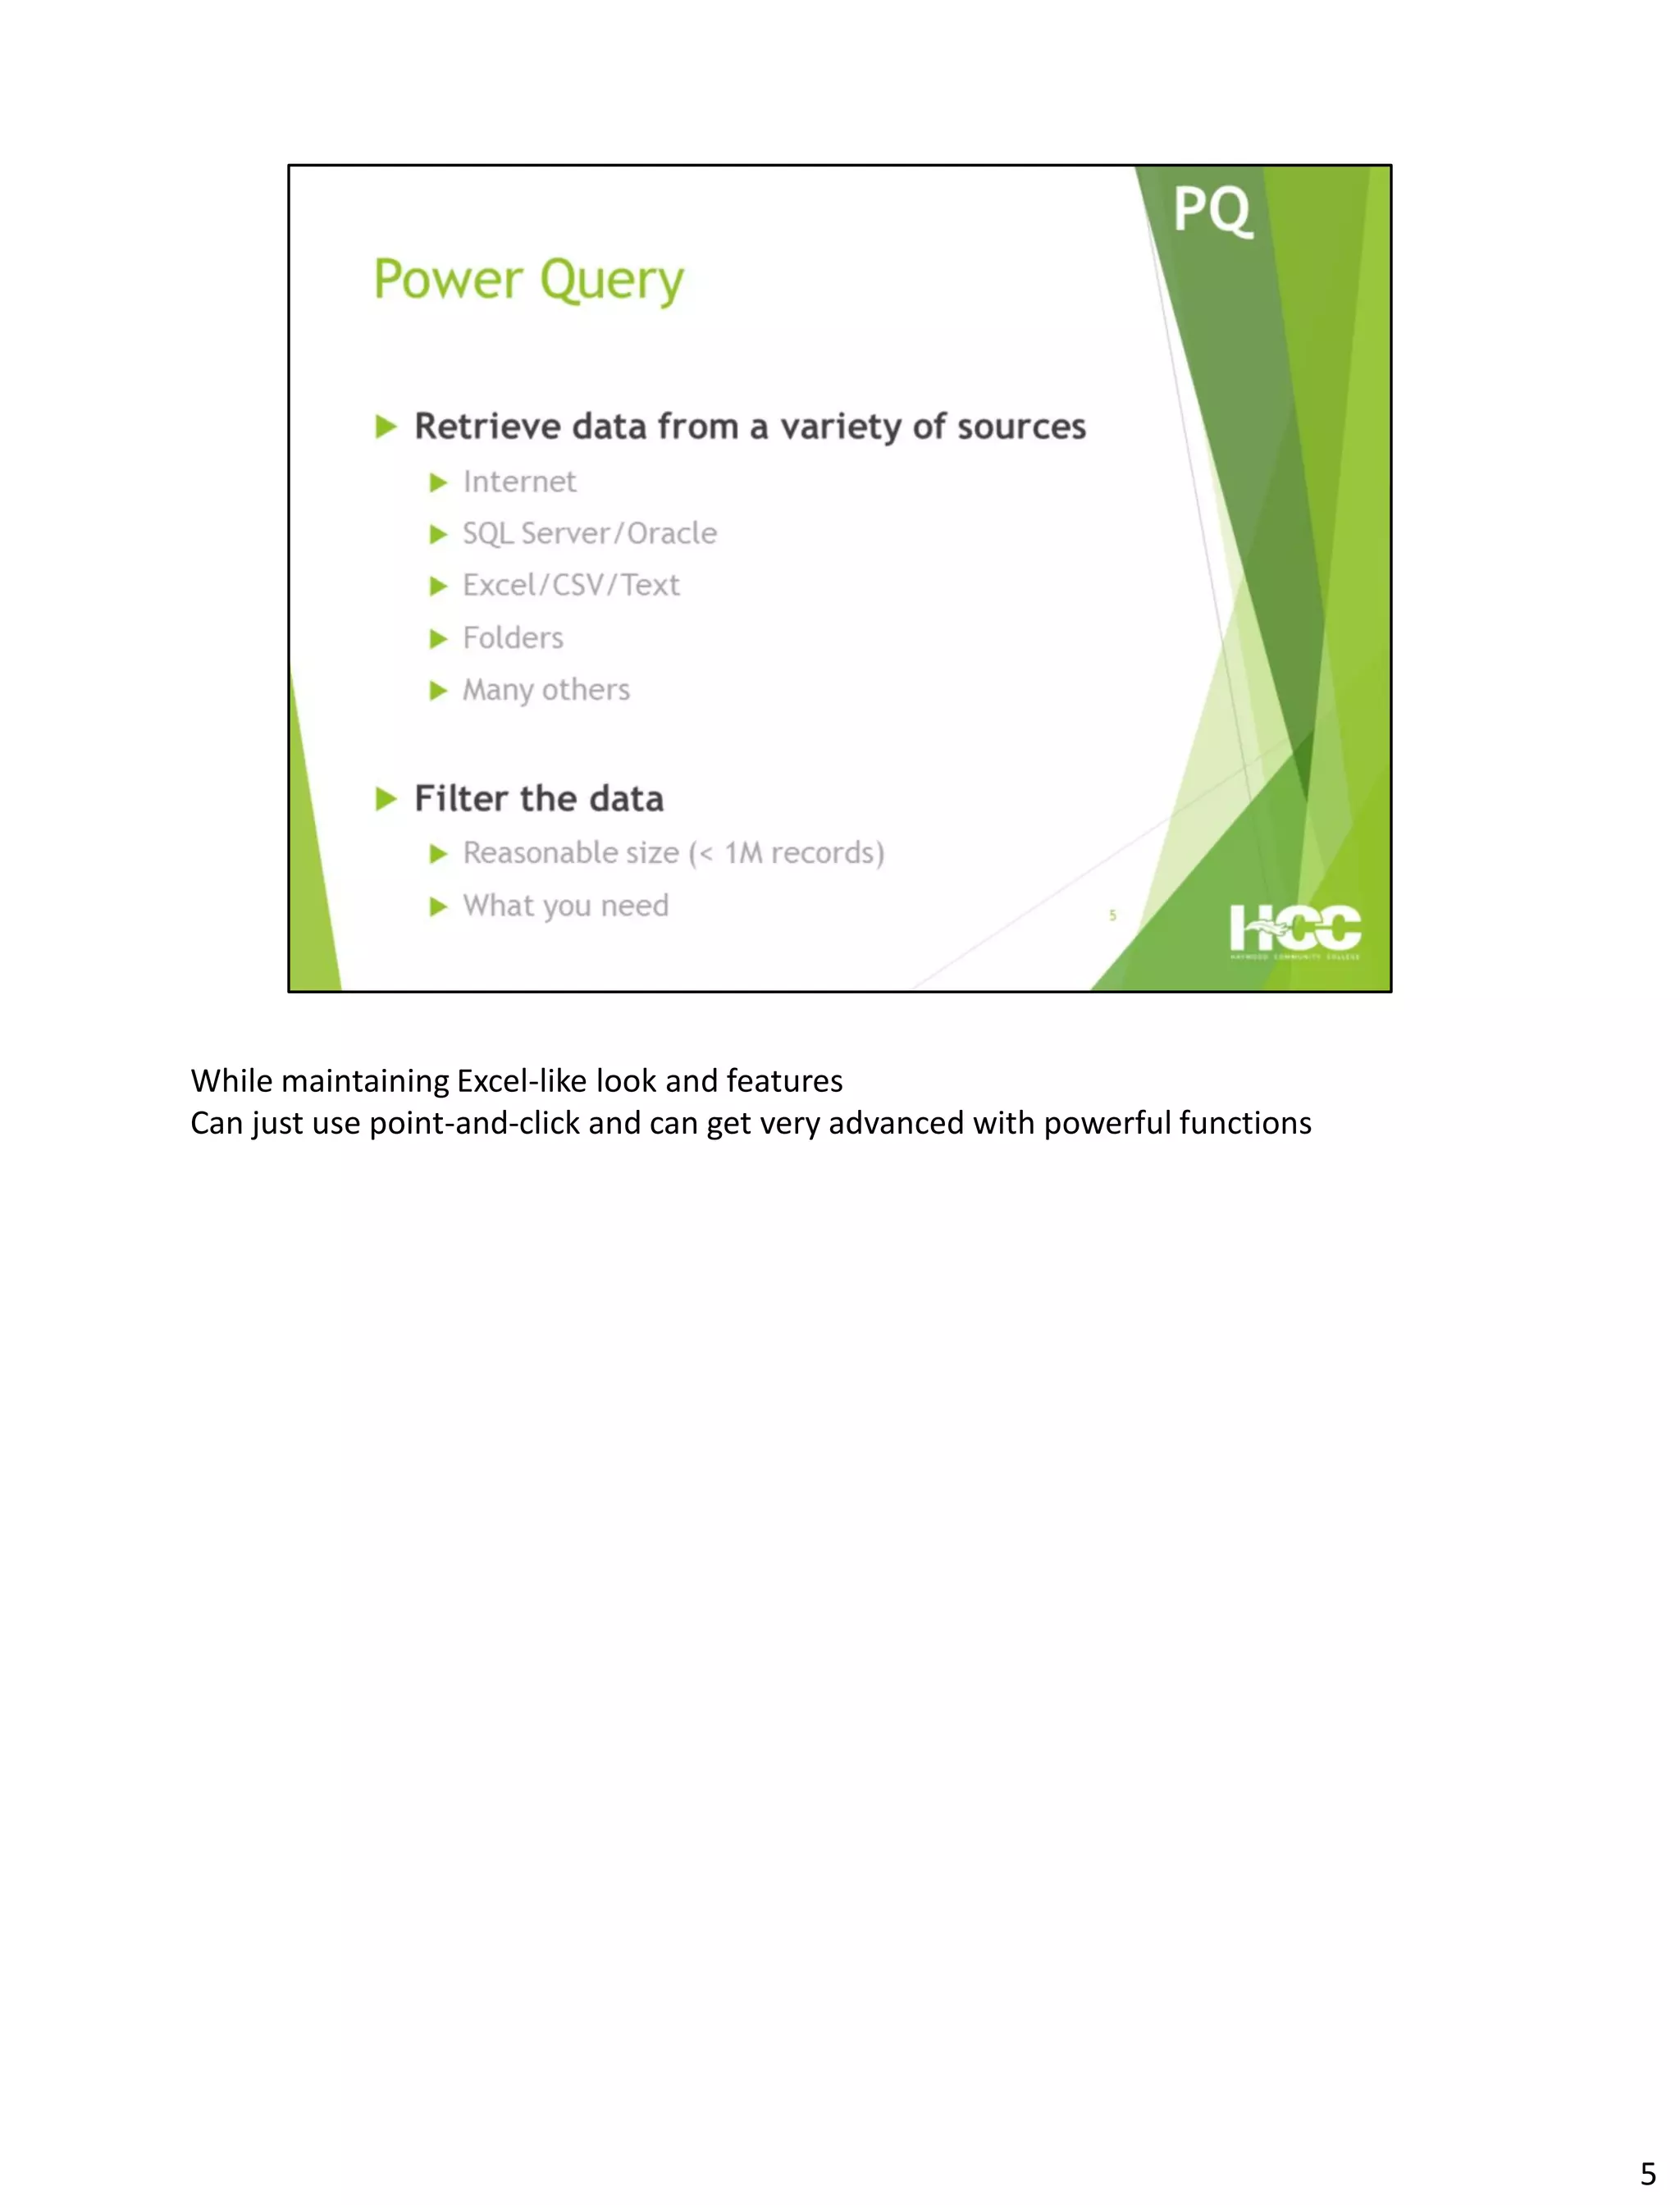
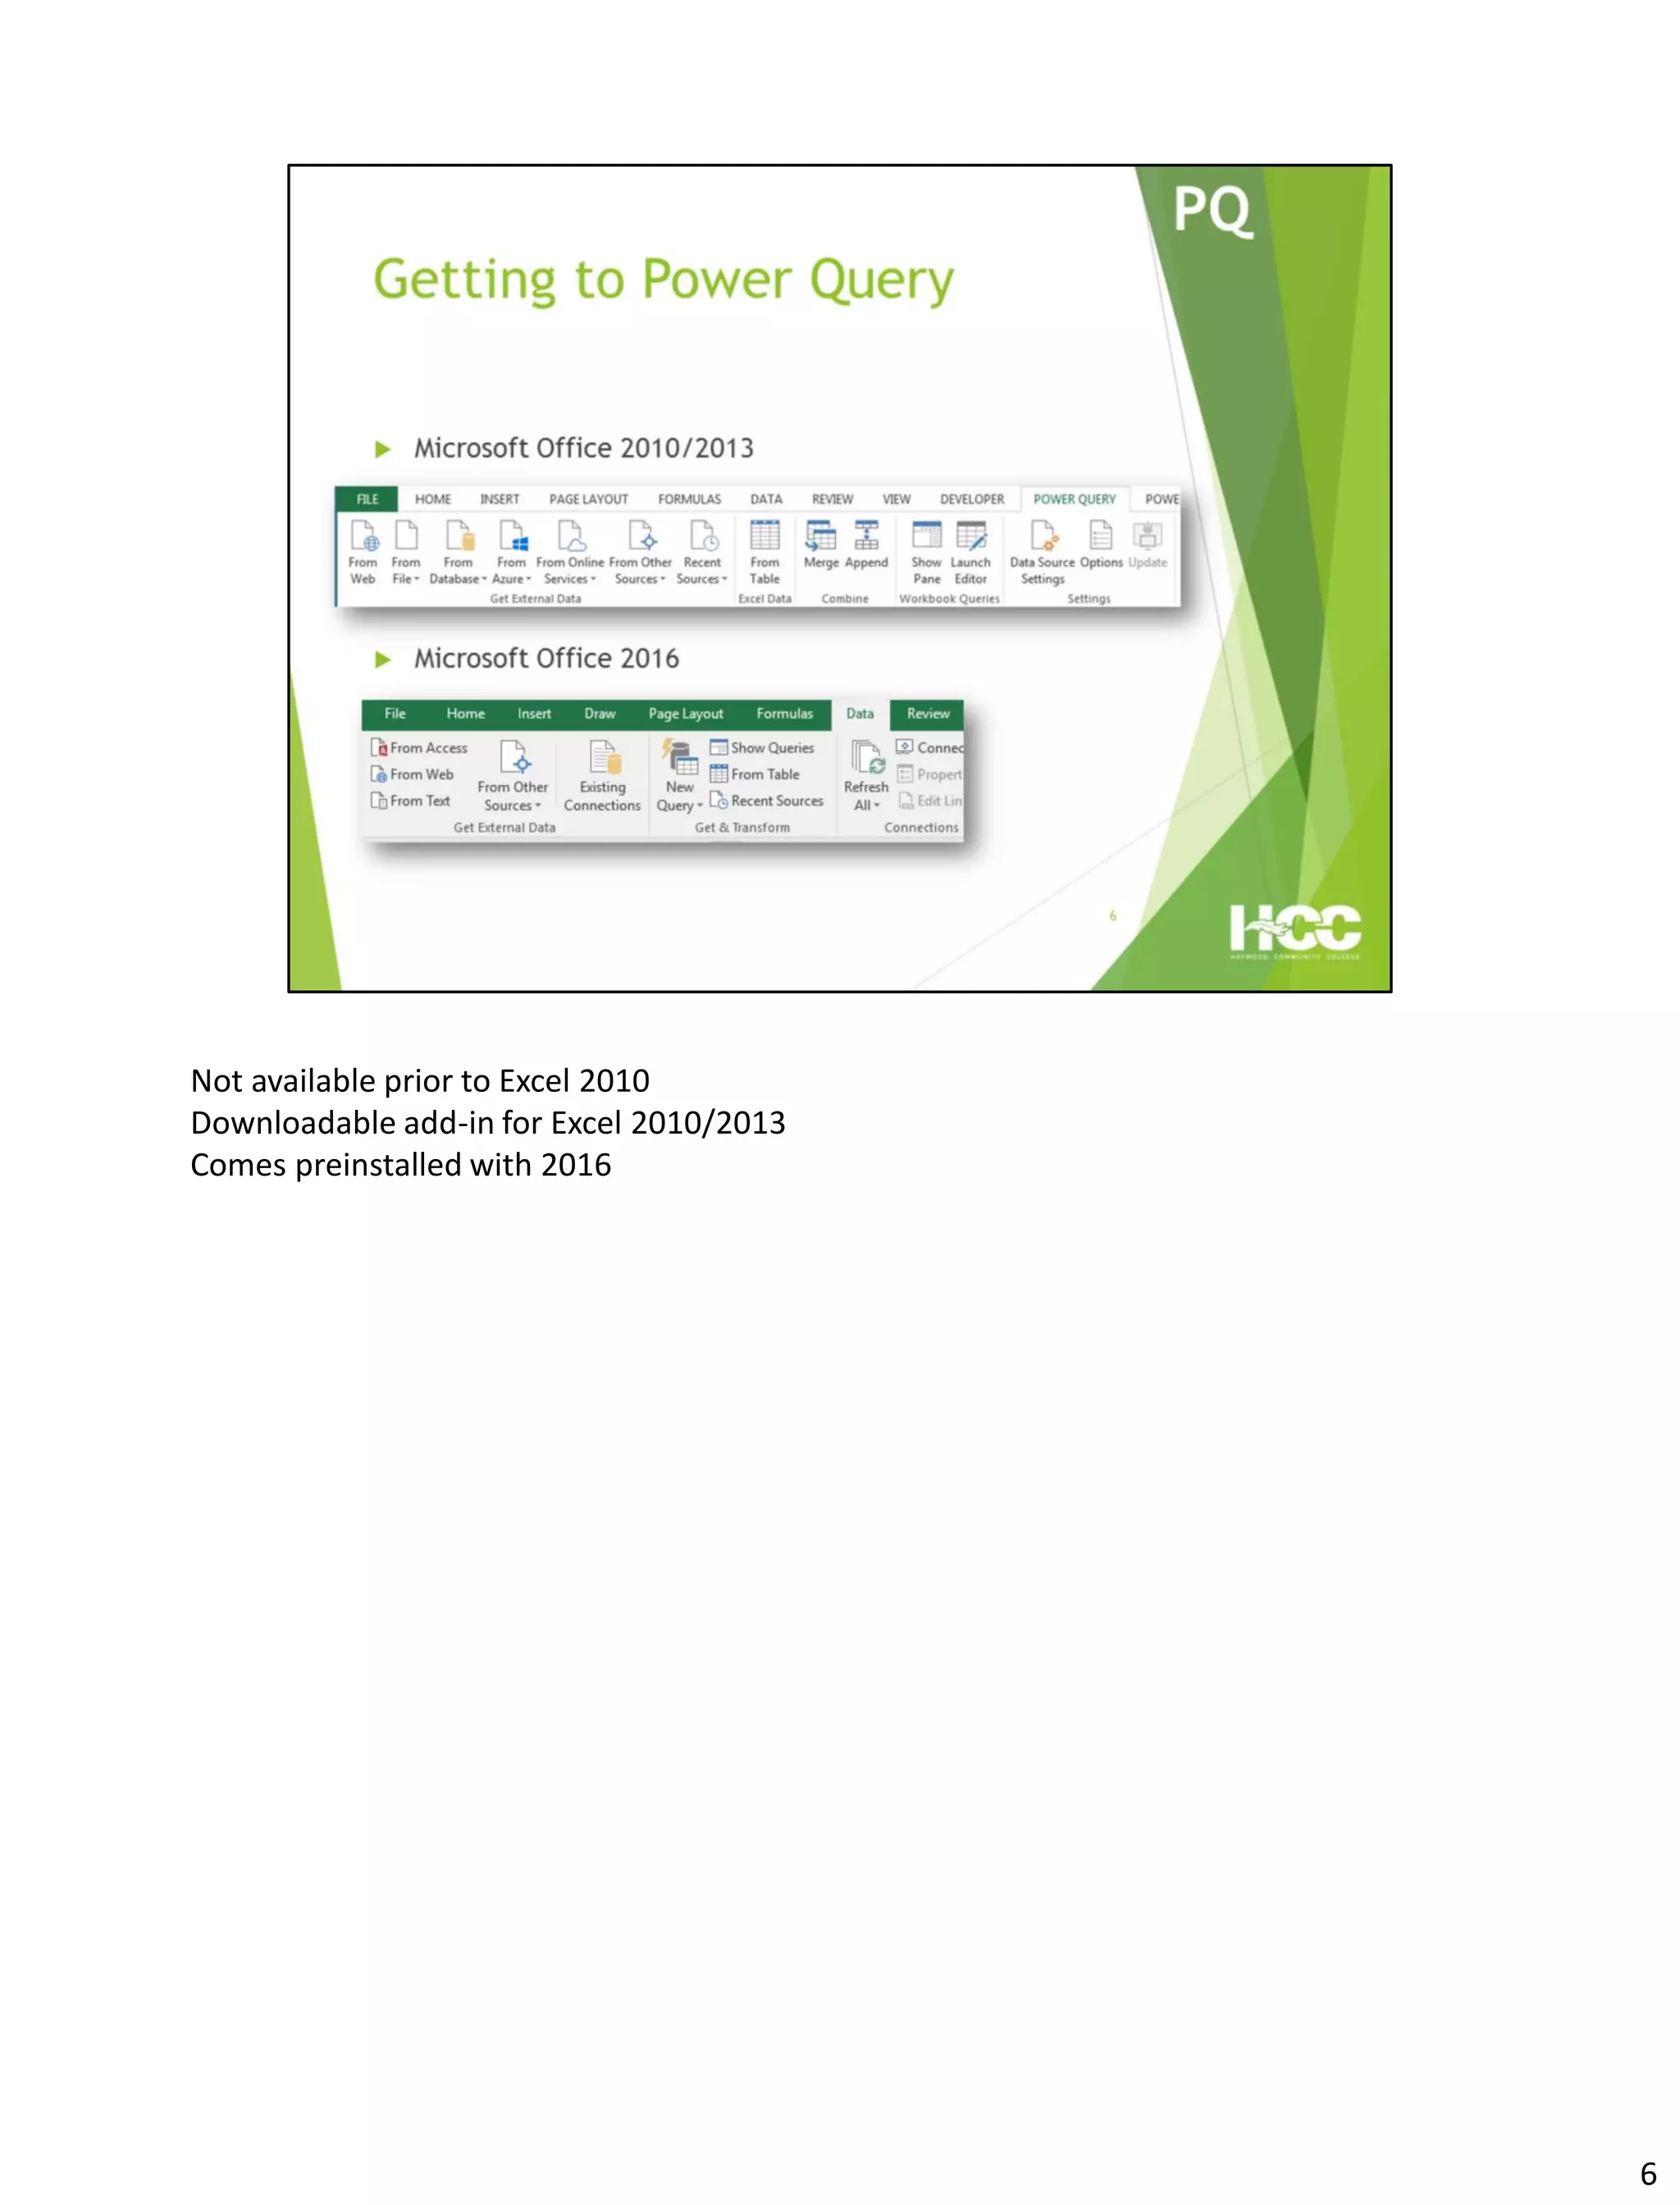
This document provides an overview of Power Query and Power Pivot. It discusses how Power Query allows users to import data from various sources using a point-and-click interface and transform the data. Power Pivot then allows users to create data models and relationships between tables for analysis using powerful DAX formulas in Excel pivot tables.


![[Meetup] Code Quality tools used at Wolox for Web developing.](https://cdn.slidesharecdn.com/ss_thumbnails/meetupita1-160317143233-thumbnail.jpg?width=600ounds&width=560&fit=bounds)


