The document introduces Excel's statistical applications, emphasizing its importance for university courses, especially in finance. It covers various Excel functions such as SUM, COUNT, AVERAGE, logical functions, and how to perform statistical analysis using data analysis and pivot tables. Additionally, it provides resources for practice and encourages students to learn Excel for future career opportunities.
Why excel?Why shouldI care about excel?It helps with your university courses, especially if you’re doing finance where you’ll encounter it in 1613, 2624, Applied Corporate Finance, Options, Applied Corporate Finance etc.But I have an awesome friend who knows excel and will do it all for me!Well, that friend won’t be there forever, especially when you get an internship or a graduate job where knowing how to use excel will help you adapt quicker and give you a better chance at doing well.I don’t plan to work in commerce!Well then… WHAT ON EARTH ARE YOU DOING HERE?!?!Now that we have that sorted, please go to the link below to download the excel spreadsheet with exercises and data for practice.www.unswbsoc.com/media/Introduction to Excel - Application to Statistics.xlsxhttp://myendlesssoliloquy.files.wordpress.com/2011/05/introduction-to-excel-application-to-statistics1.xlsx
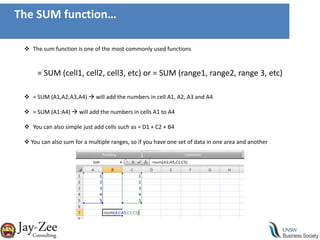
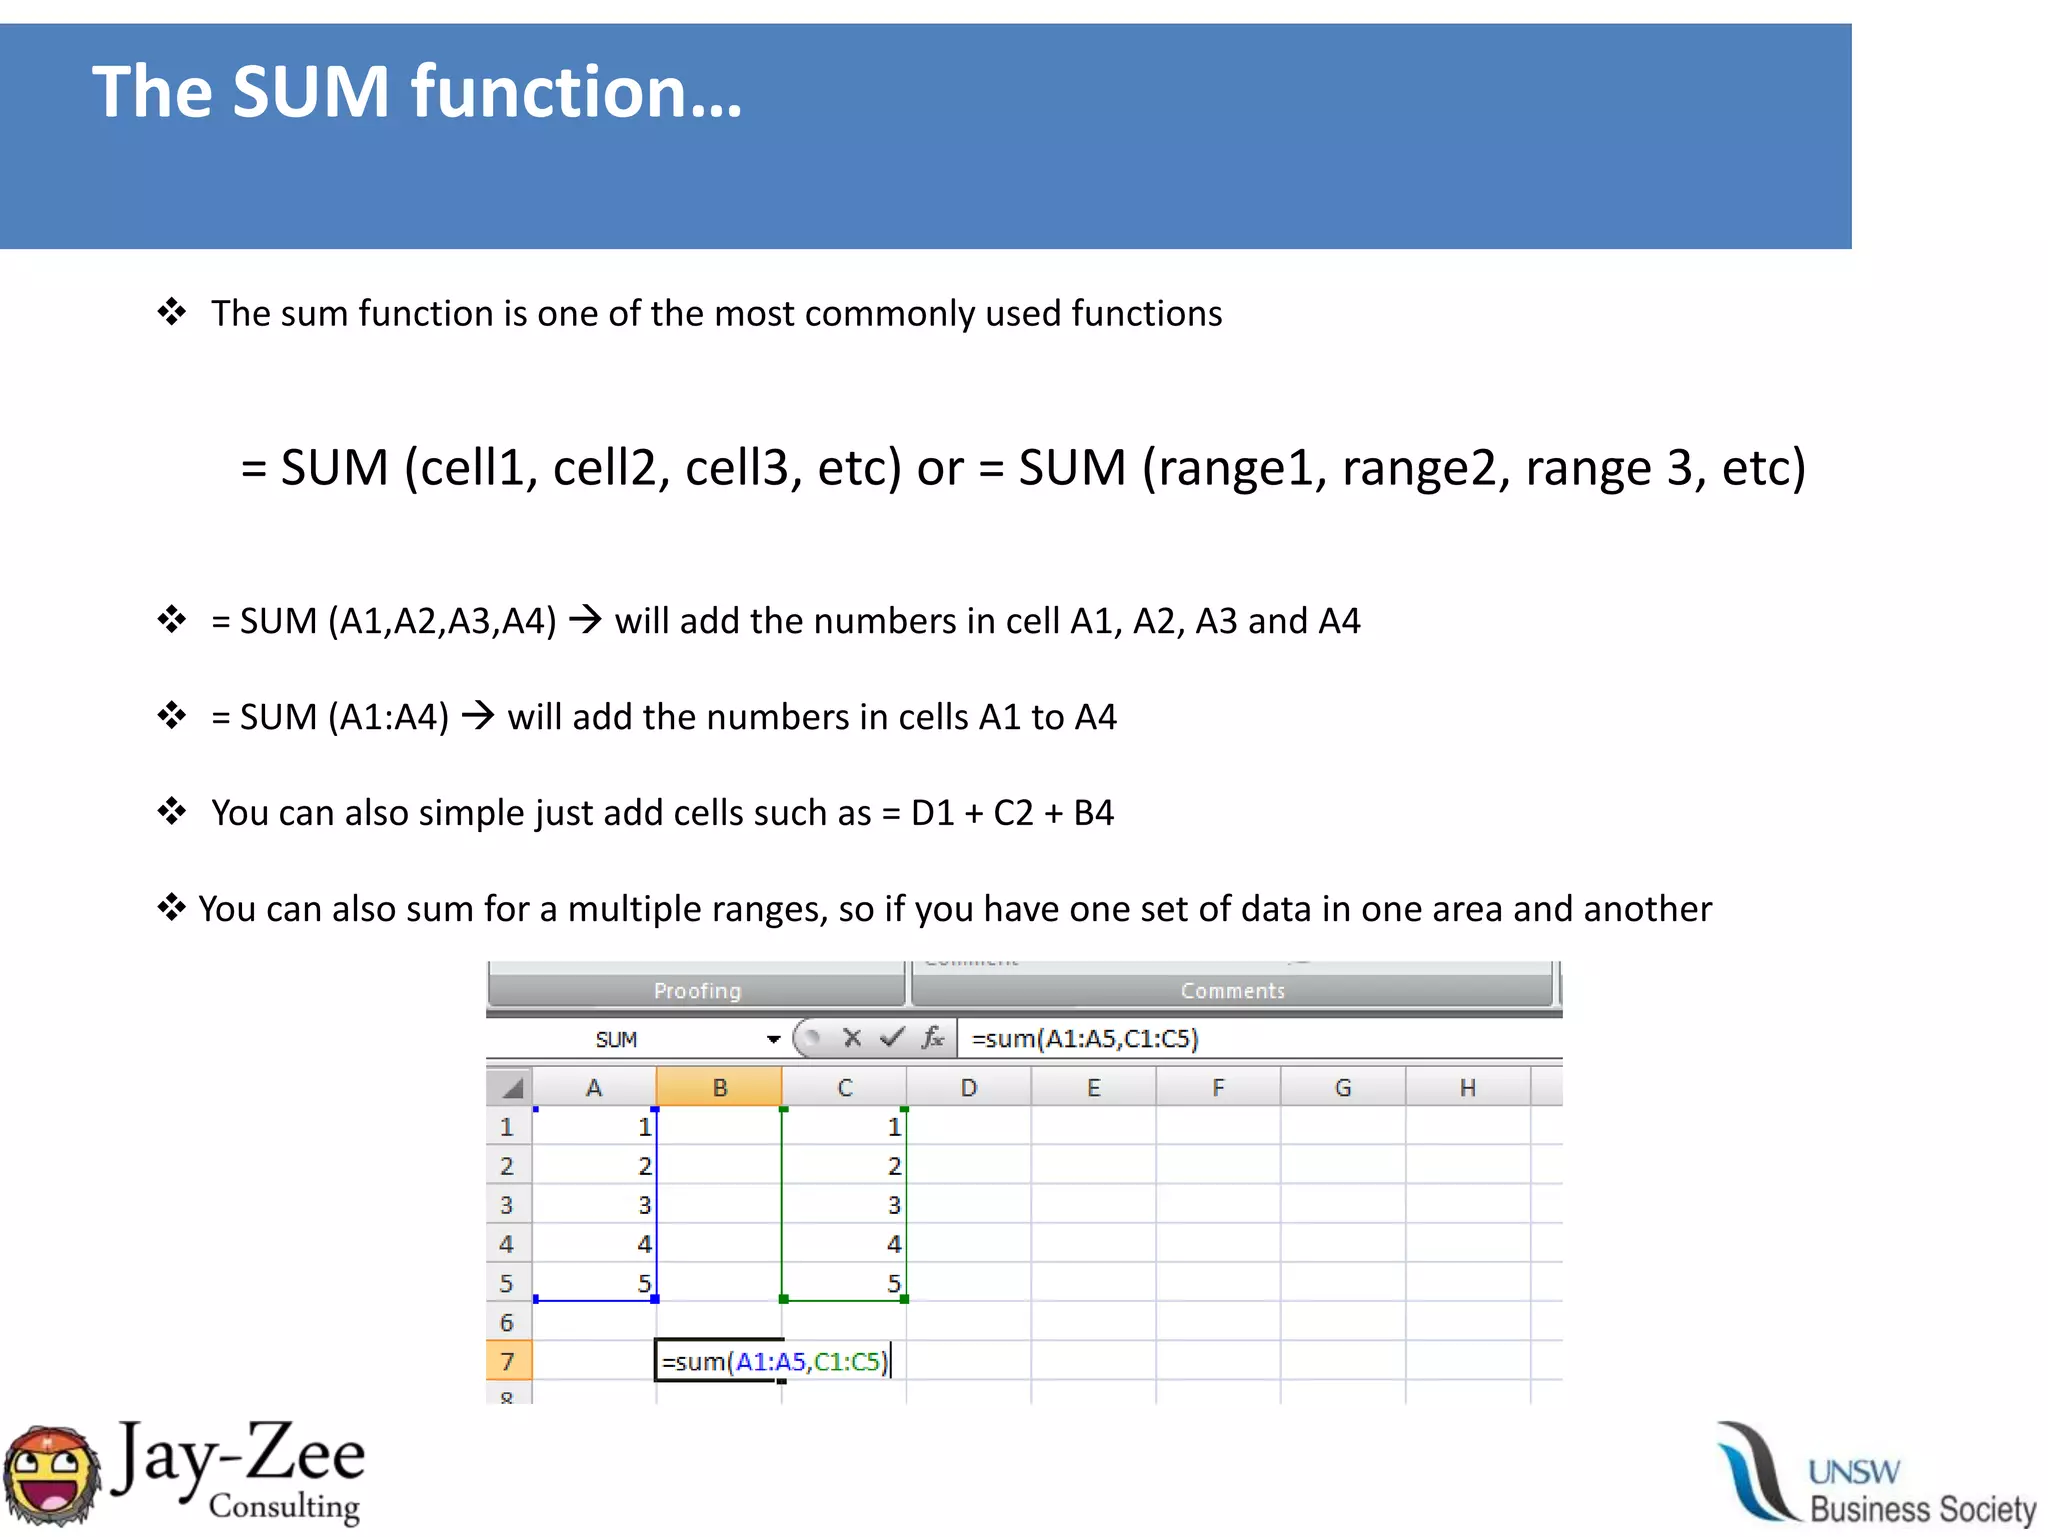
The SUM function…Thesum function is one of the most commonly used functions= SUM (cell1, cell2, cell3, etc) or = SUM (range1, range2, range 3, etc)= SUM (A1,A2,A3,A4) will add the numbers in cell A1, A2, A3 and A4
15.
= SUM (A1:A4) will add the numbers in cells A1 to A4
16.
You can alsosimple just add cells such as = D1 + C2 + B4
17.
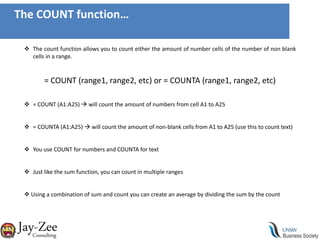
You canalso sum for a multiple ranges, so if you have one set of data in one area and another The COUNT function…The count function allows you to count either the amount of number cells of the number of non blank cells in a range.= COUNT (range1, range2, etc) or = COUNTA (range1, range2, etc)= COUNT (A1:A25) will count the amount of numbers from cell A1 to A25
18.
= COUNTA (A1:A25) will count the amount of non-blank cells from A1 to A25 (use this to count text)
Just like thesum function, you can count in multiple ranges
21.
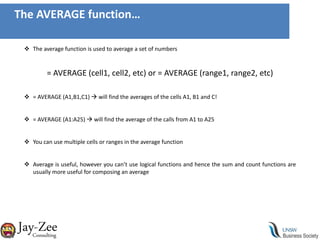
Using acombination of sum and count you can create an average by dividing the sum by the countThe AVERAGE function…The average function is used to average a set of numbers= AVERAGE (cell1, cell2, etc) or = AVERAGE (range1, range2, etc)= AVERAGE (A1,B1,C1) will find the averages of the cells A1, B1 and C!
You can usemultiple cells or ranges in the average function
24.
Average is useful,however you can’t use logical functions and hence the sum and count functions are usually more useful for composing an averageLogical Functions
25.
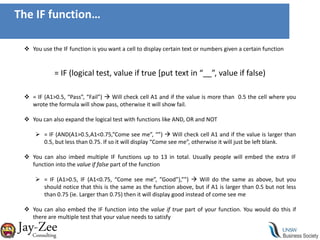
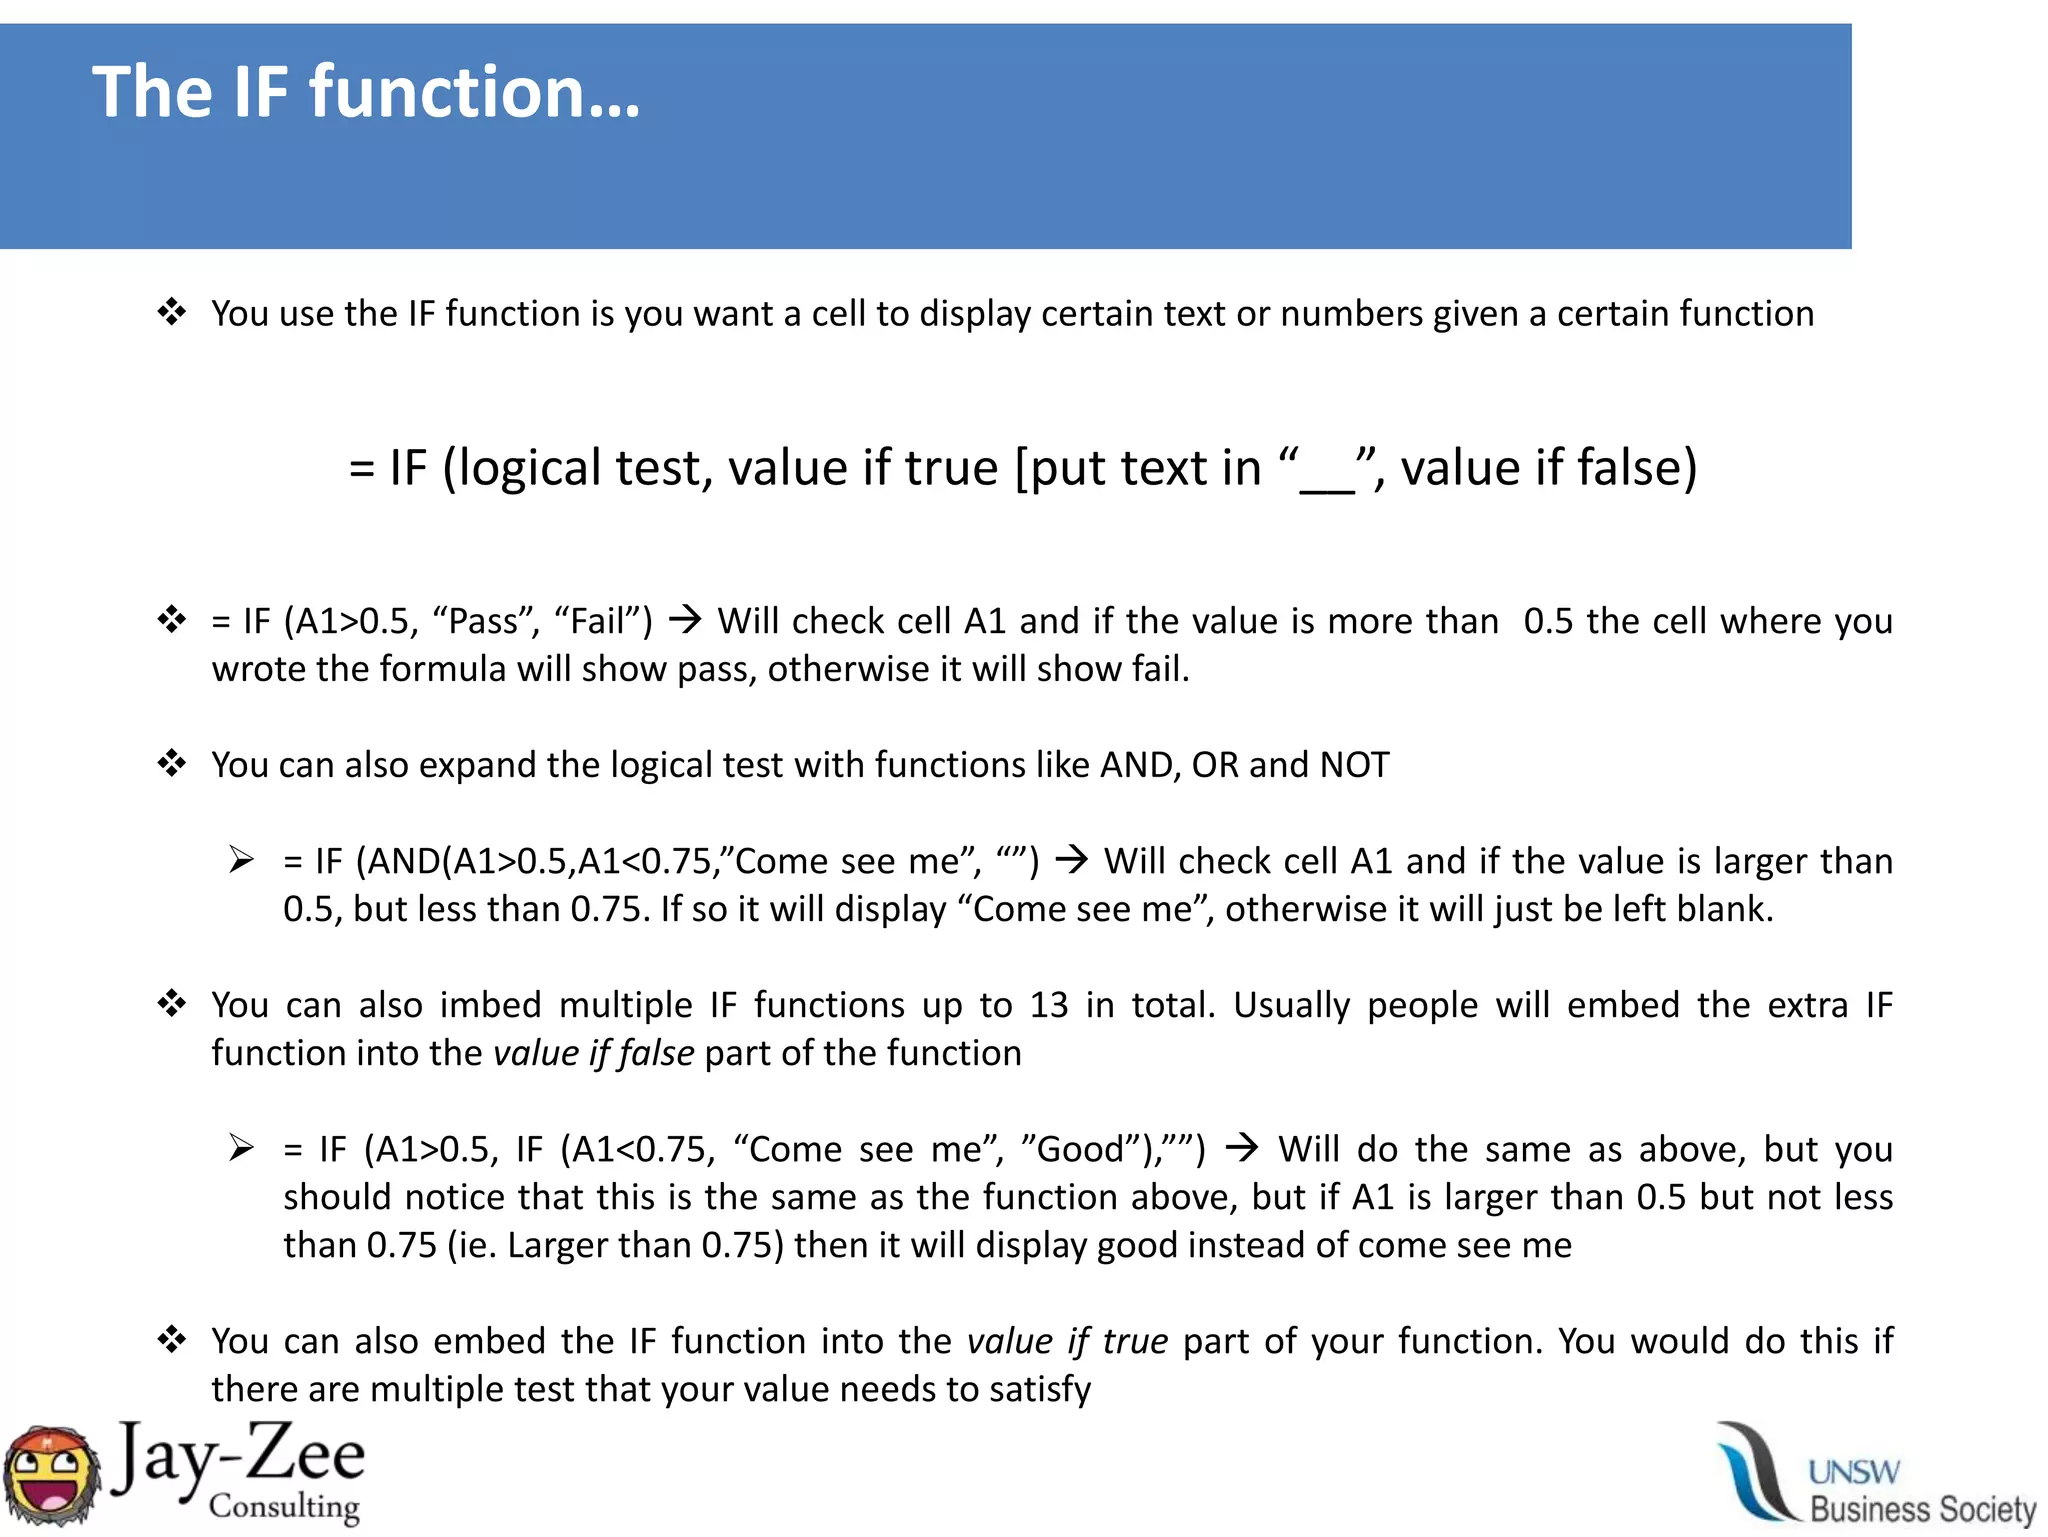
The IF function…Youuse the IF function is you want a cell to display certain text or numbers given a certain function = IF (logical test, value if true [put text in “__”, value if false)= IF (A1>0.5, “Pass”, “Fail”) Will check cell A1 and if the value is more than 0.5 the cell where you wrote the formula will show pass, otherwise it will show fail.
26.
You can alsoexpand the logical test with functions like AND, OR and NOT
27.
= IF (AND(A1>0.5,A1<0.75,”Comesee me”, “”) Will check cell A1 and if the value is larger than 0.5, but less than 0.75. If so it will display “Come see me”, otherwise it will just be left blank.
28.
You can alsoimbed multiple IF functions up to 13 in total. Usually people will embed the extra IF function into the value if false part of the function
29.
= IF (A1>0.5,IF (A1<0.75, “Come see me”, ”Good”),””) Will do the same as above, but you should notice that this is the same as the function above, but if A1 is larger than 0.5 but not less than 0.75 (ie. Larger than 0.75) then it will display good instead of come see me
30.
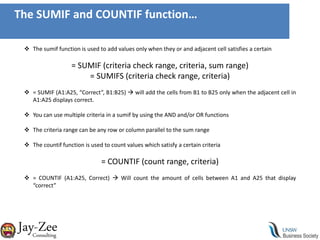
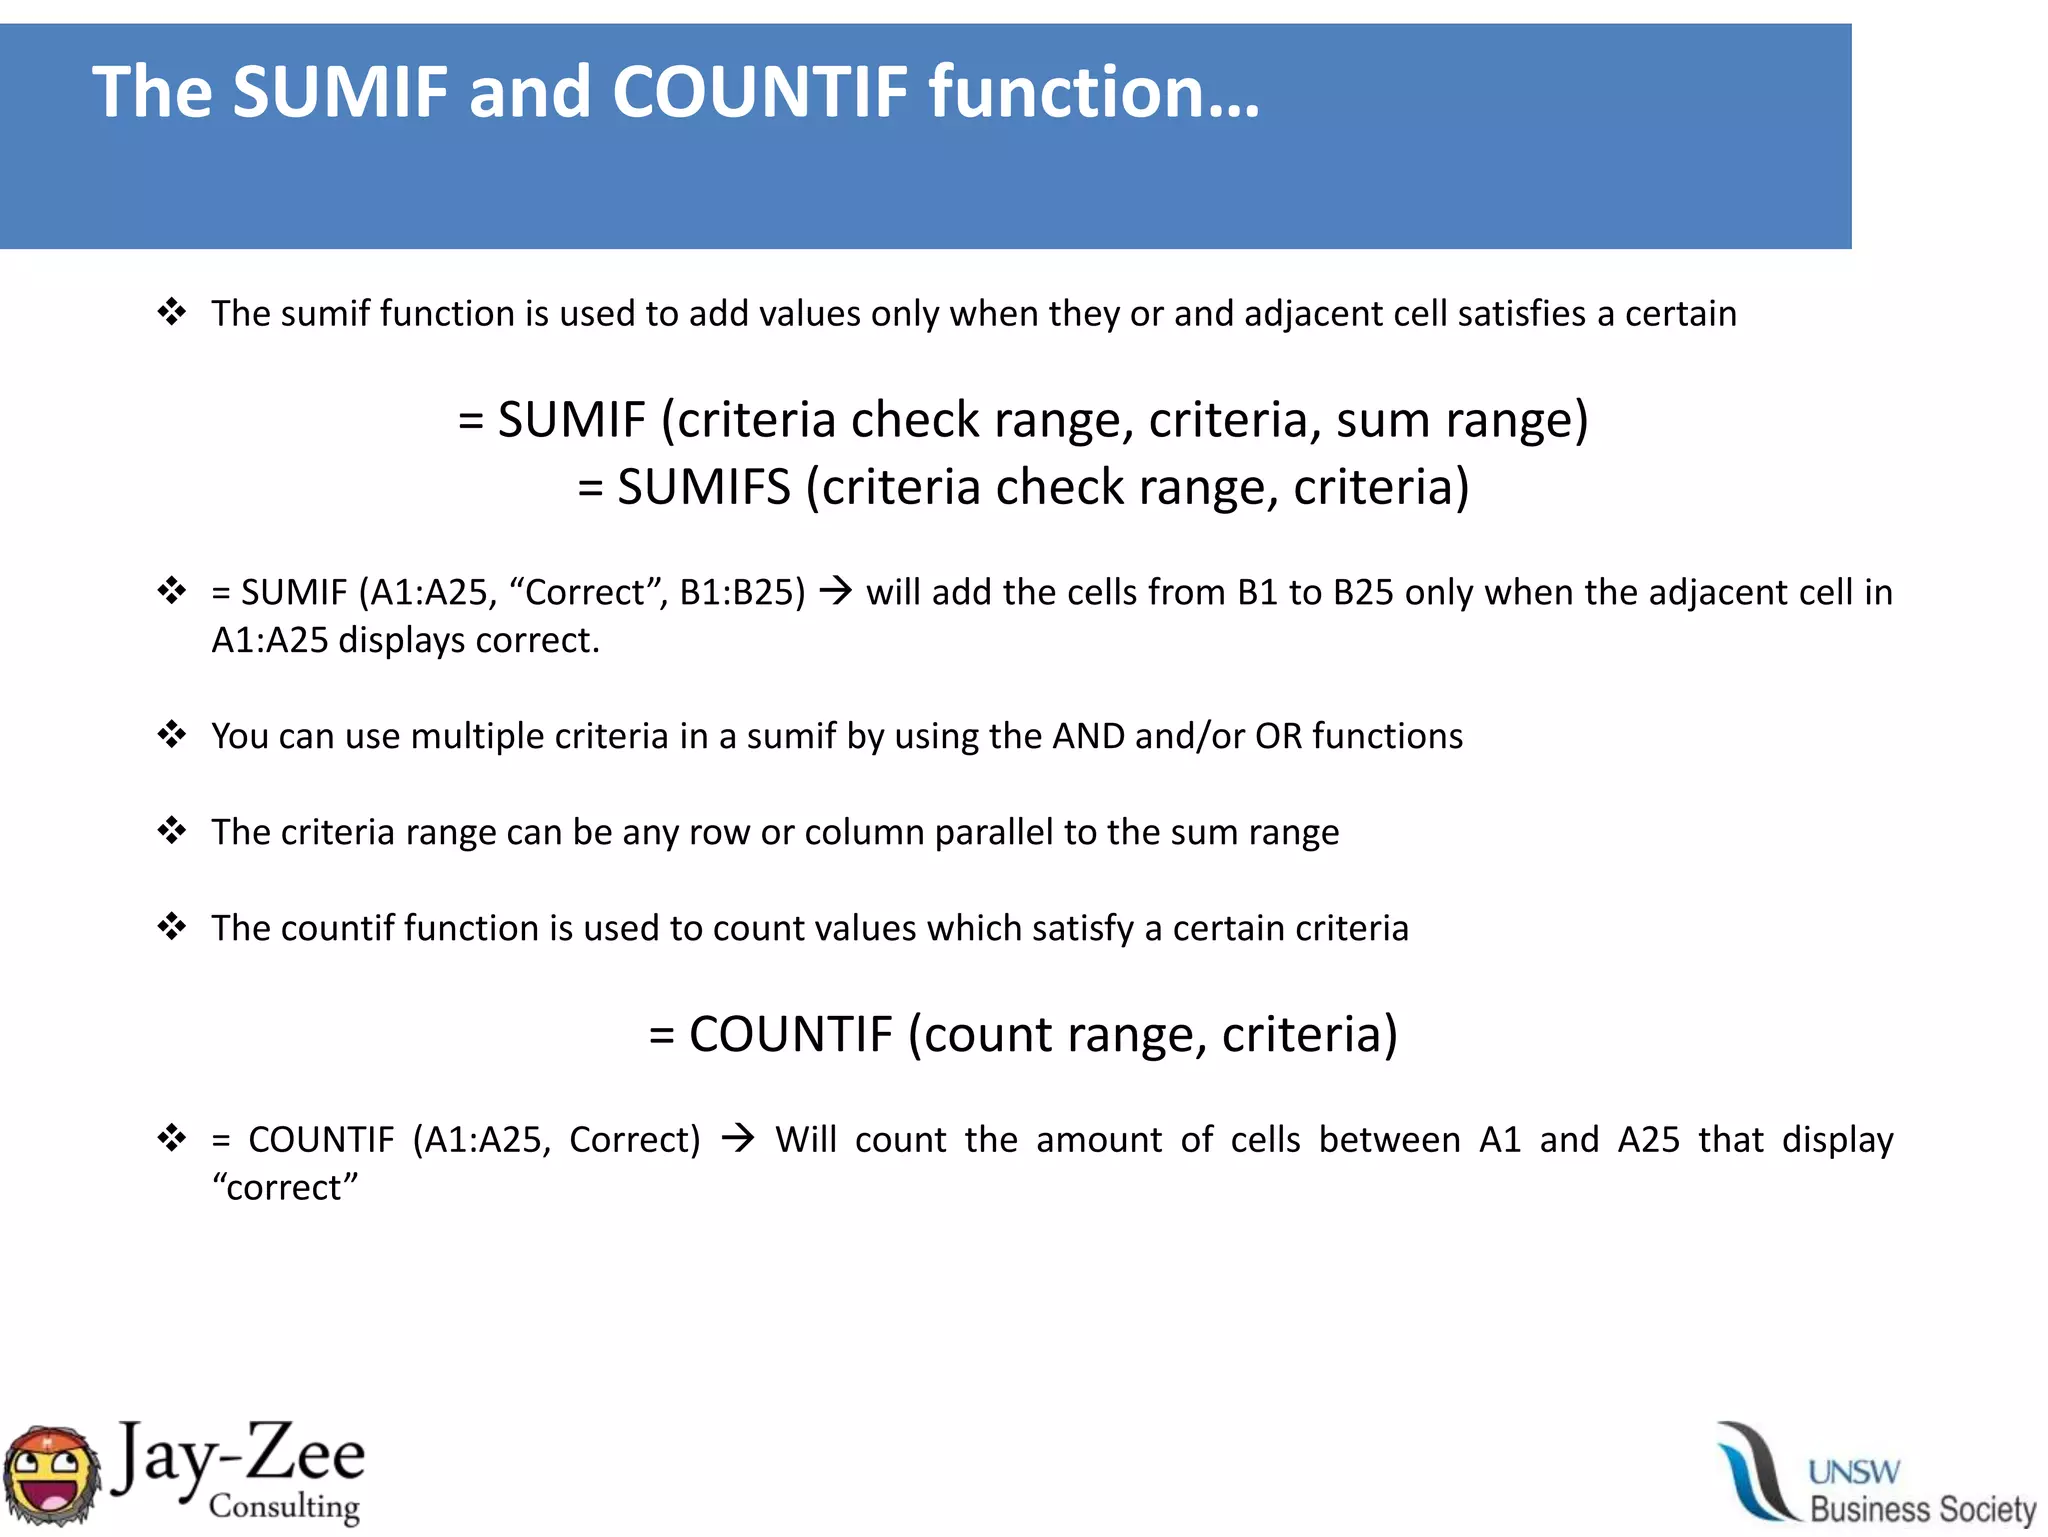
You can alsoembed the IF function into the value if true part of your function. You would do this if there are multiple test that your value needs to satisfyThe SUMIF and COUNTIF function…The sumif function is used to add values only when they or and adjacent cell satisfies a certain= SUMIF (criteria check range, criteria, sum range)= SUMIFS (criteria check range, criteria)= SUMIF (A1:A25, “Correct”, B1:B25) will add the cells from B1 to B25 only when the adjacent cell in A1:A25 displays correct.
31.
You can usemultiple criteria in a sumif by using the AND and/or OR functions
The countif functionis used to count values which satisfy a certain criteria= COUNTIF (count range, criteria)= COUNTIF (A1:A25, Correct) Will count the amount of cells between A1 and A25 that display “correct”Statistical MethodsData Analysis
34.
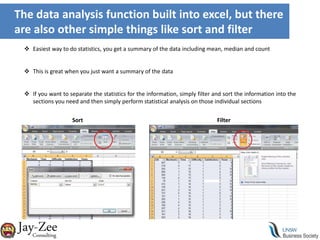
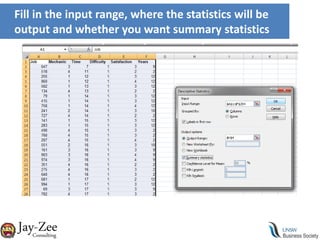
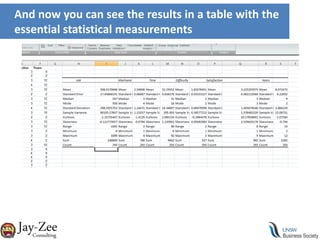
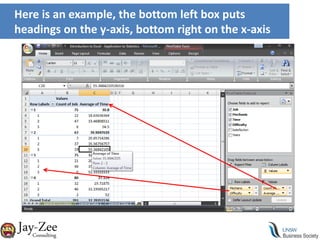
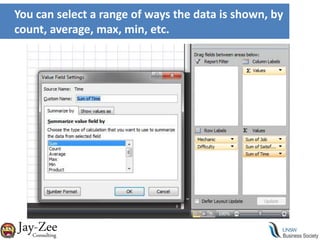
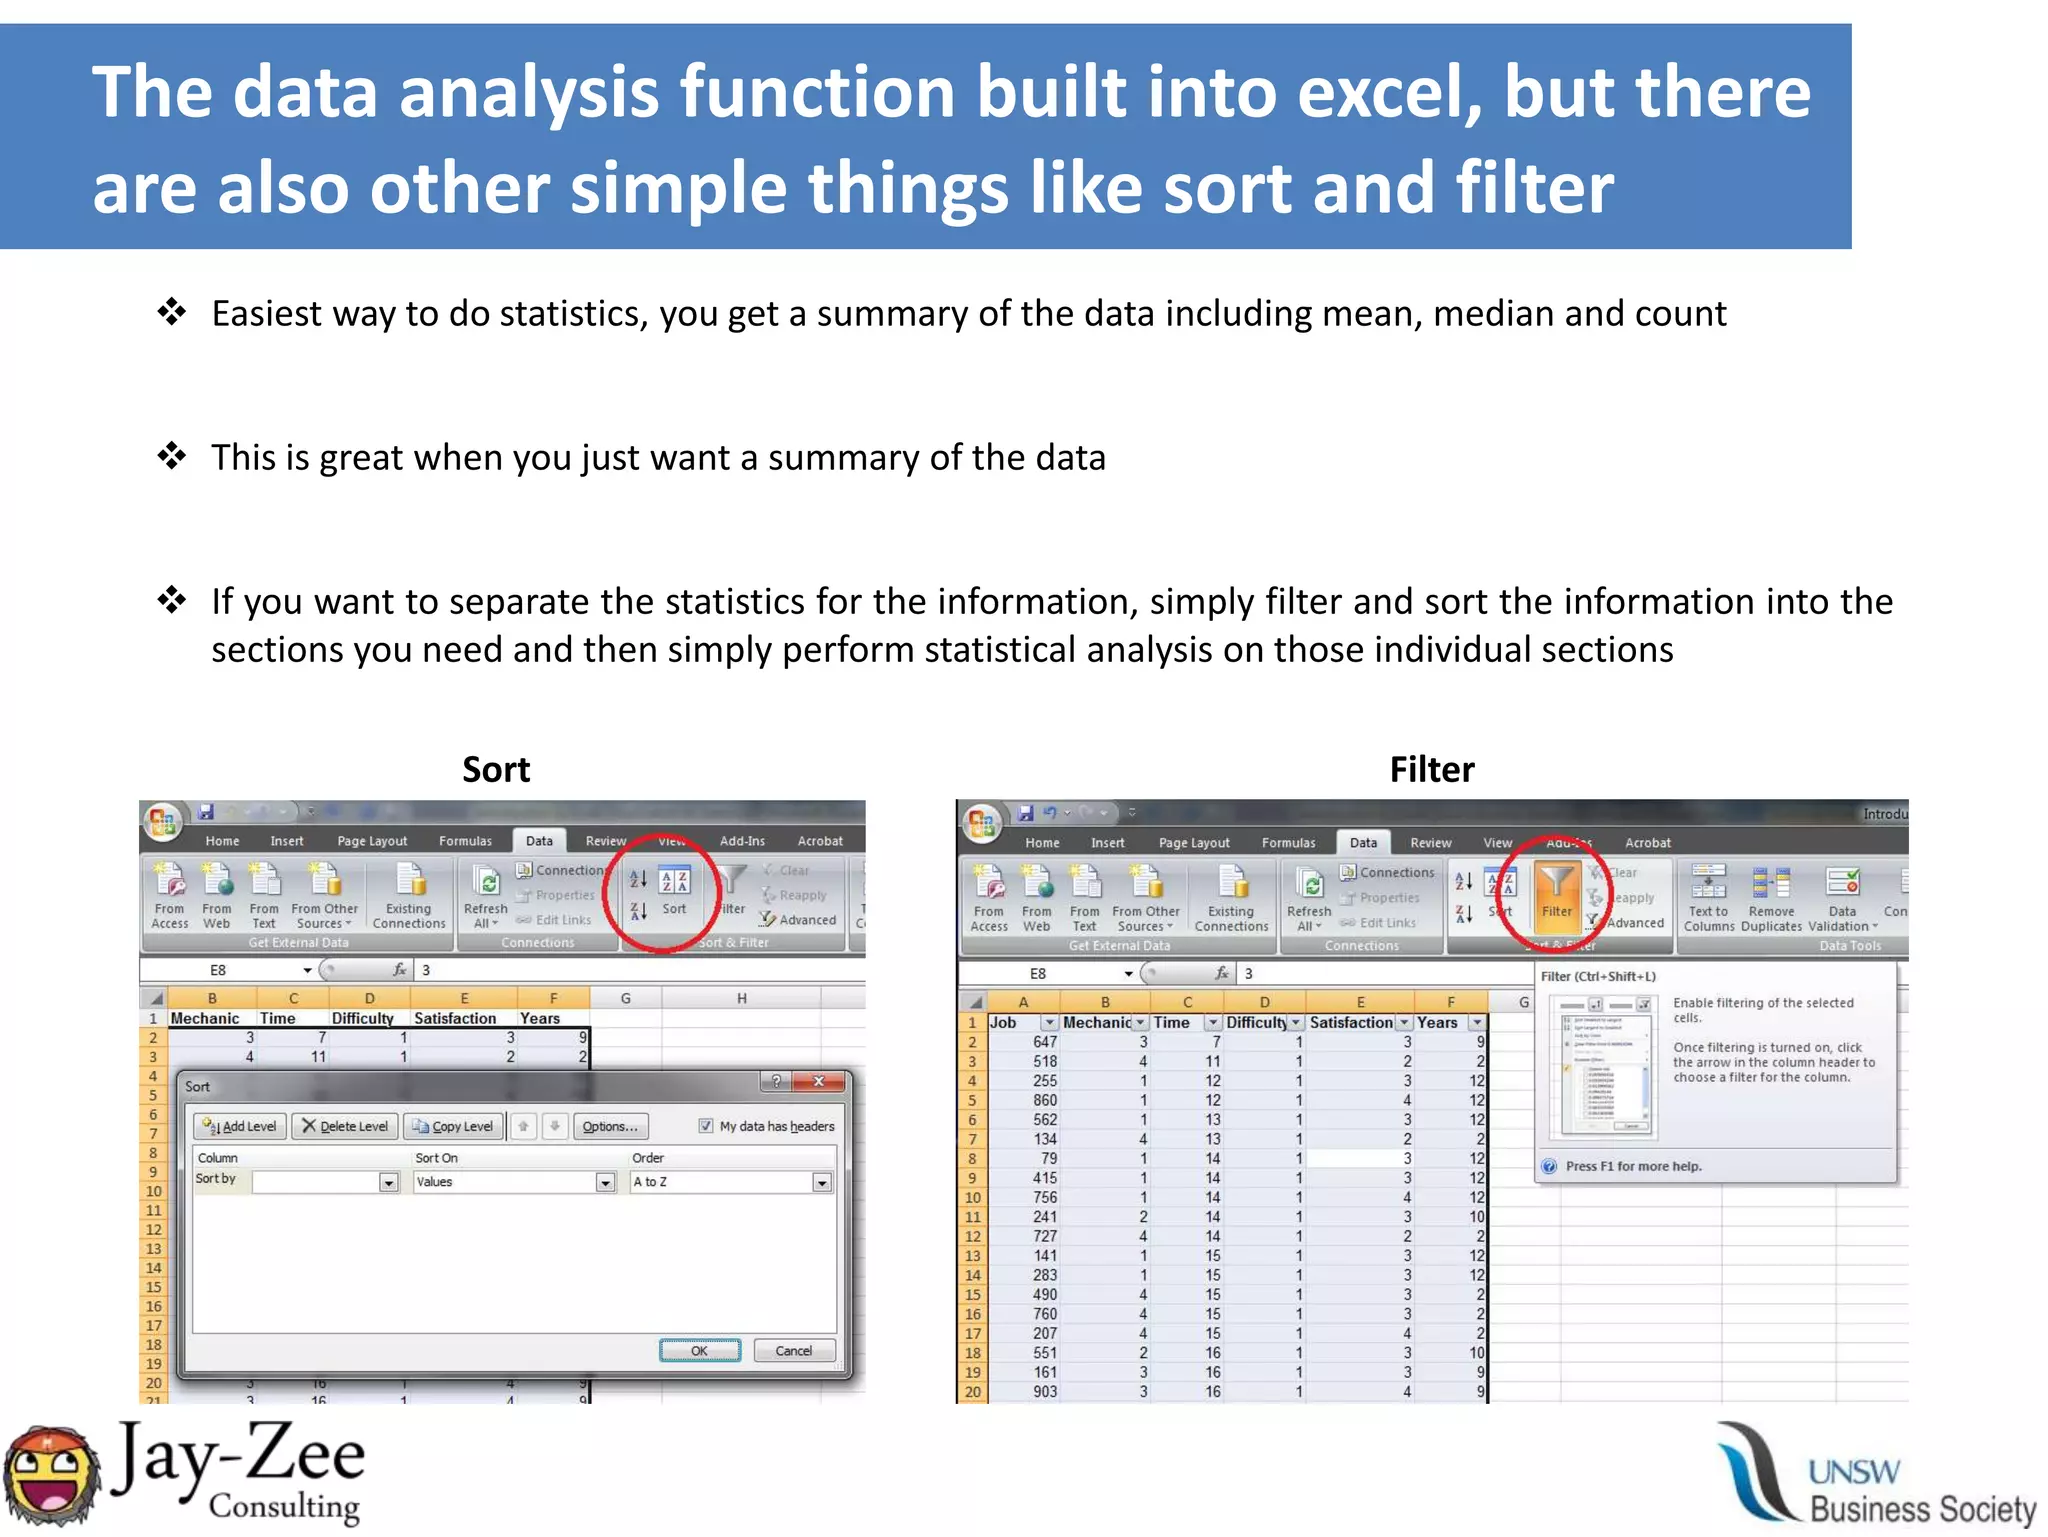
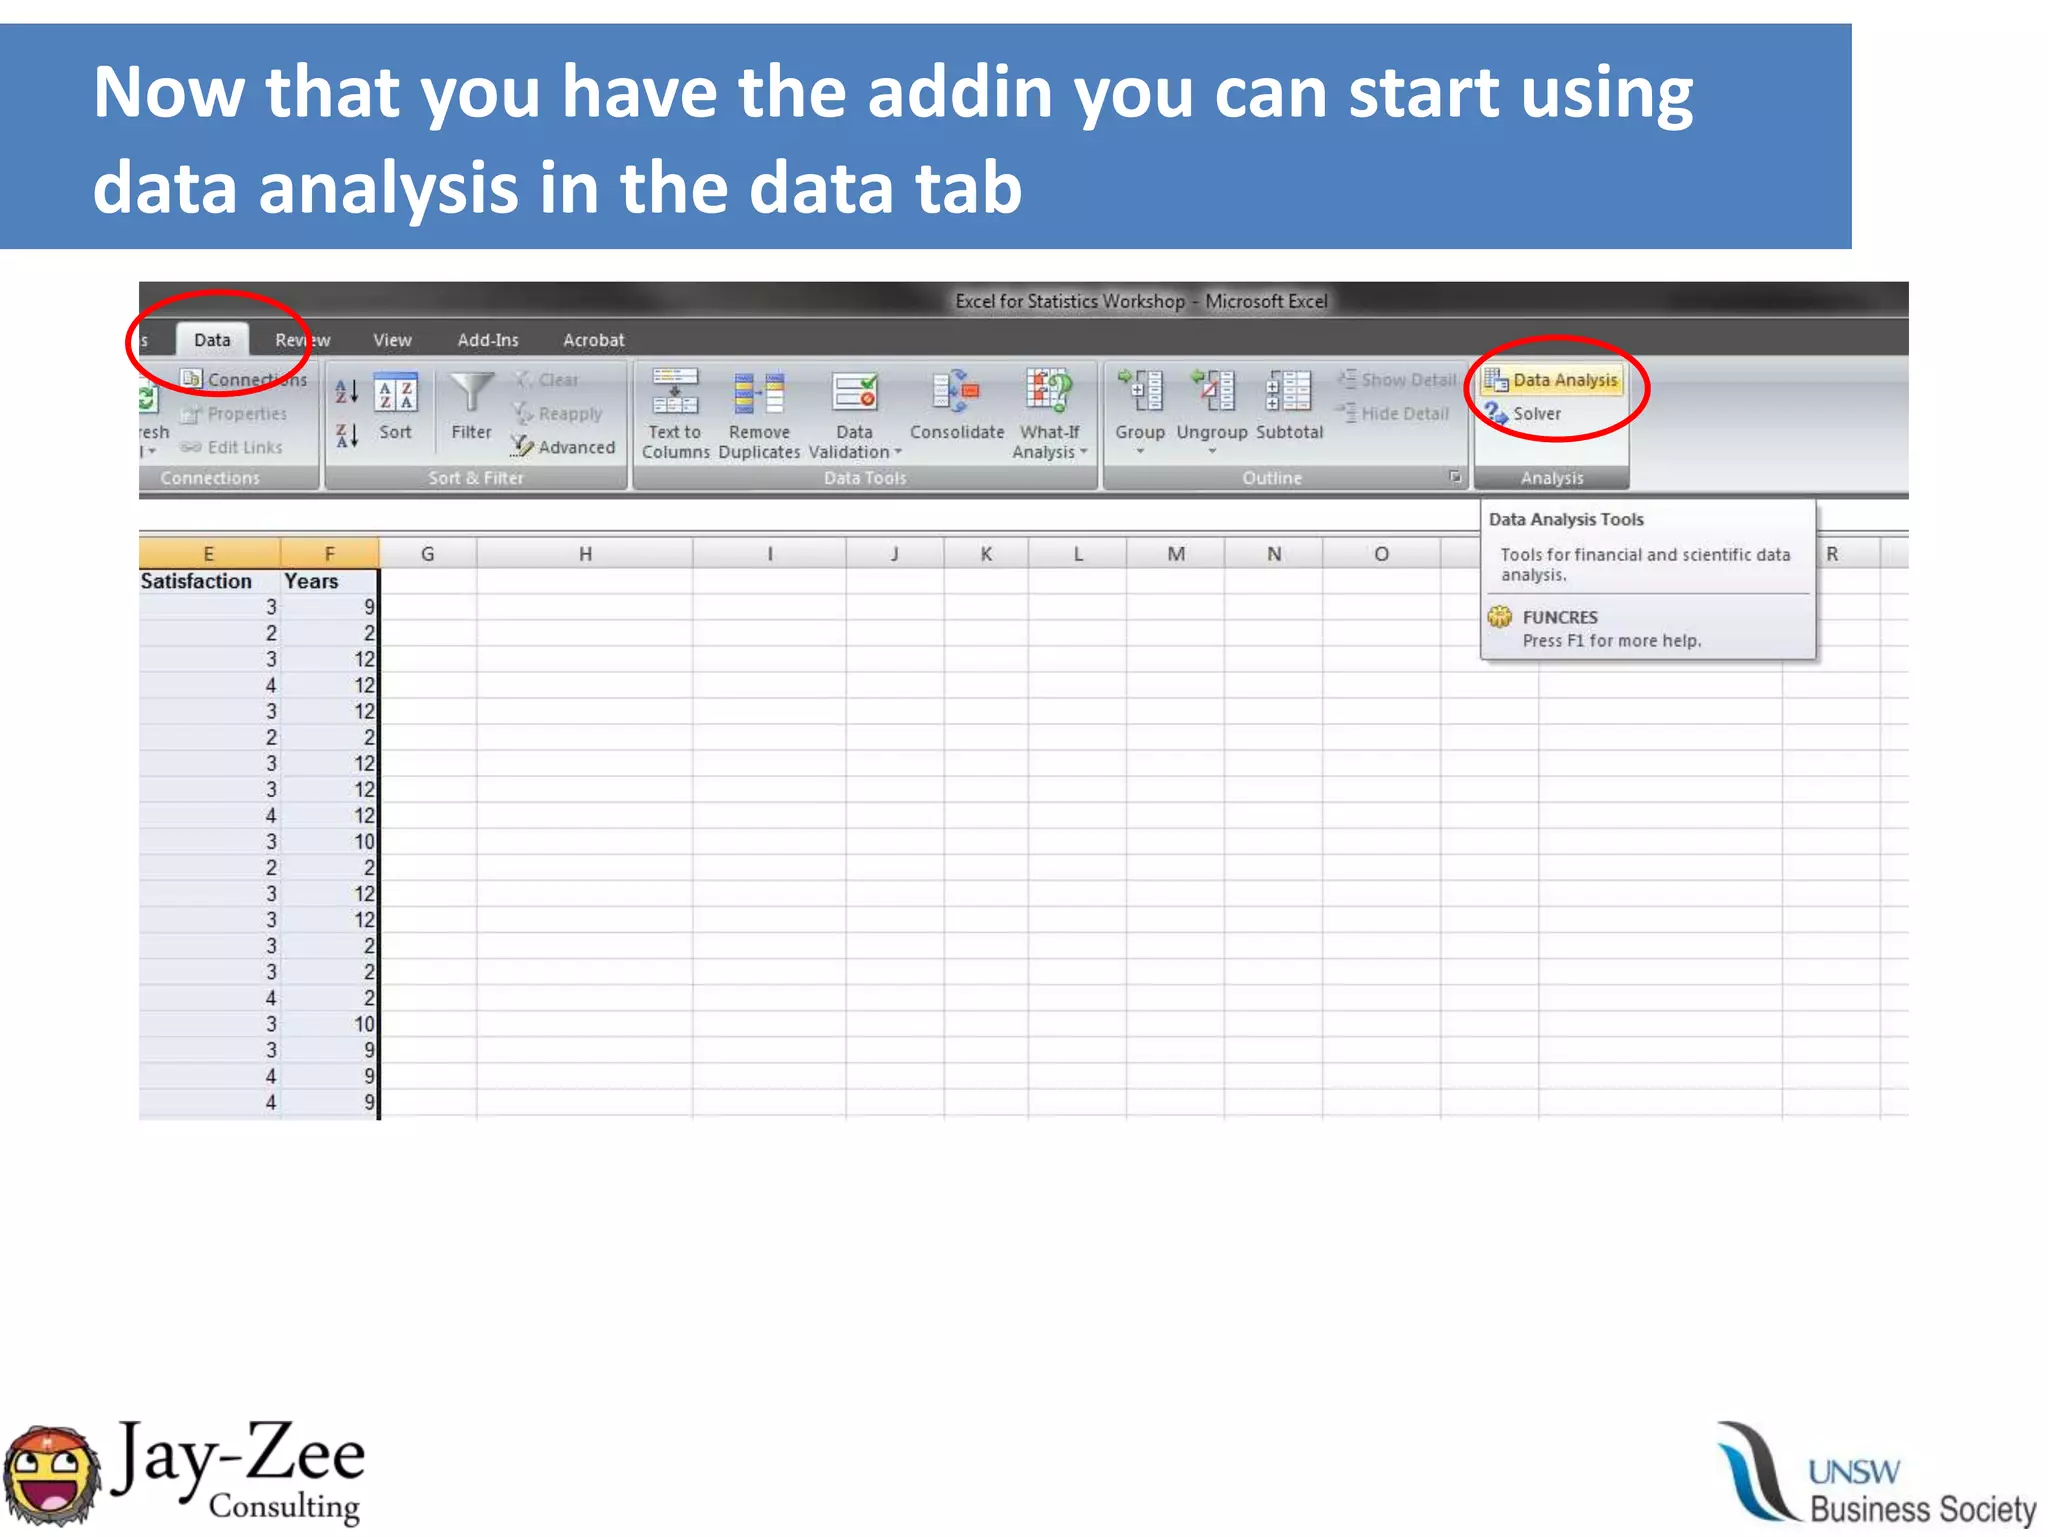
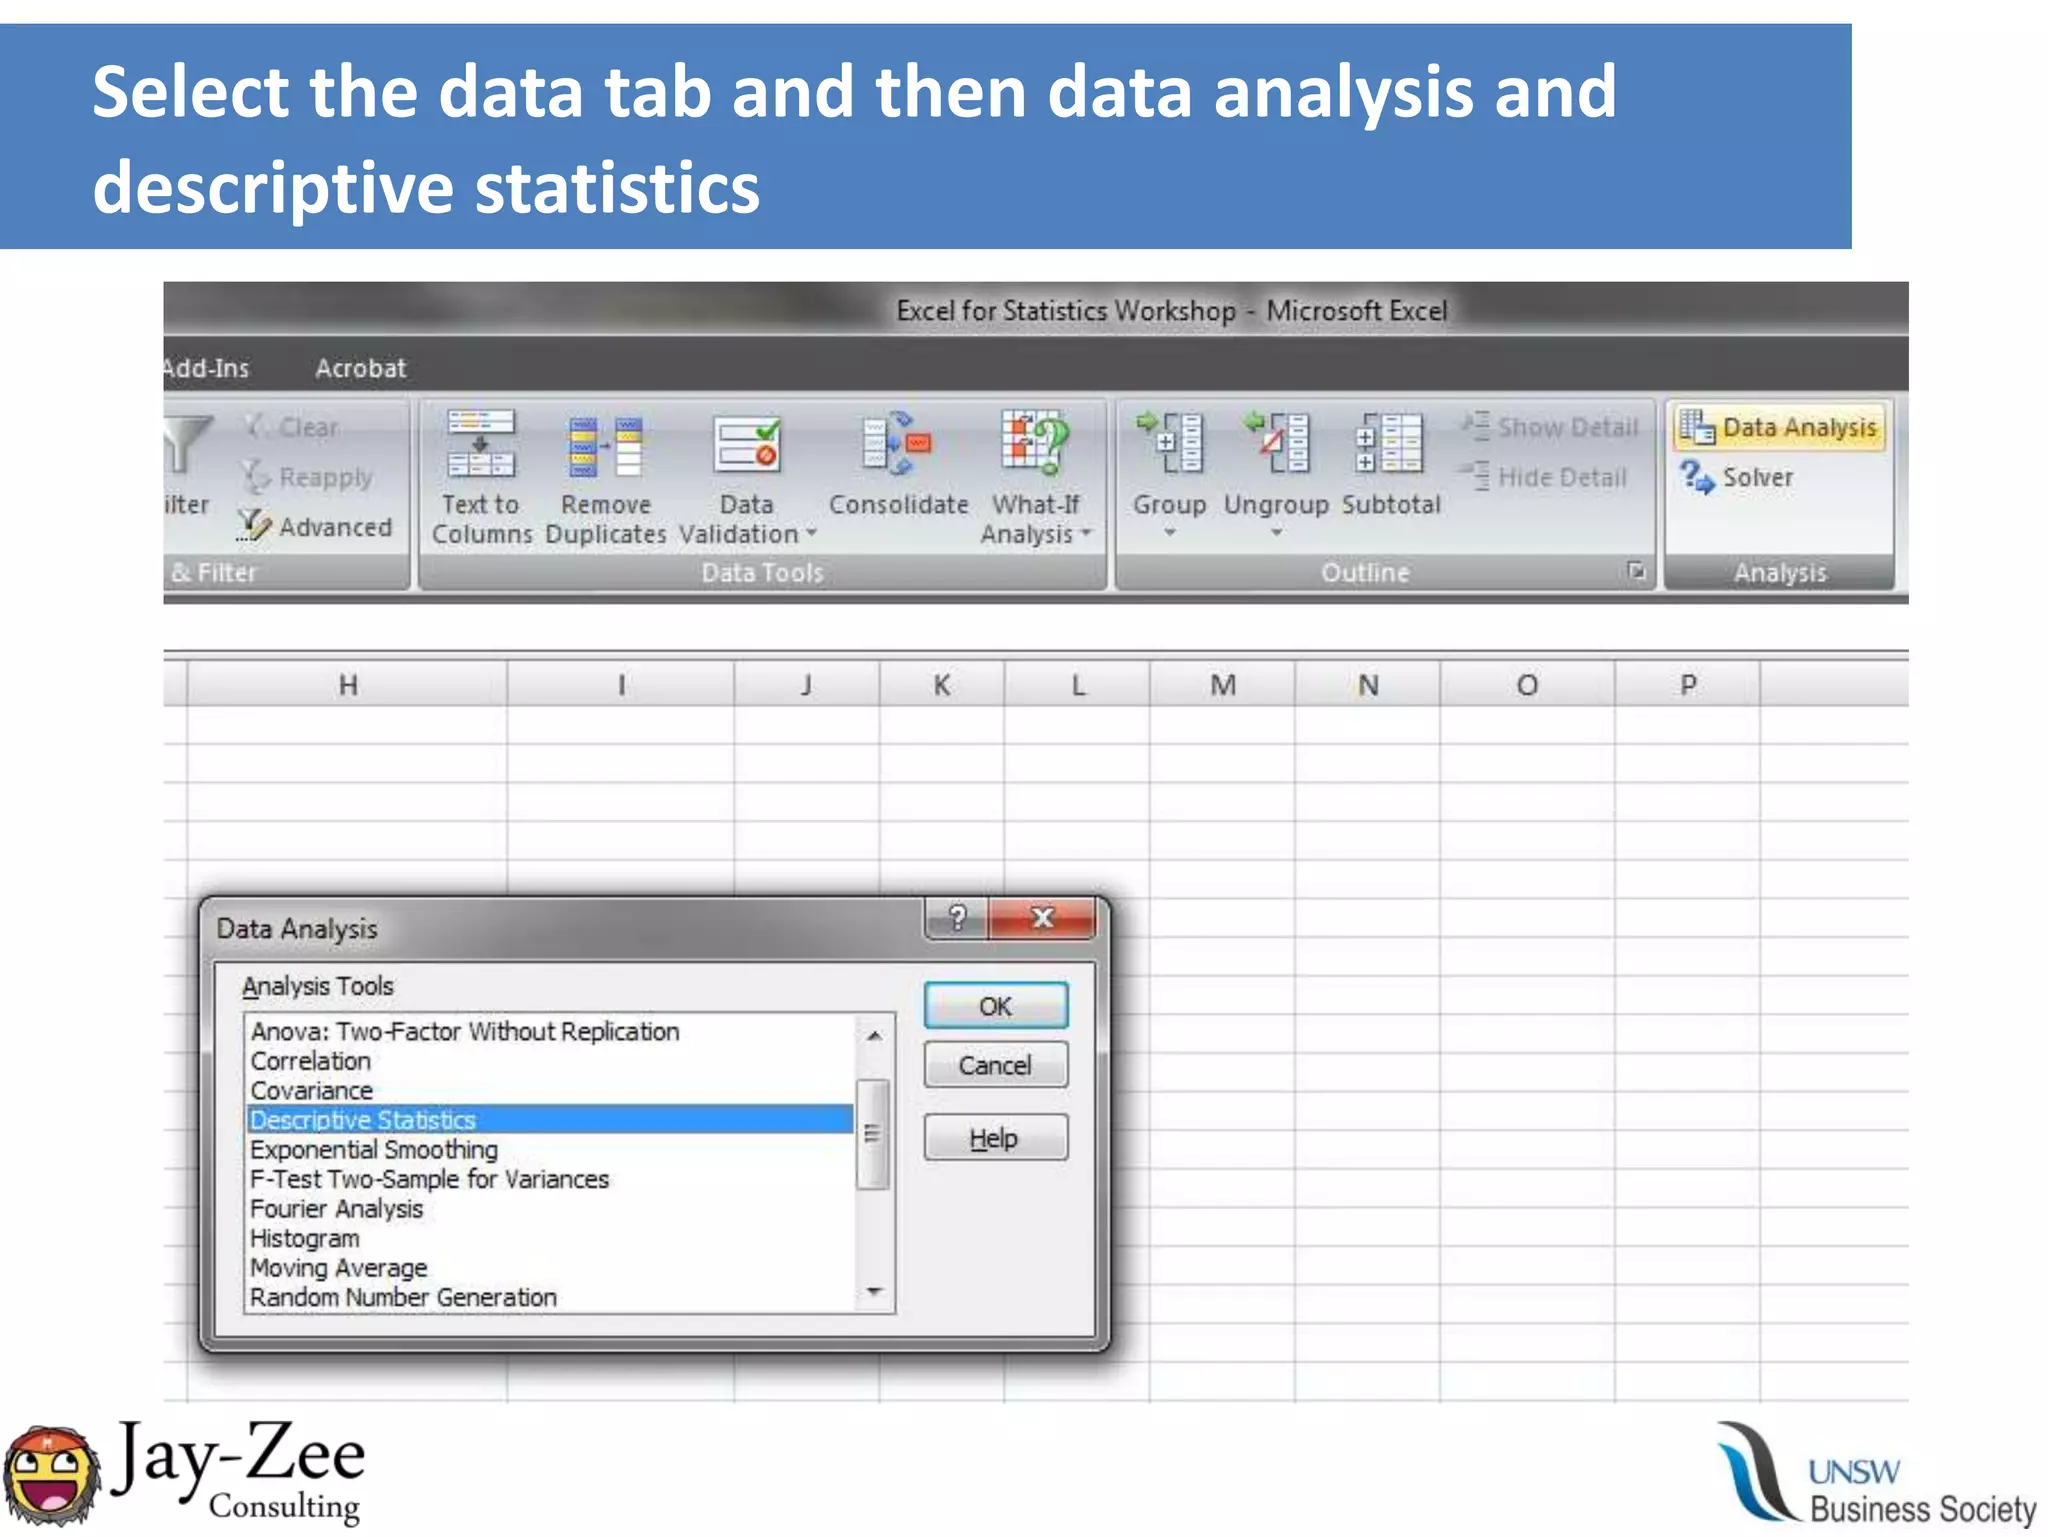
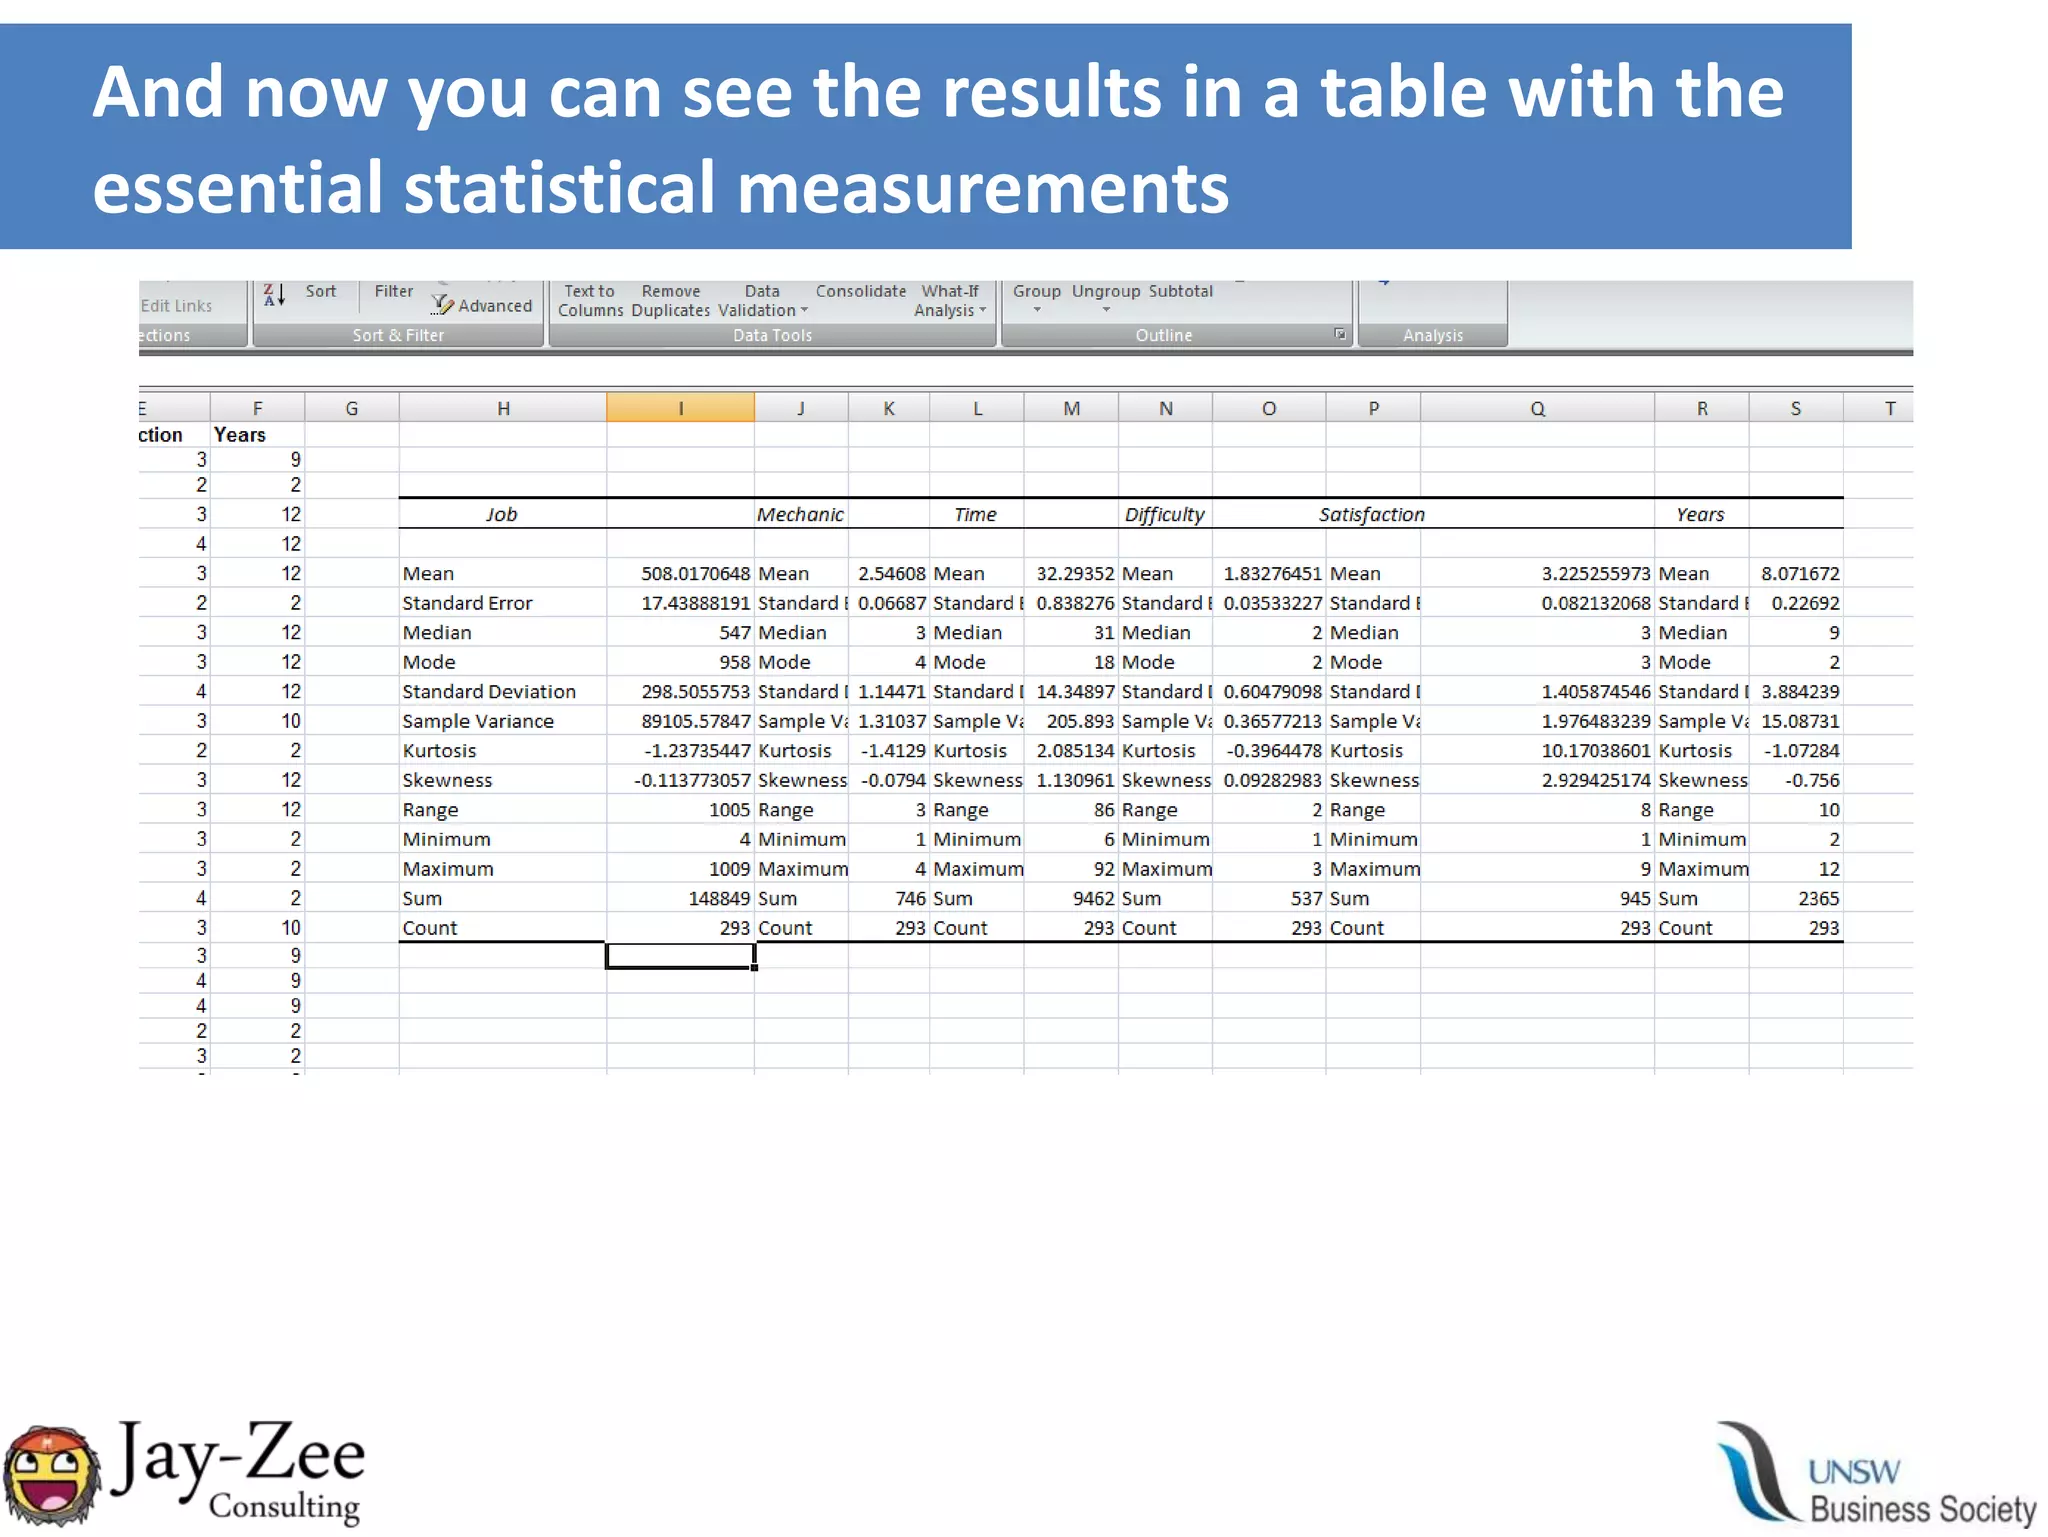
The data analysisfunction built into excel, but there are also other simple things like sort and filterEasiest way to do statistics, you get a summary of the data including mean, median and count
35.
This is greatwhen you just want a summary of the data
36.
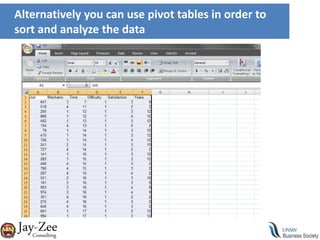
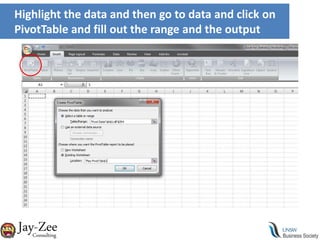
If you wantto separate the statistics for the information, simply filter and sort the information into the sections you need and then simply perform statistical analysis on those individual sectionsSortFilter
37.
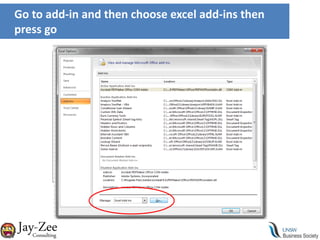
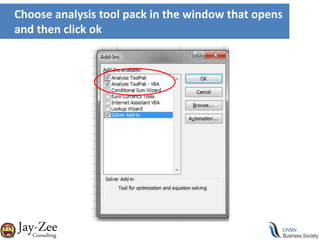
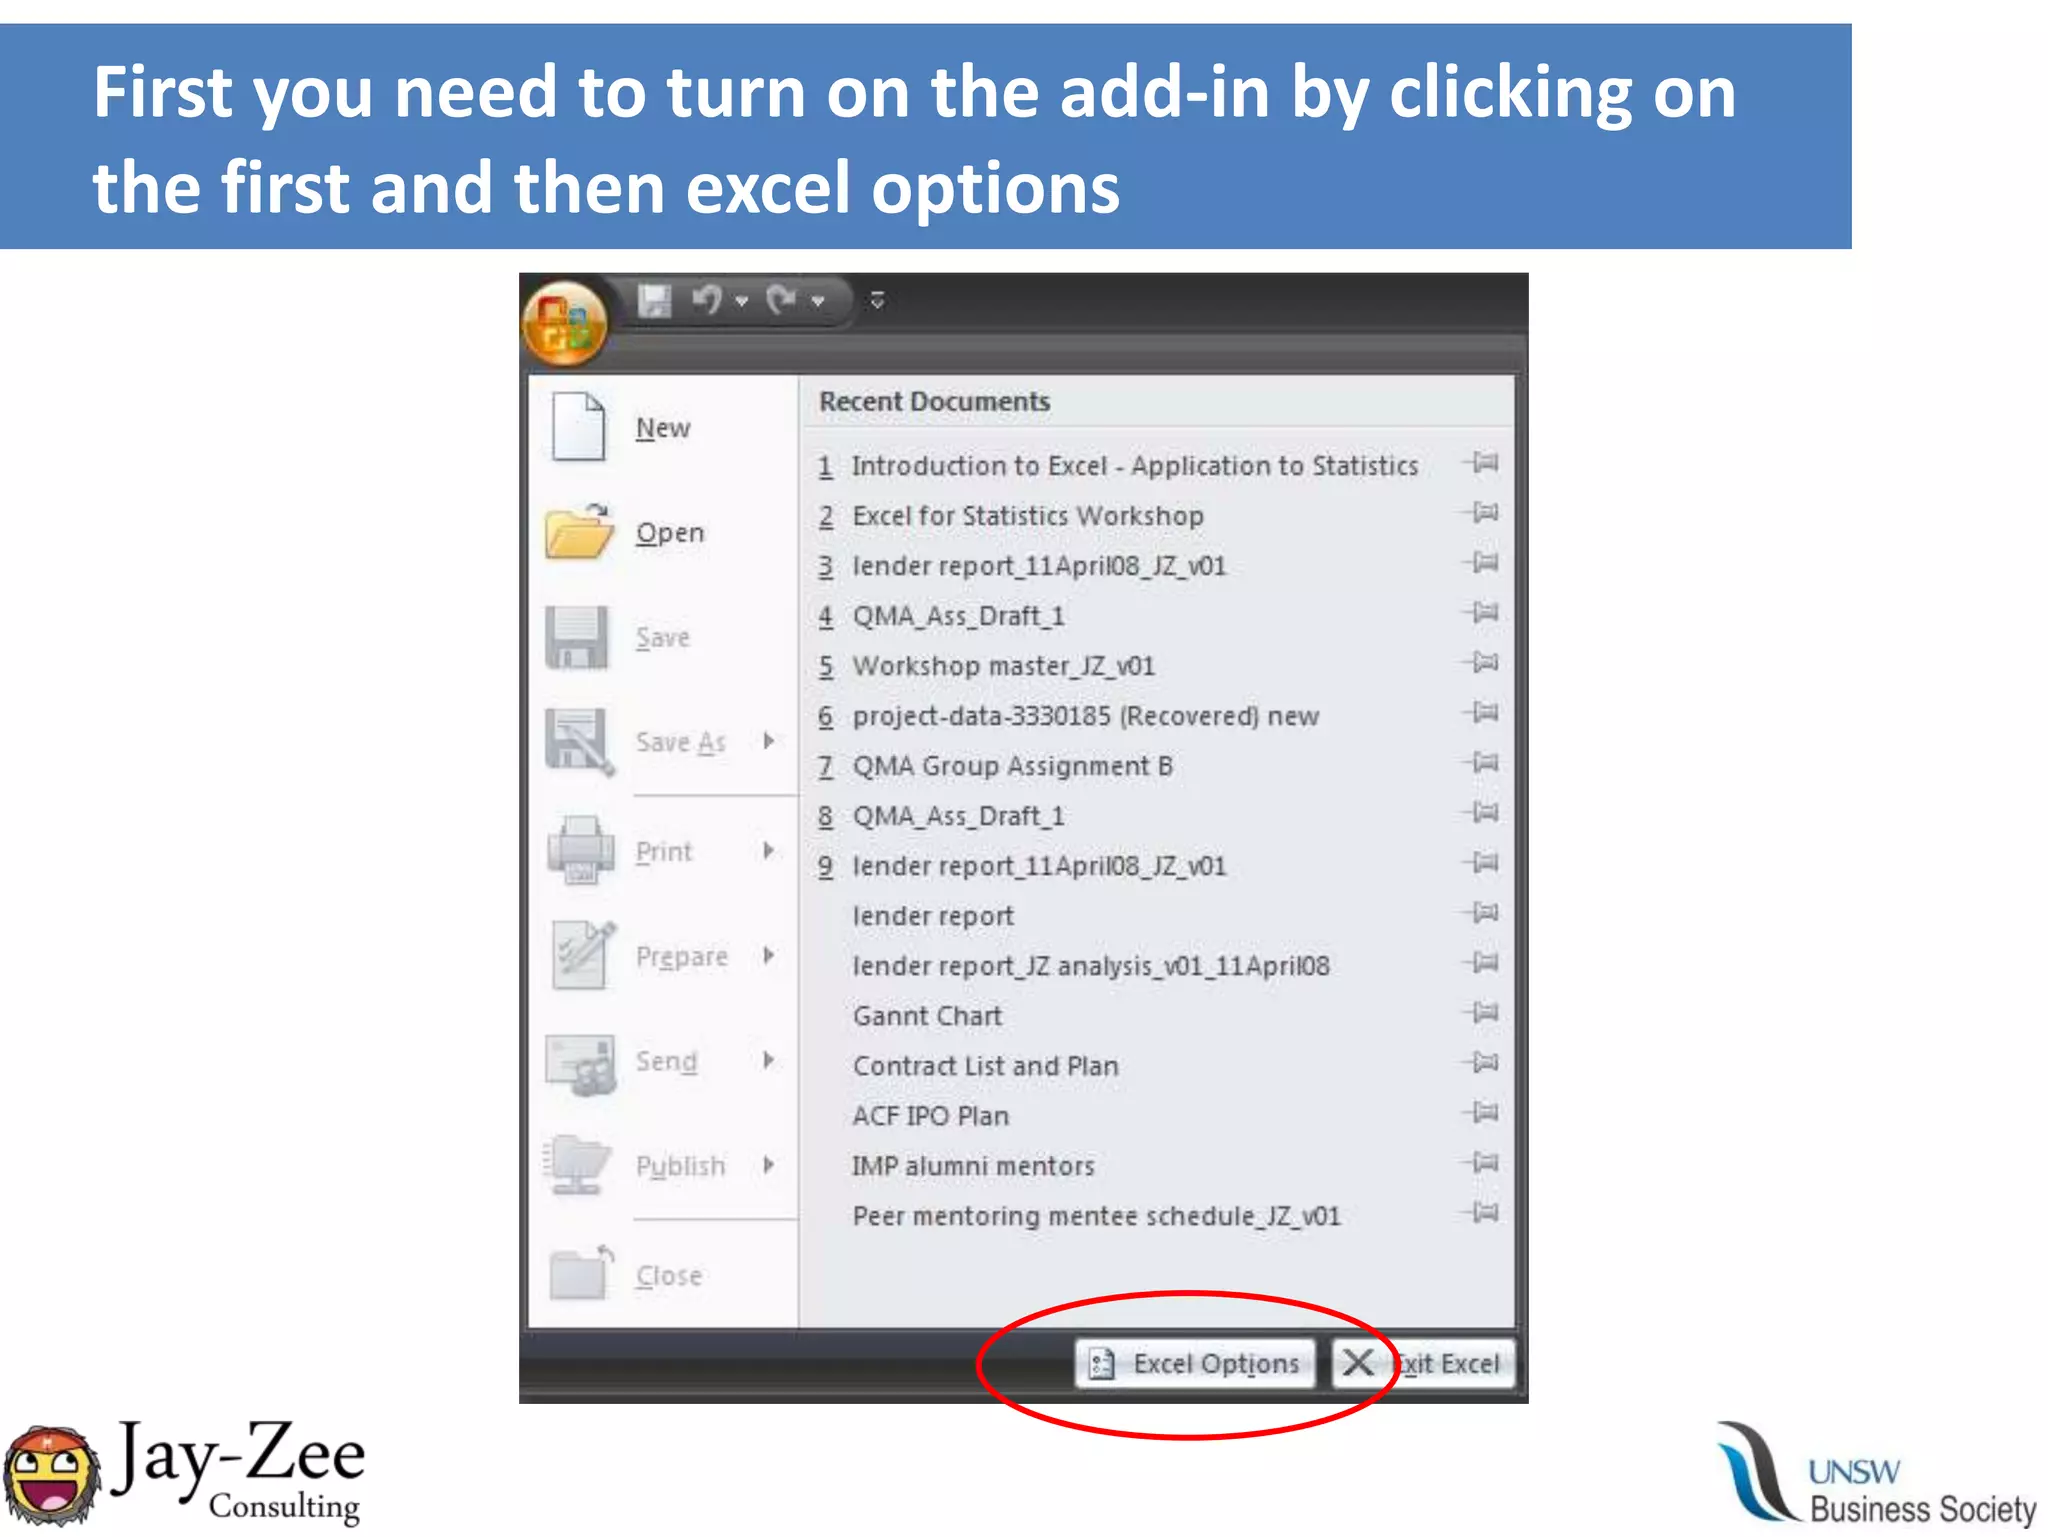
First you needto turn on the add-in by clicking on the first and then excel options
38.
Go to add-inand then choose excel add-ins then press go