Download as PDF, PPTX

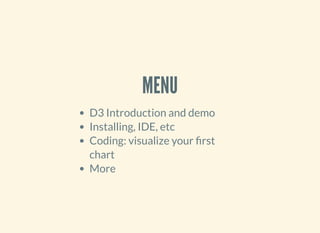


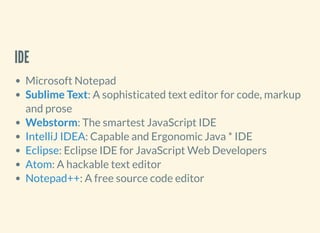

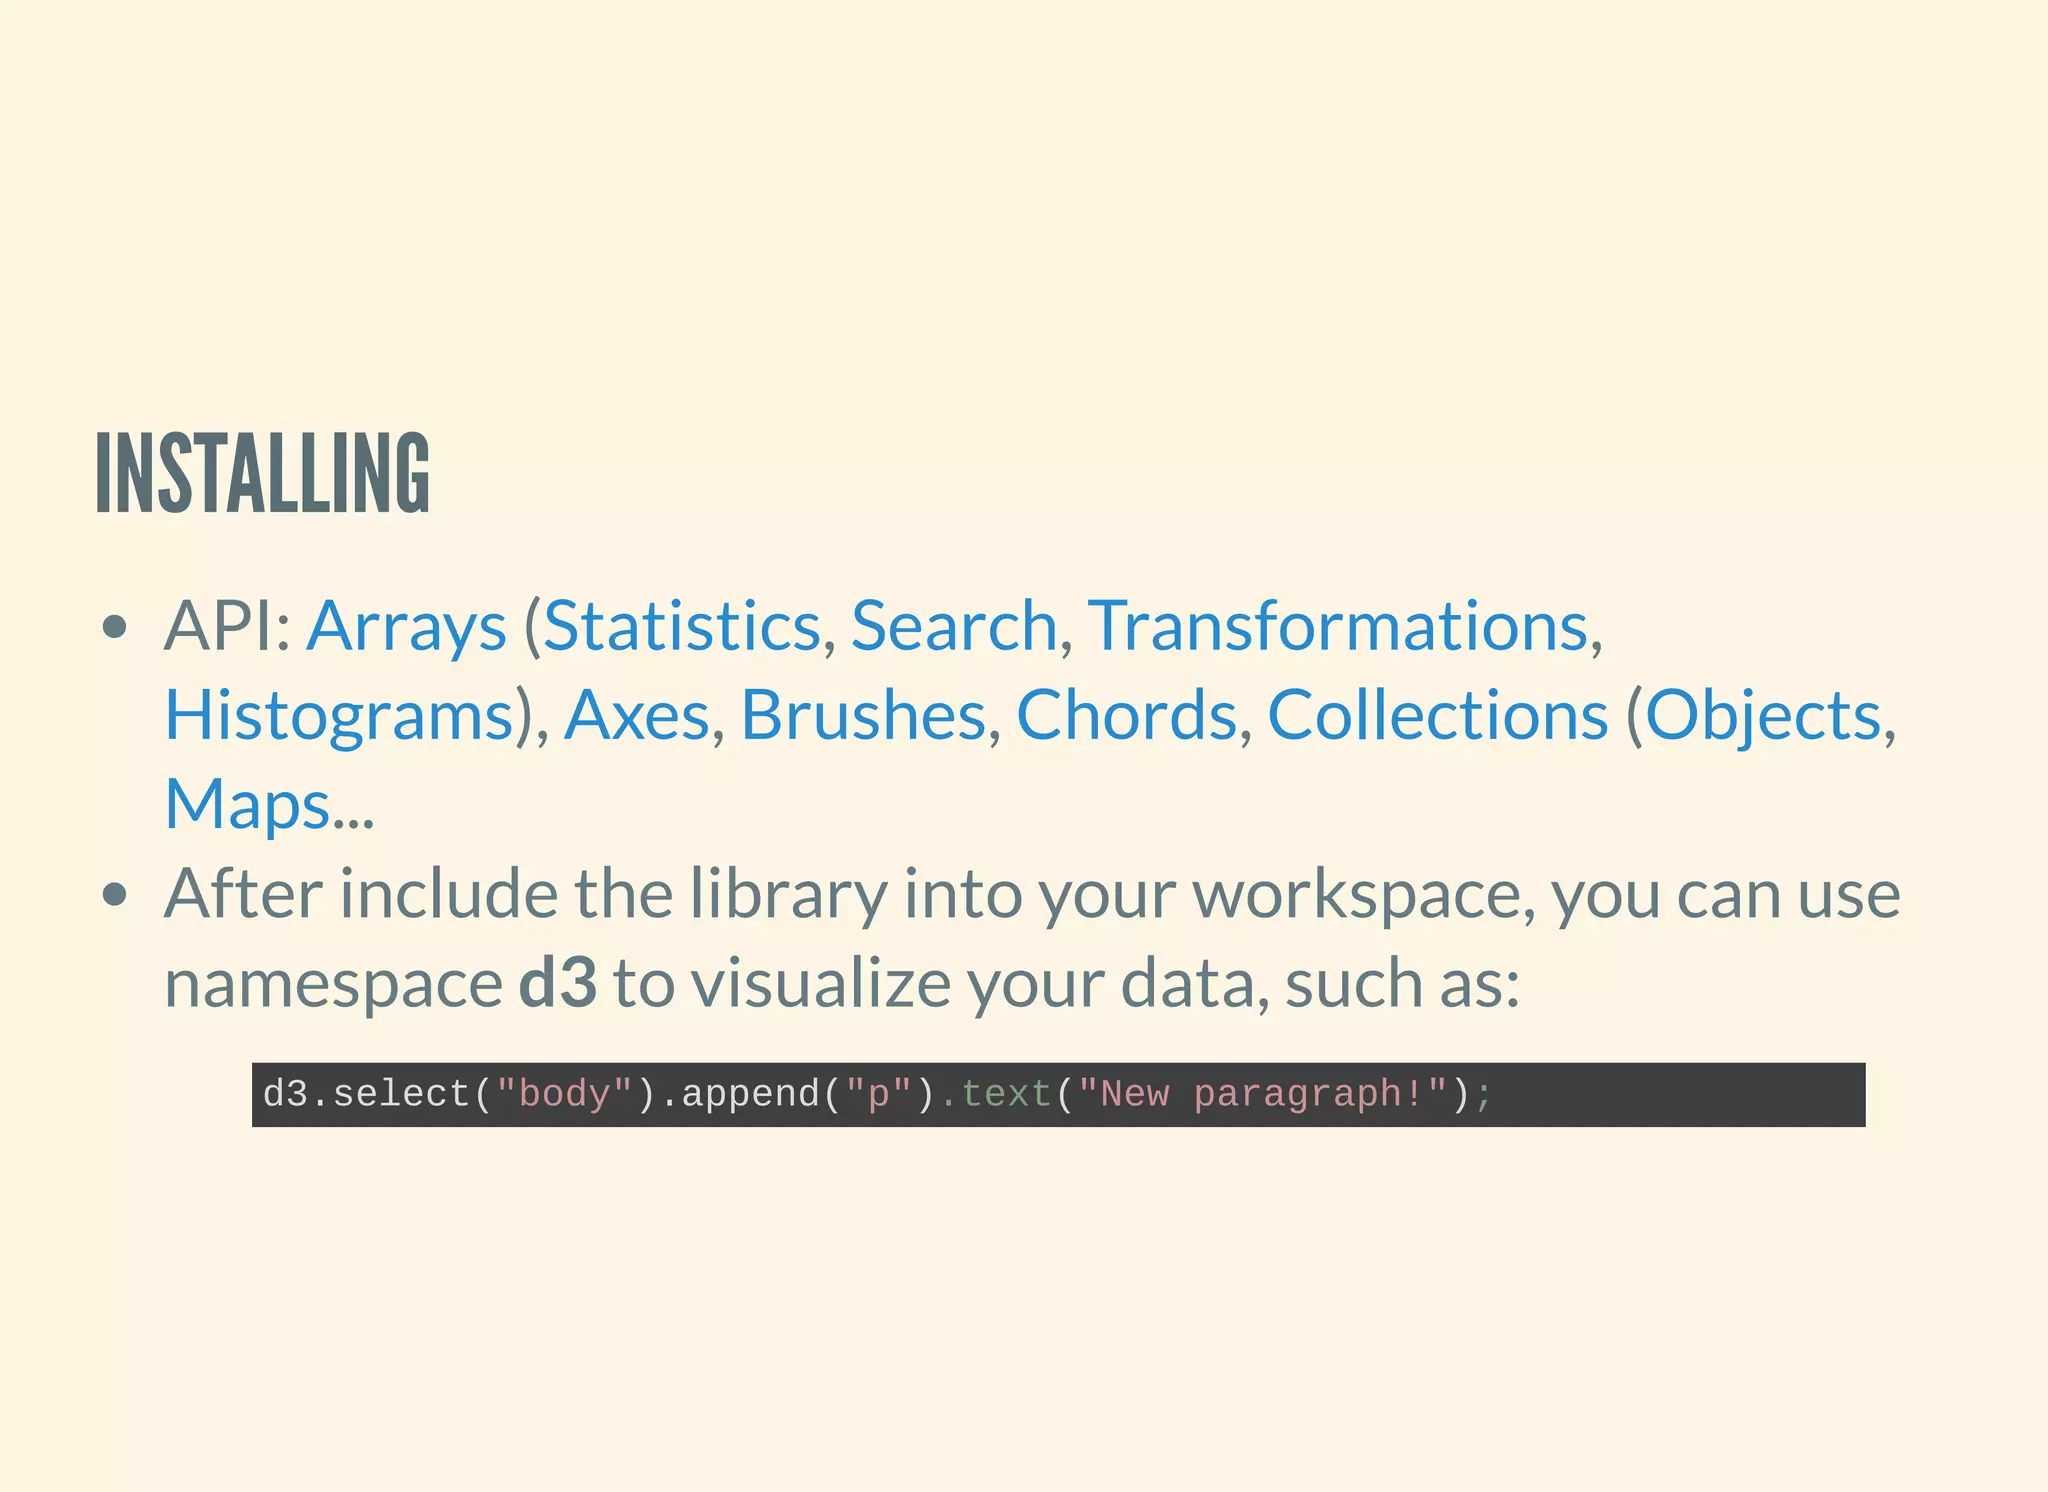
![2. INITIAL SVG AND SCALE
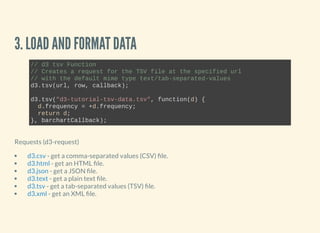
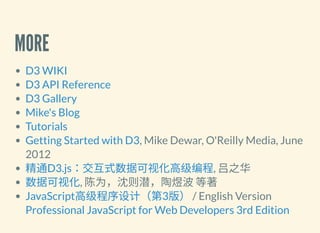
// append a svg element and define margins
var svg = d3.select("#barchart")
.append("svg")
.attr("width", 960)
.attr("height", 500),
margin = {top: 20, right: 20, bottom: 30, left: 40},
width = +svg.attr("width") margin.left margin.right,
height = +svg.attr("height") margin.top margin.bottom;
// Constructs a new band scale (x) and a new continuous scale (y)
var x = d3.scaleBand().rangeRound([0, width]).padding(0.1),
y = d3.scaleLinear().rangeRound([height, 0]);
// append g element
var transStr = "translate(" + margin.left + "," + margin.top + ")";
var g = svg.append("g")
.attr("transform", transStr);](https://image.slidesharecdn.com/5e53f57f-e22f-441b-a134-a1f5a7ba3f6a-161007073831/85/D3-Basic-Tutorial-16-320.jpg)
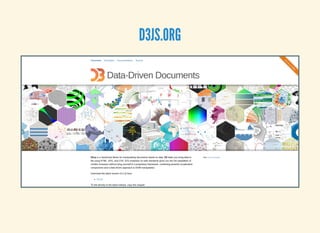
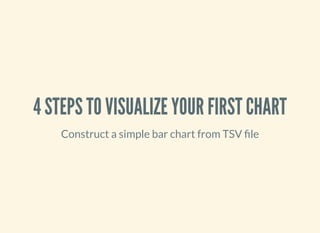
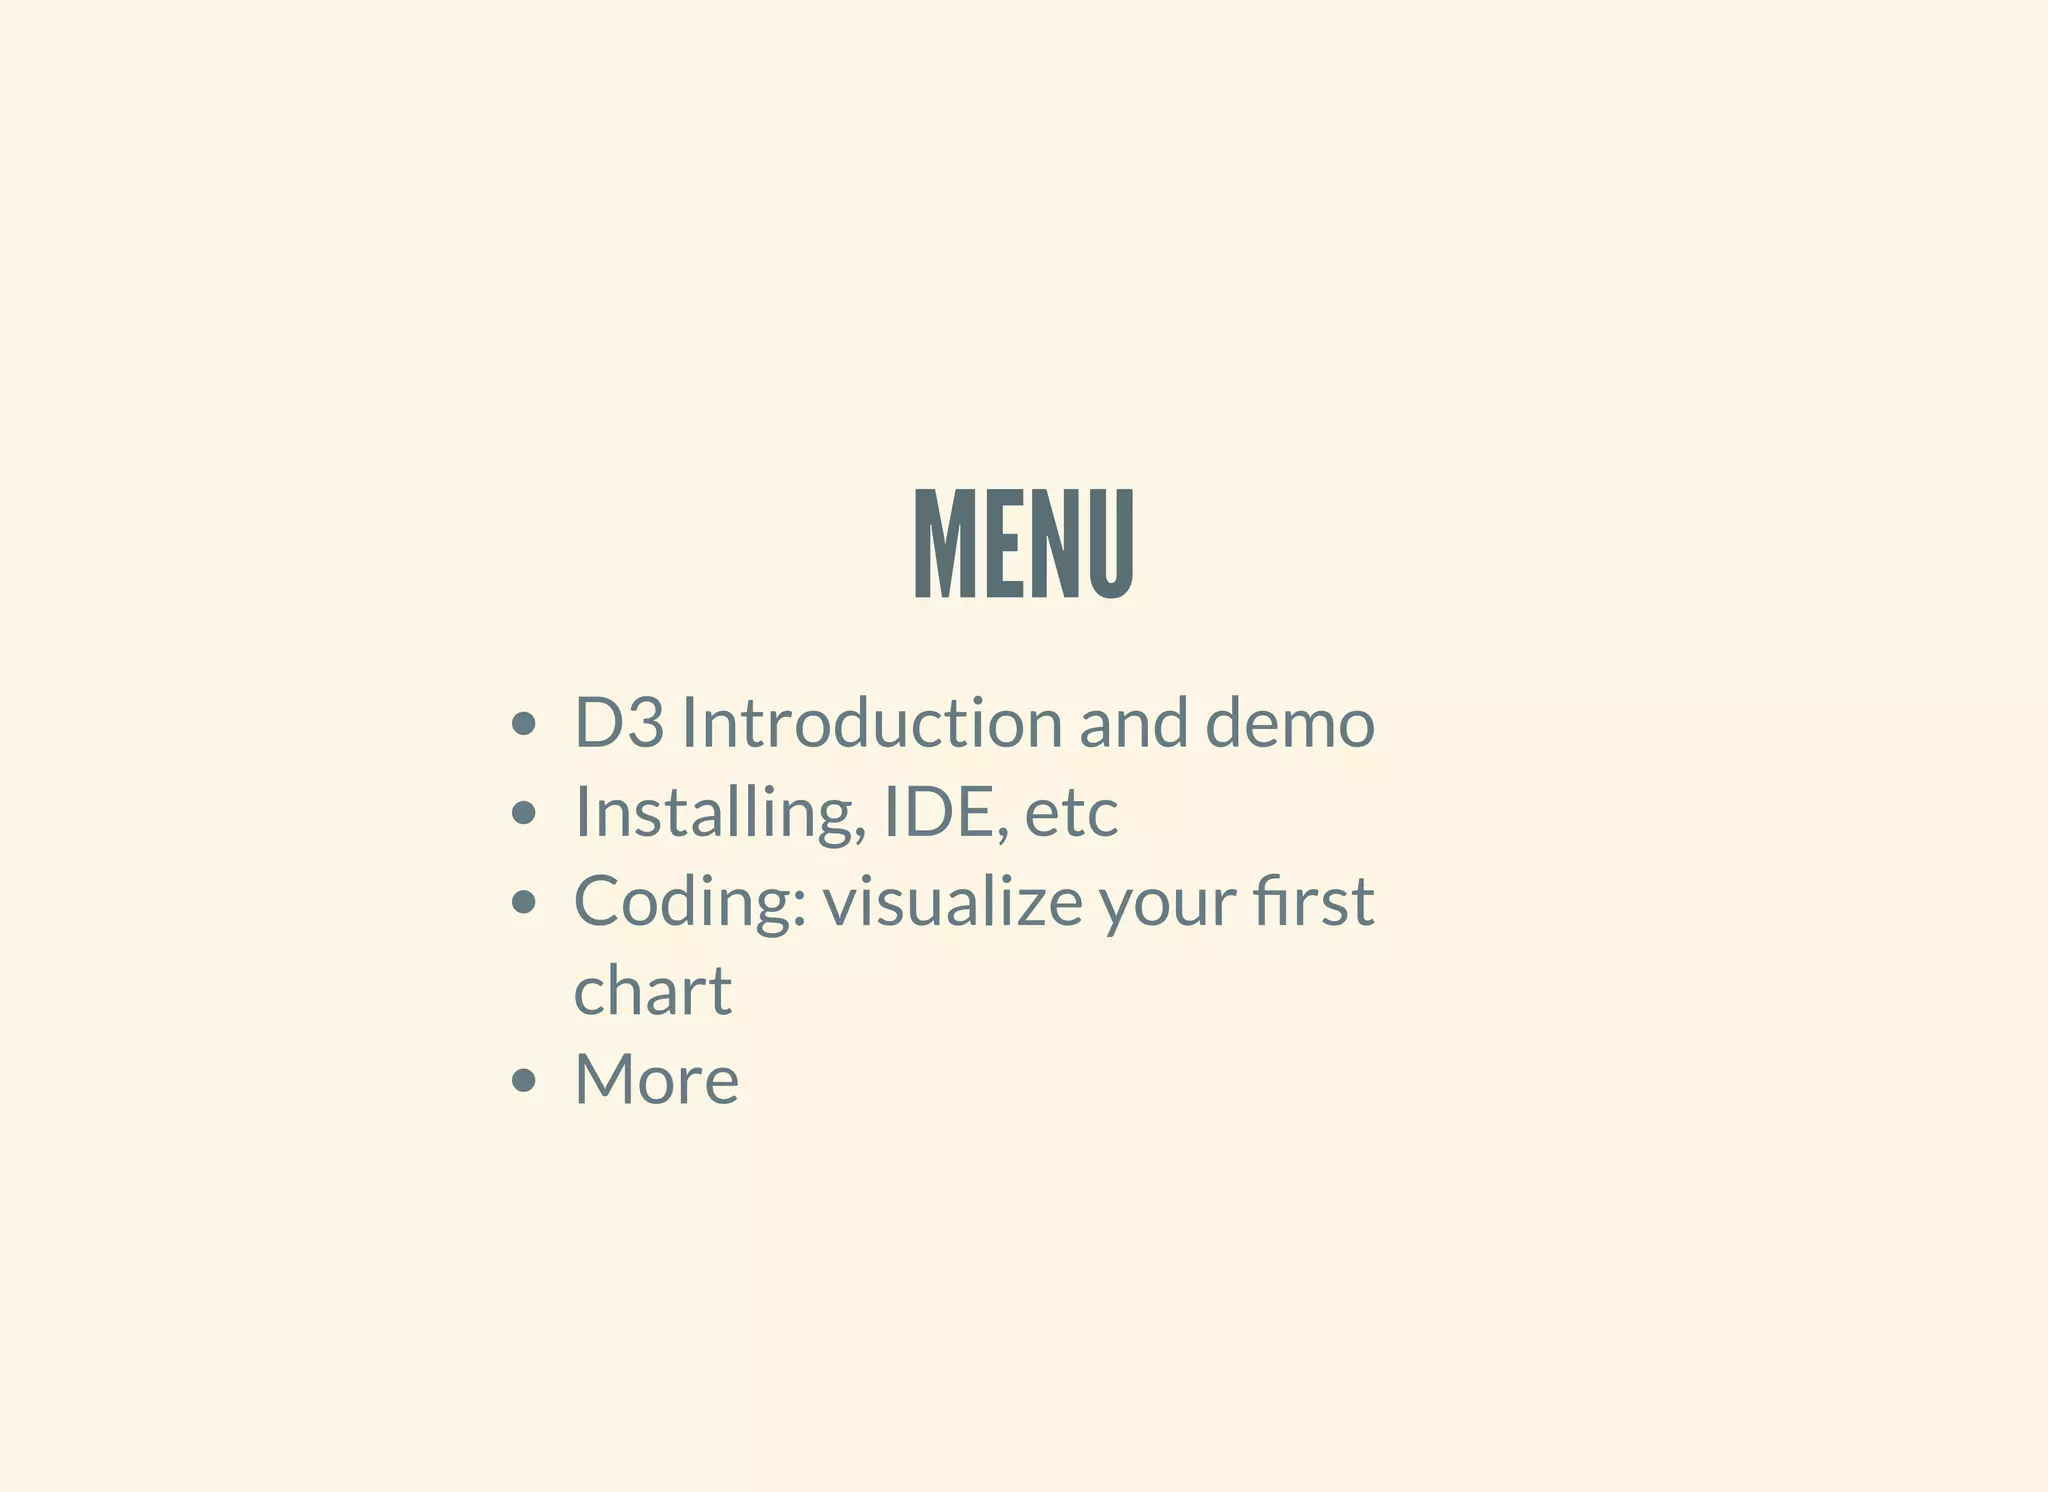
![4. BIND DATA AND UPDATE ELEMENT
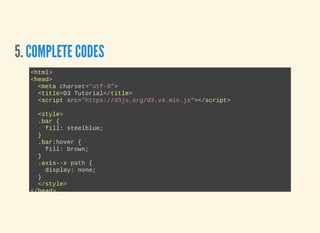
function barchartCallback(error, data) {
if (error) throw error;
// Given a value from the domain
// returns the corresponding value from the range.
x.domain(data.map(function(d) {
return d.letter;
}));
y.domain([0, d3.max(data, function(d) {
return d.frequency;
})]);
// x axis
g.append("g")
.attr("class", "axis axisx")
.attr("transform", "translate(0," + height + ")")
.call(d3.axisBottom(x));](https://image.slidesharecdn.com/5e53f57f-e22f-441b-a134-a1f5a7ba3f6a-161007073831/85/D3-Basic-Tutorial-18-320.jpg)


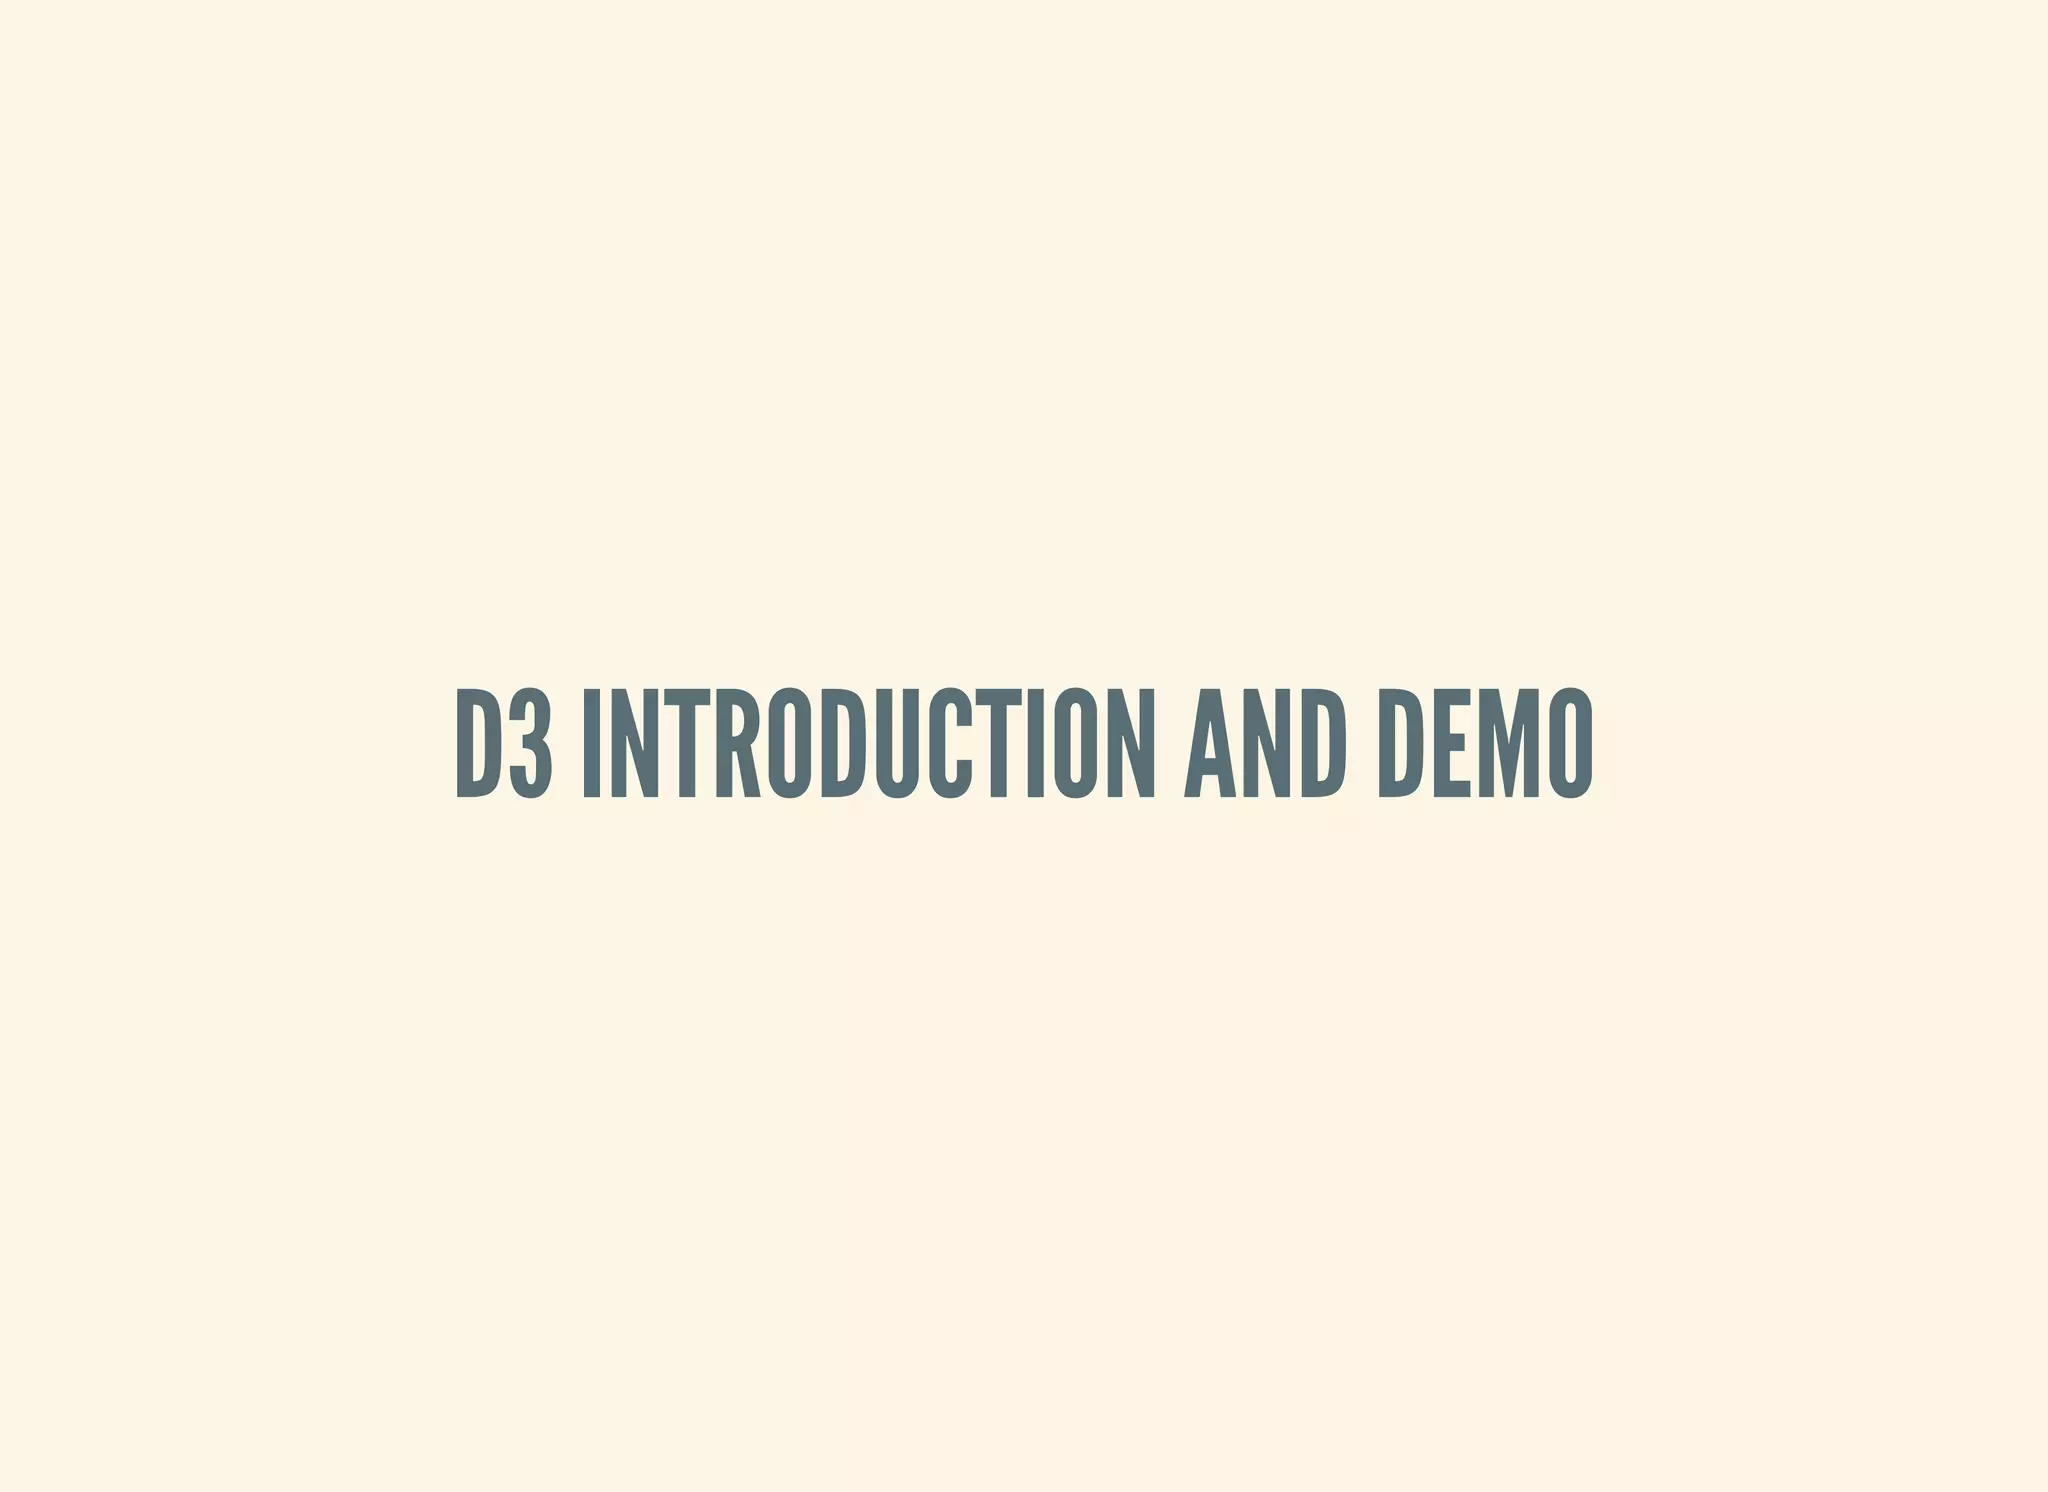


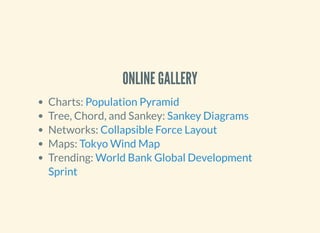
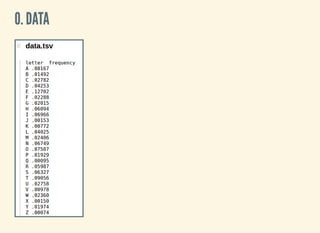
![2. INITIAL SVG AND SCALE
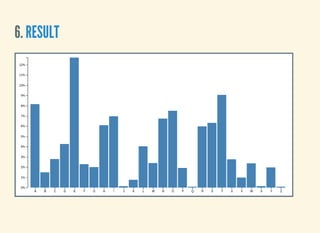
// append a svg element and define margins
var svg = d3.select("#barchart")
.append("svg")
.attr("width", 960)
.attr("height", 500),
margin = {top: 20, right: 20, bottom: 30, left: 40},
width = +svg.attr("width") margin.left margin.right,
height = +svg.attr("height") margin.top margin.bottom;
// Constructs a new band scale (x) and a new continuous scale (y)
var x = d3.scaleBand().rangeRound([0, width]).padding(0.1),
y = d3.scaleLinear().rangeRound([height, 0]);
// append g element
var transStr = "translate(" + margin.left + "," + margin.top + ")";
var g = svg.append("g")
.attr("transform", transStr);](https://image.slidesharecdn.com/5e53f57f-e22f-441b-a134-a1f5a7ba3f6a-161007073831/75/D3-Basic-Tutorial-16-2048.jpg)
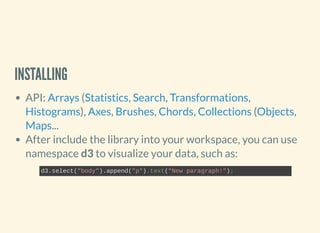
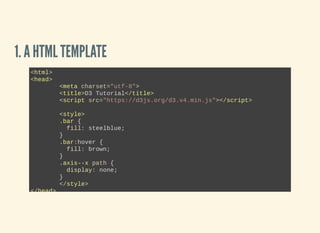
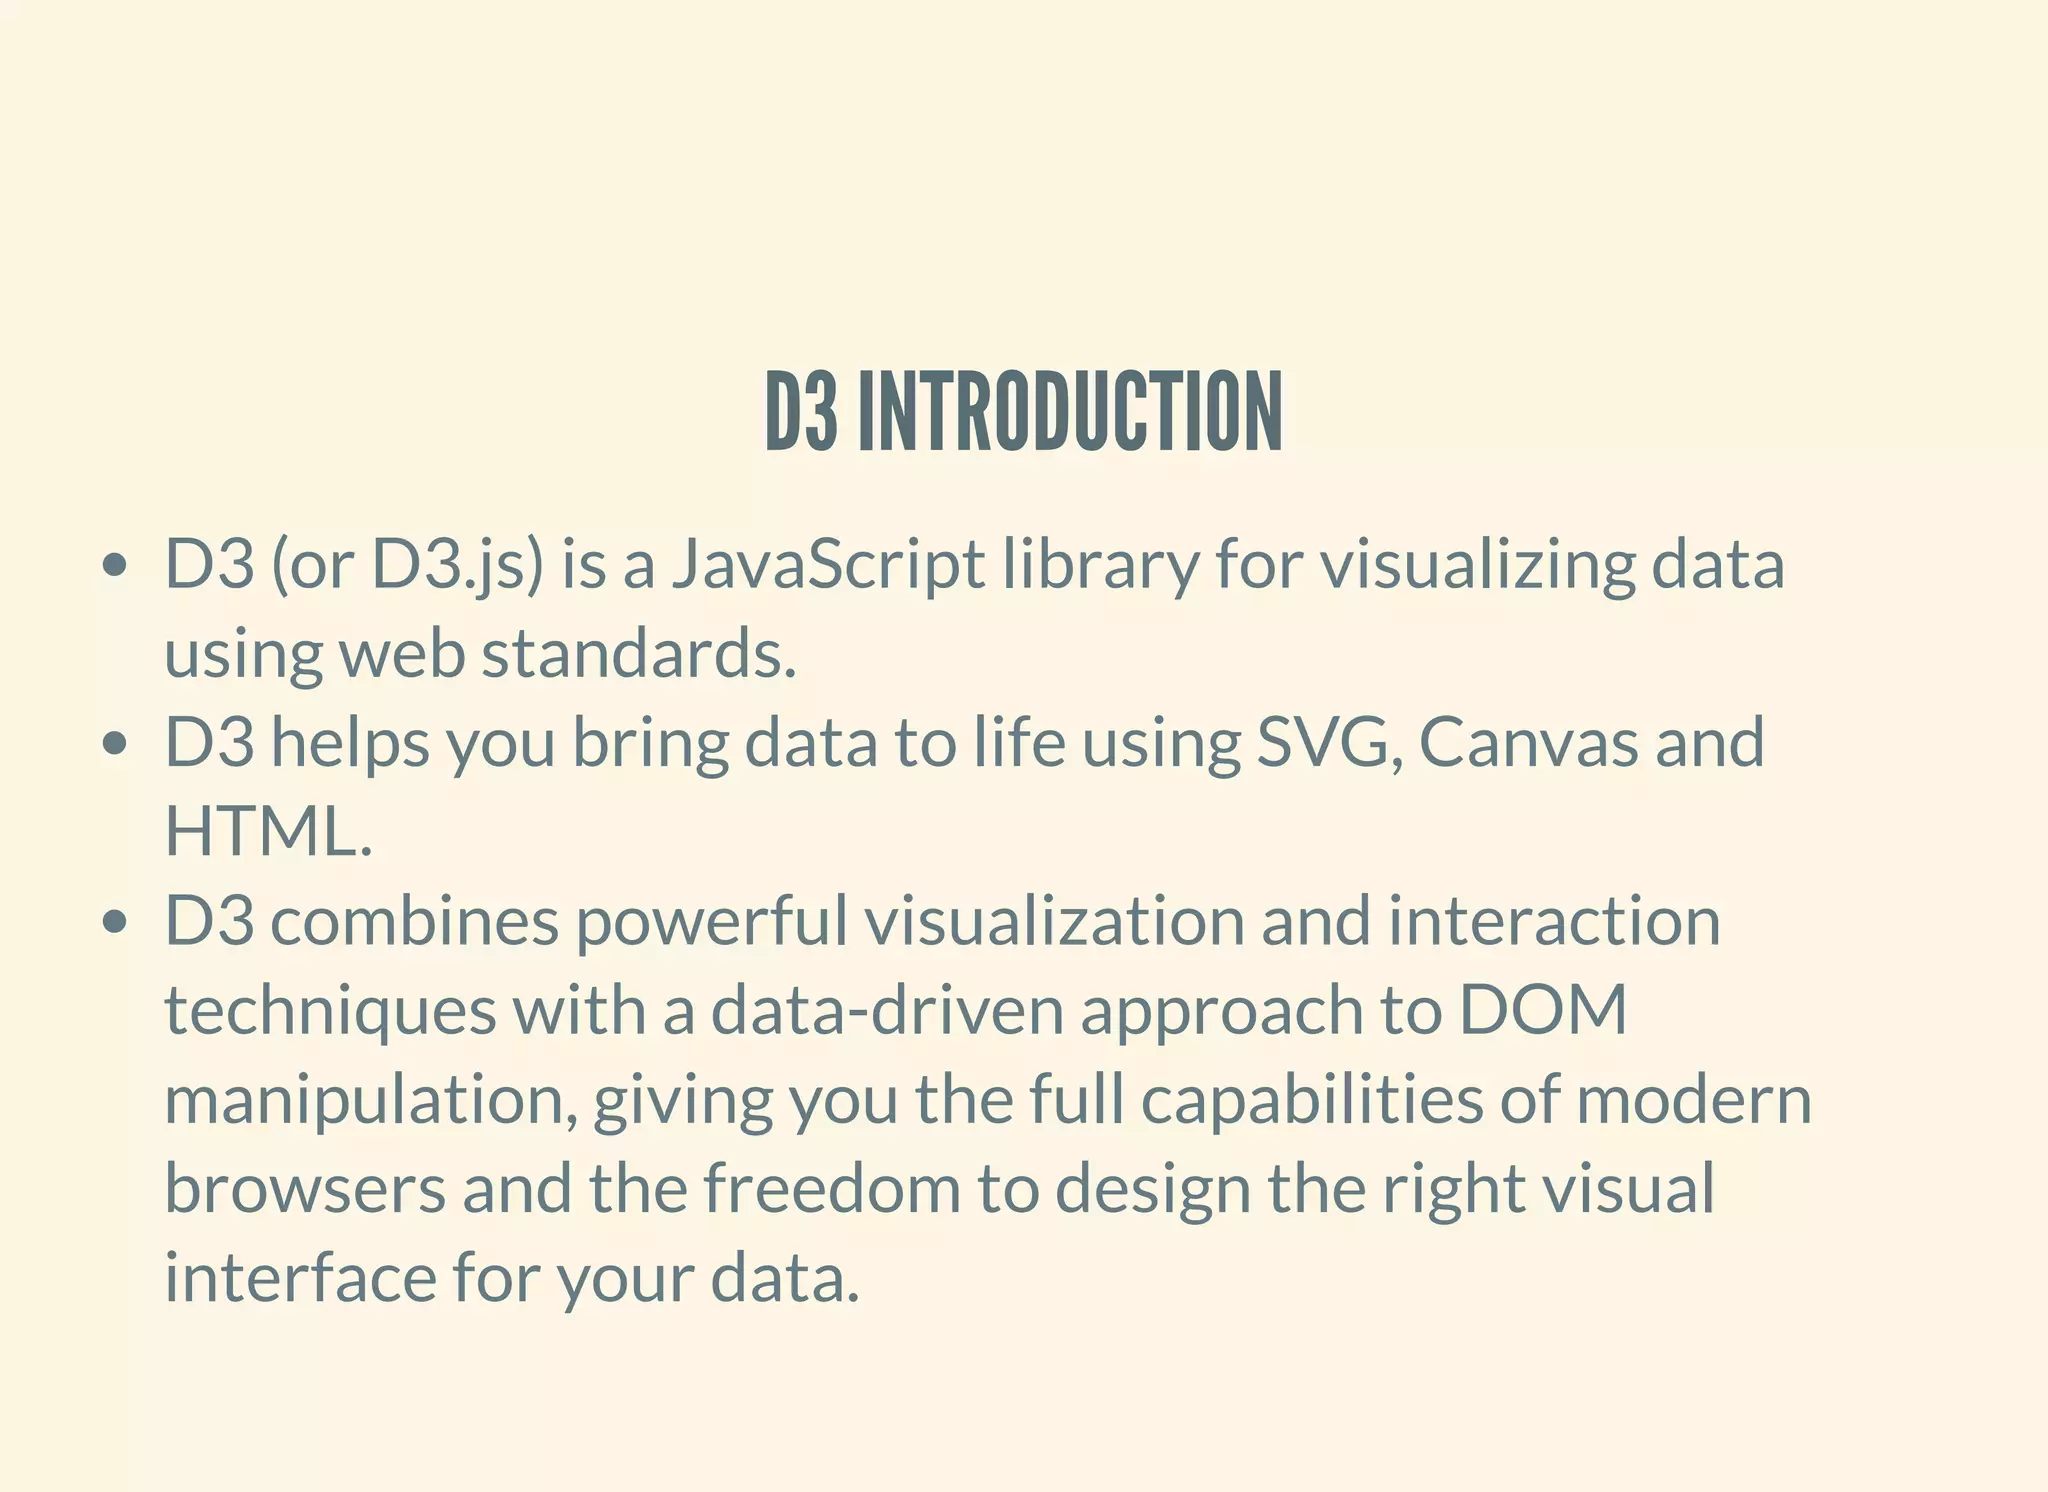
![4. BIND DATA AND UPDATE ELEMENT
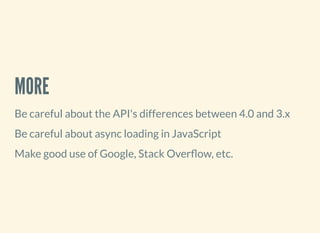
function barchartCallback(error, data) {
if (error) throw error;
// Given a value from the domain
// returns the corresponding value from the range.
x.domain(data.map(function(d) {
return d.letter;
}));
y.domain([0, d3.max(data, function(d) {
return d.frequency;
})]);
// x axis
g.append("g")
.attr("class", "axis axisx")
.attr("transform", "translate(0," + height + ")")
.call(d3.axisBottom(x));](https://image.slidesharecdn.com/5e53f57f-e22f-441b-a134-a1f5a7ba3f6a-161007073831/75/D3-Basic-Tutorial-18-2048.jpg)
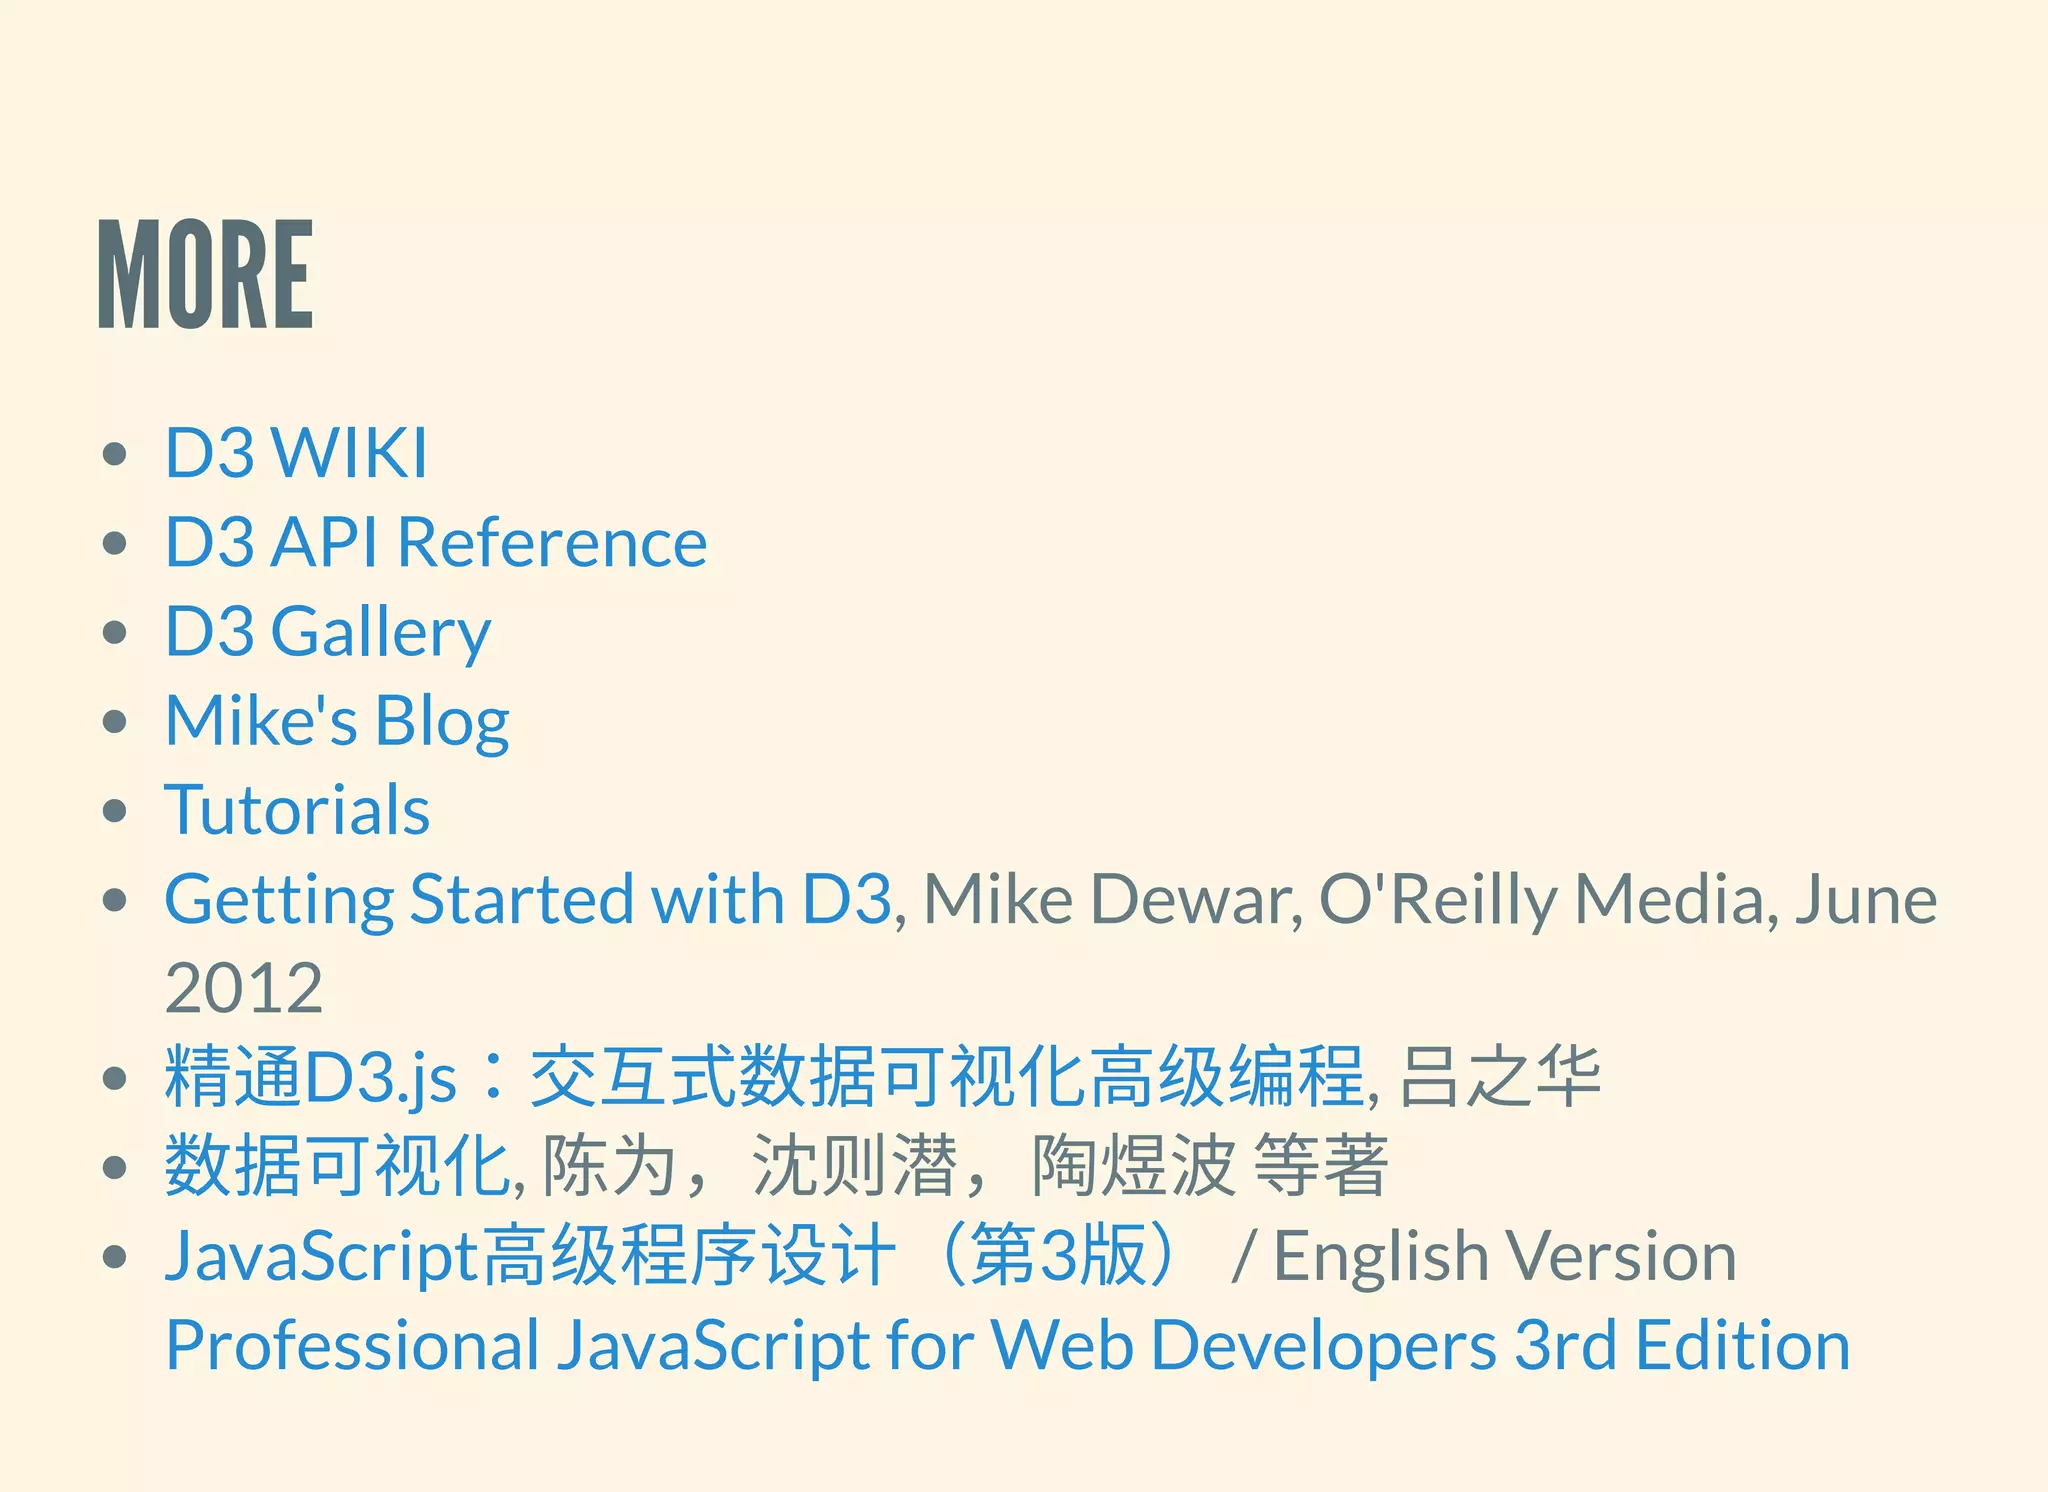


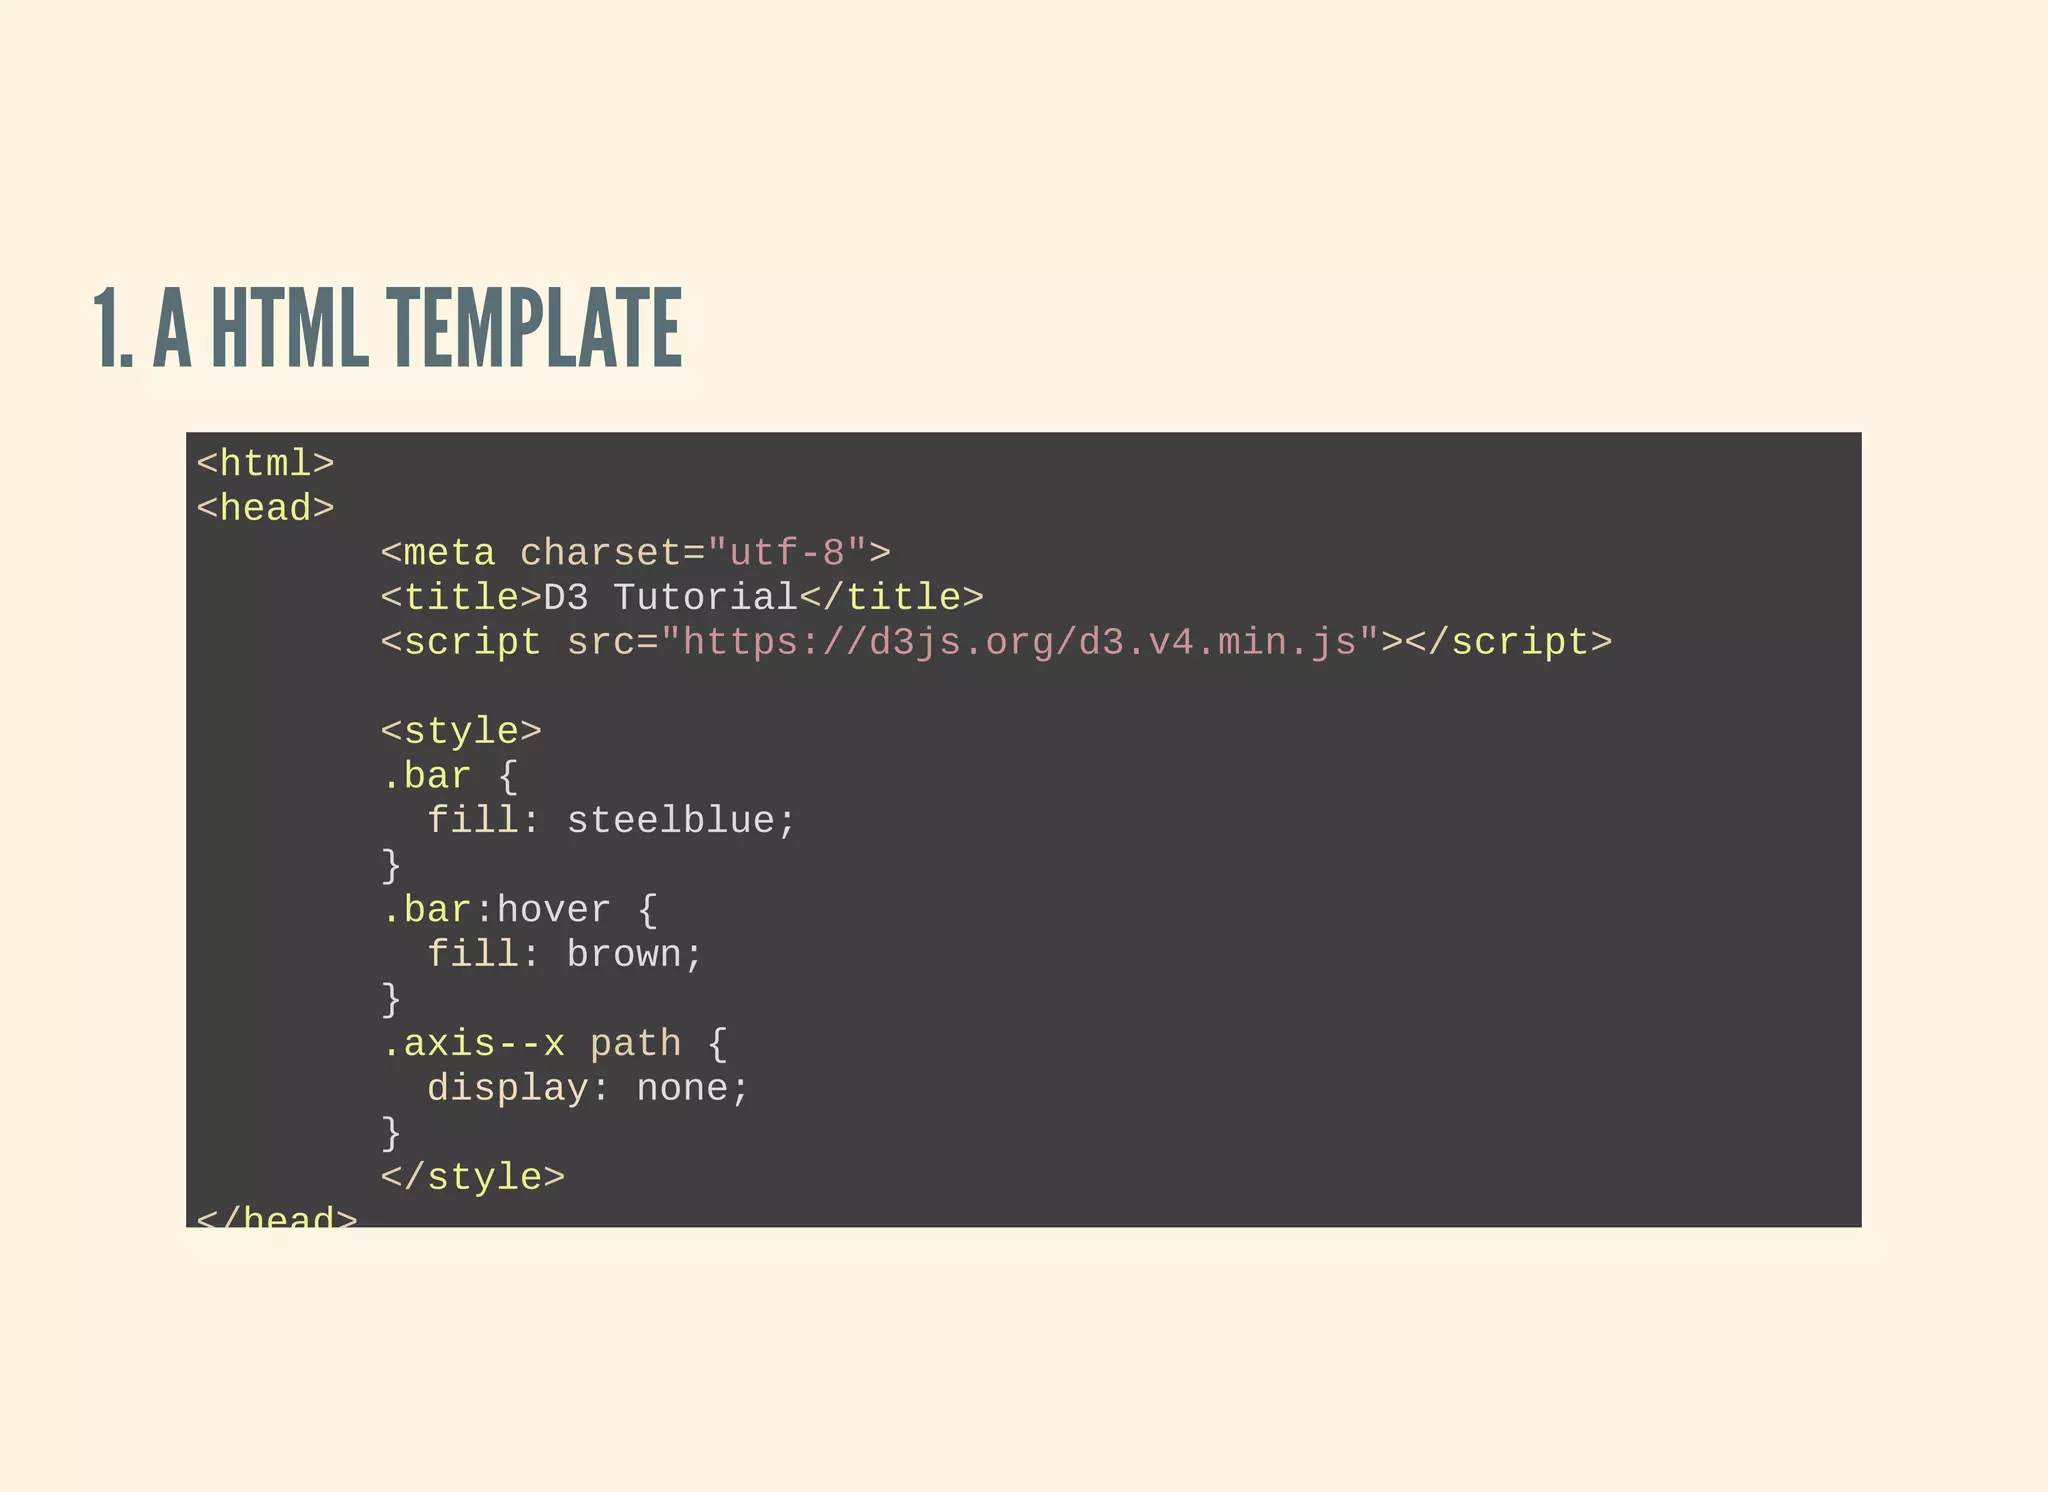
This document provides an introduction and overview of D3 (D3.js), an open-source JavaScript library for visualizing data using web standards like SVG, HTML and CSS. It discusses how to install D3, introduces common chart types like trees, networks and maps, and provides a 4-step tutorial for creating a basic bar chart from TSV data to get started with visualizing data in D3. The document recommends additional learning resources for diving deeper into D3.


