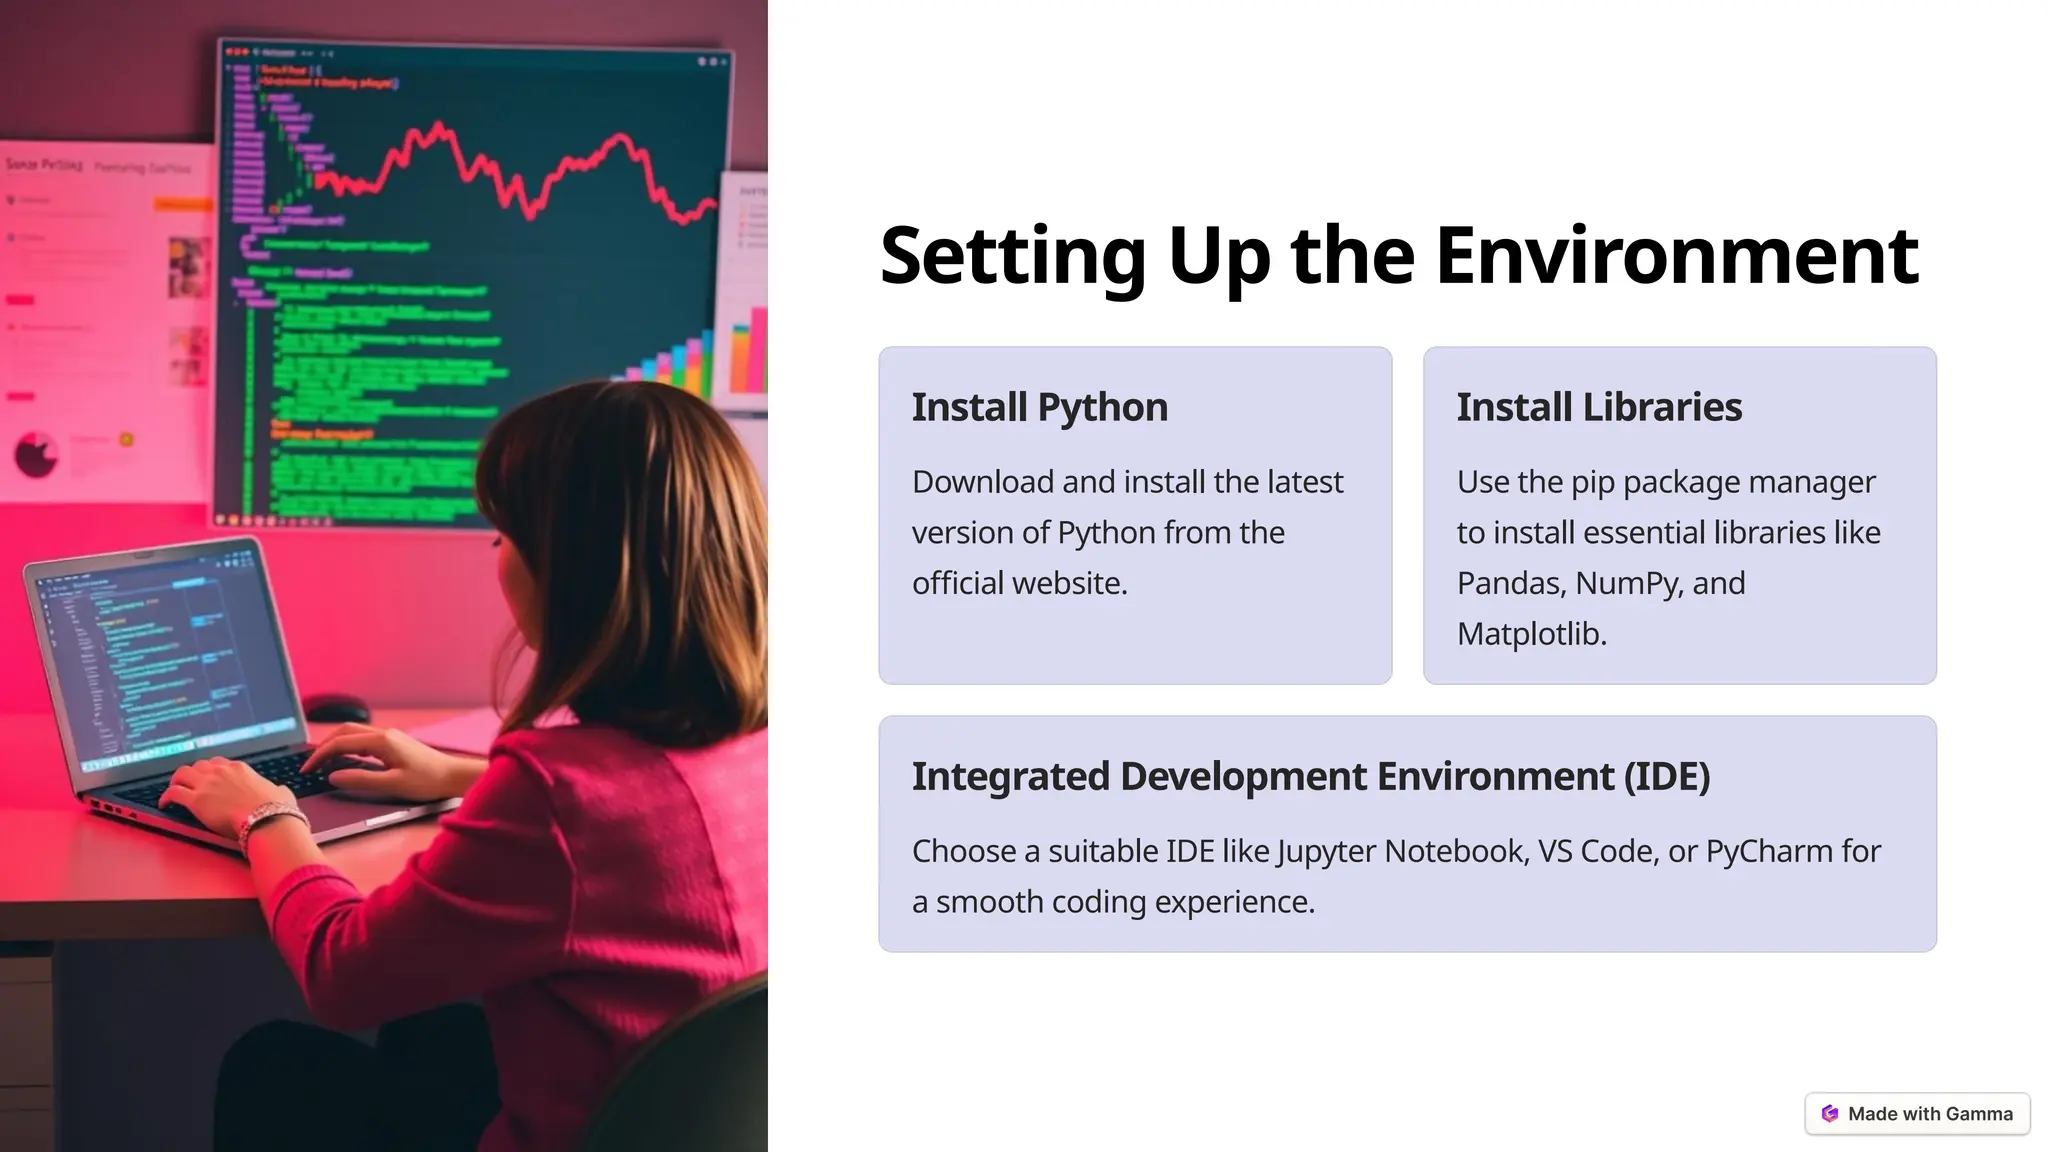
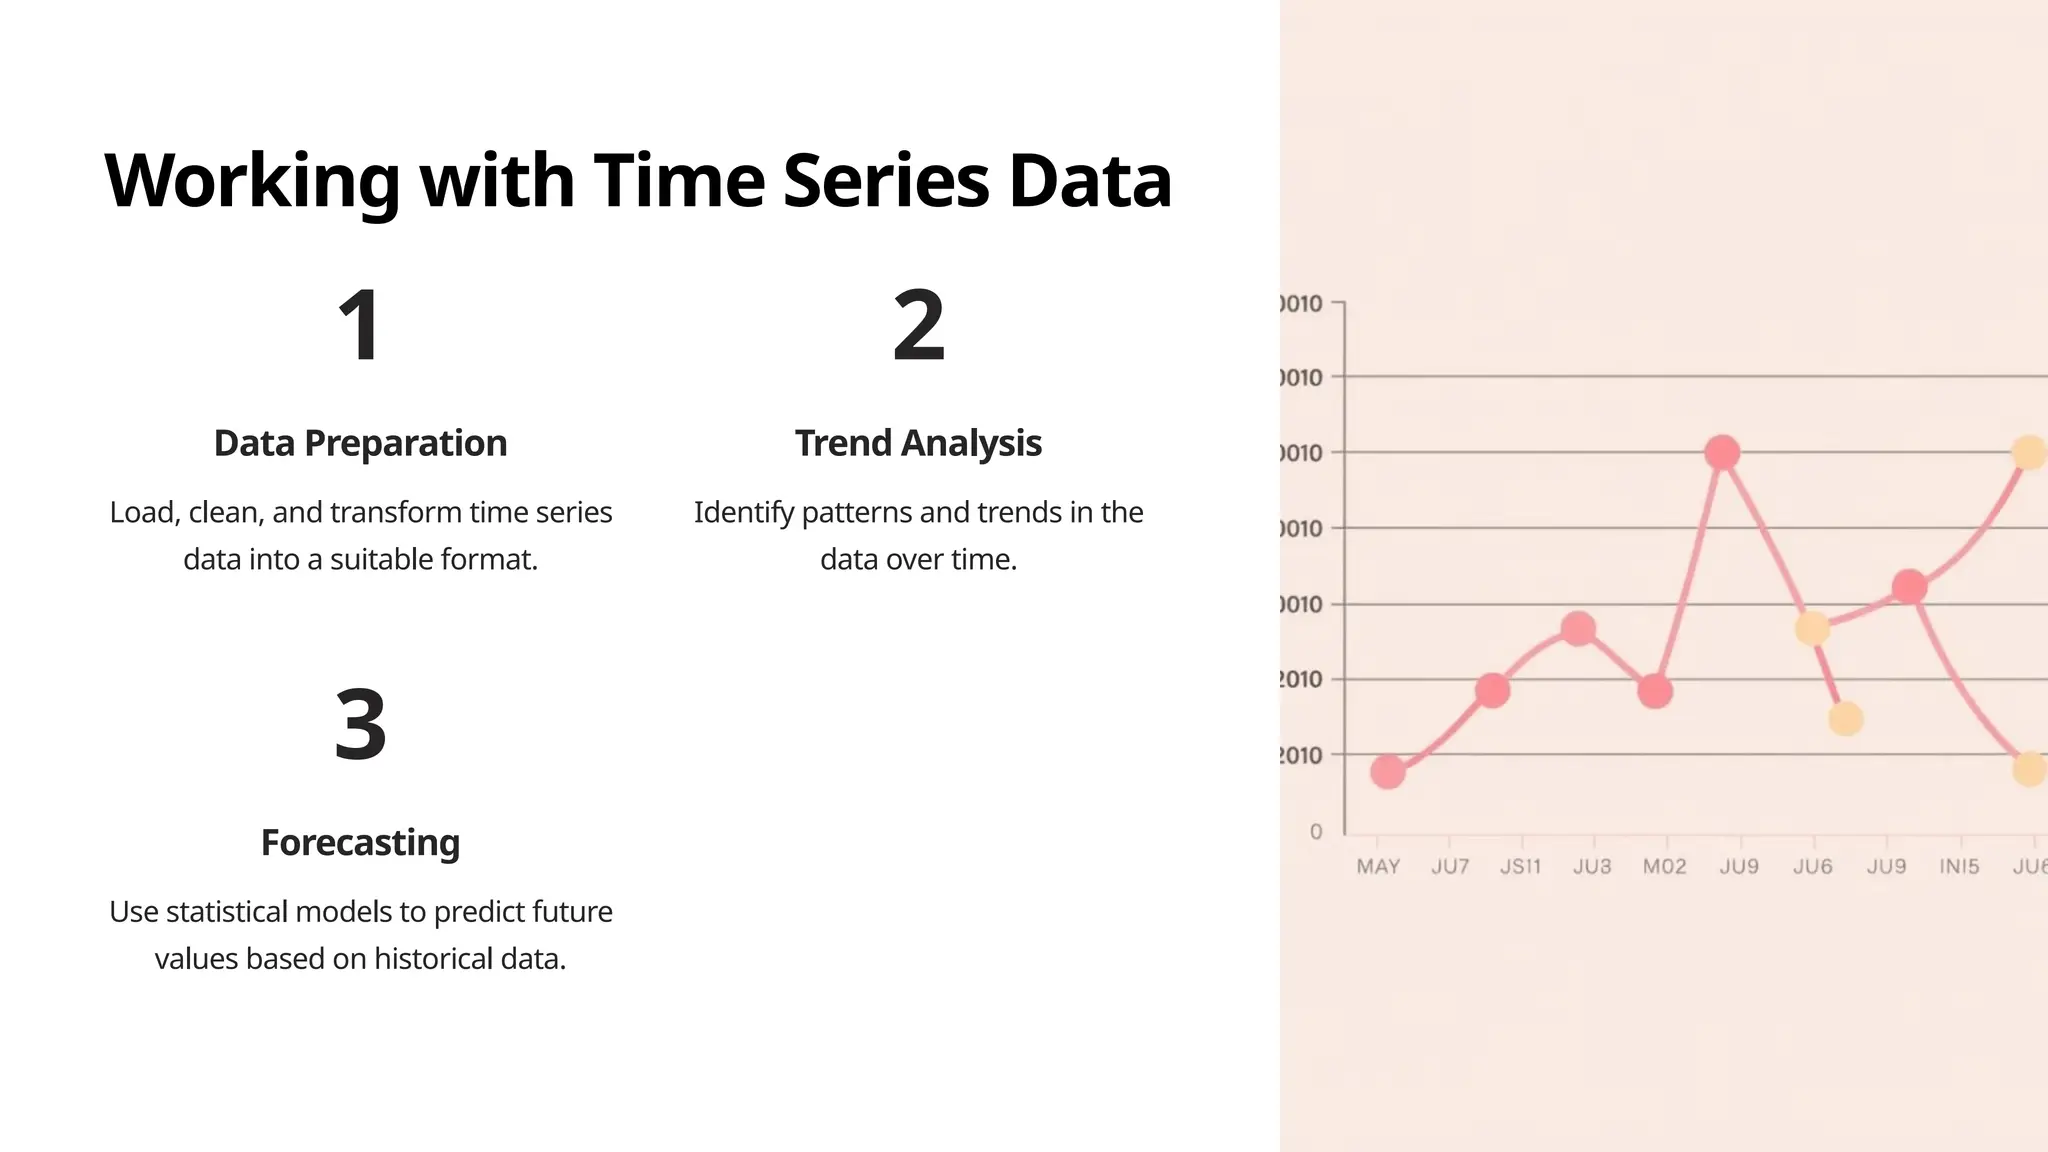
KEMBAR78
Data-Analysis-and-Visualization-in-Python-1.pptx
Data Analysis &
Visualization in Python
This presentation will guide you through the fundamentals and advanced
techniques of data analysis and visualization using Python, empowering
you to transform data into insightful stories.
by Dr. Sitanath Biswas
Overview of Python for Data Analysis
Open-source
Python is free to use and modify,
fostering collaboration and innovation.
Extensive Libraries
A rich ecosystem of libraries for data
analysis, visualization, and machine
learning.
Beginner-friendly
Python's syntax is relatively simple,
making it accessible for beginners.
Setting Up the Environment
Install Python
Download and install the latest
version of Python from the
official website.
Install Libraries
Use the pip package manager
to install essential libraries like
Pandas, NumPy, and
Matplotlib.
Integrated Development Environment (IDE)
Choose a suitable IDE like Jupyter Notebook, VS Code, or PyCharm for
a smooth coding experience.
Introduction to Pandas
1 Data Structures
Pandas provides powerful
data structures like Series
(1D) and DataFrames (2D) for
efficient data manipulation.
2 Data Loading
Easily load data from various
sources like CSV, Excel, and
SQL databases.
3 Data Selection and Filtering
Access and filter data using intuitive methods for targeted analysis.
Data Cleaning and
Preprocessing
Handling Missing Data
Identify and address missing values
using techniques like imputation or
removal.
Data Transformation
Convert data types, standardize
units, and apply necessary
transformations.
Removing Duplicates
Identify and eliminate redundant
entries to ensure data integrity.
Exploratory Data Analysis
(EDA)
1 Descriptive Statistics
Calculate summary statistics like mean, median, and standard
deviation to understand data distributions.
2 Data Visualization
Create various charts and plots to identify trends, patterns,
and relationships in the data.
3 Hypothesis Testing
Formulate and test hypotheses based on the observed data
patterns.
Data Visualization Basics
Bar Charts
Ideal for comparing categorical data.
Line Charts
Illustrate trends and patterns over time.
Scatter Plots
Show the relationship between two numerical variables.
Histograms
Visualize the distribution of a single numerical variable.
Advanced Visualization with Matplotlib
1
Customization
Fine-tune plot elements, labels, colors, and styles.
2
Interactive Plots
Create interactive plots that respond to user input.
3
3D Plots
Visualize data in three dimensions for a deeper
understanding.
Seaborn for Statistical Plots
1
Statistical Relationships
Create plots that highlight statistical relationships and distributions.
2
Aesthetically Pleasing
Seaborn provides high-level functions for visually appealing plots.
3
Seaborn Gallery
Explore the Seaborn gallery for inspiration and discover a
wide range of plot types.
Working with Time Series Data
1
Data Preparation
Load, clean, and transform time series
data into a suitable format.
2
Trend Analysis
Identify patterns and trends in the
data over time.
3
Forecasting
Use statistical models to predict future
values based on historical data.

Data-Analysis-and-Visualization-in-Python-1.pptx

  • 1.
    Data Analysis & Visualizationin Python This presentation will guide you through the fundamentals and advanced techniques of data analysis and visualization using Python, empowering you to transform data into insightful stories. by Dr. Sitanath Biswas
  • 2.
    Overview of Pythonfor Data Analysis Open-source Python is free to use and modify, fostering collaboration and innovation. Extensive Libraries A rich ecosystem of libraries for data analysis, visualization, and machine learning. Beginner-friendly Python's syntax is relatively simple, making it accessible for beginners.
  • 3.
    Setting Up theEnvironment Install Python Download and install the latest version of Python from the official website. Install Libraries Use the pip package manager to install essential libraries like Pandas, NumPy, and Matplotlib. Integrated Development Environment (IDE) Choose a suitable IDE like Jupyter Notebook, VS Code, or PyCharm for a smooth coding experience.
  • 4.
    Introduction to Pandas 1Data Structures Pandas provides powerful data structures like Series (1D) and DataFrames (2D) for efficient data manipulation. 2 Data Loading Easily load data from various sources like CSV, Excel, and SQL databases. 3 Data Selection and Filtering Access and filter data using intuitive methods for targeted analysis.
  • 5.
    Data Cleaning and Preprocessing HandlingMissing Data Identify and address missing values using techniques like imputation or removal. Data Transformation Convert data types, standardize units, and apply necessary transformations. Removing Duplicates Identify and eliminate redundant entries to ensure data integrity.
  • 6.
    Exploratory Data Analysis (EDA) 1Descriptive Statistics Calculate summary statistics like mean, median, and standard deviation to understand data distributions. 2 Data Visualization Create various charts and plots to identify trends, patterns, and relationships in the data. 3 Hypothesis Testing Formulate and test hypotheses based on the observed data patterns.
  • 7.
    Data Visualization Basics BarCharts Ideal for comparing categorical data. Line Charts Illustrate trends and patterns over time. Scatter Plots Show the relationship between two numerical variables. Histograms Visualize the distribution of a single numerical variable.
  • 8.
    Advanced Visualization withMatplotlib 1 Customization Fine-tune plot elements, labels, colors, and styles. 2 Interactive Plots Create interactive plots that respond to user input. 3 3D Plots Visualize data in three dimensions for a deeper understanding.
  • 9.
    Seaborn for StatisticalPlots 1 Statistical Relationships Create plots that highlight statistical relationships and distributions. 2 Aesthetically Pleasing Seaborn provides high-level functions for visually appealing plots. 3 Seaborn Gallery Explore the Seaborn gallery for inspiration and discover a wide range of plot types.
  • 10.
    Working with TimeSeries Data 1 Data Preparation Load, clean, and transform time series data into a suitable format. 2 Trend Analysis Identify patterns and trends in the data over time. 3 Forecasting Use statistical models to predict future values based on historical data.